Capacity for Cellular Osmoregulation Defines Critical Salinity of Marine Invertebrates at Low Salinity
 Imke Podbielski1*
  Claas Hiebenthal2
  Mithra-Christin Hajati3
  Christian Bock4
  Markus Bleich5
  Frank Melzner1
- 1Experimental Ecology - Benthic Ecology, GEOMAR-Helmholtz Centre for Ocean Research Kiel, Kiel, Germany
- 2Kiel Marine Organism Culture Centre (KIMOCC), GEOMAR-Helmholtz Centre for Ocean Research Kiel, Kiel, Germany
- 3Referat 2.5 Hydrogeologische Grundlagen, Landesamt für Bergbau, Energie und Geologie, Hannover, Germany
- 4Integrative Ecophysiology, Alfred Wegener Institute Helmholtz Centre for Polar and Marine Research, Bremerhaven, Germany
- 5Physiological Institute, Christian-Albrechts-University Kiel, Kiel, Germany
Low-salinity stress can severely affect the fitness of marine organisms. As desalination has been predicted for many coastal areas with ongoing climate change, it is crucial to gain more insight in mechanisms that constrain salinity acclimation ability. Low-salinity induced depletion of the organic osmolyte pool has been suggested to set a critical boundary in osmoconforming marine invertebrates. Whether inorganic ions also play a persistent role during low-salinity acclimation processes is currently inconclusive. We investigated the salinity tolerance of six marine invertebrate species following a four-week acclimation period around their low-salinity tolerance threshold. To obtain complete osmolyte budgets, we quantified organic and inorganic osmolytes and determined fitness proxies. Our experiments corroborated the importance of the organic osmolyte pool during low-salinity acclimation. Methylamines constituted a large portion of the organic osmolyte pool in molluscs, whereas echinoderms exclusively utilized free amino acids. Inorganic osmolytes were involved in long-term cellular osmoregulation in most species, thus are not just modulated with acute salinity stress. The organic osmolyte pool was not depleted at low salinities, whilst fitness was severely impacted. Instead, organic and inorganic osmolytes often stabilized at low-salinity. These findings suggest that low-salinity acclimation capacity cannot be simply predicted from organic osmolyte pool size. Rather, multiple parameters (i.e. osmolyte pools, net growth, water content and survival) are necessary to establish critical salinity ranges. However, a quantitative knowledge of cellular osmolyte systems is key to understand the evolution of euryhalinity and to characterize targets of selection during rapid adaptation to ongoing desalination.
Introduction
Salinity is one of the most important abiotic factors shaping species composition in marine environments. Low-salinity (hypoosmotic) stress as experienced in many estuaries and coastal regions can put severe physiological stress on marine animals, thereby affecting survival, immune responses, metabolism, protein function and various cellular processes (Lange, 1970; Bowlus and Somero, 1979; Braby and Somero, 2006). Under moderate hypoosmotic stress, increased costs for osmoregulation are met by an increased routine metabolic rate, or by re-allocation of energy towards osmoregulatory processes. This, however, reduces the scope for growth and reproduction and, ultimately, fitness (Pan et al., 2015; Podbielski et al., 2016). Under extreme salinity stress, many marine metazoans are restricted to maintaining basic functions to conserve energetic reserves until environmental conditions improve. Such a state is not sustainable. Avoidance is the only option, if a species’ capacity for salinity tolerance via acclimation or rapid adaptation is not sufficient. Persistent salinity changes can lead to geographic range shifts, vertical distribution shifts and, if relocation is not possible, (local) extinction (Tomanek, 2012). Benthic marine invertebrates are especially affected by environmental salinity changes as they often have limited mobility and larval stages with reduced tolerance to low-salinity (Casties et al., 2015; Nasi et al., 2018).
With ongoing climate change, salinity is projected to decrease in many coastal areas due to an increase in freshwater inflow caused by increased precipitation and glacier melting (IPCC Report, 2014). The Antarctic shelf, shallow coral reefs in Australia, or the Baltic Sea are prominent regions where expected desalination or prolonged low-salinity periods could fundamentally change benthic invertebrate communities (Haapkylä et al., 2011; Moon et al., 2015; Vuorinen et al., 2015). To predict desalination effects on distribution and species fitness, it is crucial to understand the physiological mechanisms, capacity and limits that determine salinity tolerance.
Aquatic organisms can generally be divided into osmoregulators and osmoconformers. While osmoregulators regulate the osmotic pressure of their body fluids independently to that of ambient seawater, osmoconformers are characterized by extracellular fluids (i.e. haemolymph, coelomic fluid, interstitial fluid) that are isosmotic with respect to seawater (Somero et al., 2017). However, this distinction is not absolute: e.g. many aquatic animals can be osmoconformers over broad salinity ranges while they hyperregulate body fluid osmolality at lower salinities (Gilles and Delpire, 2010; Rivera-Ingraham and Lignot, 2017). Osmoconformers, consisting chiefly of marine invertebrates, use cellular volume regulation (CVR) to react to osmotic changes. In CVR, small molecules (i.e. osmolytes) are used to adjust cellular osmotic pressure (i.e. osmolality). To acclimate to reduced seawater salinity, cells release or catabolize some of these osmotic compounds to avoid water inflow and harmful swelling (Kirschner, 1991; Lang, 2007). Only when the capacity for CVR reaches its limit, cellular water content will increase, ultimately leading to cellular damage and cell death (Lange, 1970; Schliess and Häussinger, 2005).
Osmolytes can be of inorganic and organic nature and are defined as compounds whose concentration is regulated in relation to salinity [sensu (Somero and Yancey, 2011)]. While the osmolality of the extracellular space is mainly determined by high sodium and chloride concentrations, the osmolality of the intracellular space is considered to be dominated by organic osmolytes and potassium (Kirschner, 1991; Somero et al., 2017). Organic osmolytes are also termed compatible osmolytes, because they are generally considered non-perturbing with protein function and structure (Somero and Yancey, 2011). Many of the major organic osmolytes have even beneficial attributes such as protein and membrane stabilizing abilities. Often, the organic osmolyte pool is composed of one or two major osmolytes accompanied by minor osmolytes (Podbielski et al., 2022). Invertebrates are known to mainly employ free amino acids (FAAs) and methylamines (Somero and Yancey, 2011). However, there is a strong methodological bias towards FAAs in the osmolyte literature, disregarding methylamines and methylsulfonium compounds (Podbielski et al., 2022). Yet, these substances such as proline-betaine, glycine-betaine, homarine and dimethylsulfonioproprionate can make up the majority of the organic osmolyte pool in snails, mussels, jellyfish or sea anemones (Pierce et al., 1984; de Vooys and Geenevasen, 2002; Yancey et al., 2010; Podbielski et al., 2016). The use of non-targeted analysis methods, such as HPLC, GC-mass spectrometry, or NMR spectroscopy is, hence, crucial.
The importance of organic osmolytes for long-term salinity acclimation has been demonstrated for many species and taxa (Podbielski et al., 2016; Schmittmann, 2017). Nevertheless, approximately half of the intracellular osmolyte pool consists of inorganic ions and this part of the osmolyte pool is poorly characterized (de Vooys, 1991; Podbielski et al., 2022). A better understanding of how inorganic osmolyte concentrations are modulated intracellularly during low-salinity acclimation is important, as intracellular inorganic ion concentrations influence many intracellular processes and hemolymph and tissue ionic pools have been shown to be highly correlated in aquatic decapods (Cuenca et al., 2021). Intracellular inorganic osmolytes (such as sodium and chloride) were often considered to be utilized exclusively during short-term responses to salinity stress (Quinn and Pierce, 1992; Somero et al., 2017). Other inorganic ions (i.e. potassium) are generally assumed to be highly regulated in the intracellular space as their conserved concentrations are important for protein structure and functioning (Palmer, 2015; Somero et al., 2017). However, several studies suggested that inorganic osmolytes, in addition to their role in the extracellular space, play an important, yet understudied, role in long-term acclimation in the intracellular space as well - despite potential negative impacts on protein functioning (Potts, 1958; Sarkissian and Gomolinski, 1976; Willmer, 1978; Ballantyne and Berges, 1991; Sanders, 2018). Overall, both, the inorganic and organic shares of the total osmolyte pool have to be quantified. To estimate intracellular ion concentration the extracellular space in the analyzed tissues has to be accounted for. Tissue inorganic ion concentrations are slightly higher than intracellular values due to the influence of the extracellular fluids that have a similar ionic composition to the ambient seawater. The volume of the extracellular space (ECS) can vary widely depending on species and tissue type (from 8-81% total water content) and the number of studies that investigated ECS volume is unfortunately low (Martin et al., 1958; Potts, 1958; Souza and Scemes, 2000).
While some mechanisms of CVR are relatively well established, it is unclear, whether unifying mechanisms of salinity tolerance exist in marine invertebrates. Osmolyte pool size, as well as pool composition have been suggested to be key factors in determining species salinity acclimation limits, but have not been formally tested across a broader taxonomic range (Pierce, 1971; Berger et al., 1978; Kube et al., 2006). Podbielski et al. (2016) introduced the concept of critical salinity (Scrit), suggesting that osmoconforming animals exposed to hypo-osmotic stress reach a critical point that limits their salinity tolerance capacity. With the reduction of seawater salinity the organic osmolyte pool is reduced until it is fully depleted at Scrit. Simultaneously fitness (reproductive ability, long-term survival) is minimal at Scrit. This concept has been successfully applied to a cnidarian and an echinoderm species (Podbielski et al., 2016; Schmittmann, 2017). However, tissue inorganic ions have not been determined in these studies.
Here we tested, whether the Scrit concept is applicable for species from a broad taxonomic range and whether inorganic osmolytes play a substantial role during acclimation to similar experimental salinity regimes. We focused on long-term low-salinity acclimation of benthic osmoconformers of the Baltic Sea. We chose six study species from three phyla that fulfill important ecological roles, exhibit a wide geographic distribution and differ in their tolerance of low-salinity. These species were: a bivalve and a gastropod (Molluscs: Mytilus edulis-like, Littorina littorea), a sea anemone (Cnidaria: Diadumene lineata) as well as a sea star and two sea urchin species (Echinoderms: Asterias rubens, Psammechinus milliaris, Strongylocentrotus droebachiensis) to determine differences in salinity tolerance mechanisms. They will hereafter be referred to as blue mussels, common periwinkles, orange-striped anemones, common starfish, shore sea urchins and green sea urchins, respectively. We investigated effects of low-salinity acclimation on fitness proxies and tissue osmolytes. Specifically, we hypothesized that:
I. Tissue inorganic and organic osmolyte concentrations decrease during acclimation to low-salinity in all investigated species. More specifically, the main inorganic osmolyte concentrations (i.e. sodium and chloride) decrease in tissues, while potassium and calcium concentrations remain constant.
II. Organic osmolyte composition differs between taxa.
III. The critical salinity concept is applicable for all investigated species.
This is the first study to investigate the complete osmolyte pool in a variety of marine invertebrates following long-term acclimation to low-salinity using comparable approaches.
Material and Methods
Collection and Maintenance
Study organisms were collected in the western Baltic Sea from spring to autumn 2018. All organisms were transported within 1-5 hours (except for green sea urchins from the Kattegat: 2 days) to a climate chamber at GEOMAR, Kiel where they were cultured (Figure S1A and Table S1). The Baltic Sea is characterized by a steep salinity gradient ranging from marine conditions in the west to freshwater conditions in the east. Animals were first kept at the salinity levels of their collection sites. The treatment closest to this was regarded as the respective control salinity.
Experimental Set-Up
Independent experiments were conducted for each species. After gradual salinity adjustment for 1-3 unit day-1 (Table S1), species were exposed to seven salinity treatments for four weeks (Figure S1B). A minimum of 14 days are necessary to examine stable osmolyte pools (Baginski and Pierce, 1977). Each tank was considered an experimental unit, with replicate numbers n = 2-6 (Figures S1B, C). The number of individuals per tank was adjusted according to size and availability of the animals. In total, we maintained 168 tanks for a minimum duration of 6 weeks. Physiochemical water parameters were recorded every 1-7 days to ensure high water quality (Tables S1, S2). Water was changed depending on accumulation of nitrogenous waste products measured in randomly chosen tanks of the lowest and highest salinity treatment (Tables S1, S2). Feeding was stopped a day prior to sampling. At the end of the experiment, two shares of samples were taken from individuals. The first set was used for dry weight measurement, the second one was processed for osmolyte analysis (Figure S1C).
Fitness Proxies and Tissue Water Content
We investigated fitness proxies (survival, growth) and tissue water content (as an estimate for volume regulation capacity) to understand when low-salinity stress became severe for our model organisms. Survival rate was utilized as a proxy to estimate critical salinity. Mortality was recorded on a daily basis. Dead individuals were removed from tanks and water was fully exchanged. At the end of the experiment, average survival per tank was compiled. As no mortality of orange-striped anemones was detected in our experiment, instead of survival, asexual reproduction rate was used as an indicator for salinity stress of these animals. Asexually reproducing orange-striped anemones that increased in numbers were expressed as percentages >100%. This percentage was derived from the number of individuals per tank at the beginning (which was considered 100%) and the number of individuals at the end of the experiment.
Growth was measured as change in total wet weight (WW). All animals were weighed prior to the experiment. At the end of the experiment total WW was recorded. The difference between initial and final total weight (g) was used as measure for net growth. For dry weight (DW) determination, one set of samples was dried for 48-72 hours at 80°C and DW weighed (Figure S1C). Molluscs tissues were removed from shells and weighed subsequently. Water content was determined using WW and DW values from the growth measurements at the end of the experiment expressed as:
Inorganic Osmolytes and Total Osmolality
Next, we measured the concentrations of nine inorganic ions, as well as the total osmolality in seawater, body fluids and tissues (data in Table S3). After non-invasive parameters were recorded, body fluids were retrieved from the second set of samples (Figure S1C and Table S2). This was done in this study for all investigated species, except for orange-striped anemones which were too small to extract coelenteron fluid. We took into account the volume of body fluid that was extracted before sampling tissues. Echinoderms were drained of coelomic fluid first. Tissues were sampled afterwards and thus, mainly interstitial fluids remained in the measured tissues, reducing the ECS bias. For molluscs, the minimum amount of extracted body fluid prior to sampling was estimated (Table S1). Body fluids were centrifuged at 1000 rpm for 1 min. The supernatant was extracted and frozen in liquid nitrogen. Body fluid samples of the same individuals were used for total osmolality, cation and anions analysis. We sampled whole-body tissues, except for common starfish were pyloric caeca were sampled (Table S1). Tissues were shortly immersed in iso-osmotic sucrose solution and flipped over once to remove adherent seawater, blotted dry and snap-frozen in liquid nitrogen. The same tissue material was used for anion, cation, total osmolality and metabolic profiling.
Commonly, concentrations for each anion are titrated separately (Potts, 1958; Silva, 1992). We, however, established a novel protocol for ion extraction from tissue samples - involving a sufficient cleaning of proteins to measure anions in tissue extracts via ion chromatography. Our method omits chemical precipitation of proteins which generates a noise that overlaps with the targeted anion signals. If tissue extracts are measured without filters, proteins clog the IC-column eventually leading to increased maintenance costs. As a novel technique, we instead used a mechanical filtering step applying mini dialyzers which are usually used for protein/DNA purification. These filters concentrate the protein fraction of a sample extract via vertical membranes of a specific pore size (here 3K). Instead of keeping the protein fraction, we processed the filtrated (protein-free) fluid sample. We used reference standards (IAPSO Standard Seawater and Merck IC-multi element standard V) to verify that the anion concentration in a fluid sample does not change via this technique and that no additional signal was added. This is the first protocol to sustainably measure anions in filtered tissue extracts via ion chromatography. This method replaces the need for separately conducted measurements of anions via titration. It further allows for a shorter throughput time and could also be used via auto-analyzer.
For anion, cation and total osmolality analysis, 500 mg powdered tissue samples were used. Material of different individuals from the same tank was pooled if necessary. MilliQ water was added in the smallest dilution possible (usually a 1:1 weight to volume ratio) to retrieve a final sample volume of 400 - 500 µL. The sample was then homogenized in a batch disperser (Ultra-Turrax, IKA, USA) attached to a VWR VDI 12 Homogenisator (IKA, USA) for 60 s and extracts freeze-thawed three times. Afterwards, samples were centrifuged (1500 g, 4°C, 5 min) and supernatants transferred to 3K dialyzers (Amicon Ultra Centrifugal Filter Devices, Merck, Germany). Samples were centrifuged (14000 g, 4°C, 20 min). The eluent was retrieved and used for subsequent analysis. For ion chromatography (Dionex ICS 2100, Thermo Fisher, Germany), fluid and tissue samples were diluted to a final volume ratio of 1:25 for salinity treatments <15 and 1:50 for salinity >15. A conductivity cell and a self-regenerating suppressor were used to reduce background conductivity. An IonPac AS11-HC column was used with potassium hydroxide (KOH) as eluent. We achieved separation with an isocratic flow rate of 0.6 mL min-1 15 mM KOH at 40°C for seawater and body fluid samples. For tissue samples, a ramp protocol was applied with 8 mM KOH increasing to 15 mM after 5.5 min with a flow rate of 0.5 ml min-1. Anion concentrations were computed in mM relative to an IC-multi element standard V (Merck, Germany) containing the main anions fluoride, chloride, bromide, nitrate, sulfate and phosphate.
Aliquots for cation and total osmolality measurements in tissue extracts and fluid samples were used in concentrated form. Total osmolality (osmol kg-1) was determined with a freeze-depression osmometer (Osmomat 030, Gonotec, Germany). Cations were determined via flame-photometry (EFOX 5053 Eppendorf, Germany) using urine standards. Samples were measured in duplicates.
By solely analyzing whole tissue samples it is not possible to distinguish compartmentalization between extra and intracellular ion concentrations. Measuring the ion concentration in extracellular body fluids allows to estimate the intracellular portion if the ECS volume is known. We therefore estimated likely ECS fractions for blue mussels, common starfish, green sea urchins and common periwinkles. To estimate this, we first calculated the maximal possible ECS contribution in an iterative procedure. Briefly, we calculated intracellular ion concentrations according to Freel (1978) by inserting different percentage of ECS volume into the equation (Figure S2):
Where [Ci] = intracellular solute concentration in (mmol kg-1 cell water), [Ct] = tissue solute concentration (mmol kg-1 tissue water), [Cbf] = body fluid solute concentration (mmol L-1 body fluid) and ECS = the extracellular space of the tissue (kg kg-1 tissue water). We thus determined the maximal possible ECS value before measured osmolyte tissue concentrations became negative. We compared these values to the available literature data for the respective species (or taxon) and tissue type where possible (Martin et al., 1958; Simon et al., 1964; Robertson, 1980; Sabourin and Stickle, 1981; Jones and Kamel, 1984; Taylor and Andrews, 1988; Gainey, 1994). Generally, muscle tissues have a smaller ECS volume than mantle or gill tissues, and whole-body samples contain the largest ECS portion (Michaelidis et al., 2005; Taylor and Ragg, 2005). Thus, by combining maximum possible ECS and literature values we then conservatively estimated a likely ECS fraction (Figure S2). Here, we tried to match the tissue type and species as closely as possible, however the ECS volume is very species- and tissue-specific and there was no reliable information available for each investigated species. The curated ECS volume parameters from literature were then regarded as the lower limit of the likely ECS fraction. Estimation of intracellular inorganic pool sizes with the most likely ECS-values resulted in an estimated very conservative ECS volume of 50-60%, 10-20%, 20-30% and 45-55% in blue mussel whole body tissue, common starfish pyloric caeca, green sea urchin whole body tissue and common periwinkle whole body tissue samples, respectively. Using those values, we then calculated intracellular values according to the formula above (Figure S2).
Organic Osmolytes
Metabolic profiling was conducted on the basis of Podbielski et al. (Podbielski et al., 2016). Briefly, metabolites were extracted from 200 mg of tissue (FW) by methanol extraction. Tissues were identical to samples used for inorganic analysis. The sample suspension was concentrated at 30°C overnight and pellets subsequently re-suspended 1:1 in deuterium oxide (D2O) containing 0.05% trimethylsilyl propioniate (TSP) (Sigma Aldrich, St. Louis, USA) as internal standard. Untargeted metabolic profiling was conducted at the Alfred-Wegener-Institute (Bremerhaven, Germany). One-dimensional 1H-NMR spectroscopy was performed on a wide-bore 400 MHz spectrometer (9.4 T WB with Advance III HD electronics, Bruker-BioSpin GmbH, Germany) using a triple-tunable (1H, 13C, 15N) probe for 1.7 mm NMR tubes. A sample volume of 50 µL were used for NMR spectroscopy at room temperature. Each sample was measured four times using a standard one-dimensional Carr–Purcell–Meiboom–Gill (cpmg) sequence with water suppression from the Bruker pulse program library (cpmgpr1). Parameters were as described in Schmidt et al. (2017) using a 5 μs pulse for 90°. 32 scans were usually acquired resulting in a total acquisition time of 4 min 35s. 128 number of scans were used in one sample from Psammechinus milliaris in order to increase the signal to noise ratio. Spectra were processed with a Line broadening factor of 0.3, followed by baseline-, shim-, phase-corrections and TSP calibration using the software Chenomx NMR suite 8.1 (Chenomx Inc., Canada). Afterwards metabolites were identified by their chemical shifts using the Chenomx data base. Identification was confirmed by additional 2D 1H-13C HSQC NMR recordings of individual samples from the tissues of the respective species similar to Rebelein et al. (2018). After assignment, NMR peak integrals were fitted manually to a specific compound and metabolite quantification was based on the TSP standard concentration of 3.2 mM. Across species, we identified and quantified 60 organic substances. All solutes that changed concentration in relation to salinity were regarded as osmolytes. We categorized them into minor, intermediate and major osmolytes according to their contribution to the overall organic solute pool by <1%, 1-10% and >10%, respectively (Figure S3A).
Statistics
Statistical analysis was conducted with R (version 4.1.1). All parameters were correlated to salinity and a model was fitted to the data. A range of models was tested for best fit using AIC or R2 and degrees of freedom. Amongst all significant models, we selected all models with the lowest AIC + 5. Amongst those models we always chose the model with the fewest number of parameters. If the selection of significant models only included linear models, we chose the model based on R2. If the final model was linear, assumptions were tested. If assumptions were flagged, the data set was examined manually. No model was fitted if no salinity effect was found or the number of data points was too low.
Results
Survival
Following a four-week acclimation interval to seven different salinity treatments, we observed a significant decrease of survival of common starfish, common periwinkles, blue mussels and green sea urchins (Table S4). In blue mussels, the decrease in survival occurred gradually between salinities 10 to 5. Sea star survival fell abruptly from 100% to 0% between salinities 12 and 10. Animals at salinity 11 had a low body turgor and appeared moribund. The survival of common periwinkles steeply declined from salinity 8 to 6. Green sea urchin survival decreased to 67% at salinity 17, whereas no shore sea urchins died during the experimental time period. Survival of orange-striped anemones was not impacted by low-salinity, either. However, asexual reproduction rate (i.e. fission rate) decreased to zero at salinities ≤ 10 (Figures 1, 2). Fission rate was highest at the highest salinity conditions with an average fission rate of 1.5 ± 0.5 fissions/month.
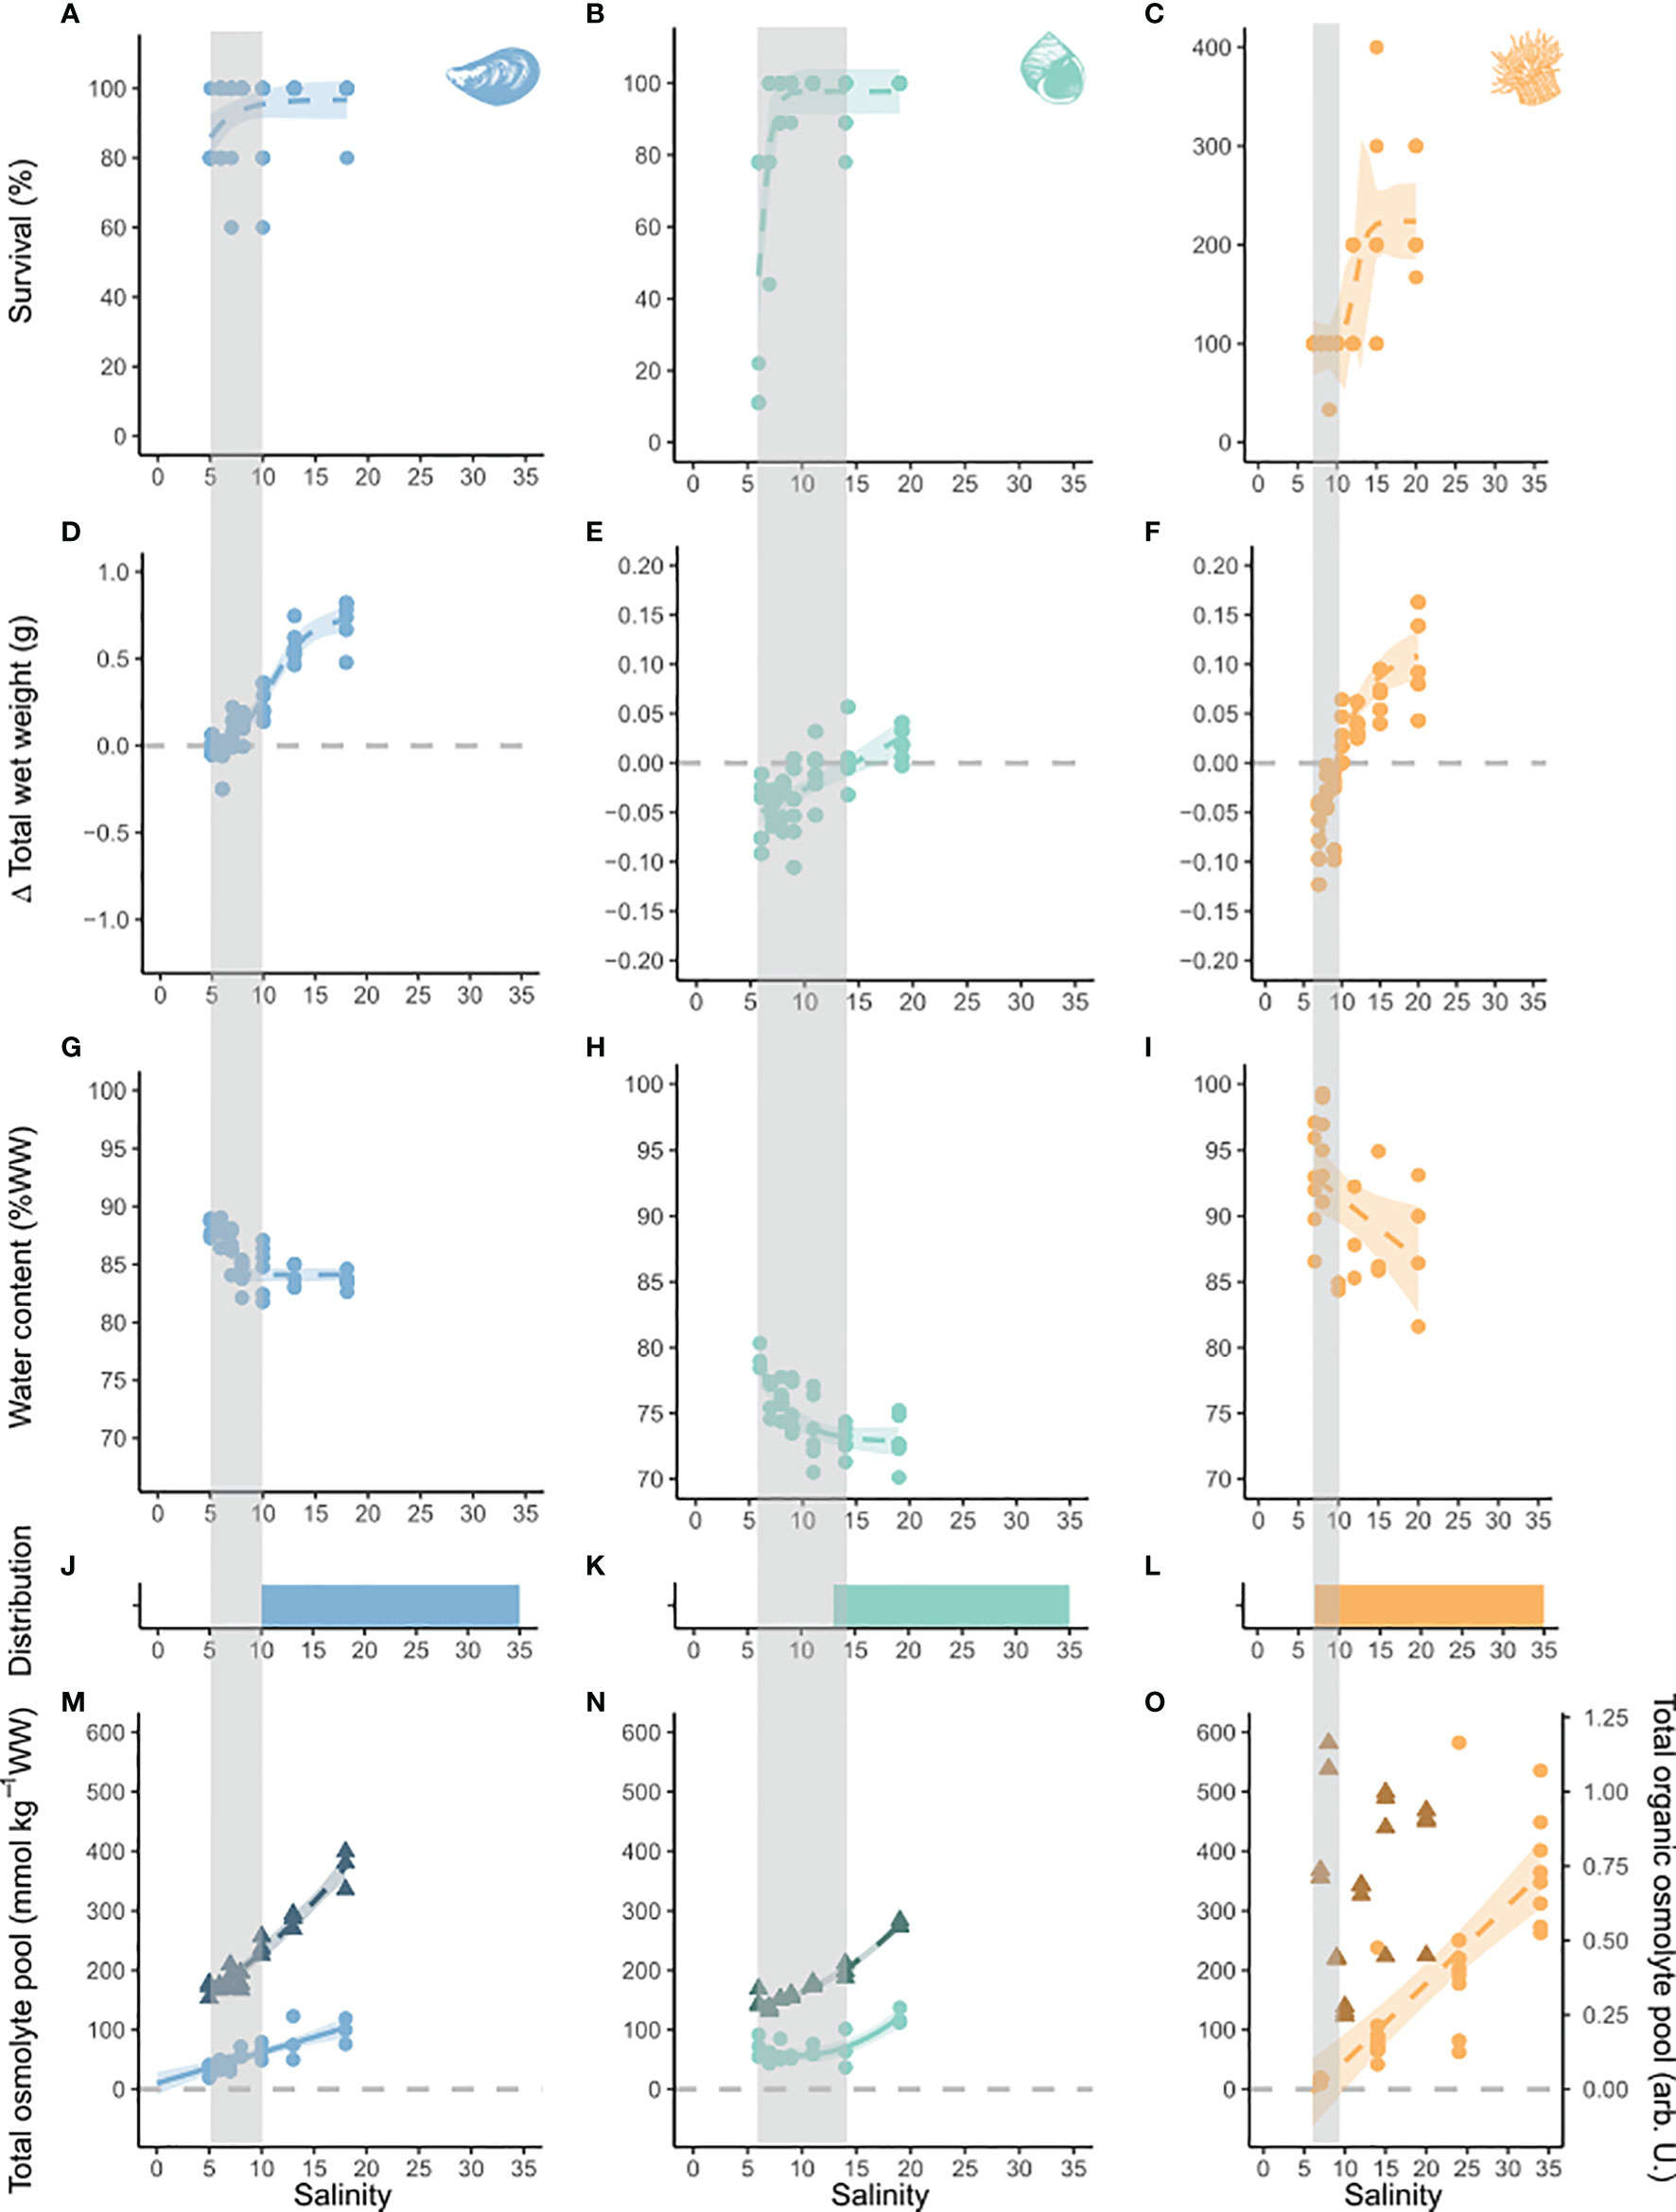
Figure 1 Effect of long-term low-salinity acclimation on survival, growth, water content, distribution and osmolyte pool size on blue mussels, common periwinkles and orange-striped anemones. Salinity is depicted on the x-axis. On the y-axis survival is presented in %, (A–C) change in total wet weight in g, (D–F) water content in % wet (G–I) weight and osmolyte pools in mmol per kg wet weight. (M–O) Osmolyte pools were corrected for relative weight change due to increase in water content with decreasing salinity. The inorganic pool is depicted by triangles and the organic pool by circles. No organic osmolytes were measured for orange-striped anemones, instead osmolyte data from a previous study is shown (Podbielski et al., 2016). Colored bars represent the species’ known salinity range in the Baltic Sea. (J–L) Models were fitted to raw data points for seven treatment levels. If no model is shown, there was no significant model. Models were chosen according to best fit. Model outcomes are listed in Table S4. Shaded areas represent a 95% confidence interval. Four treatment levels were clustered around the lower salinity threshold of each species, two levels represented intermediate salinity and the highest one was close to control conditions. Species are marked by color code and symbol: blue - blue mussels (Mytilus sp.), turquoise - common periwinkles (Littorina littorea), orange - orange-striped anemones (Diadumene lineata). Grey vertical bars represent the critical salinity range derived from the salinity thresholds of the complementing measurements of physiological and biochemical biomarkers.
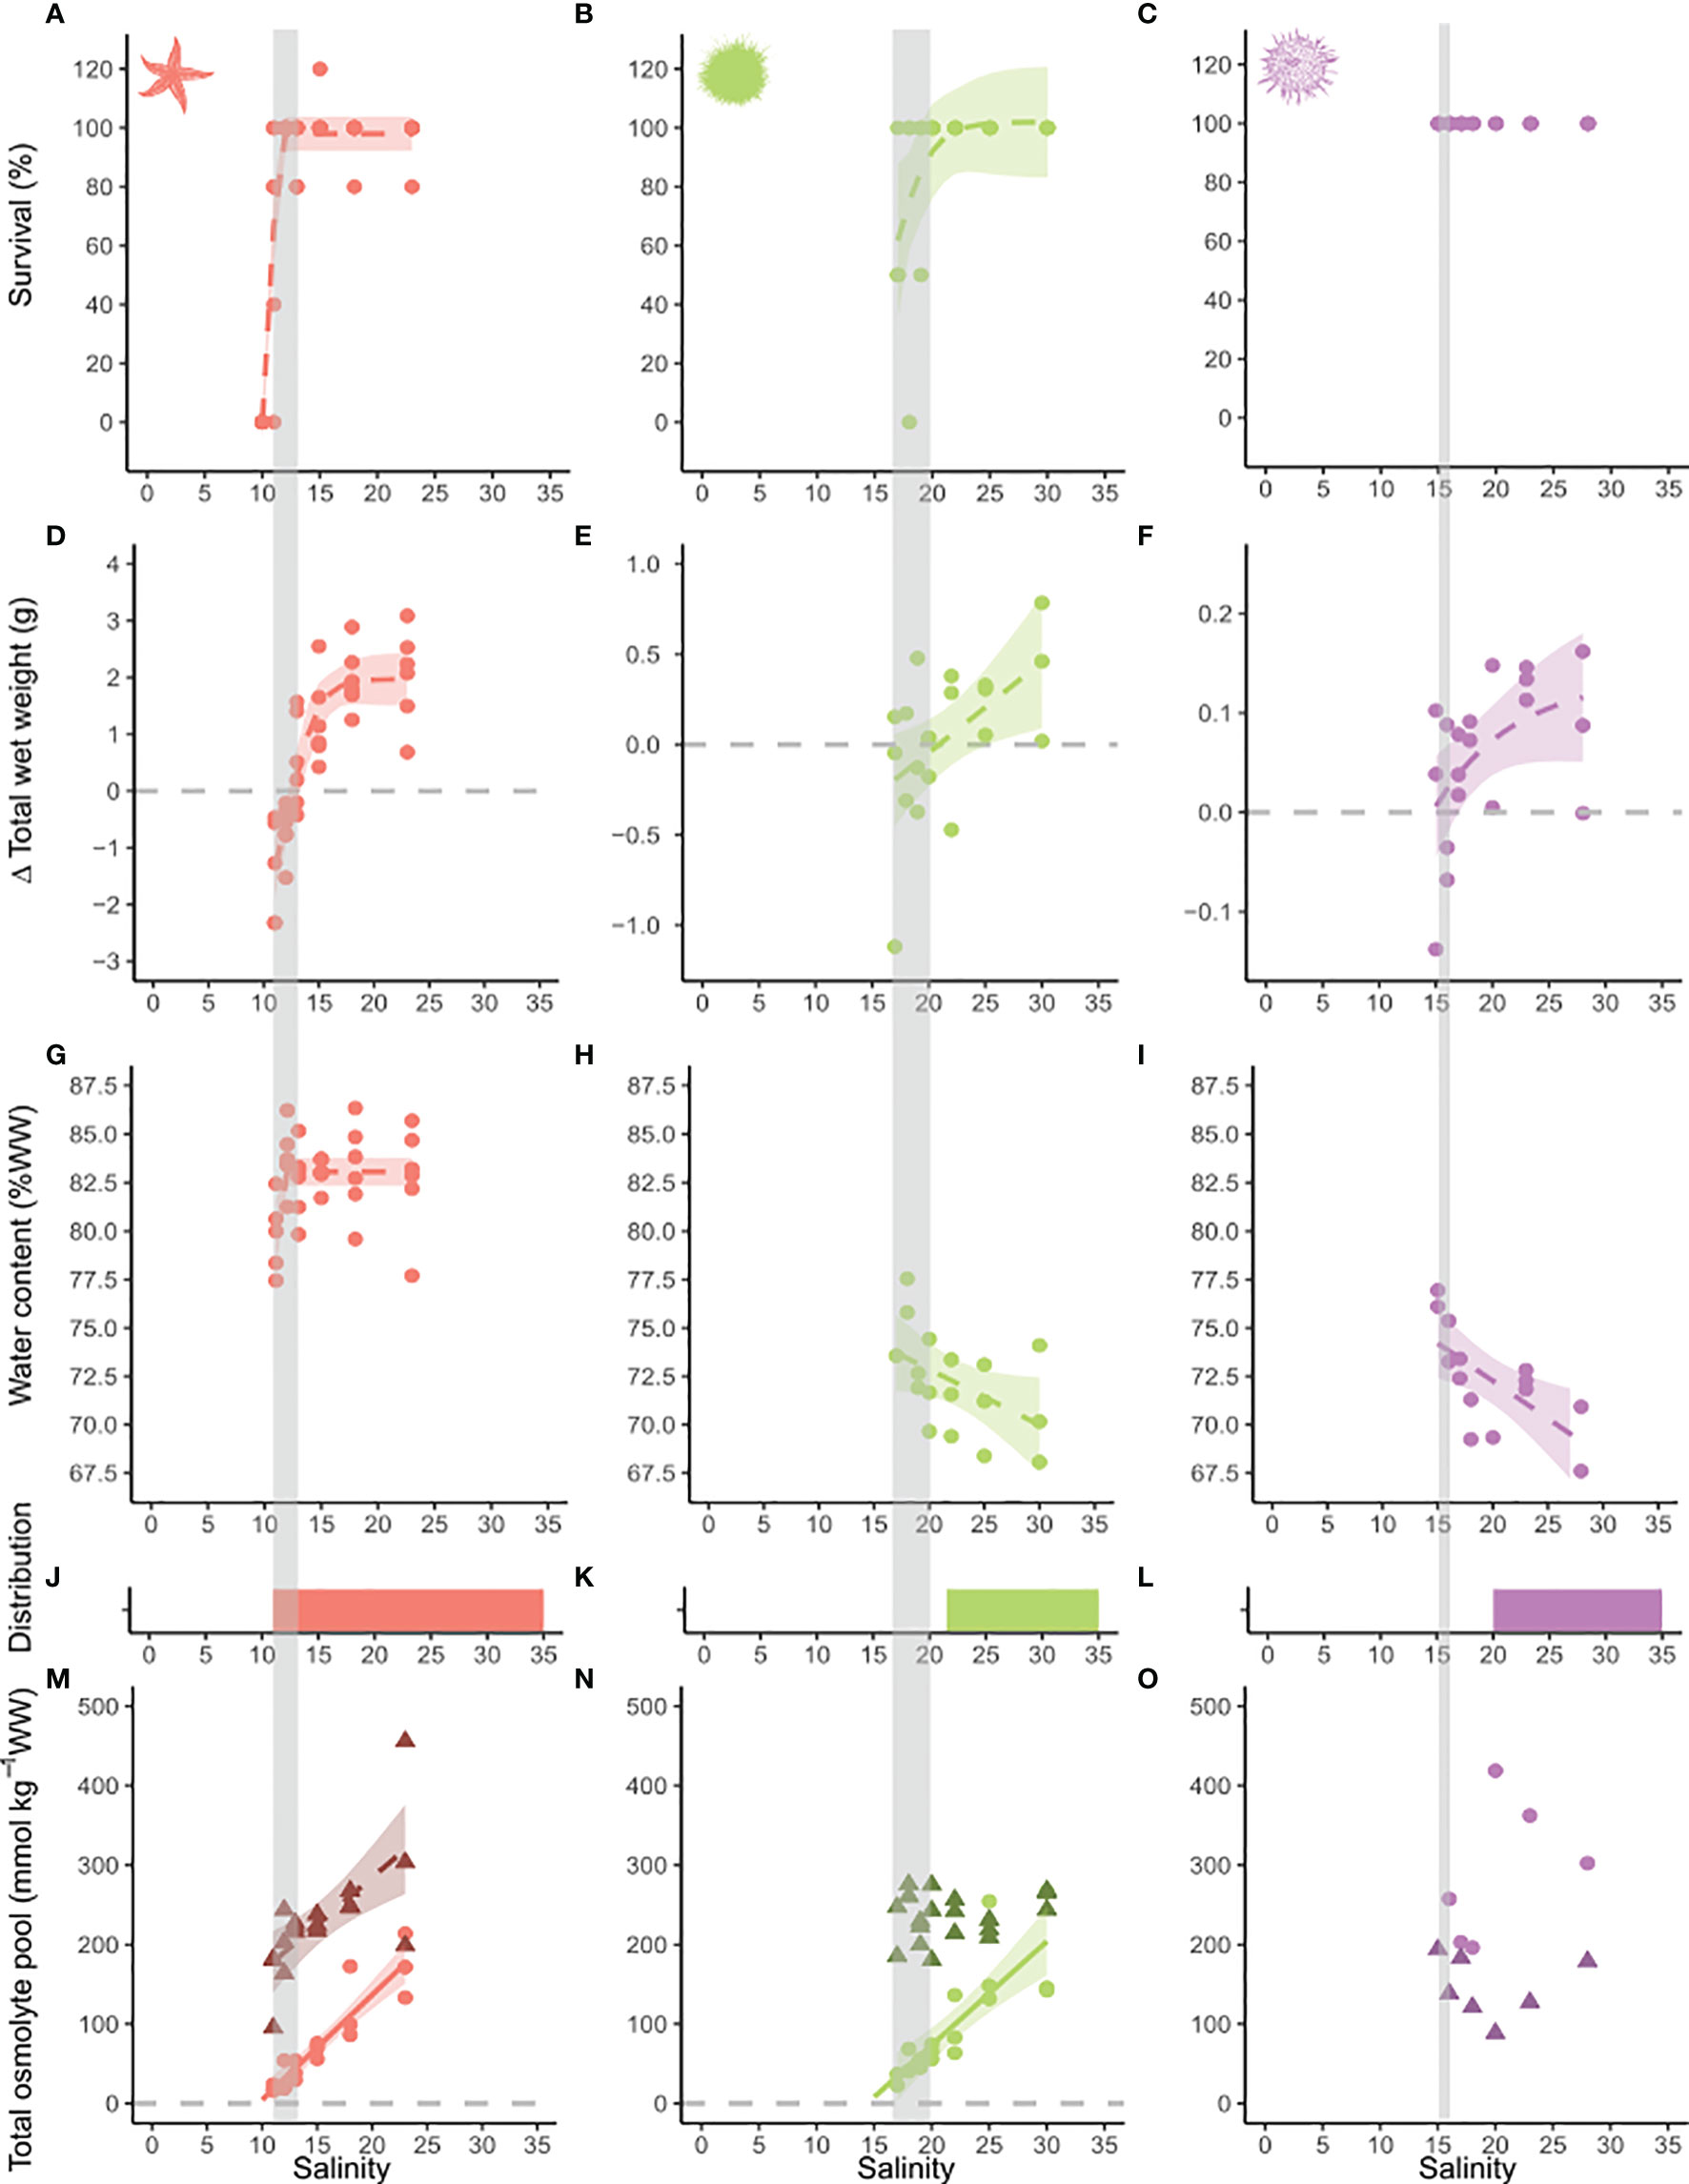
Figure 2 Effect of long-term low salinity acclimation on survival, growth, water content, distribution and osmolyte pool size on common starfish, green sea urchins and shore sea urchins. Salinity is depicted on the x-axis. On the y-axis survival is presented in %, (A–C) change in total wet weight in g, (D–F) water content in % wet weight (G–I) and osmolyte pools in mmol per kg weight wet. (M–O) Osmolyte pools were corrected for relative weight change due to increases in water content with decreasing salinity. Colored bars represent the species’ known salinity range in the Baltic Sea (J–L). The legend and further graph descriptions are addressed in Figure 1. Species are marked by color code and symbol: red - common starfish (Asterias rubens), green - green sea urchins (Strongylocentrotus droebachiensis) and purple - shore sea urchins (Psammechinus milliaris). Grey vertical bars represent the critical salinity range derived from the salinity thresholds of the measurements of physiological and biochemical markers.
Growth
Despite being fed ad libitum in all treatments, growth decreased significantly with a reduction in salinity (Table S4). Thresholds of zero weight gain and consecutive loss of biomass were located at salinities of 5.6, 9.3, 12.7, 14.6, 14.7 and 20.9 for blue mussels, orange-striped anemones, common starfish, common periwinkles, shore sea urchins and green sea urchins, respectively (Figures 1, 2). A significant increase of total wet weight (WW) was observed for all species at higher salinity treatments with an attenuation of growth observed for blue mussels, orange-striped anemones, common starfish and shore sea urchins.
Water Content
Reduction of salinity significantly increased tissue water content of all species, except for common starfish (Table S4). In molluscs, water content was constant at high and medium salinities, but increased at a salinity threshold of 8 for blue mussels and 11 for common periwinkles. Water content increase was continuous for both sea urchin species and orange-striped anemones. In common starfish, water content was constant above salinity 11 but decreased abruptly below that threshold.
Total Osmolality and Total Osmolyte Pool Sizes
Body fluid osmolality was isosmotic to seawater in all investigated species, except for common periwinkles were hyper-hypo osmoregulation was observed (Figure 3). Tissue osmolality significantly declined in tissues of blue mussels, common periwinkles, orange-striped anemones and common starfish with decreasing salinity (Figure 4). Total osmolality in blue mussels and common periwinkles declined linearly, whereas in common starfish it stabilized at very low-salinity. Sea anemone tissue osmolality was constant across a wide salinity range but dropped at a salinity threshold of 10. No significant change in osmolality was detectable in the two sea urchin species.
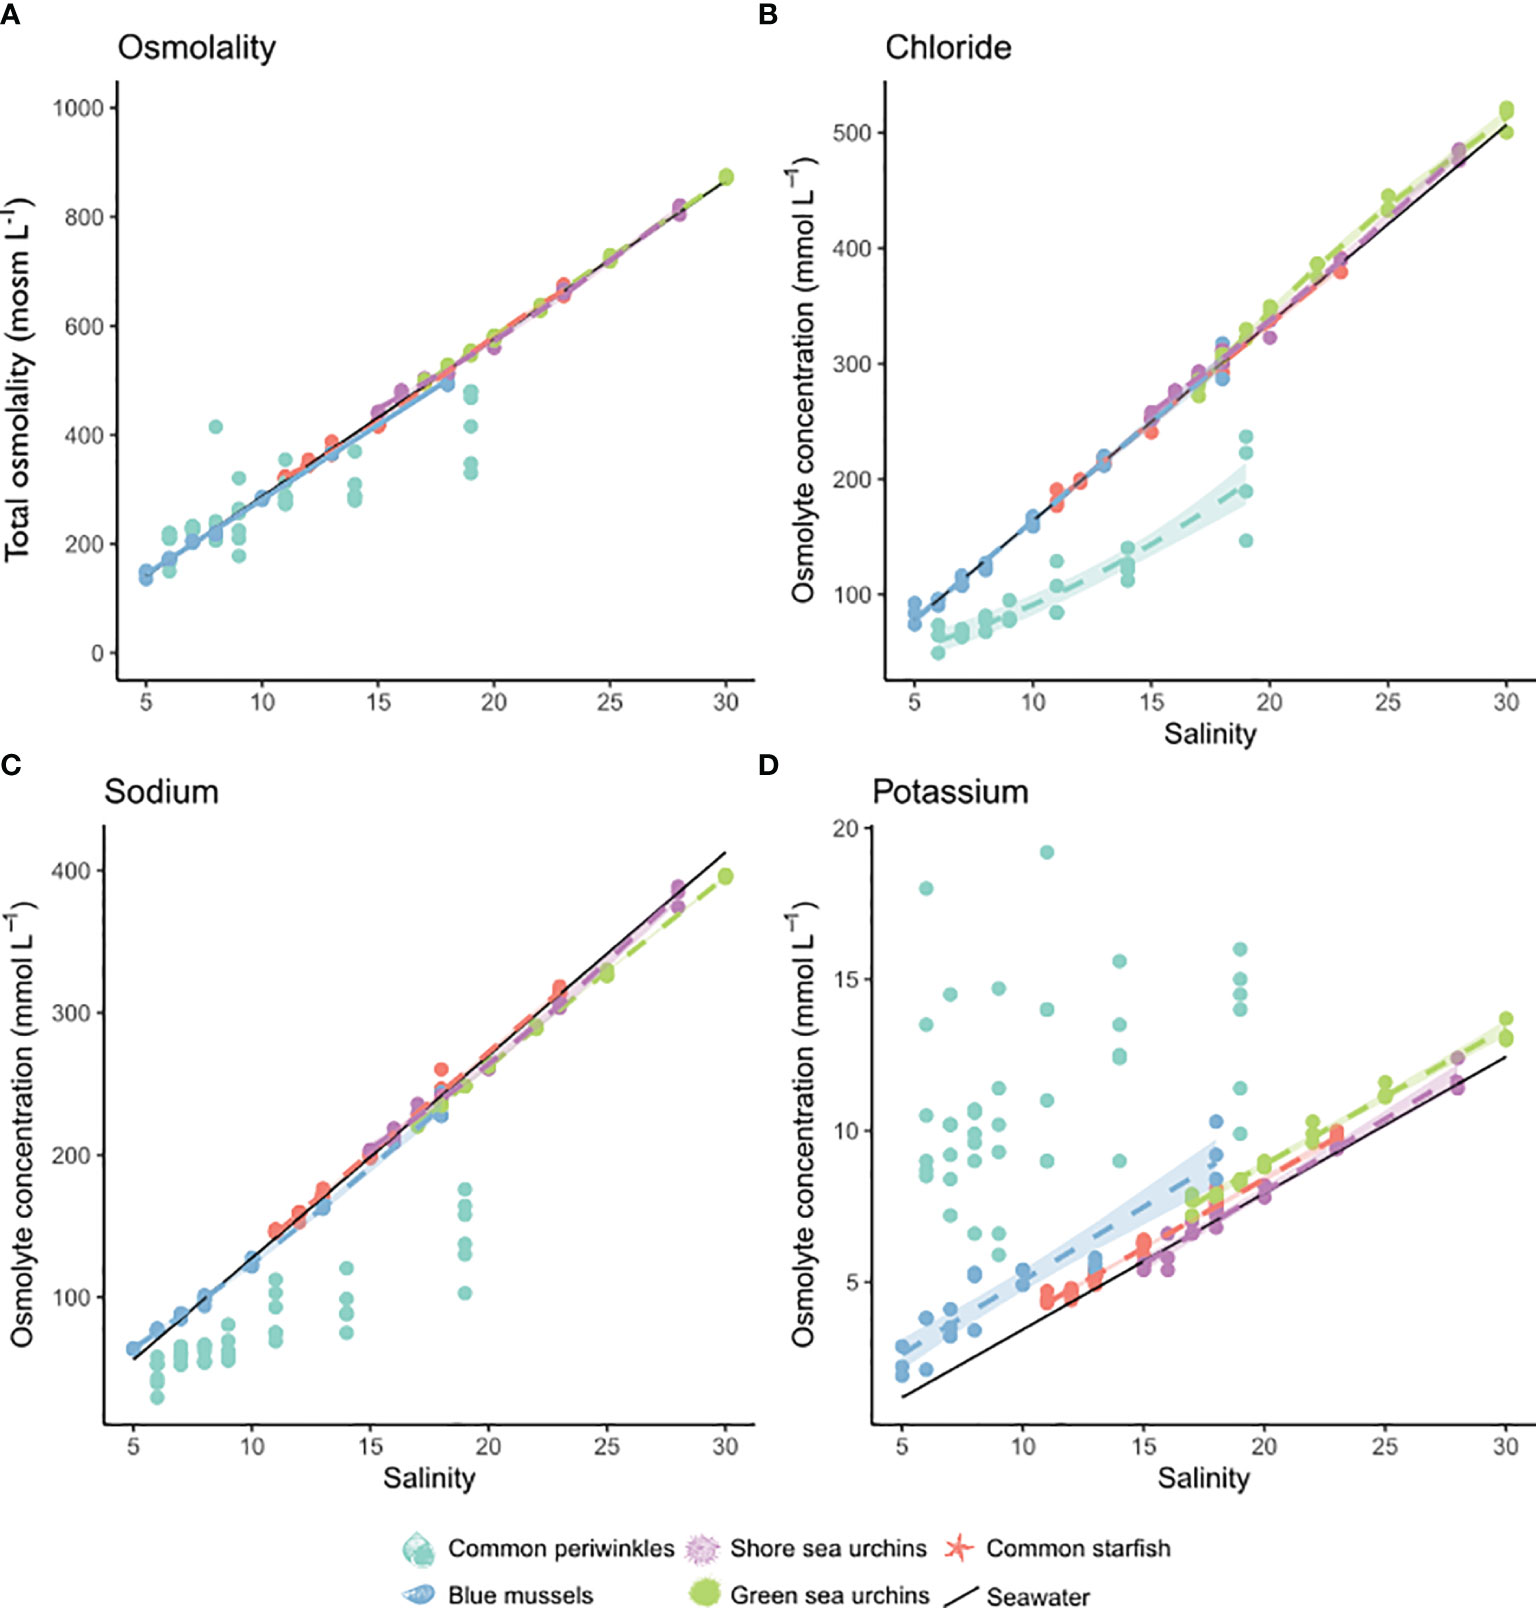
Figure 3 Salinity effect of the major inorganic osmolytes in body fluids of five of the study organisms: blue mussels (blue, Mytilus sp.,) common periwinkles (turquoise, L. littorea), shore sea urchins (purple, P. milliaris), green sea urchins (green, S. droebachiensis) and common starfish (red, A. rubens). Concentration of total osmolality (A), chloride (B), sodium (C) and potassium (D) is shown on the y-axis (mmol L-1 or mosm L-1) and salinity is depicted on the x-axis. Models were chosen according to best fit and their predicted values are depicted by lines. Only significant models were shown. If only data points are shown without a model, that means that there was no significant model, or assumptions were not met. Confidence intervals (95%) are shown as shaded area. No body fluid samples were measured for orange-striped anemones. For model results see Table S5.
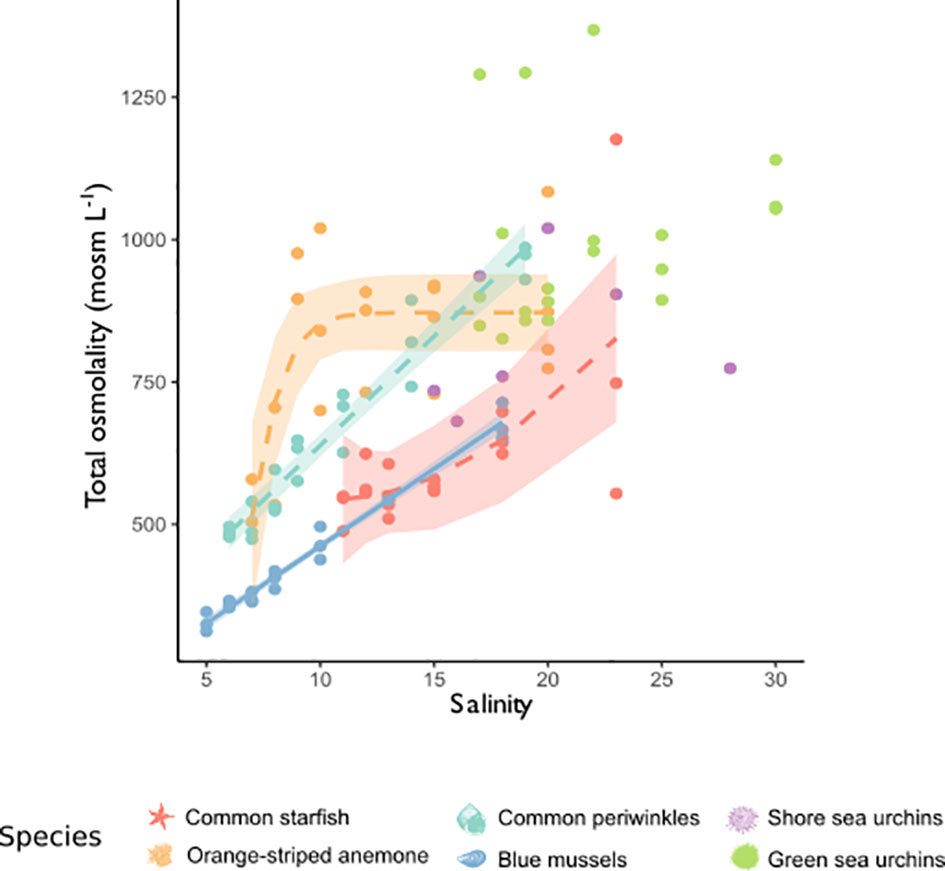
Figure 4 Effect of salinity on total osmolality of tissues. Depicted is total osmolality in tissue extracts of the six study organisms: blue mussels (blue, Mytilus sp.), common periwinkles (turquoise, Littorina littorea), green sea urchins (green, Strongylocentrotus droebachiensis), sea stars (red, Asterias rubens), orange-striped anemones (orange, Diadumene lineata) and shore sea urchins (purple, Psammechinus milliaris). Total osmolality (mosm L-1) is shown on the y-axis and salinity is depicted on the x-axis. Models were chosen according to best fit and their predicted values are depicted by lines. A. rubens: Quadratic model (R2 = 0.4486, df = 2, 15, F-value = 6.1, p-value = 0.0115), D. lineata: 3-parametric logistic model (Residual S.E. = 115.01, df = 17, b = -1.16, d = 871.90, e = 6.69), L. lineata: Linear model (R2 = 0.9411, df = 1, 19, F-value = 303.7, p-value < 0.001), Mytilus sp.: Linear model (R2 = 0.9793, df = 1, 19, F-value = 896.9, p-value < 0.001). No model is shown for shore and green sea urchins, because there was no significant relationship. Confidence intervals (95%) are shown as shaded area. b = y-intercept, d = upper limit, e = steepness of increase as x.
Overall, the concentration of inorganic osmolytes was higher than that of the organic osmolyte pool in all investigated species, besides shore sea urchins. Total inorganic osmolyte concentration decreased linearly with salinity in the tissues of common starfish, whereas a stabilization occurred for blue mussels and common periwinkles at lower salinity (Figure 1, 2). The concentration of organic osmolytes declined significantly with decreasing salinity in blue mussels, common periwinkles, orange-striped anemones, common starfish and green sea urchins. The Scrit of blue mussels, common starfish and green sea urchins was <0, 10 and 14, respectively, as could be derived from extrapolating the linear model until the organic osmolyte concentration reached zero. The Scrit of orange-striped anemones from a previous study was located at salinity 6.5 (Figure 1) (Podbielski et al., 2016). Scrit could not be estimated in of the other species as the relation was not linear (i.e. common periwinkles), not significant (i.e. shore sea urchins), or extrapolation results were negative (i.e. blue mussels).
We found that the inorganic ion contribution of the ECS does not impact the tissue inorganic ion pool patterns substantially (Figure S2). Even when using the maximum possible ECS fractions for calculations, the inorganic osmolyte concentration was still significantly affected by salinity in blue mussels, common periwinkles and common starfish and inorganic osmolyte pool size remained larger than the organic share (see Figure S2).
Organic Osmolytes: Pool Composition and Major Osmolytes
In total, 60 compounds were identified (Figure S3A and Table S3) by metabolic profiling. The concentration of 39 solutes declined significantly with decreasing salinity and were thus considered osmolytes [sensu (Somero and Yancey, 2011)]. The major osmolytes that had a substantial contribution to the total organic osmolyte pool were glycine (echinoderms), betaine (orange-striped anemones and blue mussels) and betaine and taurine (common periwinkles) (Figure 5). The concentration of most of the identified osmolytes was minor (<5% of the total organic pool; Figure S3A).
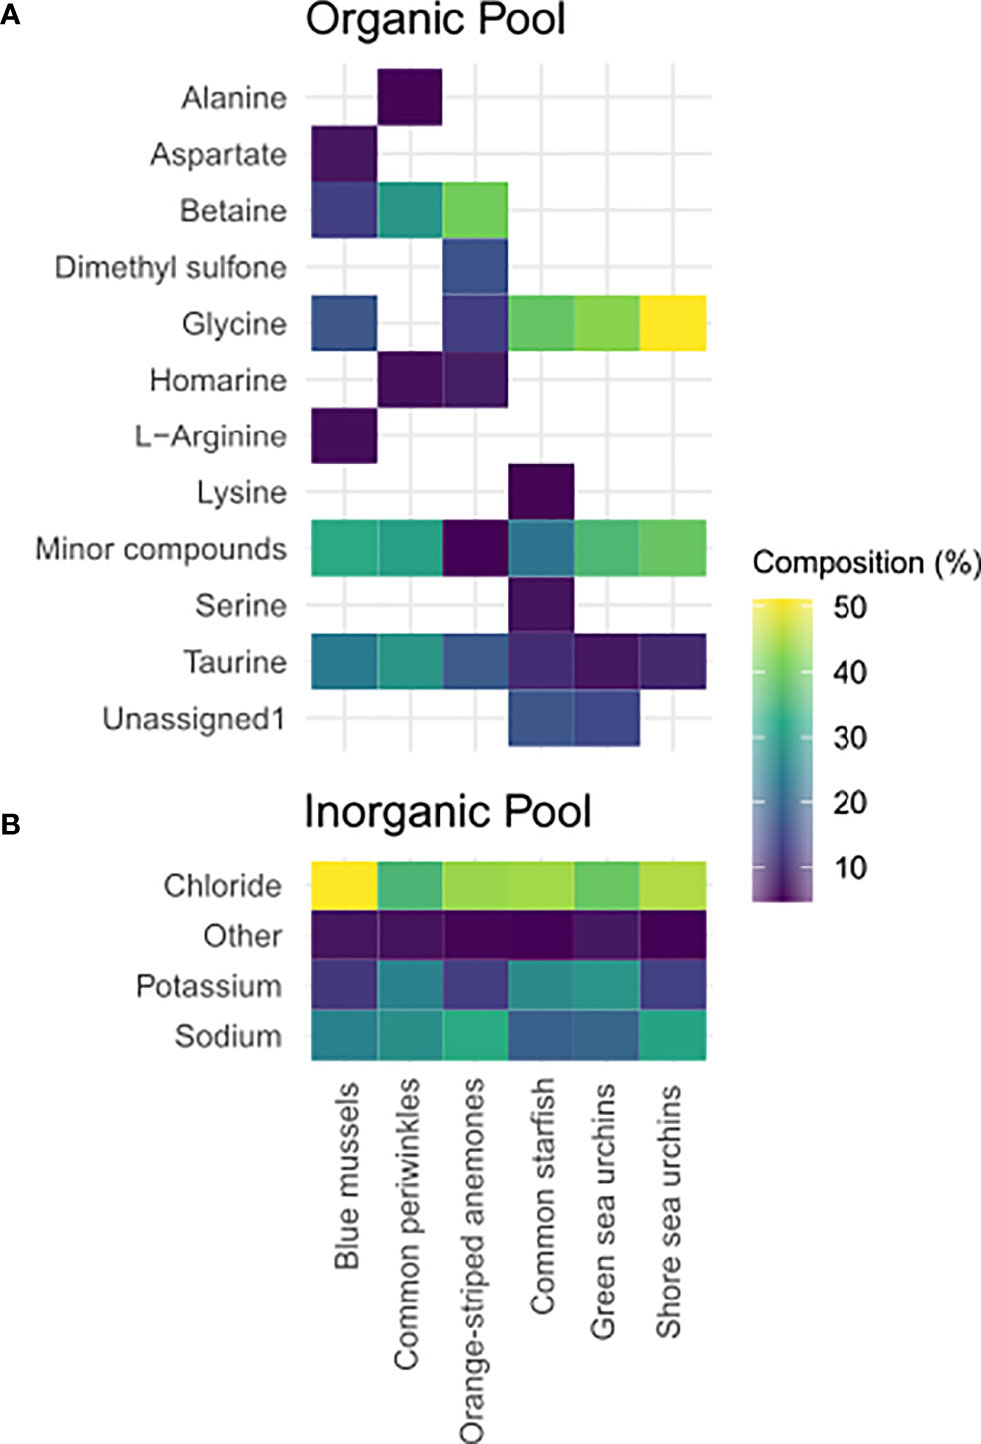
Figure 5 Composition of the total (A) organic and inorganic (B) compound pool in tissues. Depicted are the major compounds (>5%) in tissue extracts of the study organisms at the high salinity treatment: common periwinkles (L. littorea), blue mussels (Mytilus sp.), orange-striped anemones (D. lineata), shore sea urchins (P. milliaris), green sea urchins (S. droebachiensis) and common starfish (A. rubens). Organic osmolyte data for organge-striped anemones was retrieved from a previous study (Podbielski et al., 2016). The color of the field represents the percentage of the compound in the total pool of measured compounds. If no data is shown for certain species that means that the percentage of this substance is <5%.
Salinity effects on individual osmolytes were not always consistent between species (Figure 6 and Table S5). Glycine was one of the few osmolytes to be detected in all species and was the major osmolyte in echinoderms. We found methylamines such as betaine or homarine to be mollusc-specific osmolytes and to reach a constant level at low-salinity. Taurine was a major osmolyte in common starfish and molluscs. Intermediate osmolytes were often species-specific, such as glutamate in green sea urchins, aspartate in blue mussels, or lysine in common starfish. Serine was specific to echinoderms. Alanine was an intermediate organic osmolyte in echinoderms and common periwinkles. Overall, the organic osmolyte pool consisted of 25%, 43% and >60% methylamines in common periwinkles, blue mussels and orange-striped anemones, respectively (Podbielski et al., 2016). On the contrary, methylamines were negligible and FAAs constituted the main portion of the organic osmolytes in echinoderms (78-90%).

Figure 6 Salinity effect of the major inorganic and organic osmolytes. Depicted are the main osmolytes in tissues of the six study organisms: blue mussels (blue, Mytilus sp.,) common periwinkles (turquoise, L. littorea), orange-striped anemones (orange, D. lineata), shore sea urchins (purple, P. milliaris), green sea urchins (green, S. droebachiensis) and common starfish (red, A. rubens). Osmolyte concentrations were corrected for relative weight changes due to an increase in water content with decrease in salinity. Concentration of the respective osmolyte is shown on the y-axis (mmol kg-1 WW) and salinity is depicted on the x-axis. The following osmolytes are shown: (A) alanine, (B) aspartate, (C) betaine, (D) glutamate, (E) glycine, (F) homarine, (G) lysine, (H) serine, (I) taurine, (J) chloride, (K) potassium and (L) sodium. Models were chosen according to best fit and their predicted values are depicted by lines. Only significant models were shown. If no data is shown for certain species that means that this substance was not detected. If only data points are shown without a model, that means that there was no significant model. Confidence intervals (95%) are shown as shaded area. No organic osmolytes were measured for orange-striped anemones. For model results see Table S5.
Inorganic Osmolytes: Pool Composition and Major Osmolytes
The main inorganic osmolytes we identified in body fluids and tissues were chloride, potassium and sodium (Figure 5 and Figure S3B, Table S5). In body fluids chloride and sodium concentrations were isosmotic, potassium slightly hyperosmotic (i.e. hyperconform) to seawater in all investigated species except for common periwinkles (Figure 3). The total inorganic ion pool in tissues was chiefly accounted for by sodium and chloride (60-80%) in all species. We observed a significant effect of salinity on tissue chloride concentration in all species except in shore sea urchins (Figure 6). The relationship was linear in common starfish and values were constant at low salinities in blue mussels, common periwinkles and green sea urchins. Similar patterns could be observed for sodium and potassium. Tissue sodium and potassium concentrations changed significantly with salinity in common periwinkles, common starfish and blue mussels - but not in sea urchins. Sodium concentrations were constant at low-salinity in blue mussels, common periwinkles and common starfish. Tissue potassium concentration was less strongly impacted by salinity in blue mussels, common periwinkles and common starfish when compared to chloride or sodium. In orange-striped anemones, chloride, sodium and potassium concentrations decreased initially with decreasing salinity until an inflection point at salinity of 10 was reached after which concentrations increased. Concentrations were corrected for relative weight changes resulting from tissue hydration (Figure 1I).
Discussion
Fitness Proxies and Tissue Water Content
The applied salinity stress impacted the tested invertebrate species on different levels. The first physiological sign of low-salinity stress was a reduction of net growth rates, with negative values at very low salinities. Cessation of growth at low salinities indicates severe salinity stress and an unsustainable energetic state where costs for osmoregulation are too high to allow for allocation of surplus energy into anabolic processes (Landes et al., 2015). Below such growth-abolishing salinity levels, energy reserves and tissue have to be catabolized to meet energetic demands. This threshold towards negative growth was located close to salinities (within ± 0-1.5) that caused mortality and a change in tissue water content in all species examined here. Changes in cellular water content have previously been hypothesized to indicate that an organism has reached its volume regulation capacity limit (Lange, 1970). At this point, species cannot further acclimate to low-salinity by continued depletion of the osmolyte pool and cellular water content increases. Tissue water content increased in all tested species at low salinities, indicating an impaired volume regulatory ability.
Growth rates were similar or higher compared to literature data in all investigated species (Minor and Scheibling, 1997; Otero-Villanueva et al., 2004; Melatunan, 2012; Landes et al., 2015; Podbielski et al., 2016; Schmittmann, 2017).
Water content was similar to previously reported values in blue mussels, common periwinkles, orange-striped anemones, green sea urchins and shore sea urchins (Bryan, 1963; McManus et al., 1997; Sokolova et al., 2000; Locke and Carman, 2009; Sætra et al., 2022). We did not observe an increase in water content with decreasing salinity in common starfish, similar to the other species. Instead, the tissue water contents for common starfish were observed to decrease at a salinity of 11 in this experiment, which coincided with a loss of body turgor. Yet, unpublished results showed a steep increase in water content of common starfish at salinities of 11 after a shorter acclimation period of two weeks (Figure S4). This indicated that sea star water content is stable over a wide range of salinities until a limit is reached. This limit cannot be tolerated for prolonged periods and thus was only visible under shorter acclimation times. The general response of water content in relation to salinity was thus similar for all investigated species. In sea urchins the relation between water content and salinity was linear. A potential increase in tissue hydration around a threshold salinity of 20 for the green sea urchin and 18 for the shore sea urchin could not be resolved due to a high variance and low level of replication.
Low-salinity survival thresholds determined in this study corresponded to salinities observed at geographic distribution boundaries and/or were similar to published mortality rates for common starfish, green sea urchins, orange-striped anemones and blue mussels (Lange, 1964; Shick, 1976; Schmittmann, 2017; Stuckas et al., 2017). Although none of our orange-striped anemones died under the applied salinity treatments, the observed cessation of asexual reproduction already at salinity 10 was slightly higher than found previously (salinity 7) (Podbielski et al., 2016). Common periwinkles, however, were more tolerant to low-salinity during our experiments (salinity 8) than it was found in older studies (salinity limit of 10-12.5) (Klekowski, 1963). While we observed no mortality of shore sea urchins even at the lowest applied salinities of 15, in the field, the distribution limit of shore sea urchins has been reported between salinities of 17 and 20 (Gezelius, 1963).
It has to be generally acknowledged that due to local adaptation to the brackish Baltic Sea environment the low-salinity tolerance of Baltic Sea populations, especially for echinoderms and sea anemones, but also blue mussels, is much higher than for populations of the same species from fully marine environments (Tedengren et al., 1990; Schmittmann, 2017; Väinölä and Johannesson, 2017). This offers valuable insight into the acclimation (and adaptation) potential of marine invertebrates with respect to the necessity for many marine animals to cope with future salinity changes in the course of climate change (Reusch et al., 2018).
Cellular Osmoregulation
Organic osmolyte concentrations in tissues decreased following long-term low-salinity acclimation in all species, except in shore sea urchins, confirming part of hypothesis 1. This decrease was linear in orange-striped anemones, green sea urchins, common starfish and blue mussels, whereas it stabilized at low-salinity in common periwinkles (Figures 1, 2; Podbielski et al., 2016).
The other part of our first hypothesis, namely that tissue inorganic osmolyte concentrations decrease after long-term low-salinity acclimation, can be accepted for blue mussels, common periwinkles and common starfish and has to be partially rejected for green sea urchins. Tissue ion concentrations in blue mussels decreased with declining salinity, but stabilized at salinity ≤8, indicating intracellular hyperosmoticity at low-salinity, while the total osmolality of body fluids remains largely isosmotic, slight deviations from the isoline could be observed for osmolality, chloride and sodium concentration in body fluids as well, but were too small to be statistically significant. Similarly, inorganic ion concentration in snail tissues revealed stabilized concentrations in tissues at low-salinity, indicating intracellular hyperosmoticity. Usually intracellular osmolality seeks equalization with the extracellular compartment in nearly all animal cells (Kirschner, 1991). Yet, hyperosmotic conditionof nerve cells was observed in blue mussels acclimated to low-salinity (Willmer, 1978). Intracellular hyperosmoticity at low-salinity has also been observed in other osmoconformers (Willmer et al., 2009). In order to measure this, fine-scale monitoring is needed, but the rare inorganic osmolyte studies were not designed to detect this pattern (Potts, 1958; Silva, 1992). This exposes a huge research gap for fine-scale monitoring of inorganic osmolyte profiles of osmoconforming invertebrates. In green sea urchins, inorganic osmolyte concentrations were stable across salinity treatments. Inorganic osmolytes do not seem to play a role in green sea urchin CVR.
In general, by solely analyzing whole tissue samples it is not possible to distinguish compartmentalization between extra and intracellular ion concentrations. Tissue inorganic ion concentrations are higher than intracellular values due to the influence of the extracellular fluids. By determining the likely ECS fraction we were able to draw the conclusions that the inorganic ion contribution of the ECS does not strongly impact the tissue inorganic pool patterns (Figure S2). This very conservative calculation revealed that intracellular inorganic ion concentrations are reduced after long-term low-salinity acclimation in blue mussels, common periwinkles and common starfish. While our tissue analysis yielded robust results, determination of intracellular fluid concentrations via precise ECS volume estimation would be important to further constrain intracellular ion concentrations. Traditionally, this has been accomplished via measuring the dilution of a known volume of radioactively labelled tracers such as 3H-/14C-inulin injected into the ECS (Willmer, 1978; Thompson et al., 1980; Michaelidis et al., 2005). These methods require adequate facilities and equipment for radiotracer studies (which was not available in this instance) and also pose a safety risk for investigators. With the advancement in labelling techniques we propose the use of fluorescent tracers such as FITC-inulin instead. There are a few recent studies available that successfully used FITC inulin for ECS determination in mammals (Krol et al., 1999; Binder et al., 2004; Verkman, 2013).
The organic and the inorganic osmolyte pool played important roles in cellular osmoregulation in molluscs and common starfish, whereas in green sea urchins, only the organic pool was involved. Furthermore, the higher inorganic osmolyte concentration (compared to the organic pool) implied an even higher importance of the inorganic pool for the CVR process in molluscs and some echinoderms. Only three other studies are available, (exclusively assessing molluscs) that measured inorganic as well as organic compounds after long-term low-salinity acclimation. Similar to our results, these studies found significant effects of salinity on both osmolyte pools and a larger inorganic pool size (Potts, 1958; Turgeon, 1973; Silva, 1992).
Organic Osmolyte Concentration
Overall, we observed three recurrent patterns of individual organic osmolyte concentration changes with salinity. First, for some osmolytes (e.g. intermediate osmolytes in common starfish) we detected a steady decrease of osmolyte concentration with decreasing salinity, which agrees well with previous studies ( (Schmittmann, 2017), Figure 6). A second pattern we observed was a decline of organic osmolyte concentrations with declining salinity that eventually stabilized - indicating hyperregulation - at low-salinity. This pattern was very prominent for the major organic osmolytes betaine (molluscs) and glycine (common starfish; Figure 6) and is also consistent with literature results (Deaton et al., 1989; Sanders, 2018). Third, the major osmolytes glycine in green sea urchins and taurine and blue mussels reached maximum concentrations already at intermediate to high salinity. A similar saturation pattern for taurine concentrations was found in bivalves (Kube et al., 2007). At lower salinities the third pattern can either show a linear decrease as described in the first pattern (e.g. taurine or aspartate in blue mussels), or concentrations can stabilize as described in pattern 2 (e.g. aspartate and glutamate in green sea urchins).
Furthermore, a selective utilization of intermediate organic osmolytes below a certain salinity threshold was observed. This indicates that under severe salinity stress a wider variety of organic osmolytes is modulated, whereas under moderate stress only major osmolytes are utilized. Under moderate salinity stress, intermediate osmolytes occurred at low constant concentrations and were not accumulated further at higher salinity. The reason for this could be that many minor osmolytes are intermediates in metabolic pathways that generate major osmolytes - and are thus converted instead of being accumulated (Ellis et al., 1985; Pierce et al., 1992; Wargo, 2013). We propose that the examined Baltic Sea invertebrates prioritize a reduction of major osmolytes during low-salinity acclimation and only resort to intermediate osmolytes when salinity stress progresses.
The taxon-specific differences in osmolyte composition (for example methylamines) between echinoderms and molluscs confirmed our second hypothesis. This is consistent with a recent meta-analysis about taxonomic variation of the salinity effect on osmolyte concentrations in tissues of osmoconformers (Podbielski et al., 2022). Our study highlights methylamines as an important part of the organic osmolyte pool in marine invertebrates. However, a large deficit of studies utilizing untargeted metabolic profiling leads to a severe under-representation of methylamines in the osmolyte literature (Podbielski et al., 2022).
Within the echinoderms studied, both sea urchin species had an almost identical organic osmolyte composition. The organic osmolyte pool of the sea star was only slightly different in its composition to that of the two sea urchin species. All three species utilized glycine as main osmolyte and serine as accompanying intermediate osmolyte. Previous studies detected similar concentrations for glycine, but smaller values for serine and other minor osmolytes (Schmittmann, 2017). Common starfish additionally employed taurine and lysine as intermediate osmolytes, the latter of which we only found in common starfish. Sea urchins were fed with algae, while common starfish were fed with blue mussels that contain a high taurine concentration themselves, which might explain small differences in osmolyte composition. While osmolytes are generated de novo (de Vooys and Geenevasen, 2002), diet can also affect osmolyte composition. Amino acids have been shown to be taken up via ingestion of food in green sea urchins, and tissue lipid content was affected by diet in shore sea urchins (Castell et al., 2004; Lawrence et al., 2007).
Between the two tested molluscs, we found larger differences in osmolyte composition when compared to the variation among echinoderms. The largest difference was observed for betaine. Common periwinkles utilized betaine as a major osmolyte, whereas in blue mussels, betaine was an intermediate osmolyte. In contrast, glycine concentrations were higher in blue mussels compared to common periwinkles, thus substituting betaine. This is consistent with some previous studies on molluscs (Hoyaux et al., 1976; Sanders, 2018). However, utilization of high concentrations of betaine has been observed in a closely related blue mussel congener (Mytilus californianus) (Silva, 1992). Moreover, glycine is a product of betaine catabolism (Wargo, 2013). Osmolyte pathways are linked and changes in these metabolic processes could also be responsible for these observed differences (Wargo, 2013). Also betaine, has been shown to have other cellular functions: it is involved in regulation of enzymes involved in energy metabolism, lipogenesis or beta-oxidation or regulation of transcription factors (Figueroa-Soto and Valenzuela-Soto, 2018). Thus, differences in betaine osmolyte concentrations between species could indicate differences in these metabolic pathways.
Why taxonomic group-specific osmolytes (such as methylamines in molluscs) have evolved is yet unclear. Our results demonstrate the presence of betaine in high concentrations in molluscs. While we cannot infer the source from that data, betaine biosynthesis has been demonstrated in Mytilus galloprovincialis (de Vooys and Geenevasen, 2002). In contrast, echinoderms, do not seem to employ betaine in large concentrations albeit the availability of a genomic blueprint for betaine synthesis and precursor uptake via transporters (Ngugi et al., 2020). Choline is a precursor of betaine. Genes coding choline transporters, responsible for choline uptake, as well as enzymes for betaine synthesis (choline dehydroxygenase, betaine aldehyde dehydrogenase, choline oxidase, glycine-sarcosine methyltransferase and sarcosine dimethyl transferase) are present in echinoderms (Goel and Mushegian, 2006; Ngugi et al., 2020).
Generally, methylamines are considered stronger protein stabilizers than non-methylated osmolytes such as glycine (Yancey, 2005; Yancey and Siebenaller, 2015). Thus, the use of methylamines in euryhaline blue mussels and common periwinkles could be an adaptation to the low saline conditions of their environment, whereas habitat osmolality is usually higher for the typically more stenohaline echinoderms. The sea star examined in this study is one of the few euryhaline echinoderms. The only notable difference between sea urchins and common starfish were the larger concentrations of intermediate osmolytes (such as alanine, aspartate, lysine, ornithine, serine, etc.) at low to medium salinities and the use of taurine as an osmolyte in common starfish.
Inorganic Osmolyte Concentration
Our first hypothesis, stating that tissue chloride and sodium concentrations decrease with decreasing salinity, can be accepted for blue mussels, common periwinkles, common starfish and orange-striped anemones. In green sea urchins, only tissue chloride concentrations were significantly decreased following acclimation to low-salinity. Our hypothesis that constant tissue calcium and potassium concentrations are maintained across salinity treatments, can only be accepted for green sea urchins.
In our study, the monovalent ions chloride and sodium were the main inorganic osmolytes involved in long-term low-salinity acclimation, which is in line with other studies using mollusc model organisms (Potts, 1958; Berger et al., 1978; Silva, 1992; Sanders, 2018). However, not all studies detected a salinity effect on tissue monovalent inorganic osmolyte concentrations. In the mussel Perna perna, no changes in cellular chloride or sodium concentration were detected (Stucchi-Zucchi and Salomão, 1998). The effect of salinity on potassium concentrations is however controversial. Our results for blue mussels, common periwinkles and common starfish revealed a significant change in tissue potassium concentration acclimated to different salinities, which is corroborated by other bivalve studies (Potts, 1958; Willmer, 1978; Stucchi-Zucchi and Salomão, 1998). Yet, usually potassium is assumed to be highly regulated in the intracellular space (Palmer, 2015), which is also supported by other mollusc studies (Berger et al., 1978; Silva, 1992; Sanders, 2018). As stated above, we analyzed tissue extracts which include intracellular as well as extracellular fluids. However, considering the likely ECS fractions (4.2, Figure S2) we assume that the highly significant salinity effects seen for inorganic ions in tissue will translate, albeit to a slightly lesser degree, to the intracellular fluids.
Significant changes of other, lower concentrated, tissue inorganic ions (Table S3) may also be of relevance. Ions like calcium and bromide affect organisms by limiting many biological processes, ranging from calcification to cytoprotective functions (Borgmann, 1996; Sanders et al., 2021). Overall, however, our results highlight, the importance of the monovalent ions chloride and sodium as inorganic osmolytes in long-term salinity acclimation processes.
Critical Salinity Concept
We previously defined a critical salinity (Scrit) as the lower salinity threshold at which the organic cellular osmolyte pool and fitness (proxies: mortality, growth) are reduced to zero and postulated (hypothesis 3) that Scrit can be identified in all experimental species (5, Figure 7). We could not confirm this hypothesis for any of the investigated species. In contrast, we discovered that organic osmolyte pools in most animals were not yet fully depleted when severe loss of fitness occurred (Figures 7B, D). The previously reported Scrit concept for orange-striped anemones (Podbielski et al., 2016) and common starfish (Schmittmann, 2017) is thus not transferable across all invertebrate phyla. In green sea urchins, orange-striped anemones and common starfish, the determined Scrit was lower than the threshold we would have expected from fitness proxies and changes in tissue water content. In blue mussels, the negative Scrit values are biologically nonsensical and thus the concept was not applicable. In common periwinkles, or shore sea urchins, the concept was not applicable to organic osmolyte data.
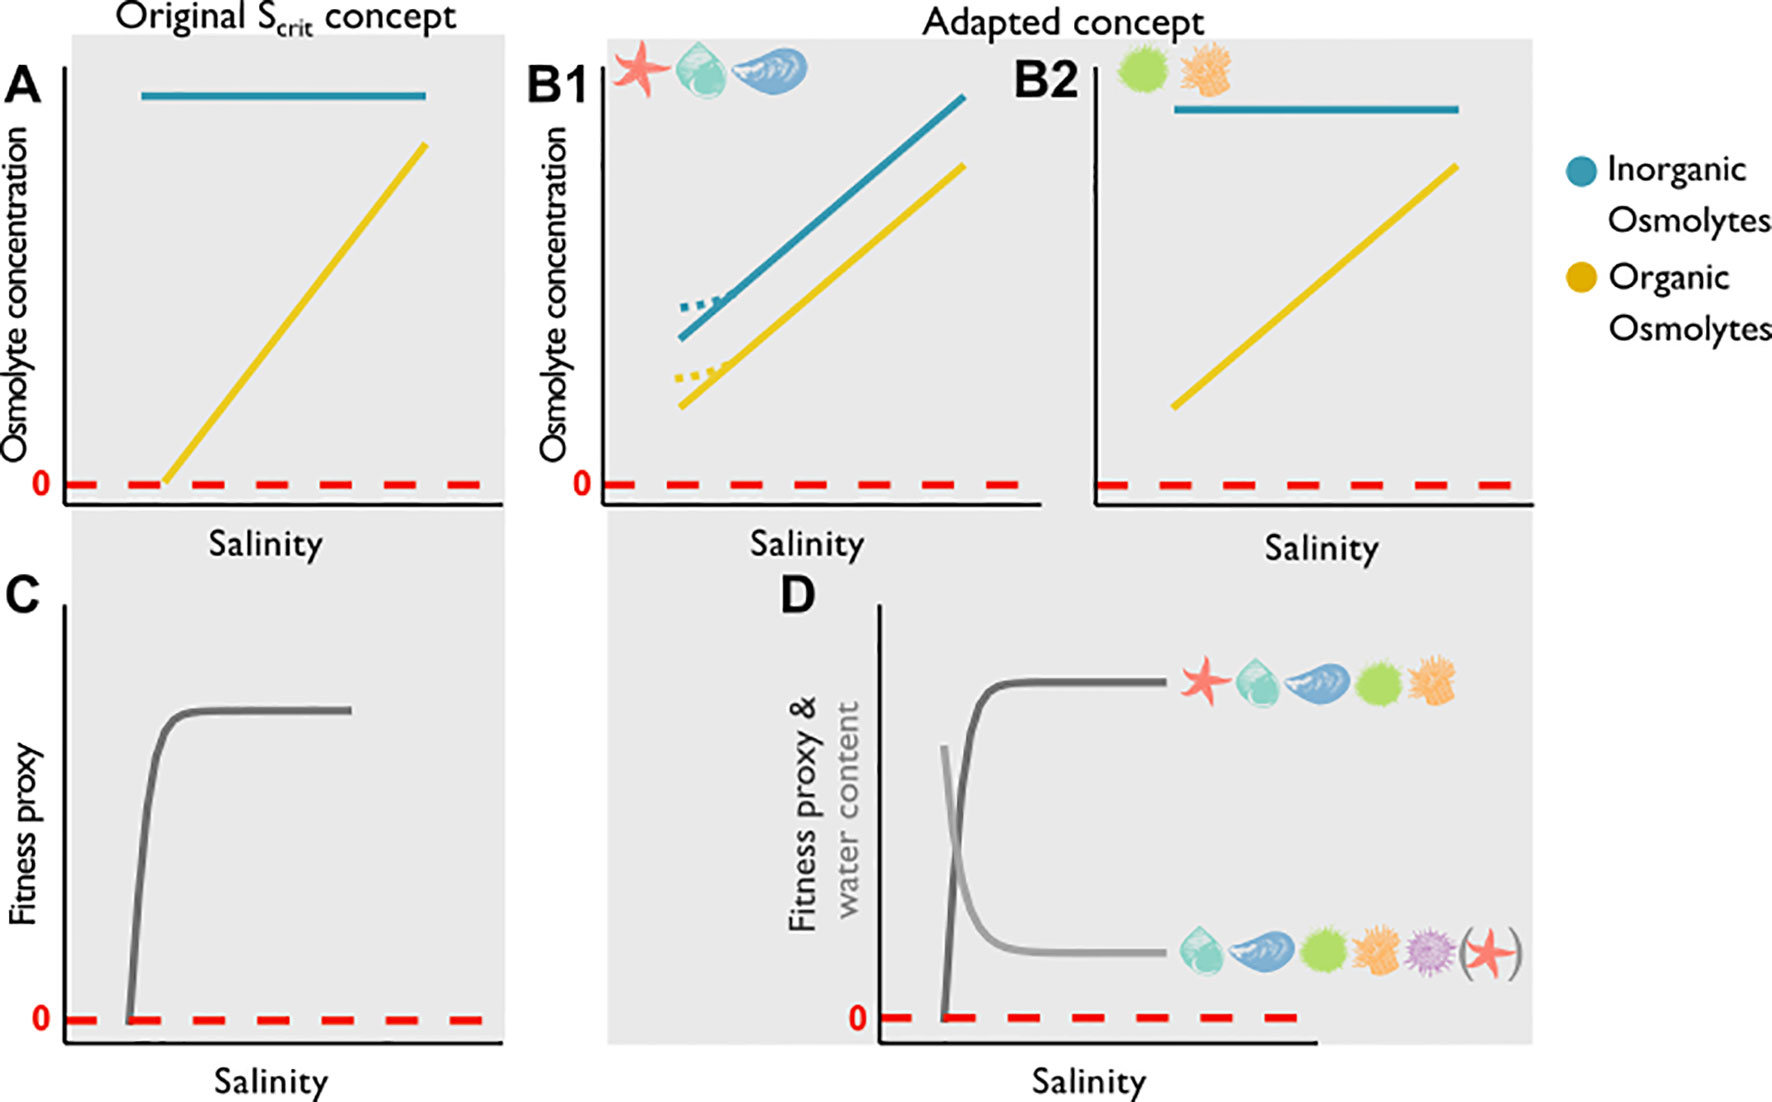
Figure 7 Depicted are hypotheses on how salinity affects the osmolyte pool in combination with idealized fitness parameters and tissue water content. The blue lines mark the inorganic osmolyte pool, the yellow lines mark the organic osmolyte pool. The dashed red lines marks zero. Panel (A) shows the original Scrit concept for the total organic osmolyte pool. A linear decrease of organic osmolytes is shown until the organic osmolyte pool is fully depleted while inorganic ion concentration is constant. Scrit is defined as the point when the organic osmolyte pool is depleted. Panel (B) shows an altered concept of two scenarios that show a Scrit range which incorporates the inorganic and organic osmolyte pool). In scenario B1 both pools decrease with salinity [in some species these concentrations stabilize at low salinities (dashed yellow and blue lines)], but concentrations do not reach zero. Scenario B2 shows a decrease with salinity in the organic pool, but concentrations do not reach zero, while the inorganic pool remains constant. (C) Depicted is a fitness proxy (e.g. survival; dark grey) in relation to salinity, which according to the Scrit concept reaches zero when the organic osmolyte pool is depleted. (D) Here we see a fitness proxy that drops rapidly after a low-salinity threshold is reached (i.e. survival), meanwhile tissue water content (light grey) increases below this limit. The species symbols in panels (B, D) symbolize if the suggested concept applies to the investigated species in this study.
In common periwinkles, the original Scrit concept was not applicable as organic osmolyte concentrations stabilized below a lower salinity threshold, indicating hyperosmotic regulation. Similar patterns could be seen for individual osmolytes in the other invertebrates when fitness was reduced (i.e. betaine and homarine in blue mussels; alanine, glutamate and serine in green sea urchins; glycine in common starfish). Hyperregulation is an energetically costly process (McAllen et al., 2002; Willmer et al., 2009; Freire et al., 2011; Sokolova et al., 2012; Rivera-Ingraham and Lignot, 2017).
We found that blue mussels are isosmotic across a large salinity range, but hyperregulate at extremely low-salinity. This is also known for example from in estuarine annelids (Willmer et al., 2009). We presume that such hyperregulation indicate conditions that cannot be tolerated permanently, at least not under regular metabolic rates if costs to maintain homeostasis exceed available energy (Kim et al., 2001; Rivera-Ingraham et al., 2016). In blue mussels, modeling Scrit from osmolyte concentrations was not meaningful as a Scrit <0 would be calculated, a phenomenon that was also observed in a previous blue mussel study (Sanders, 2018).
A shortcoming of the original concept was its focus on organic osmolytes (Figure 7A). This study has, indeed, demonstrated the significant involvement of the inorganic osmolyte pool in active CVR. An altered concept therefore has to include inorganic osmolytes in long-term acclimation processes to low-salinity (Figure 7B). There does not seem to be a universal concept based on osmolyte concentrations that defines the lower salinity threshold of species. Rather, the combination of multiple parameters characterizes the mechanistic basis of the lower salinity threshold of study organisms.
For common periwinkles the salinity threshold derived from reduced fitness and inorganic and organic osmolyte hyperregulation matched perfectly. A clear tipping point was apparent in common periwinkles with a salinity of 14, where biomass is catabolized, tissue water content increased, survival was impacted and inorganic and organic osmolyte pools stabilized. While common periwinkles can endure lower salinities of 6-13 for some time, living under such conditions will not be sustainable. These findings roughly match known species distribution limits at a salinity of 10-12.5 (Klekowski, 1963).
In blue mussels, we saw a clear tipping point at salinity 10 where tissue water content sharply increased and survival declined and the major organic osmolytes betaine and taurine had their inflection points. At salinity ≤7, this increase stagnated and water content as well as inorganic and organic osmolyte concentrations stabilized. Biomass was not catabolized until salinity dropped below 6. Another study (with individuals of similar size) found an increase of mortality only at salinities ≤5 (Sanders, 2018). Altogether, a critical salinity range of 7-10 can be suggested, in which a majority of blue mussels can still survive, yet with energetic trade-offs due to costs for cellular osmoregulation that affect growth, which was demonstrated by a 64% reduction in growth. While they can, hence, tolerate lower salinities under laboratory conditions, M. edulis-like genotypes (as used in our study) are replaced in the field by M. trossolus-like genotypes already at salinities <10 (Stuckas et al., 2017; Knöbel et al., 2021). The distribution limit of M. edulis-like mussels in the Baltic Sea is therefore defined by M. edulis’ physiological limits.
The fitness parameters, mean water content, concentrations of inorganic osmolytes chloride and sodium as well as the inflection point in total osmolality of orange-striped anemones matched perfectly to suggest a salinity limit of these animals at 10 (Figure 1). Previous studies on organic osmolytes in orange-striped anemones, however, showed a Scrit at salinity 6.5 (Podbielski et al., 2016). No mortality was observed for orange-striped anemones at the measured salinities, but when net growth was zero, asexual reproduction of orange-striped anemones ceased. Thus, despite short-term survival at lower salinities, the long-term lower salinity threshold that permits growth and reproduction of orange-striped anemones appears to be located at salinities around 10. This also agrees with distribution limits of orange-striped anemones in the field (Podbielski et al., 2016).
While our calculated Scrit values for common starfish (Scrit = 10) agreed with literature data (Schmittmann, 2017), Scrit was lower than could be expected from fitness proxies. Catabolism of biomass was associated with decrease in survival of common starfish at salinities ≤13. Furthermore, while tissue total osmolality stabilized at salinities ≤13 (Figure 4), this pattern was not apparent in the inorganic or organic osmolyte pool (Figure 2). However, a closer look at the main organic osmolyte glycine demonstrated stabilizing concentrations at salinities ≤13 (Figure 6). We can, hence, corroborate a low-salinity threshold between salinities of 12 and 13, which was published before (Casties et al., 2015; Schmittmann, 2017).
As in common starfish, the Scrit = 14.4 calculated for green sea urchins was lower than expected from net growth and survival, which both decreased at salinity 20. No threshold was visible in water content, total organic osmolyte pool and the major osmolyte glycine, while the inorganic ion pool remained constant. Yet, at a salinity of 20, a stabilization of some minor organic osmolytes was observed, agreeing well with the performance fitness parameters. Thus, in green sea urchins no clear salinity threshold was indicated by osmolyte data, whereas fitness parameters proved more useful. The fitness threshold at salinity 20 corresponds well with the distribution limit reported for North Sea populations that occur down to a salinity of 21.5 (Lange, 1964).
Responses in for physiological parameters in shore sea urchins appeared to be similarly associated (even though a low number of replicates hindered the statistical analysis of osmolytes): zero net growth and increasing tissue water content indicated a low-salinity threshold at 15, even though survival was not impacted yet. As seen for common starfish, once a tipping point is reached, the survival of marine animals suffering from desalination can decline very rapidly. We hence expect the threshold for mortality to be located close to the lowest salinity treatment (salinity = 15) tested in our experiment. In the field, the distribution limit of shore sea urchins has been reported between salinities 17 and 20 which is higher than could be expected from our data (Gezelius, 1963).
Conclusion
Overall, we found that low-salinity acclimation had severe effects on the physiological performance and osmotic system of six Baltic Sea invertebrate species.
We were able to demonstrate that the total inorganic organic osmolyte pool was dynamically modulated by changes in salinity in blue mussels, common periwinkles, common starfish and orange-striped anemones, whereas no changes in the inorganic osmolyte pool were detected in green sea urchins.
I. These changes in the inorganic osmolyte pool were mainly driven by modulation of monovalent ion concentrations (sodium, chloride) and less so potassium and calcium.
II. Taxon-specific differences in osmolyte composition between studied Echinodermata and Mollusca were mainly manifested in the utilization of methylamines by molluscs (main osmolytes betaine & taurine) and the restriction to FAAs in echinoderms (main osmolyte glycine).
III. Lastly, we found the Scrit concept sensu Podbielski et al. (Podbielski et al., 2016) not applicable as osmolyte pools, albeit being reduced with salinity, were not fully depleted at low-salinity. Organic osmolyte content alone cannot predict a species’ lower tolerance limit. Fitness parameters and osmolyte profiles were found to be linked. However, the relationships are not simple and mechanisms are not uniform between species.
While we found that all species can endure reduced salinity over a certain range, we determined clear physiological limits. Our results nicely show that the low-salinity threshold marks a critical salinity range (rather than one specific point). Here, fine-scale monitoring around the anticipated lower salinity threshold is needed to detect the stabilization of osmolyte levels as well as an increase in water content reliably. With respect to future changes in salinity we thus hypothesize that all species studied here will experience a shift in species distribution with the projected salinity changes. Further, fitness of local populations in high salinity environments may be reduced in response to the lowered salinity conditions in the future. As the salinity effects found in this study were species-specific the use of a universal concept is not supported. We propose an alternate comprehensive approach that includes fitness parameters, water content and osmolytes (Figure 7), to understand how distribution limits are determined and identify the mechanisms that control salinity tolerance.
A recent meta-analysis highlighted large gaps of knowledge with respect to intracellular osmolyte concentrations across invertebrate taxa (Podbielski et al., 2022). Research in the field of salinity tolerance, especially cellular osmoregulation, is essential, and certainly needed, to establish reliable physiological limits of species in order to estimate consequences of future salinity changes with ongoing climate change. It is important to assess the salinity tolerance capacity in euryhaline species to obtain a better understanding of the basic mechanisms that are utilized in a wide range of species. It is further crucial to establish cellular inorganic and organic osmolyte profiles that build a foundation for applied cellular physiological research, for example for designing suitable buffers for in vitro assays as these buffers need to incorporate complex organic and inorganic osmolyte changes. Knowledge about cellular and whole-organism biochemistry and physiology is absolutely crucial for characterizing the functions of genes that are under selection by climate change stressors (Melzner et al., 2021). The Baltic Sea, with its natural salinity gradient and locally adapted populations, can be used to simulate future selection gradients to identify which cellular mechanisms and genes are modulated under persistent salinity reductions. This fundamental knowledge is necessary in order to assess whether there is potential for acclimation and rapid adaptation in changing oceans.
Data Availability Statement
The original contributions presented in the study are included in the article/Supplementary Material. Further inquiries can be directed to the corresponding author.
Author Contributions
IP, FM, CH, and MB designed research; IP performed research; MB and CB contributed analytic tools; IP and M-CH analyzed data; IP, CH, M-CH, CB, and FM wrote the paper. All authors contributed to the article and approved the submitted version.
Conflict of Interest
The authors declare that the research was conducted in the absence of any commercial or financial relationships that could be construed as a potential conflict of interest.
Publisher’s Note
All claims expressed in this article are solely those of the authors and do not necessarily represent those of their affiliated organizations, or those of the publisher, the editors and the reviewers. Any product that may be evaluated in this article, or claim that may be made by its manufacturer, is not guaranteed or endorsed by the publisher.
Acknowledgments
The authors would like to thank U. Panknin for providing Rhodomonas sp.-Cultures and for help during sampling. We thank T. Stegmann for help with analytical procedure. We thank T. Hamm, O. Schäfer, C. Schmidt, S. Mlyneck and C. Dyroff for help with aquaristic maintenance. We would further like to thank C. Panknin and A. L. Schmidt for help on sampling days. We’d like to thank S. Pierce and F.J. Sartoris for advice on ion chromatography protocols.
Supplementary Material
The Supplementary Material for this article can be found online at: https://www.frontiersin.org/articles/10.3389/fmars.2022.898364/full#supplementary-material
References
Baginski R. M., Pierce S. K. (1977). The Time Course of Intracellular Free Amino Acid Accumulation in Tissues of Modiolus Demissus During High Salinity Adaptations. Comp. Biochem. Physiol. A Physiol. 57, 407–412. doi: 10.1016/0300-9629(77)90137-2
Ballantyne J. S., Berges J. (1991). Enzyme-Activities of Gill, Hepatopancreas, Mantle, and Adductor Muscle. Can. J. Fish. Aquat. Sci. 48, 1117–1123. doi: 10.1139/f91-133
Berger V. Y., Khlebovich V. V., Kovaleva N. M., Natochin Y. (1978). The Changes of Ionic Composition and Cell Volume During Adaptation of Molluscs (Littorina) to Lowered Salinity. Comp. Biochem. Physiol. A Physiol. 60, 447–452. doi: 10.1016/0300-9629(78)90015-4
Binder D. K., Papadopoulos M. C., Haggie P. M., Verkman A. S. (2004). In Vivo Measurement of Brain Extracellular Space Diffusion by Cortical Surface Photobleaching. J. Neurosci. 24, 8049–8056. doi: 10.1523/JNEUROSCI.2294-04.2004
Borgmann U. (1996). Systematic Analysis of Aqueous Ion Requirements of Hyalella Azteca: A Standard Artificial Medium Including the Essential Bromide Ion. Arch. Environ. Contam. Toxicol. 30, 356–363. doi: 10.1007/BF00212294
Bowlus R. D., Somero G. N. (1979). Solute Compatibility With Enzyme Function and Structure: Rationales for the Selection of Osmotic Agents and End-Products of Anaerobic Metabolism in Marine Invertebrates. J. Exp. Zool. 208, 137–151. doi: 10.1002/jez.1402080202
Braby C. E., Somero G. N. (2006). Following the Heart: Temperature and Salinity Effects on Heart Rate in Native and Invasive Species of Blue Mussels (Genus Mytilus). J. Exp. Biol. 209, 2554–2566. doi: 10.1242/jeb.02259
Bryan G. W. (1963). The Accumulation of Radioactive Caesium by Marine Invertebrates. J. Mar. Biol. Assoc. U. K. 43, 519–539. doi: 10.1017/S0025315400000497
Castell J. D., Kennedy E. J., Robinson S. M. C., Parsons G. J., Blair T. J., Gonzalez-Duran E. (2004). Effect of Dietary Lipids on Fatty Acid Composition and Metabolism in Juvenile Green Sea Urchins (Strongylocentrotus Droebachiensis). Aquaculture 242, 417–435. doi: 10.1016/j.aquaculture.2003.11.003
Casties I., Clemmesen C., Melzner F., Thomsen J. (2015). Salinity Dependence of Recruitment Success of the Sea Star Asterias Rubens in the Brackish Western Baltic Sea. Helgol. Mar. Res. 69, 169–175. doi: 10.1007/s10152-015-0425-8
Climate Change 2014: Synthesis Report (2014). Contribution of Working Groups I, II and III to the Fifth Assessment Report of the Intergovernmental Panel on Climate Change (Geneva, Switzerland: IPCC).
Cuenca A. L. R., Souza M. M., Freire C. A. (2021). Osmoregulatory Power Influences Tissue Ionic Composition After Salinity Acclimation in Aquatic Decapods. Comp. Biochem. Physiol. A. Mol. Integr. Physiol. 259, 111001. doi: 10.1016/j.cbpa.2021.111001
Deaton L. E., Derby J. G., Subhedar N., Greenberg M. J. (1989). Osmoregulation and Salinity Tolerance in Two Species of Bivalve Mollusc: Limnoperna Fortunei and Mytilopsis Leucophaeta. J. Exp. Mar. Biol. Ecol. 133, 67–79. doi: 10.1016/0022-0981(89)90158-5
de Vooys C. G. N. (1991). Anaerobic Metabolism in Sublittoral Living Mytilus Galloprovincialis in the Mediterranean—IV. Role of Amino Acids in Adaptation to Low Salinities During Anaerobiosis and Aerobiosis. Comp. Biochem. Physiol. A Physiol. 100, 423–431. doi: 10.1016/0300-9629(91)90494-W
de Vooys C. G. N., Geenevasen J. A. J. (2002). Biosynthesis and Role in Osmoregulation of Glycine-Betaine in the Mediterranean Mussel Mytilus Galloprovincialis LMK. Comp. Biochem. Physiol. B. Biochem. Mol. Biol. 132, 409–414. doi: 10.1016/S1096-4959(02)00052-0
Ellis L. L., Burcham J. M., Paynter K. T., Bishop S. H. (1985). Amino Acid Metabolism in Euryhaline Bivalves: Regulation of Glycine Accumulation in Ribbed Mussel Gills. J. Exp. Zool. Part Ecol. Genet. Physiol. 233, 347–358. doi: 10.1002/jez.1402330303
Figueroa-Soto C. G., Valenzuela-Soto E. M. (2018). Glycine Betaine Rather Than Acting Only as an Osmolyte Also Plays a Role as Regulator in Cellular Metabolism. Biochimie 147, 89–97. doi: 10.1016/j.biochi.2018.01.002
Freel R. W. (1978). Patterns of Water and Solute Regulation in the Muscle Fibres of Osmoconforming Marine Decapod Crustaceans. J. Exp. Biol. 72, 107–126. doi: 10.1242/jeb.72.1.107
Freire C. A., Welker A. F., Storey J. M., Storey K. B., Hermes-Lima M. (2011). “Oxidative Stress in Estuarine and Intertidal Environments (Temperate and Tropical),” in Oxidative Stress in Aquatic Ecosystems (John Wiley & Sons, Ltd), 41–57. doi: 10.1002/9781444345988.ch3
Gainey L. (1994). Volume Regulation in 3 Species of Marine Mussels. J. Exp. Mar. Biol. Ecol. 181, 201–211. doi: 10.1016/0022-0981(94)90128-7
Gezelius G. (1963). Adaptation of the Sea Urchin Psammechinus Miliaris to Different Salinities. Zool. Bidr. Från Upps. 35, 329–337.
Gilles R., Delpire E. (2010). “Variations in Salinity, Osmolarity, and Water Availability: Vertebrates and Invertebrates,” in Comprehensive Physiology (John Wiley & Sons, Inc). doi: 10.1002/cphy.cp130222
Goel M., Mushegian A. (2006). Intermediary Metabolism in Sea Urchin: The First Inferences From the Genome Sequence. Dev. Biol. 300, 282–292. doi: 10.1016/j.ydbio.2006.08.030
Haapkylä J., Unsworth R. K. F., Flavell M., Bourne D. G., Schaffelke B., Willis B. L. (2011). Seasonal Rainfall and Runoff Promote Coral Disease on an Inshore Reef. PloS One 6, e16893. doi: 10.1371/journal.pone.0016893
Hoyaux J., Gilles R., Jeuniaux Ch. (1976). Osmoregulation in Molluscs of the Intertidal Zone. Comp. Biochem. Physiol. A Physiol. 53, 361–365. doi: 10.1016/S0300-9629(76)80157-0
Jones H. D., Kamel E. G. (1984). The Effect of Cryptocotyle Lingua Infection on the Blood Volume of Littorina Littorea. Comp. Biochem. Physiol. A Physiol. 79, 493–494. doi: 10.1016/0300-9629(84)90552-8
Kim W. S., Huh H. T., Huh S.-H., Lee T. W. (2001). Effects of Salinity on Endogenous Rhythm of the Manila Clam, Ruditapes Philippinarum (Bivalvia: Veneridae). Mar. Biol. 138, 157–162. doi: 10.1007/s002270000430
Kirschner L. B. (1991) Water and Ions. Available at: https://scholar.google.com/scholar_lookup?title=Water%20and%20ions&author=L.%20B.%20Kirschner&author=C.%20L.%20Prosser&publication_year=1991&book=Comparative%20Animal%20Physiology%3A%20Environmental%20and%20Metabolic%20Animal%20Physiology (Accessed April 20, 2022).
Klekowski R. Z. (1963). The Influence of low-salinity and Dessication on the Survival, Osmoregulation and Water Balance of Littorina Littorea. Pol. Arch. Hydrobiol. 11, 241–250.
Knöbel L., Nascimento-Schulze J. C., Sanders T., Zeus D., Hiebenthal C., Barboza F. R., et al. (2021). Salinity Driven Selection and Local Adaptation in Baltic Sea Mytilid Mussels. Front. Mar. Sci. 8. doi: 10.3389/fmars.2021.692078
Krol A., Maresca J., Dewhirst M. W., Yuan F. (1999). Available Volume Fraction of Macromolecules in the Extravascular Space of a Fibrosarcoma: Implications for Drug Delivery. Cancer Res. 59, 4136–4141.
Kube S., Gerber A., Jansen J. M., Schiedek D. (2006). Patterns of Organic Osmolytes in Two Marine Bivalves, Macoma Balthica, and Mytilus Spp., Along Their European Distribution. Mar. Biol. 149, 1387–1396. doi: 10.1007/s00227-006-0303-7
Kube S., Sokolowski A., Jansen J. M., Schiedek D. (2007). Seasonal Variability of Free Amino Acids in Two Marine Bivalves, Macoma Balthica and Mytilus Spp., in Relation to Environmental and Physiological Factors. Comp. Biochem. Physiol. A. Mol. Integr. Physiol. 147, 1015–1027. doi: 10.1016/j.cbpa.2007.03.012
Landes A., Dolmer P., Poulsen L. K., Petersen J. K., Vismann B. (2015). Growth and Respiration in Blue Mussels (Mytilus Spp.) From Different Salinity Regimes. J. Shellfish. Res. 34, 373–382. doi: 10.2983/035.034.0220
Lang F. (2007). Mechanisms and Significance of Cell Volume Regulation. J. Am. Coll. Nutr. 26, 613S–623S. doi: 10.1080/07315724.2007.10719667
Lange R. (1964). The Osmotic Adjustment in the Echinoderm, Strongylocentrotus Droebachiensis. Comp. Biochem. Physiol. 13, 205–216. doi: 10.1016/0010-406X(64)90117-3
Lange R. (1970). Isosmotic Intracellular Regulation and Euryhalinity in Marine Bivalves. J. Exp. Mar. Biol. Ecol. 5, 170–179. doi: 10.1016/0022-0981(70)90015-8
Lawrence J. M., Lawrence A. L., Watts S. A. (2007). “Feeding, Digestion, and Digestibility,” in Developments in Aquaculture and Fisheries Science (Elsevier), 135–158.
Locke A., Carman M. (2009). Ecological Interactions Between the Vase Tunicate (Ciona Intestinalis) and the Farmed Blue Mussel (Mytilus Edulis) in Nova Scotia, Canada. Aquat. Invasion. 4, 177–187. doi: 10.3391/ai.2009.4.1.18
Martin A. W., Harrison F. M., Huston M. J., Stewart D. M. (1958). The Blood Volumes of Some Representative Molluscs. J. Exp. Biol. 35, 260–279. doi: 10.1242/jeb.35.2.260
McAllen R., Walker D., Taylor A. (2002). The Environmental Effects of Salinity and Temperature on the Oxygen Consumption and Total Body Osmolality of the Marine Flatworm Procerodes Littoralis. J. Exp. Mar. Biol. Ecol. 268, 103–113. doi: 10.1016/S0022-0981(01)00381-1
McManus M. G., Place A. R., Zamer W. E. (1997). Physiological Variation Among Clonal Genotypes in the Sea Anemone Haliplanella Lineata: Growth and Biochemical Content. Biol. Bull. 192, 426–443. doi: 10.2307/1542752
Melatunan S. (2012) Biochemical, Metabolic and Morphological Responses of the Intertidal Gastropod Littorina Littorea to Ocean Acidification and Increase Temperature. Available at: https://pearl.plymouth.ac.uk/handle/10026.1/1009 (Accessed September 16, 2021).
Melzner F., Podbielski I., Mark F. C., Tresguerres M. (2021). A Rapidly Expanding House of Cards: The Silent Loss of Cell Physiology Hampers Marine Biosciences. EcoEvoRxiv 20 (5), e3001641. doi: 10.32942/osf.io/xkj6n
Michaelidis B., Haas D., Grieshaber M. K. (2005). Extracellular and Intracellular Acid-Base Status With Regard to the Energy Metabolism in the Oyster Crassostrea Gigas During Exposure to Air. Physiol. Biochem. Zool. Ecol. Evol. Approach. 78, 373–383. doi: 10.1086/430223
Minor M. A., Scheibling R. E. (1997). Effects of Food Ration and Feeding Regime on Growth and Reproduction of the Sea Urchin Strongylocentrotus Droebachiensis. Mar. Biol. 129, 159–167. doi: 10.1007/s002270050156
Moon H.-W., Wan Hussin W. M. R., Kim H.-C., Ahn I.-Y. (2015). The Impacts of Climate Change on Antarctic Nearshore Mega-Epifaunal Benthic Assemblages in a Glacial Fjord on King George Island: Responses and Implications. Ecol. Indic. 57, 280–292. doi: 10.1016/j.ecolind.2015.04.031
Nasi F., Nordström M. C., Bonsdorff E., Auriemma R., Cibic T., Del Negro P. (2018). Functional Biodiversity of Marine Soft-Sediment Polychaetes From Two Mediterranean Coastal Areas in Relation to Environmental Stress. Mar. Environ. Res. 137, 121–132. doi: 10.1016/j.marenvres.2018.03.002
Ngugi D. K., Ziegler M., Duarte C. M., Voolstra C. R. (2020). Genomic Blueprint of Glycine Betaine Metabolism in Coral Metaorganisms and Their Contribution to Reef Nitrogen Budgets. iScience 23, 101120. doi: 10.1016/j.isci.2020.101120
Otero-Villanueva M., del M., Kelly M. S., Burnell G. (2004). How Diet Influences Energy Partitioning in the Regular Echinoid Psammechinus Miliaris; Constructing an Energy Budget. J. Exp. Mar. Biol. Ecol. 304, 159–181. doi: 10.1016/j.jembe.2003.12.002
Palmer B. F. (2015). Regulation of Potassium Homeostasis. Clin. J. Am. Soc Nephrol. 10, 1050–1060. doi: 10.2215/CJN.08580813
Pan T.-C. F., Applebaum S. L., Manahan D. T. (2015). Experimental Ocean Acidification Alters the Allocation of Metabolic Energy. Proc. Natl. Acad. Sci. 112, 4696–4701. doi: 10.1073/pnas.1416967112
Pierce S. K. (1971). Volume Regulation and Valve Movements by Marine Mussels. Comp. Biochem. Physiol. A Physiol. 39, 103–117. doi: 10.1016/0300-9629(71)90350-1
Pierce S. K., Edwards S. C., Mazzocchi P. H., Klingler L. J., Warren M. K. (1984). Proline Betaine: A Unique Osmolyte in an Extremely Euryhaline Osmoconformer. Biol. Bull. 167, 495–500. doi: 10.2307/1541294
Pierce S. K., Rowland-Faux L. M., O’brien S. M. (1992). Different Salinity Tolerance Mechanisms in Atlantic and Chesapeake Bay Conspecific Oysters: Glycine Betaine and Amino Acid Pool Variations. Mar. Biol. 113, 107–115. doi: 10.1007/BF00367644
Podbielski I., Bock C., Lenz M., Melzner F. (2016). Using the Critical Salinity (Scrit) Concept to Predict Invasion Potential of the Anemone Diadumene Lineata in the Baltic Sea. Mar. Biol. 163, 227. doi: 10.1007/s00227-016-2989-5
Podbielski I., Schmittmann L., Sanders T., Melzner F. (2022). Acclimation of Marine Invertebrate Osmolyte Systems to low-salinity: A Systematic Review & Meta-Analysis. Front. Mar. Sci.
Potts W. T. W. (1958). The Inorganic and Amino Acid Composition of Some Lamellibranch Muscles. J. Exp. Biol. 35, 749–764. doi: 10.1242/jeb.35.4.749
Quinn R. H., Pierce S. K. (1992). The Ionic Basis of the Hypo-Osmotic Depolarization in Neurons From the Opisthobranch Mollusc Elysia Chlorotica. J. Exp. Biol. 163, 169–186. doi: 10.1242/jeb.163.1.169
Rebelein A., Pörtner H.-O., Bock C. (2018). Untargeted Metabolic Profiling Reveals Distinct Patterns of Thermal Sensitivity in Two Related Notothenioids. Comp. Biochem. Physiol. A. Mol. Integr. Physiol. 217, 43–54. doi: 10.1016/j.cbpa.2017.12.012
Reusch T. B., Dierking J., Andersson H. C., Bonsdorff E., Carstensen J., Casini M., et al. (2018). The Baltic Sea as a Time Machine for the Future Coastal Ocean. Sci. Adv. 4, eaar8195. doi: 10.1126/sciadv.aar8195
Rivera-Ingraham G. A., Lignot J.-H. (2017). Osmoregulation, Bioenergetics and Oxidative Stress in Coastal Marine Invertebrates: Raising the Questions for Future Research. J. Exp. Biol. 220, 1749–1760. doi: 10.1242/jeb.135624
Rivera-Ingraham G. A., Nommick A., Blondeau-Bidet E., Ladurner P., Lignot J.-H. (2016). Salinity Stress From the Perspective of the Energy-Redox Axis: Lessons From a Marine Intertidal Flatworm. Redox Biol. 10, 53–64. doi: 10.1016/j.redox.2016.09.012
Robertson J. D. (1980). Osmotic Constituents of Some Echinoderm Muscles. Comp. Biochem. Physiol. A Physiol. 67, 535–543. doi: 10.1016/0300-9629(80)90238-8
Sabourin T. D., Stickle W. B. (1981). Effects of Salinity on Respiration and Nitrogen Excretion in Two Species of Echinoderms. Mar. Biol. 65, 91–99. doi: 10.1007/BF00397072
Sætra I. M., Burgerhout E., Johnsen H., James P. (2022). Comparative Morpho-Physiological Aspects and Transcriptomics of the Gonads From Wild Caught and Enhanced Green Sea Urchin (Strongylocentrotus Droebachiensis). Aquac. Fish. Fish. 2, 28–43. doi: 10.1002/aff2.27
Sanders T. (2018). Bioenergetik Der Kalzifizierung in Mytiliden Muscheln Entlang Des Salinitätsgradienten Der Ostsee.
Sanders T., Thomsen J., Müller J. D., Rehder G., Melzner F. (2021). Decoupling Salinity and Carbonate Chemistry: Low Calcium Ion Concentration Rather Than Salinity Limits Calcification in Baltic Sea Mussels. Biogeosciences 18, 2573–2590. doi: 10.5194/bg-18-2573-2021
Sarkissian I. V., Gomolinski E. (1976). Regulation of Malate Dehydrogenase From an Osmoconformer by Salt. Comp. Biochem. Physiol. Part B. Comp. Biochem. 53, 191–194. doi: 10.1016/0305-0491(76)90034-1
Schliess F., Häussinger D. (2005). The Cellular Hydration State: A Critical Determinant for Cell Death and Survival. Biol. Chem. 383, 577–583. doi: 10.1515/BC.2002.059
Schmidt M., Windisch H. S., Ludwichowski K.-U., Seegert S. L. L., Pörtner H.-O., Storch D., et al. (2017). Differences in Neurochemical Profiles of Two Gadid Species Under Ocean Warming and Acidification. Front. Zool. 14, 1–13. doi: 10.1186/s12983-017-0238-5
Schmittmann L. (2017). Local Adaptation of the Common Sea Star Asterias Rubens to Different Salinities.
Shick J. M. (1976)Ecological Physiology and Genetics of the Colonizing Actinian Haliplanella Luciae. In: Coelenterate Ecology and Behavior (Springer US). Available at: http://link.springer.com/chapter/ (Accessed January 28, 2015).
Simon S. E., Muller J., Dewhurst D. J. (1964). Ionic Partition in Holothuroidean Muscle. J. Cell. Comp. Physiol. 63, 77–84. doi: 10.1002/jcp.1030630109
Sokolova I. M., Bock C., Pörtner H.-O. (2000). Resistance to Freshwater Exposure in White Sea Littorina Spp. II: Acid-Base Regulation. J. Comp. Physiol. B. 170, 105–115. doi: 10.1007/s003600050265
Sokolova I. M., Frederich M., Bagwe R., Lannig G., Sukhotin A. A. (2012). Energy Homeostasis as an Integrative Tool for Assessing Limits of Environmental Stress Tolerance in Aquatic Invertebrates. Mar. Environ. Res. 79, 1–15. doi: 10.1016/j.marenvres.2012.04.003
Somero G. N., Lockwood B. L., Tomanek L. (2017). Biochemical Adaptation: Response to Environmental Challenges, From Life’s Origins to the Anthropocene (Sinauer Associates, Incorporated Publishers).
Somero G. N., Yancey P. H. (2011). “Osmolytes and Cell-Volume Regulation: Physiological and Evolutionary Principles,” in Comprehensive Physiology (American Cancer Society), 441–484. doi: 10.1002/cphy.cp140110
Souza M. M., Scemes E. (2000). Volume Changes in Cardiac Ventricles From Aplysia Brasiliana Upon Exposure to Hyposmotic Shock. Comp. Biochem. Physiol. -Mol. Integr. Physiol. 127, 99–111. doi: 10.1016/S1095-6433(00)00243-9
Stucchi-Zucchi A., Salomão ,. L. C. (1998). The Ionic Basis of Membrane Potentials and Adaptation to Hyposmotic Stress in Perna Perna, an Osmoconforming Mollusc. Comp. Biochem. Physiol. A. Mol. Integr. Physiol. 121, 143–148. doi: 10.1016/S1095-6433(98)10115-0
Stuckas H., Knöbel L., Schade H., Breusing C., Hinrichsen H.-H., Bartel M., et al. (2017). Combining Hydrodynamic Modelling With Genetics: Can Passive Larval Drift Shape the Genetic Structure of Baltic Mytilus Populations? Mol. Ecol. 26, 2765–2782. doi: 10.1111/mec.14075
Taylor P. M., Andrews E. B. (1988). Osmoregulation in the Intertidal Gastropod Littorina Littorea. J. Exp. Mar. Biol. Ecol. 122, 35–46. doi: 10.1016/0022-0981(88)90210-9
Taylor H. H., Ragg N. L. C. (2005). Extracellular Fluid Volume, Urine Filtration Rate and Haemolymph Mixing Time in the Abalone, Haliotis Iris Martyn: A Comparison of 51Cr-EDTA and 14C-Inulin as Extracellular Markers. Mar. Freshw. Res. 56, 1117–1126. doi: 10.1071/MF05122
Tedengren M., André C., Johannesson K., Kautsky N. (1990). Genotypic and Phenotypic Differences Between Baltic and North Sea Populations of Mytilus Edulis Evaluated Through Reciprocal Transplantations. III. Physiology. Mar. Ecol. Prog. Ser. 59, 221–227. doi: 10.3354/meps059221
Thompson R. J., Livingstone D. R., de Zwaan A. (1980). Physiological and Biochemical Aspects of the Valve Snap and Valve Closure Responses in the Giant Scallopplacopecten Magellanicus. J. Comp. Physiol. 137, 97–104. doi: 10.1007/BF00689207
Tomanek L. (2012). Environmental Proteomics of the Mussel Mytilus: Implications for Tolerance to Stress and Change in Limits of Biogeographic Ranges in Response to Climate Change. Integr. Comp. Biol. 52, 648–664. doi: 10.1093/icb/ics114
Turgeon K. W. (1973). Osmotic Adjustment in Two Population of Urosalpinx Cinerea (Say) (Muricidae, Prosobranchia, Gastropoda).
Väinölä R., Johannesson K. (2017). “Genetic Diversity and Evolution,” in Biological Oceanography of the Baltic Sea (Dordrecht: Springer), 233–253.
Verkman A. S. (2013). Diffusion in the Extracellular Space in Brain and Tumors. Phys. Biol. 10, 045003. doi: 10.1088/1478-3975/10/4/045003
Vuorinen I., Hänninen J., Rajasilta M., Laine P., Eklund J., Montesino-Pouzols F., et al. (2015). Scenario Simulations of Future Salinity and Ecological Consequences in the Baltic Sea and Adjacent North Sea Areas–Implications for Environmental Monitoring. Ecol. Indic. 50, 196–205. doi: 10.1016/j.ecolind.2014.10.019
Wargo M. J. (2013). Homeostasis and Catabolism of Choline and Glycine Betaine: Lessons From Pseudomonas Aeruginosa. Appl. Environ. Microbiol. 79, 2112–2120. doi: 10.1128/AEM.03565-12
Willmer P. G. (1978). Volume Regulation and Solute Balance in the Nervous Tissue of an Osmoconforming Bivalve (Mytilus Edulis). J. Exp. Biol. 77, 157–179. doi: 10.1242/jeb.77.1.157
Yancey P. H. (2005). Organic Osmolytes as Compatible, Metabolic and Counteracting Cytoprotectants in High Osmolarity and Other Stresses. J. Exp. Biol. 208, 2819–2830. doi: 10.1242/jeb.01730
Yancey P. H., Heppenstall M., Ly S., Andrell R. M., Gates R. D., Carter V. L., et al. (2010). Betaines and Dimethylsulfoniopropionate as Major Osmolytes in Cnidaria With Endosymbiotic Dinoflagellates. Physiol. Biochem. Zool. Ecol. Evol. Approach. 83, 167–173. doi: 10.1086/644625
Keywords: salinity stress, osmolytes, cellular volume regulation, invertebrates, osmoconformer, climate change, cellular osmoregulation
Citation: Podbielski I, Hiebenthal C, Hajati M-C, Bock C, Bleich M and Melzner F (2022) Capacity for Cellular Osmoregulation Defines Critical Salinity of Marine Invertebrates at Low Salinity. Front. Mar. Sci. 9:898364. doi: 10.3389/fmars.2022.898364
Received: 17 March 2022; Accepted: 19 May 2022;
Published: 14 June 2022.
Edited by:
Youji Wang, Shanghai Ocean University, ChinaReviewed by:
Carolina Arruda Freire, Federal University of Paraná, BrazilPaul Yancey, Whitman College, United States
Copyright © 2022 Podbielski, Hiebenthal, Hajati, Bock, Bleich and Melzner. This is an open-access article distributed under the terms of the Creative Commons Attribution License (CC BY). The use, distribution or reproduction in other forums is permitted, provided the original author(s) and the copyright owner(s) are credited and that the original publication in this journal is cited, in accordance with accepted academic practice. No use, distribution or reproduction is permitted which does not comply with these terms.
*Correspondence: Imke Podbielski, ipodbielski@geomar.de