Machine learning applied to big data from marine cabled observatories: A case study of sablefish monitoring in the NE Pacific
 Federico Bonofiglio1
  Fabio C. De Leo2,3
  Connor Yee3
  Damianos Chatzievangelou4
  Jacopo Aguzzi4,5
  Simone Marini1,5*
- 1Institute of Marine Sciences (ISMAR), National Research Council of Italy, Lerici, Italy
- 2Ocean Networks Canada, University of Victoria, Victoria, BC, Canada
- 3Department of Biology, University of Victoria, Victoria, BC, Canada
- 4Functioning and Vulnerability of Marine Ecosystems Group, Department of Renewable Marine Resources, Instituto de Ciencias del Mar - Consejo Superior de Investigaciones Científicas (ICM-CSIC), Barcelona, Spain
- 5Stazione Zoologica Anton Dohrn (SZN), Naples, Italy
Ocean observatories collect large volumes of video data, with some data archives now spanning well over a few decades, and bringing the challenges of analytical capacity beyond conventional processing tools. The analysis of such vast and complex datasets can only be achieved with appropriate machine learning and Artificial Intelligence (AI) tools. The implementation of AI monitoring programs for animal tracking and classification becomes necessary in the particular case of deep-sea cabled observatories, as those operated by Ocean Networks Canada (ONC), where Petabytes of data are now collected each and every year since their installation. Here, we present a machine-learning and computer vision automated pipeline to detect and count sablefish (Anoplopoma fimbria), a key commercially exploited species in the N-NE Pacific. We used 651 hours of video footage obtained from three long-term monitoring sites in the NEPTUNE cabled observatory, in Barkley Canyon, on the nearby slope, and at depths ranging from 420 to 985 m. Our proposed AI sablefish detection and classification pipeline was tested and validated for an initial 4.5 month period (Sep 18 2019-Jan 2 2020), and was a first step towards validation for future processing of the now decade-long video archives from Barkley Canyon. For the validation period, we trained a YOLO neural network on 2917 manually annotated frames containing sablefish images to obtain an automatic detector with a 92% Average Precision (AP) on 730 test images, and a 5-fold cross-validation AP of 93% (± 3.7%). We then ran the detector on all video material (i.e., 651 hours from a 4.5 month period), to automatically detect and annotate sablefish. We finally applied a tracking algorithm on detection results, to approximate counts of individual fishes moving on scene and obtain a time series of proxy sablefish abundance. Those proxy abundance estimates are among the first to be made using such a large volume of video data from deep-sea settings. We discuss our AI results for application on a decade-long video monitoring program, and particularly with potential for complementing fisheries management practices of a commercially important species.
Introduction
Ocean exploitation at industrial levels increasingly threatened the ocean health (Danovaro et al., 2017; Rayner et al., 2019; Kildow, 2022), especially regarding fisheries (Kearney and Hilborn, 2022; Pentz and Klenk, 2022; Pitcher et al., 2022) and underwater mining activities (Levin et al., 2020; Filho et al., 2021). Fisheries in particular, although not a global issue per se (rather more efficiently treated on a local to regional level; Kearney and Hilborn, 2022), can contribute to a global reduction of biomass if not correctly managed (Palomares et al., 2020). Efficient management of the marine environment is promoted through international initiatives such as the UN’s Decade of Ocean Science for Sustainable Development1 and the EU’s Marine Strategy Framework Directive (MSFD, 2008), where intelligent monitoring of marine resources is expected to play a central role (Beyan and Browman, 2020; Malde et al., 2020; Rountree et al., 2020; Aguzzi et al., 2021).
Estimates of species composition and relative abundance of a local community are influenced by the temporal patterns in the behavioral rhythms of fauna at diel (i.e., 24-h) and seasonal scales (Aguzzi and Company, 2010; Aguzzi et al., 2011b; Aguzzi et al., 2015b). This raises the need for high-frequency, long-term, datasets of the stock levels and demographic indices of fishery targets, whose generation is difficult with the use of expensive vessel-based sampling methodologies (Naylor, 2010). Moreover, in zones such as Marine Protected Areas (MPAs), invasive sampling of key species is often prohibited (Vigo et al., 2021).
Bottom trawling is to date the most reliable stock assessment method for demersal resources (Ovando et al., 2022) but it’s temporally intensive application would have a high environmental impact (e.g., Hiddink et al., 2006; Jamieson et al., 2013; Flannery and Przeslawski, 2015; Colloca et al., 2017; Costello et al., 2017; Sciberras et al., 2018; Rousseau et al., 2019; De Mendonça and Metaxas, 2021). Imagery-based sampling methods are still not as widespread (Bicknell et al., 2016), although they are successfully applied for gathering species composition and abundance data, for instance along usage of Baited Remote Underwater Video Stations (BRUVs), stereo-BRUVs (with stereo cameras for accurate fish sizing), and more recently Deep-BRUVS (for deep-water deployments; e.g., Langlois et al., 2018; Withmarsh et al., 2017). Nowadays, such fixed-point cabled observatory stations can collect detailed biological and environmental data, allowing for species abundance estimates in response to environmental changes (Aguzzi and Company, 2010; Aguzzi et al., 2012; Aguzzi et al., 2015b; Chatzievangelou et al., 2016; Doya et al., 2017; Chatzievangelou et al., 2020).
In order to fully unlock the potential of such infrastructures, appropriate analytical tools are needed to automatically and quickly process vast amounts of generated data (Schoening et al., 2012; Osterloff et al., 2016; Aguzzi et al., 2019; Osterloff et al., 2020; Zuazo et al., 2020). Artificial Intelligence (AI) procedures can provide important fishery-independent data (Marini et al., 2018a; Marini et al., 2018b; Malde et al., 2020; Lopez-Vazquez et al., 2020; Aguzzi et al., 2021; Harris et al., 2021) collected by infrastructures capable of supporting video data acquisition and processing (Jahanbakht et al., 2021).
Sablefish (Anoplopoma fimbria) is a demersal fish species of the Pacific coast of North America (depth range 300-3000 m; Orlov, 2003), which supports important commercial fisheries (Warpinski et al., 2016; Riera et al., 2020). Sablefish populations include resident and migrating individuals performing both horizontal and vertical movements (Jacobson et al., 2001; Maloney and Sigler, 2008; Morita et al., 2012; Hanselman et al., 2015; Goetz et al., 2018; Sigler and Echave, 2019) across large geographic ranges (Chapman et al., 2012). In British Columbia (BC), sablefish stocks have shown indication of decline, with a recent observed resurgence attributed to some years of stronger recruitment (Workman et al., 2019). Along the BC coast, sablefish appear to move horizontally, back and forth along the canyon axis on a daily basis, in search of prey (Doya et al., 2014; Chatzievangelou et al., 2016). Locally, seasonal trends in abundance have been also documented by the high-frequency observations provided by the North-East Pacific Undersea Networked Experiments (NEPTUNE) observatory’s seafloor video cameras (Doya et al., 2017; Chauvet et al., 2018).
There are available tools to automatically process large quantities of videos for extracting biological data. A number of methodologies have been proposed for fish species recognition and classification over the last two decades, but the great variability of either species morphologies, or the conditions in which the videos are captured, is still a major challenge for automated processing (e.g., Matabos et al., 2017; Marini et al., 2018a; Marini et al., 2018b; Ottaviani et al., 2022). These automated approaches span a wide range of topics within the AI and computer vision based literature (e.g., Hsiao et al., 2014; Nishida et al., 2014; Wong et al., 2015; Chuang et al., 2016; Tills et al., 2018; Harrison et al., 2021; Yang et al., 2021; Liu et al., 2021; Sokolova et al., 2021a; Sokolova et al., 2021b). A preliminary attempt to automatically detect sablefish in Barkley Canyon was carried out by Fier et al. (2014) using a supervised image segmentation approach, whose detection efficiency was later compared with manual annotations performed by biologist experts, students and the general public using an online citizen science platform (DigitalFishers, http://dmas.uvic.ca/DigitalFishers), (Matabos et al., 2017). However, those initial attempts highlighted that the fish detection algorithms were still rudimentary, being significantly outperformed by trained human eyes, and therefore calling for significant improvement. Nevertheless, the recent developments based on Deep Learning (DL) Convolutional Neural Network (CNN) processing methods demonstrated high accuracy performance and reliability in completing fish recognition and classification tasks (Konovalov et al., 2019; Lopez-Vazquez et al., 2020; Yang et al., 2021; Lopez-Marcano et al., 2021; Zhao et al., 2021; Ottaviani et al., 2022).
DL has recently emerged as an innovative field in AI for language processing, computer vision, and the alike (Goodfellow et al., 2016; Han et al., 2020; Langenkämper et al., 2020; Malde et al., 2020; Ottaviani et al., 2022). CNNs are successfully used in computer vision because, thanks to their interconnected structure, they can automatically capture many hidden features of the input data, generating information on a number of valuable image features (shape, texture, and so on) with little manual intervention (Simonyan and Zisserman, 2015; LeCun et al., 2015; Girshick, 2015; Ren et al., 2015). In general terms, a CNN is a complex statistical model of some outcome (here images) which can be graphically represented as interconnected nodes, stacked into several layers. Each node is assigned one or more parameters to be optimized through a training phase. Since the whole network accounts for many nodes and often millions of parameters, DL methods can be computationally intensive (LeCun et al., 2015). Although very useful, such techniques alone are yet not sufficient to fulfill all scopes of automated monitoring programs centered on megafauna quantification, and still require some customization effort.
In the present study, we combine existing DL approaches with object tracking techniques, in order to produce reliable counts of sablefish in deep-sea settings of slope and submarine canyon habitats of the NE Pacific within variable environmental conditions and subjects in movement. Making use of the NEPTUNE cabled observatory, an abundance time-series extracted from video data was generated through an AI-based pipeline proposed for the automatic detection, classification, and counting of sablefish. In general, the proposed approach is aimed at supporting the stock-related assessment metrics and monitoring programs of deep sea commercial species with ancillary data, according to the increasing trend of networks of fixed point observatories (Painting et al., 2020; Rountree et al., 2020; Rountree et al., 2020; Aguzzi et al., 2021).
2. Methods
2.1 Cabled observatory data
The NEPTUNE cabled observatory operated by Ocean Networks Canada (ONC) presently represents one of the best technologically-equipped networks to undertake fish communities monitoring along the Pacific coast of North America (Aguzzi et al., 2020a). One of its nodes, located in Barkley Canyon2, consists of several cabled instrumented platforms that span a maximum linear distance of ~15 km, and a depth range of 400 to 985 m, overlapping with the habitat range of the greatest sablefish abundance (Goetz et al., 2018; Kimura et al., 2018; Aguzzi et al., 2020a). A total of 5 fixed instrumented platforms and a mobile crawler (with a 70-m radius range) are equipped with a suite of oceanographic and biogeochemical sensors in addition to video cameras mounted on pan and tilt units (Figure 1).
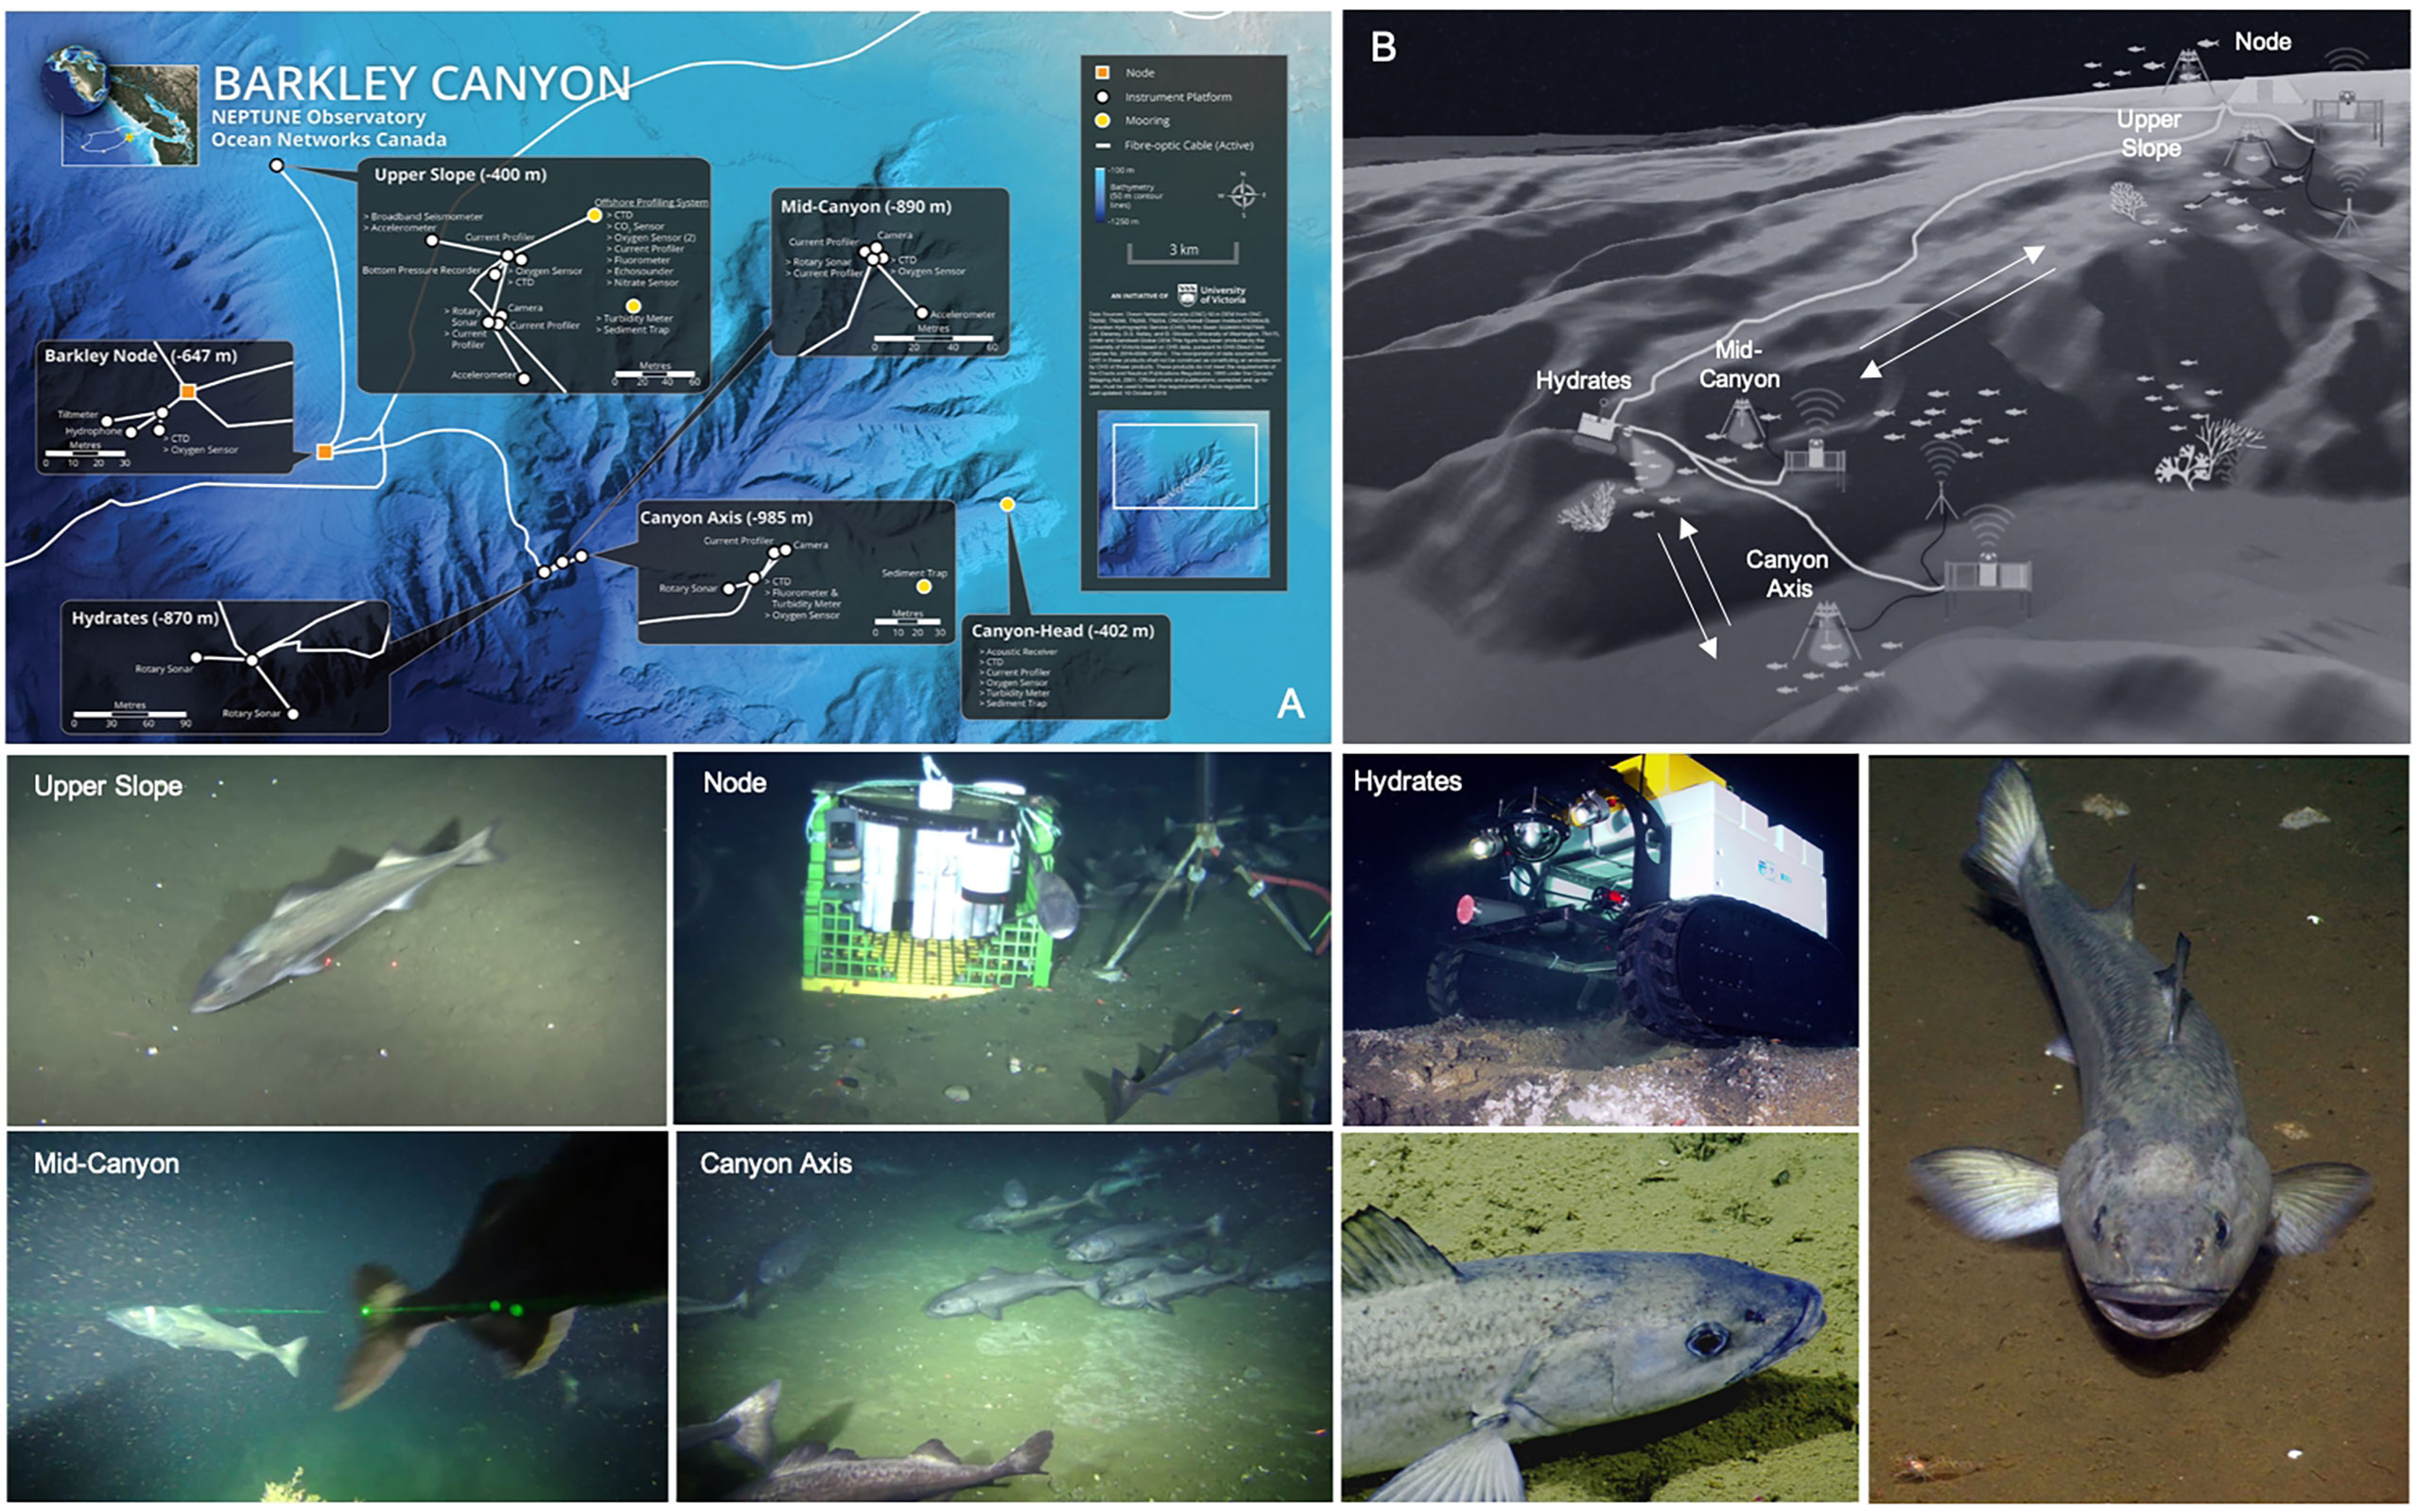
Figure 1 Map (A), schematic (B) and photographs depicting the study area in Barkley Canyon, NE Pacific, and the NEPTUNE cabled observatory infrastructure. Video imagery used in this study was limited to 3 out of 5 long-term monitoring sites, Upper Slope (420 m), Canyon Axis (985 m) and Node (620 m). Screen grabs (labeled Upper Slope, Node and Axis) represent the variable video field of view conditions of the three locations used in our study.
The study took place at three sites from the Barkley Canyon, all equipped with a video-camera (Table 1 and Figure 1A). All the high-definition cameras recorded at 1080p horizontal line pixel resolution and at ~23 frames per second (fps). The cameras were mounted on galvanized steel tripods and attached to ROS-485 Pan and Tilt units, with a pair of dimmable ROS LED lights (100 W, > 406 lm), which provided illumination during video recording. Two parallel laser-beams, 10 cm apart, provided scaling of the seafloor. All three cameras had specific and optimal field of views adjusted after deployment, which remained unaltered throughout the study period (Table 1). Due to variable tilt angles and tripods, each with slightly different heights above the seabed, the imaged seabed area varied among the cameras, ranging 5-10 m2 (Table 1). The three cameras synchronously recorded 5-minute videos at each UTC hour. The synchronization in image acquisition was of particular relevance to track fish shoals and spatial displacements of benthic megafauna within a spatially-coherent camera network along the continental margin areas (Aguzzi et al., 2011a; Aguzzi et al., 2020b).
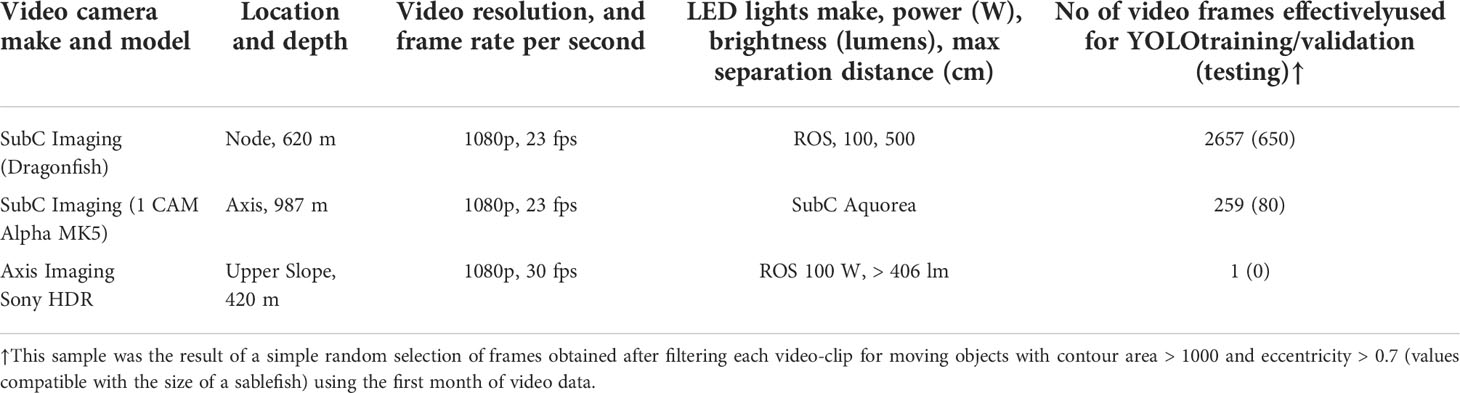
Table 1 Camera specifications and deployment details according to the locations shown in Figure 1.
2.2 Data analysis work-flow, preparation of the training set
Archived video data were accessed using the ONC repository3 and Application Programming Interface (API) using a Python client library4 targeting the study period, corresponding to September 18th 2019 to February 3rd 2020 (136 days). Next, in order to train a classification model for recognizing sablefish individuals in the videos, we generated a ground-truth dataset consisting of a number of video frames selected from the whole video material and containing examples of sablefish individuals. Figure 2 schematically describes the workflow required for the data analysis up to the endpoint production (estimated fish count time series).
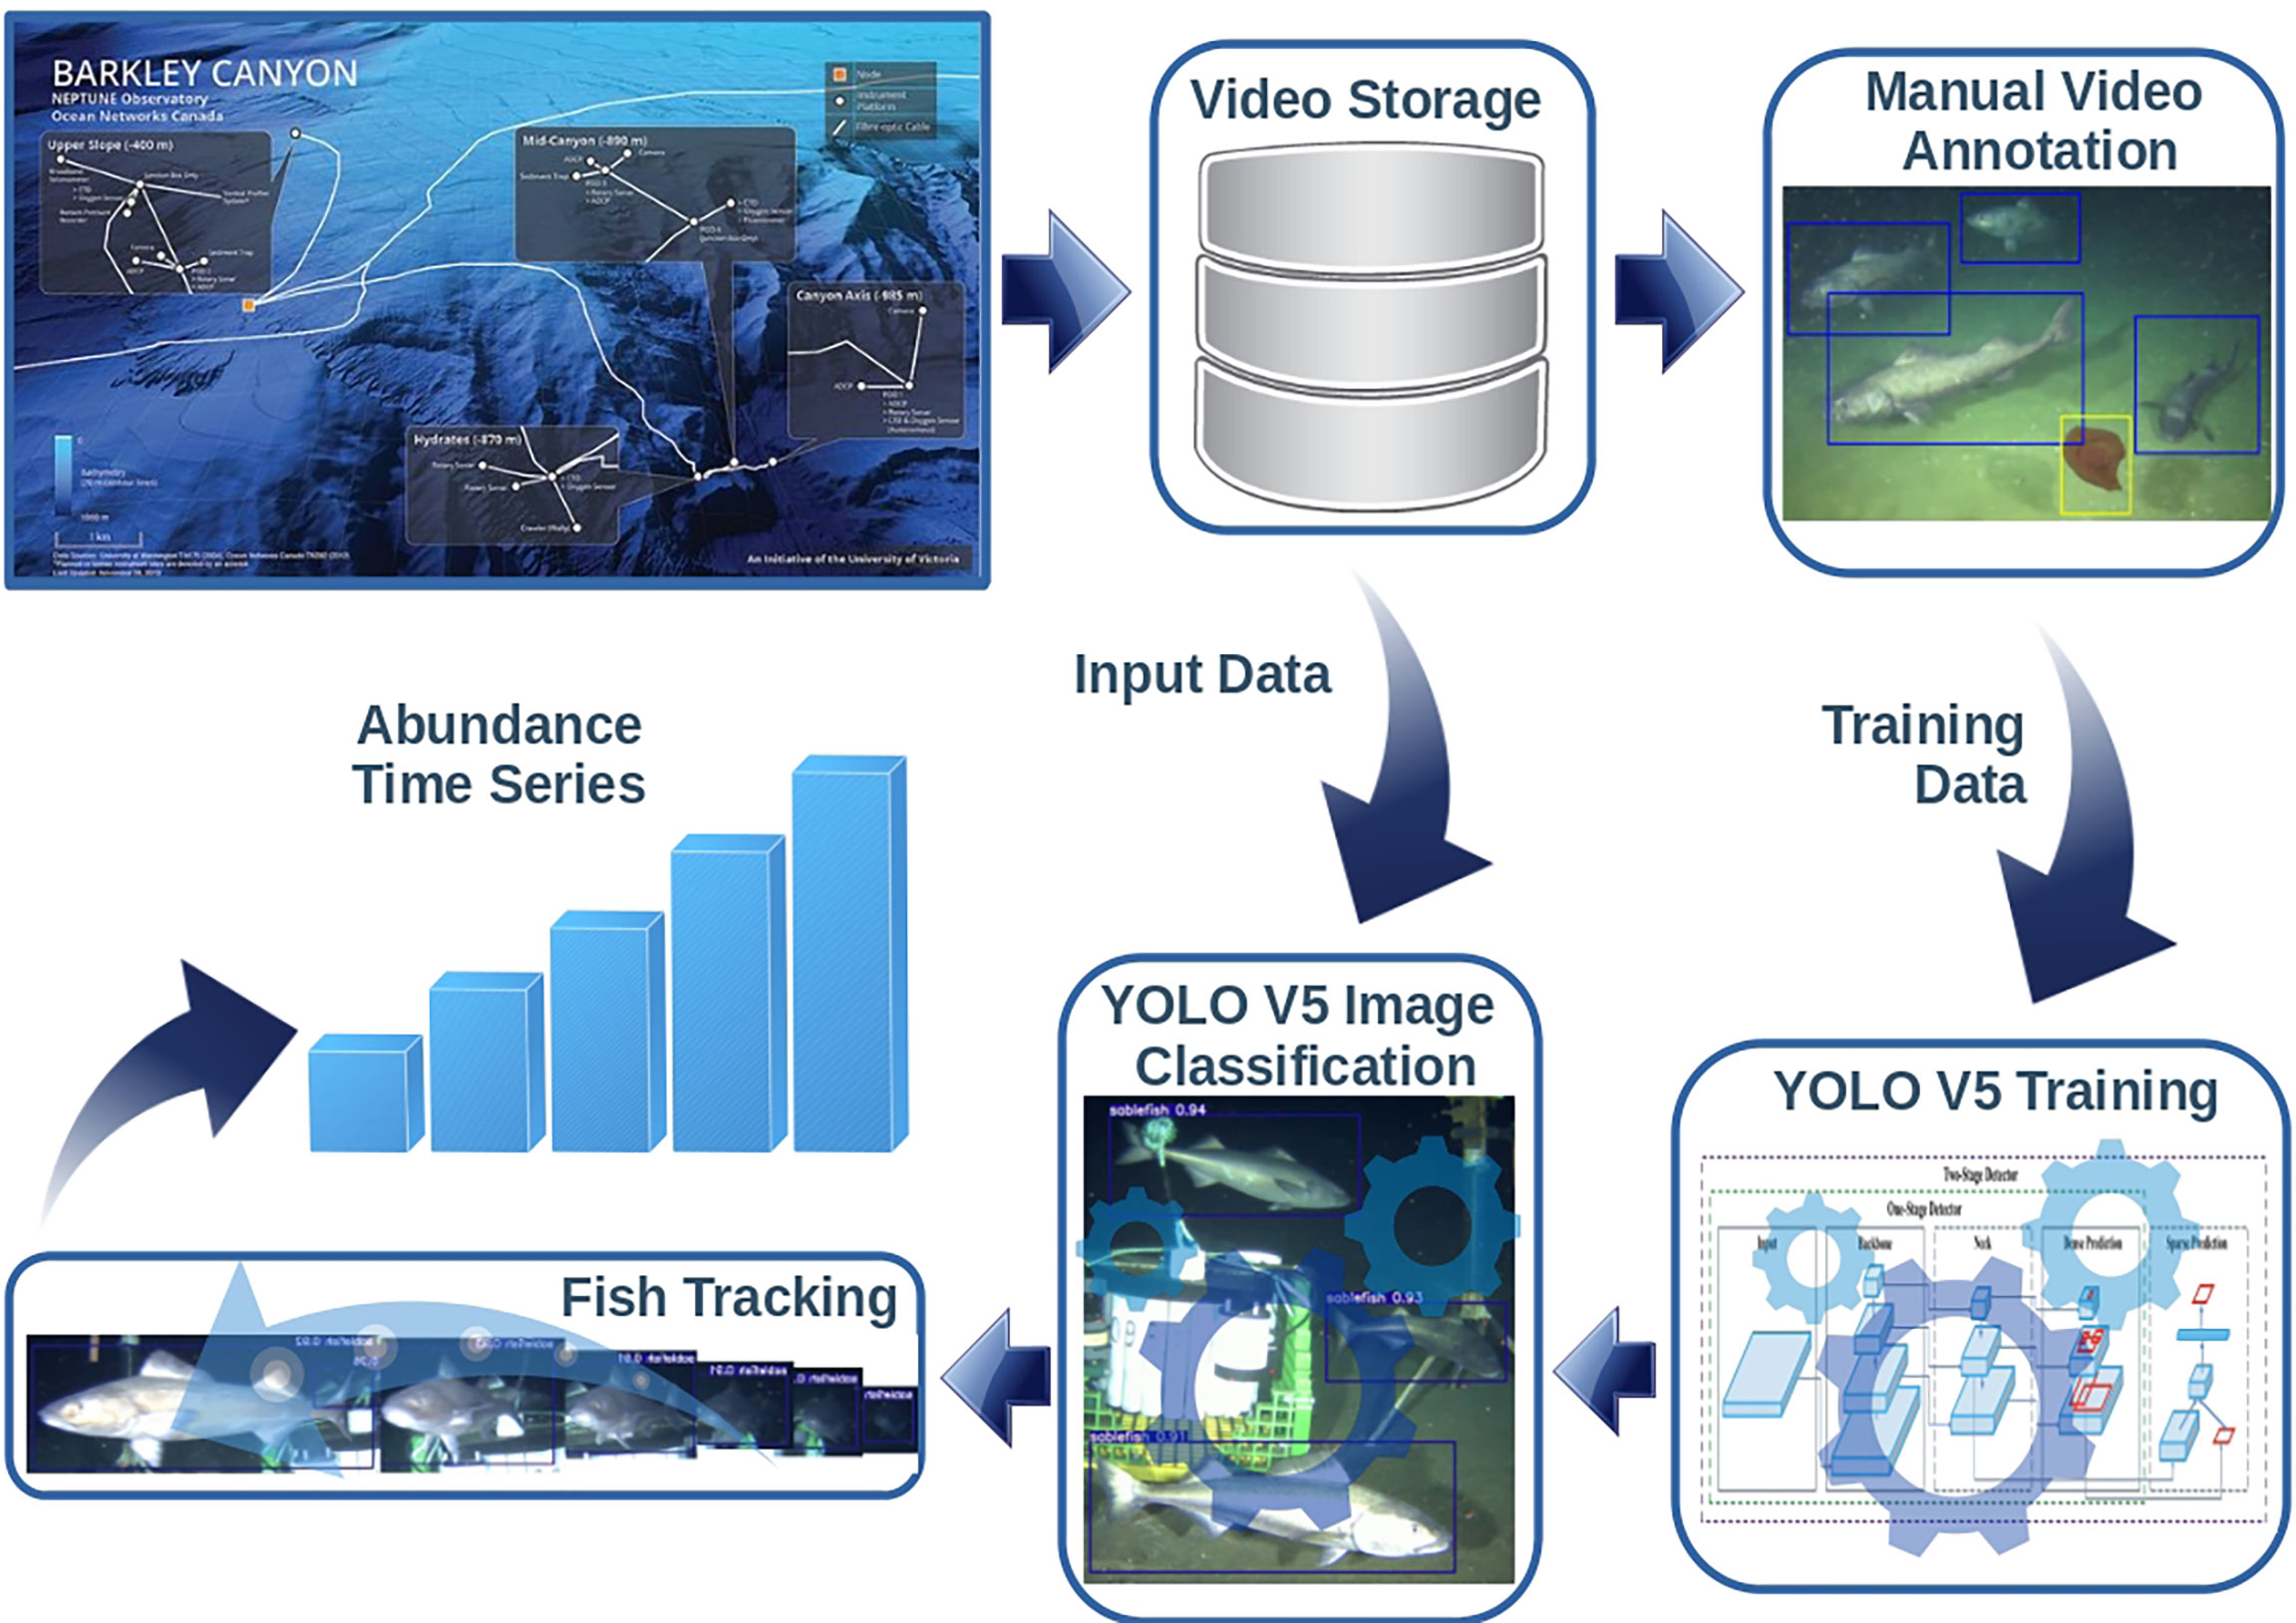
Figure 2 Schematic workflow of the video imagery data analysis. Frames from the acquired video are selected, manually annotated and used for the training/validation of the sablefish classifier; Then the trained classifier is applied to the footage not used in the training/validation phase producing the bounding boxes of the detected relevant subjects; then the tracking algorithm is used to track the relevant subject moving within the field of view with the aim of producing reliable counts of the framed individuals.
The ground-truth data set was prepared by two annotators on two different groups of videos. One annotator manually searched and selected video material which resulted in annotation of 3189 video frames, mostly from the Barkley Node location. Another annotator additionally annotated 458 video frames, resulting from a simple random selection of a pool of frames evenly distributed along all study sites. The total ground-truth dataset corresponds to 3647 frames subdivided between training and validation as described in Table 1. Moreover a 5-Fold Cross-Validation within the training/validation part of the dataset has been used for the evaluation of the classification performance, as described in the Result section.
Annotations were made by drawing a bounding box around each sablefish individual in the image, and by specifying the class (i.e., species) of that individual (i.e., only one in the present application). Hence, the ground-truth data ready for computer vision training consisted of a set of paired images and text files containing bounding box coordinates and class labels for each individual. All annotations were made using the labeling software labellmg5.
2.3 Classification model
In recognizing the rapidly evolving landscape in DL computer vision methods, and in critically evaluating the most recent approaches, we focused on models readily available to the average user with relatively limited computation resources. The “You Only Look Once” (YOLO) DL neural network (Redmon et al., 2016) was ultimately selected, after recently drawing attention for its good performances and relatively light computational burden (Aziz et al., 2020). Relative to other successful CNNs, YOLO does manage to process the data in one step, by introducing yet more automation in the detection and classification process (Koirala et al., 2019),. Although many versions of the YOLO architecture exist (e.g. YOLOv36 and YOLOv77), experiments have been performed with the YOLOv5 software8.
2.4 Transfer learning
The classification task involves the recognition of a relevant subject with respect to the image background. To this end, the required, expensive, training step can be simplified by using a transfer learning approach, where a classifier is trained on a general purpose dataset and then specialized on a dataset defined for the specific application context (Tan et al., 2018). Accordingly, we pre-trained the network on the Common Objects in COntext dataset (COCO9), which is a popular general purpose dataset containing annotated images of animals (without fishes), persons and various objects. The pre-train phase was aimed at lending the network a baseline discrimination for a variety of image features (e.g., shapes, textures), as opposed to training the network on the sablefish dataset from scratch which is time consuming and needs a huge amount of ground-truth examples.
Only in a second step, we used the dataset obtained from the manual annotations for specializing the pre-trained classifier on sablefish-related features the acquisition conditions varying across the ONC sites (i.e, seafloor illumination, texture, color, etc.) and the different species present in the images e.g. Pink Urchin (Strongylocentrotus fragilis), Tanner crab (Chionoecetes tanneri), hagfish and gastropods species). This additional training resulted in a classifier specifically calibrated for sablefish detection. The classifier was fine-tuned via further training on an extended dataset including outputs by both manual annotators, which increased representativeness of the overall study area conditions.
For the performance assessment, we measured the Average Precision (AP) at 50% overlap between the ground-truth and the inferred bounding boxes. AP is the area under the curve resulting from plotting the classification Recall and Precision for sablefish (Fawcett, 2006). Recall is the number of detected True Positives (TP) over all ground truth annotations,
where FN is all False Negatives. Recall is also known as sensitivity. Precision is all TP over all detections:
where FP is all False Positives. Precision is also known as a positive predictive value.
We make the weights obtained by this training procedure and used for detection and classification analyses also freely available for reproducibility of our results (see next Section below). Training was performed on Google Colab10.
2.5 Automatic detection and classification analysis
In this final step, we applied the trained YOLO model on the stored video data, to produce automatic detection and classification of all sablefish appearing on scene during the 4.5 month period and at the three study locations. The output for one single video clip was an automatically produced annotation text file, for each video frame, including bounding box coordinates, object class, and detection confidence for each detected object in the frame (ranging 0-1). To speed up the video footage analysis, without losing relevant information, we kept only 50% of the original frame size and only every 20th frame in the four minutes video clip.
While the YOLO model is necessary to detect and classify every sablefish appearing in each video frame, this alone cannot provide estimates of the number of unique individuals appearing in the video clip. Therefore, we needed to extend the computer vision pipeline to add a tracking step, aimed at producing an estimate of the number of individual subjects appearing in the video. Such a step reduces the multiple counts of individuals moving along the field of view. (. To this end, we used the bounding box coordinates automatically generated by the YOLO for tracking each individual fish along the time sequence of video frames.
Although many approaches exist for object tracking (Fiaz et al., 2019; Du and Wang, 2022) we decided to implement a simple tracking algorithm based on the Euclidean distance among the bounding boxes of the individuals detected by the classification algorithm (e.g. Islam, 2020; Azimjonov and Özmen, 2022). We related two fishes between two consecutive time frames by taking the corresponding box coordinates (centroids) and by computing their Euclidean distance. We repeated this for any pair of centroids, and the pair with the smallest Euclidean distance resulted in attributing one track to the same individual moving in the field of view. Therefore, the estimated total number of tracks in one video is an approximation of proxy abundance recorded by the video. One fish was tracked until it disappeared from the scene for a maximum number (“m”) of consecutive empty frames, which was a key parameter of this algorithm. This method might cause fishes to swap tracks if centroids of two different fishes come too close and cross. However, this alone does not critically alter the estimation of the total number of individuals in one video, and therefore is an acceptable drawback of this tracking method.
2.6 Machine learning output assessment against manual visual counts
We plotted the sablefish hourly count time series calculated from the AI pipeline output over the entire 4.5 month monitoring period at each observatory platform/site. The sablefish count estimates should be considered as a proxy of fish abundance measurements, because observations arise from a non-probability sampling scheme and because of intrinsic approximation errors of the detection pipeline. We computed summary statistics such as mean sablefish count over the study period and linear time trend.
We validated the machine-learning results against independent visual counts manually obtained via the widespread MaxN estimation method (Priede et al., 1994; Harvey et al., 2007; Yeh and Drazen, 2009; Schobernd et al., 2014) on 30-second video clips extracted from the original 5-min video files, and starting at elapsed 1 min 45 sec into each video to ensure standardized effects of artificial lighting on the sablefish startling behavior and attraction in the field of view (Doya et al., 2014; De Leo et al., 2018). MaxN consists of obtaining the maximum number of fish (peak abundance) observed in any single frame during the viewing interval (here 30 sec.). It is also a proxy for abundance, because it typically underestimates its true value. Therefore, we are only interested in comparing the trend between the AI-based and the manual counts time-series, as opposed to their absolute value. For Barkley Axis and Upper Slope, only 30 days worth of video clips were used for the manual count. We computed the Pearson correlation between the machine-learning and the manual time-series results, by matching them by date.
All the scripts needed for downloading and processing the ONC data are freely available on GitHub (Bonofilgio, 2021).
3. Results
3.1 Training and validation
The volume of data analyzed consisted of 9772 video clips (Node = 3313; Axis = 3154; Slope = 3305) over the 4.5 month period, for a total of ~650 hours of video recording and ~1 TB of data. Among all the available video-clips 3647 were used for training/validation and test and the remaining 6125 video-clips were used for comparison between automated and manual counts. At the end of the detection pipeline, we had a sablefish count time series of ~600 KB, which stresses the stark data reduction needed to obtain the desired end information. The manual annotation produced a total of 9205 tagged unique sablefish individuals distributed in 3647 image-frames, used for training (n = 2917) and testing (n = 730) the YOLO (Table 1).
The obtained classifier resulted in a 92% AP on test data and a 93% (sd: 3.7%) 5-fold cross-validated AP (mean precision: 99%, sd: 0.4%; mean recall: 52%, sd: 1.2%)11. We deemed these results as good and kept this model as our final detector and classifier.
3.2 Detection and tracking results
Reducing video size and frames number prior to automatic detection, resulted in decreasing data size by almost 14 times, which also sped up detection computations. In particular, only one frame every 20 was analyzed, reducing the processing time of a whole video clip from about 20 minutes to 3 minutes, on an 8 CPU Intel(R) Core(TM) i7-4800MQ CPU @ 2.70GHz computer.
Although the problem of uncertainty and confidence within the object classification context is quite complex and still debated (Mena et al., 2022), we run the tracking algorithm on all detection results, filtering only detections with the confidence value returned by YOLO greater or equal than 80% for the Node and Axis sites and 95% for Slope. The larger confidence value used for the Slope was needed to better discriminate the very few individuals of sablefish occurring in this site against other fauna (e.g., dark blotched rockfish), present in much greater abundance here compared to the other two sites. In total, this processing step produced a count time series of about 600 KB of size only. Examples of sablefish detections from two consecutive frames of video clips of Barkley Axis and Node are shown in Figure 3. The labeled boxes are the result of the automatic YOLO detection and classification. Note the classification confidence metric displayed in each sablefish bounding box (ranging from 0-1), which we use as a filter to generate more conservative estimates when needed. Green numbered points over each individual are the result of the tracking algorithm. Using the examples in Figure 3, the procedure counted 105 and 32 sablefish individuals at the end of each respective video clip for Axis and Node. These two entire video clips are available as Supplementary Material (Supplementary Videos 1 and 2). For Barkley Axis, where the video camera had multiple pan and tilt field of view positions, the YOLO and the tracking algorithm had similar efficiency under variable artificial illumination conditions as well as with variable amounts of seafloor present in the image background (Figure 4).
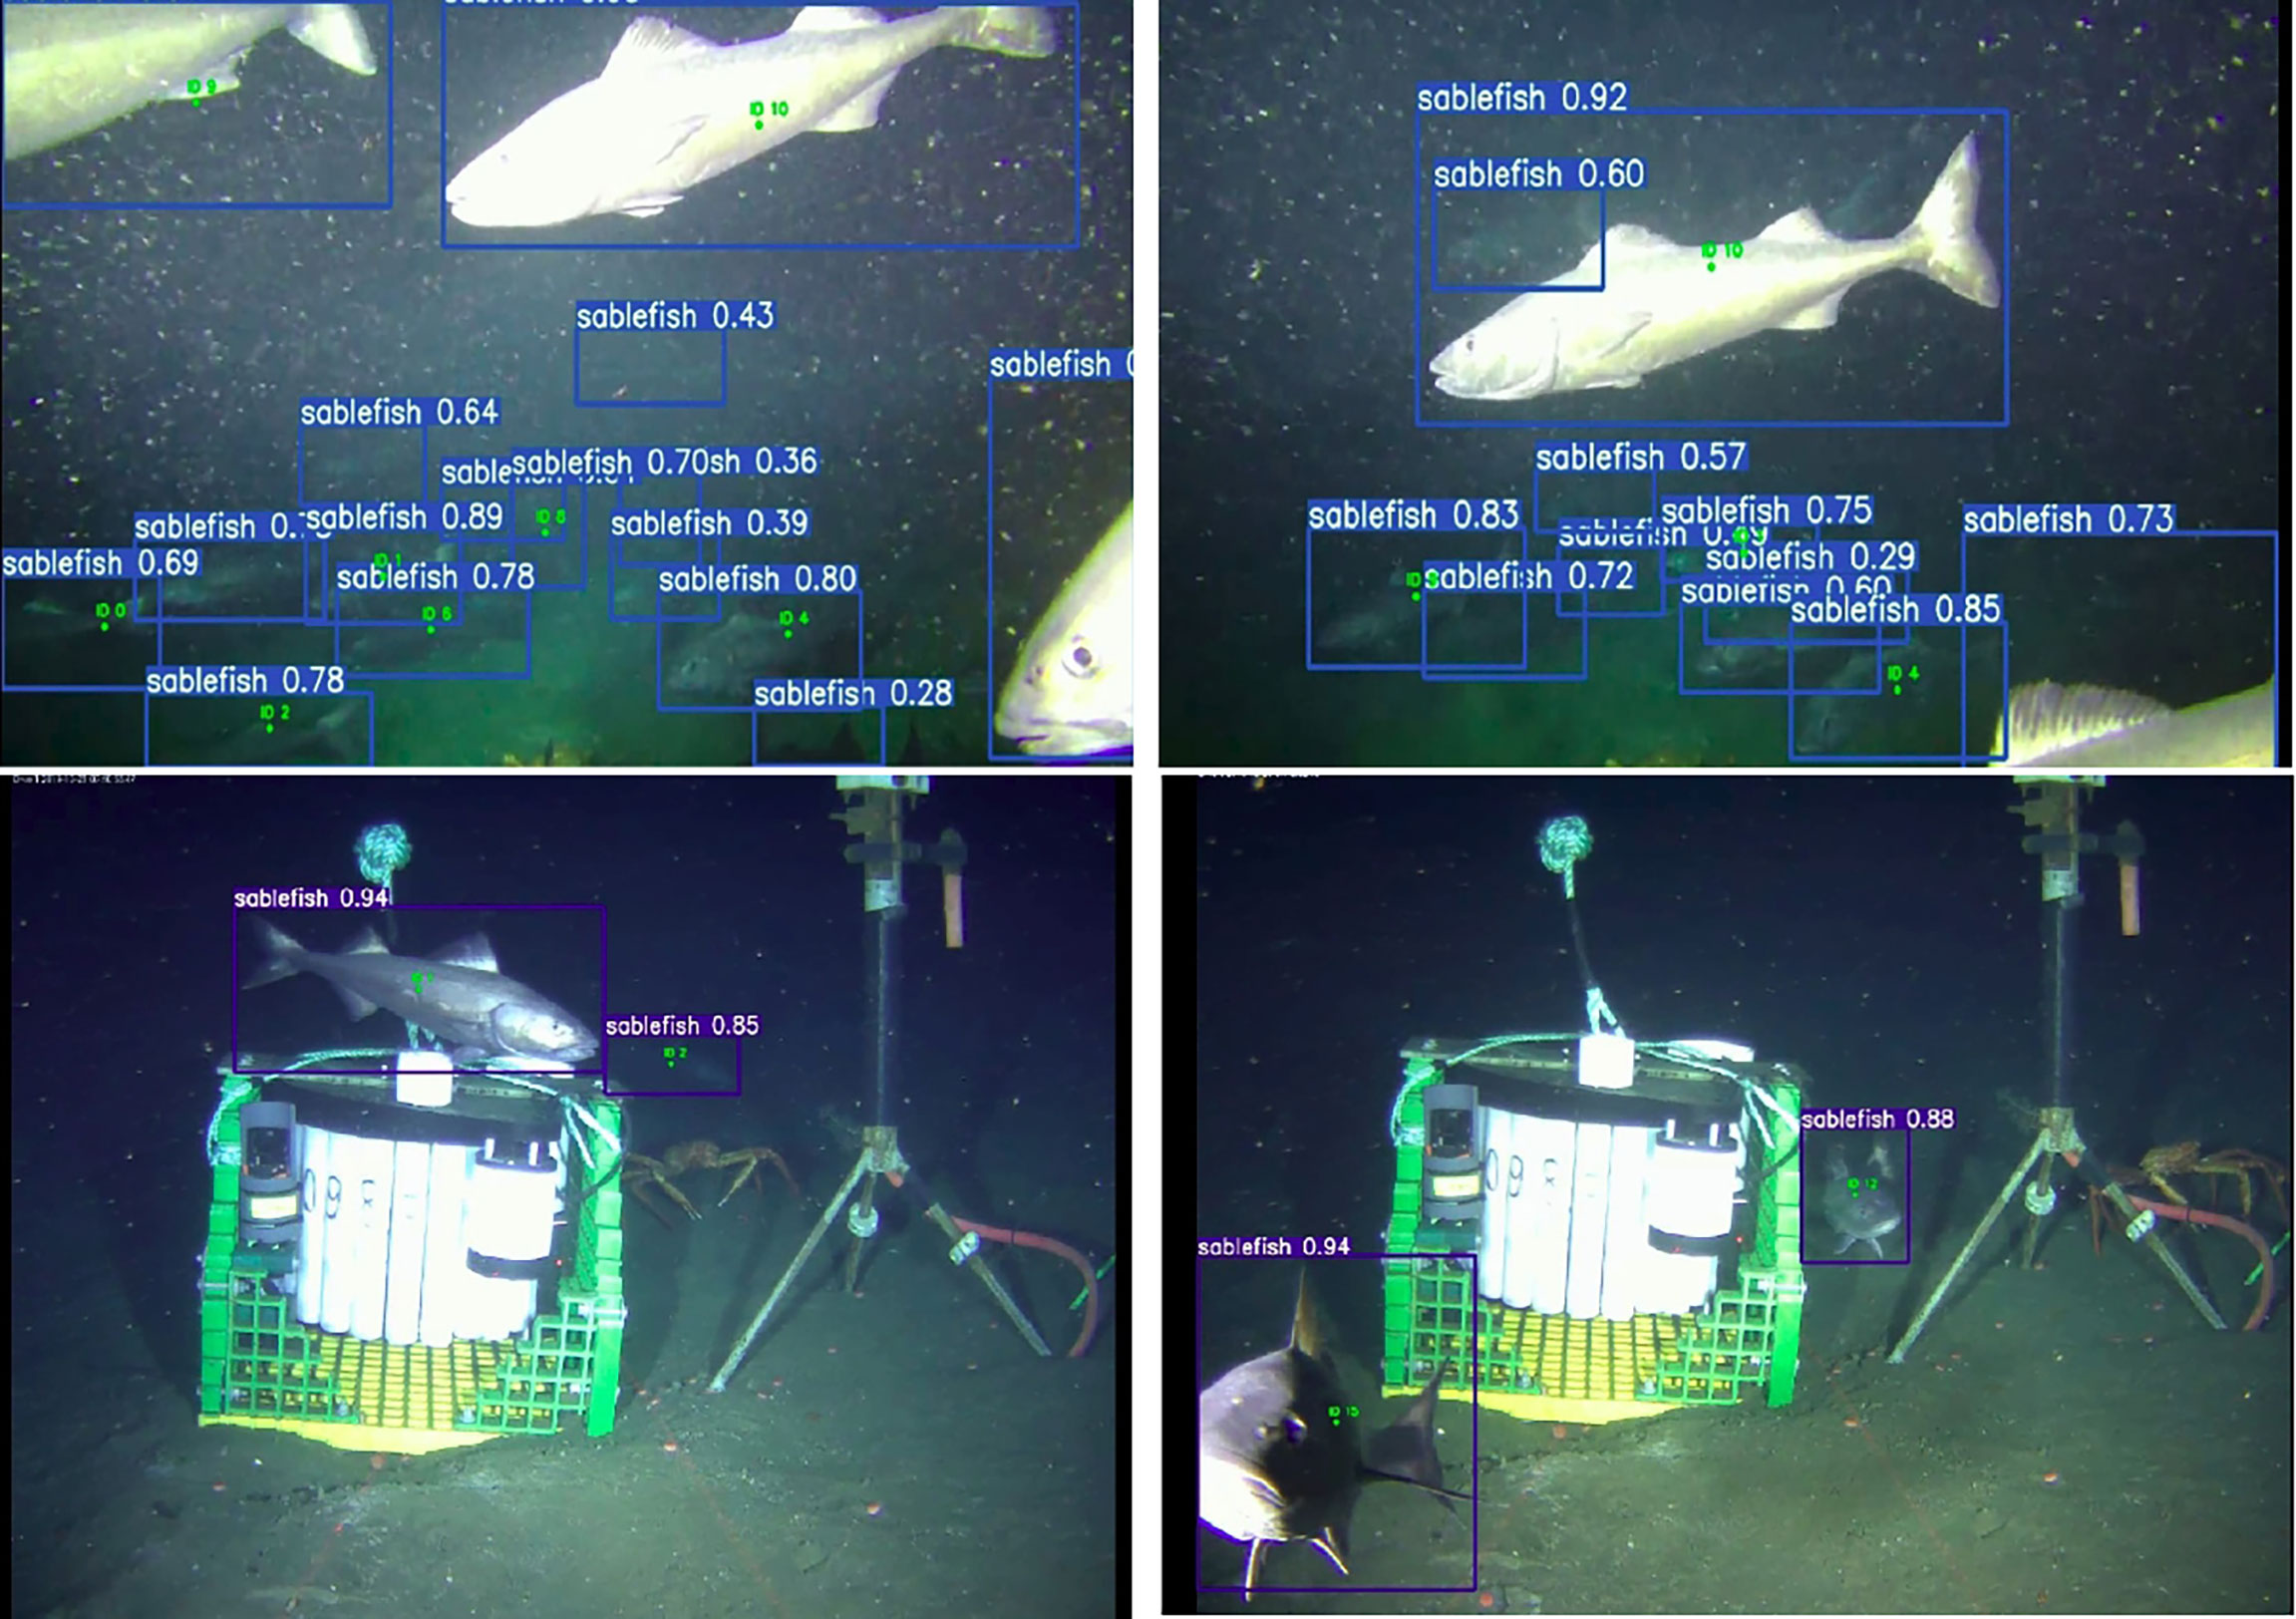
Figure 3 Examples of the outcome of detection, classification, and tracking of sablefish individuals. Bounding boxes and the corresponding confidence levels are the result of the YOLO detection and classification algorithm, where the classification confidence ranges from 0 to 1. Green numbered points (barely visible in the images) are the result of the tracking algorithm, approximating the count of unique individuals appearing on video. The images at the top show two video frames at 5 and 7 seconds elapsed from a video clip recorded in Barkley Axis on October 17th 2019 at 11:00 am UTC. The images at the bottom show two video frames at 31 seconds and 2 minutes elapsed from a video clip recorded in Barkley Node on October 21st 2019 at 8:04 am UTC.
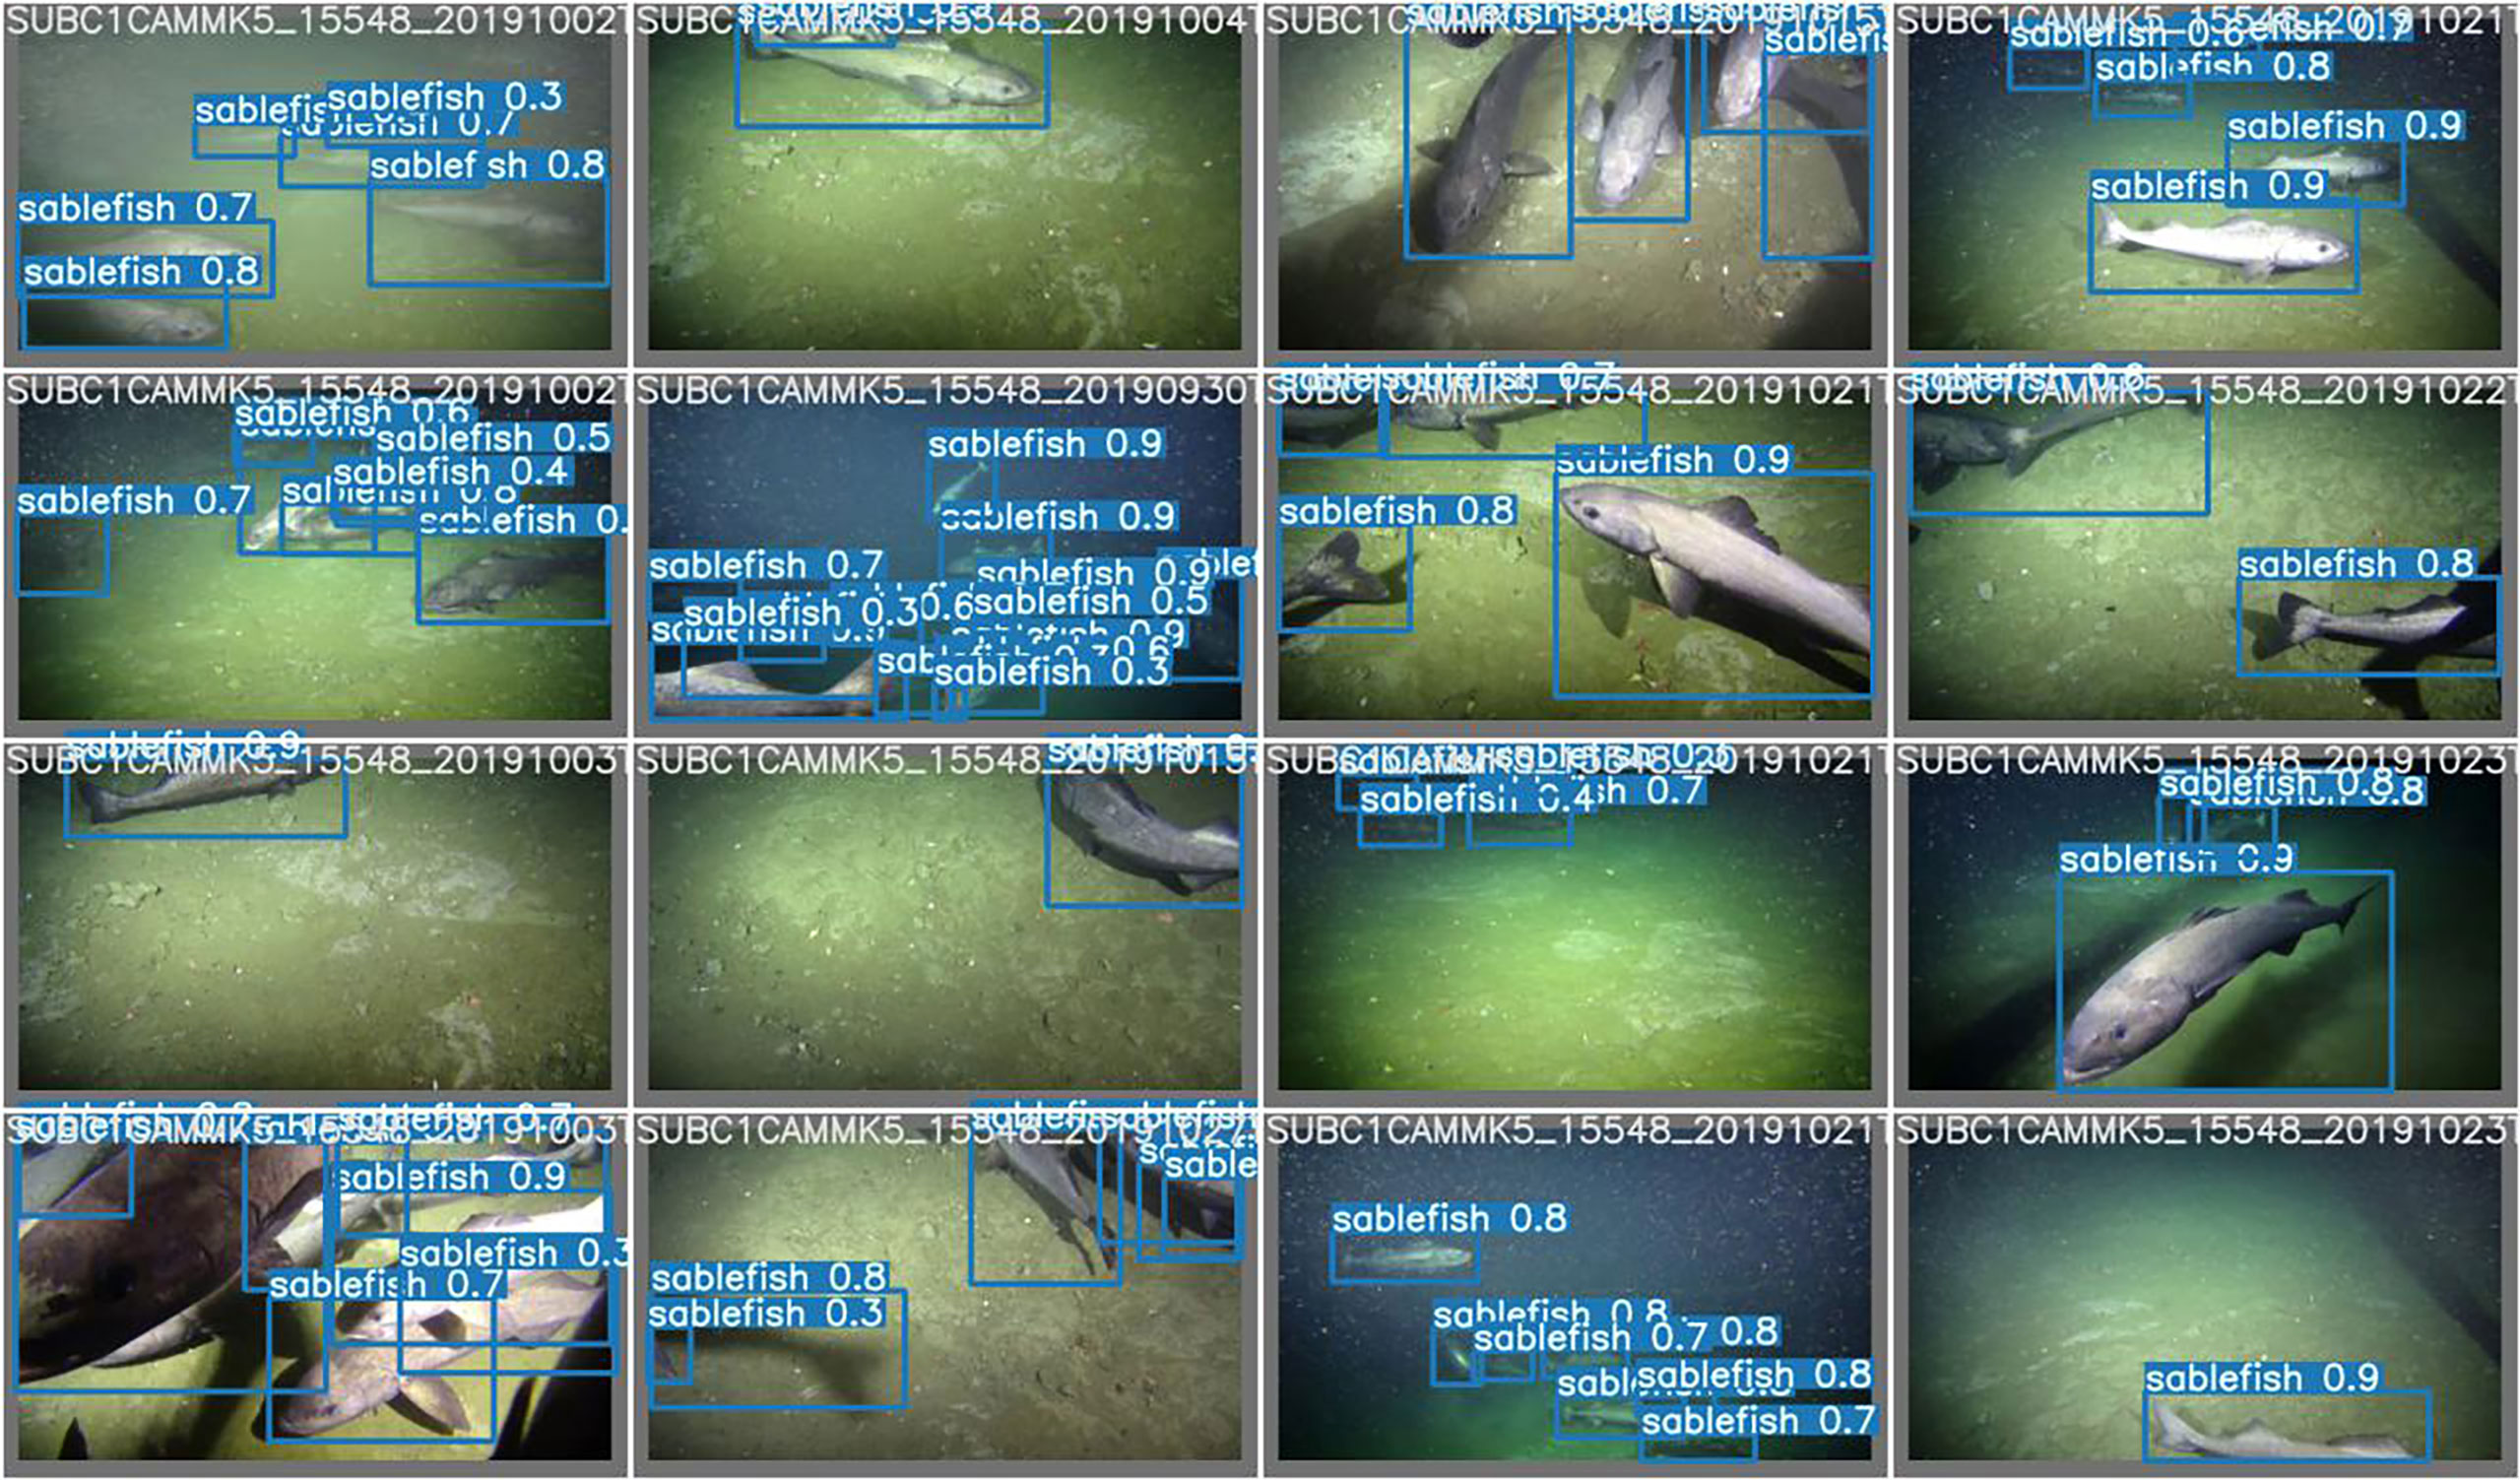
Figure 4 Examples of sablefish detection and classification at Barkley Axis (NE Pacific), showing multiple pan positions (camera moving laterally) and multiple tilt positions (camera moving vertically). The algorithm had to work under multiple illumination and seafloor configurations.
3.3 Derived time-series of sablefish proxy abundance
Using the tracking algorithm, estimates of sablefish proxy abundance from each video clip were extracted, resulting in a 4.5 month long proxy abundance time-series (Figure 5). A total of 263,780 sablefish individuals were counted across all sites (Node: 107,366; Axis: 156;414; Slope: 3), with mean counts of 32.4 (sd: 24.4) and 49.6 (sd: 26.3) per videoclip for Node and Axis, respectively.
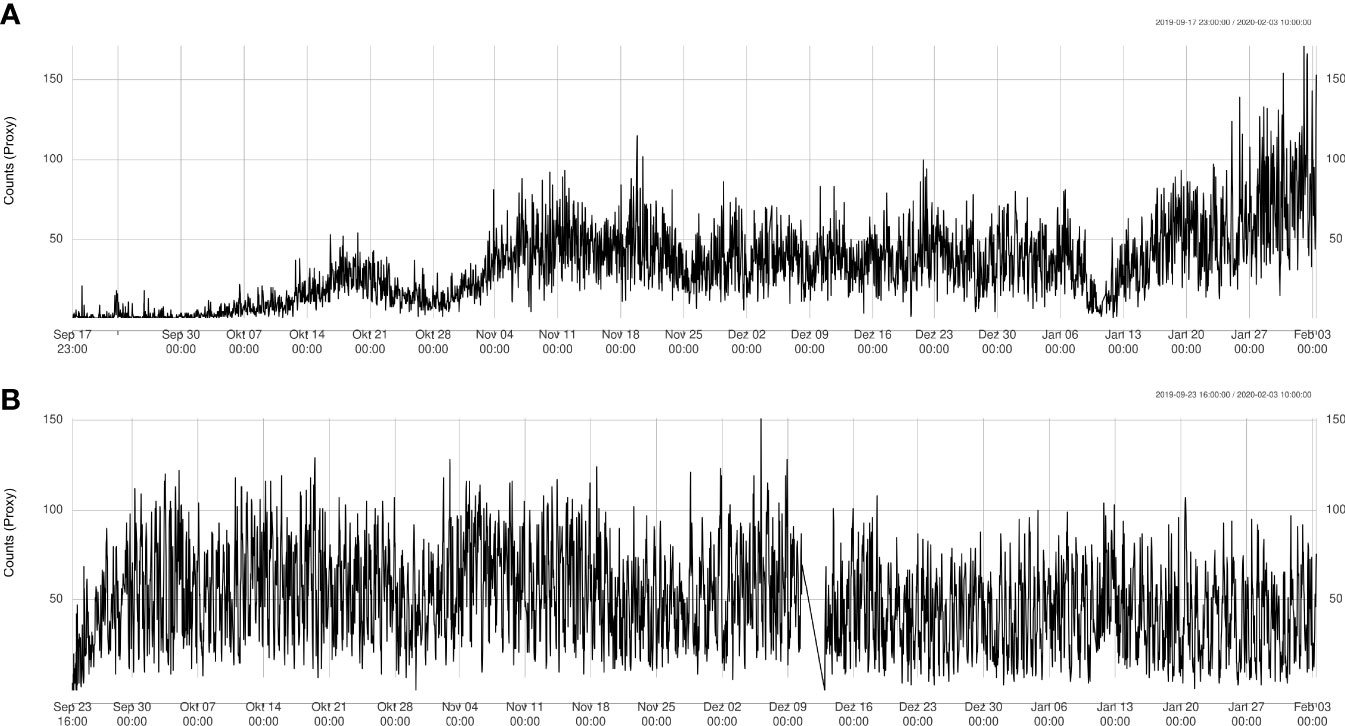
Figure 5 Automatically detected count time series at Node (A) and Axis (B) sites. Data from Upper Slope is not shown since there were only 4 instances where sablefish was detected.
The time series at the Node site showed fluctuating behavior (Figure 5A) and an overall significant linear increase of 12 ± 0.25 sablefish per month on average (R2 = 0.4), especially due to the rise in counts starting from January 13th. The time series at the Axis site had a concave shape (Figure 5B) with an initial sharp increase and a slow decrease at the end. Therefore, the time series had an almost null linear change in average number of sablefish per month with little explained variation (slope = -1.3-6 ± 1.4-7, R2 = 0.027), and therefore a poor linear fit. Filter increment at Upper Slope site resulted in counting only three sablefish between November 17th-27th 2019. We checked videos at these dates confirming the presence of sablefish individuals, although the automatic count was slightly more conservative. We also directly checked for counts greater than 100 at Barkley Node site after day 120, manually confirming the numbers.
The results obtained from the automatic sablefish counts showed good agreement with results from the manual counts, both for Barkley Node (Figure 6) and Axis (Figure 7). However, it is worth noting that the absolute sablefish counts cannot be compared between the two methodologies, in particular because the manual counts were obtained from much shorter video clips (30 sec) instead of the 5 min. long videos used in the YOLO and tracking algorithms combined. Thus, we are mostly interested in comparing the temporal trends between the two series (see Figures 6, 7) and their correlation. For site Node and Axis, we measured 88% and 81% Pearson correlation, respectively (p-value< 0.0001 in both cases). Manual counting at Upper Slope yielded 4 sablefish between September 19th and October 21st, 2019. Therefore, both automatic and manual counting at Upper Slope resulted in False Negatives. Finally, the result of the time trend was robust to variation of the main parameter “m” of the tracking algorithm (Figure 8).
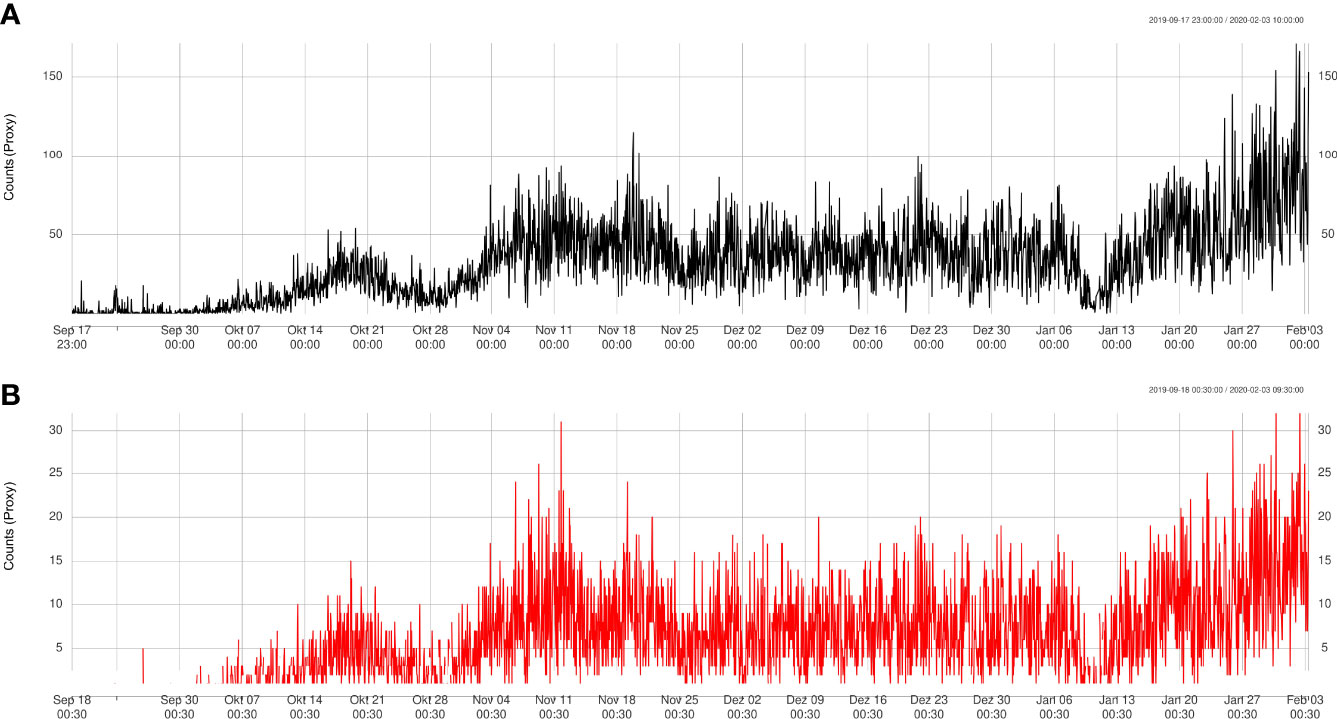
Figure 6 Trend validation of automatically detected counts (A) at Node site compared to manually detected counts (B).
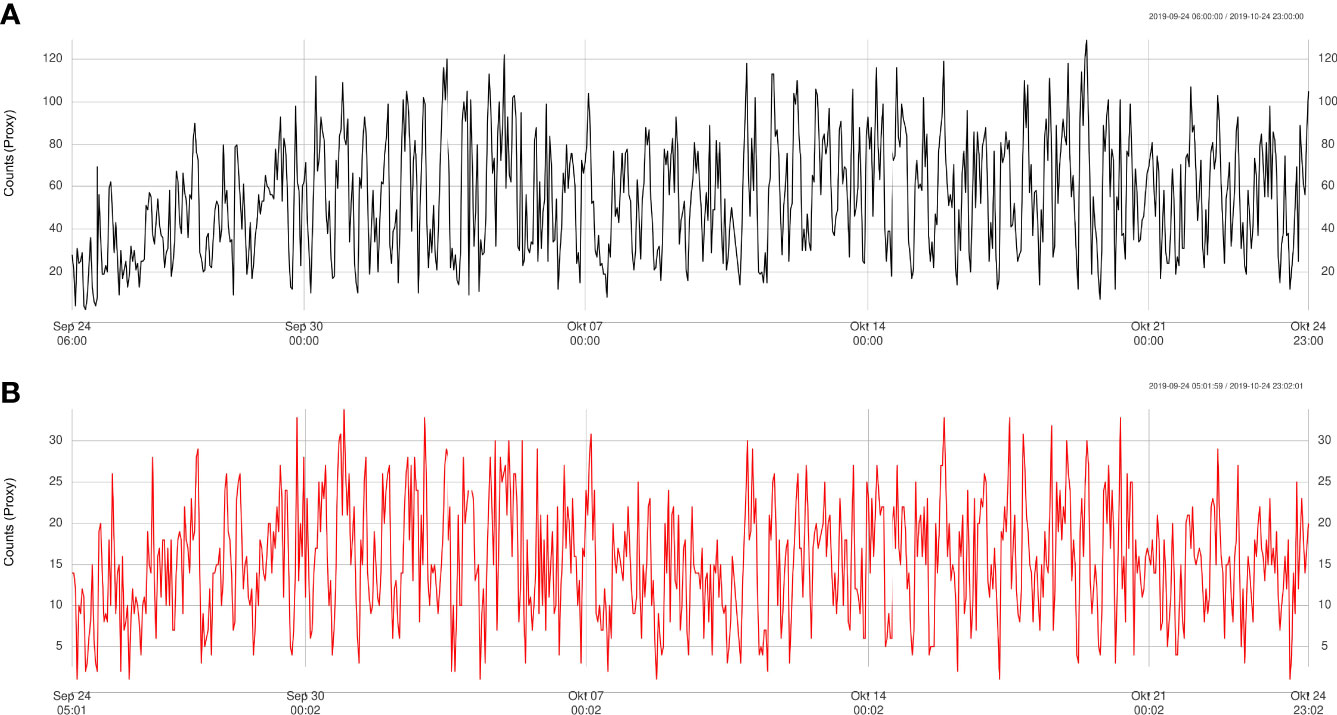
Figure 7 Trend validation of automatically detected counts (A) at Axis site compared to manually detected counts (B), for the period September-October 2019 only.
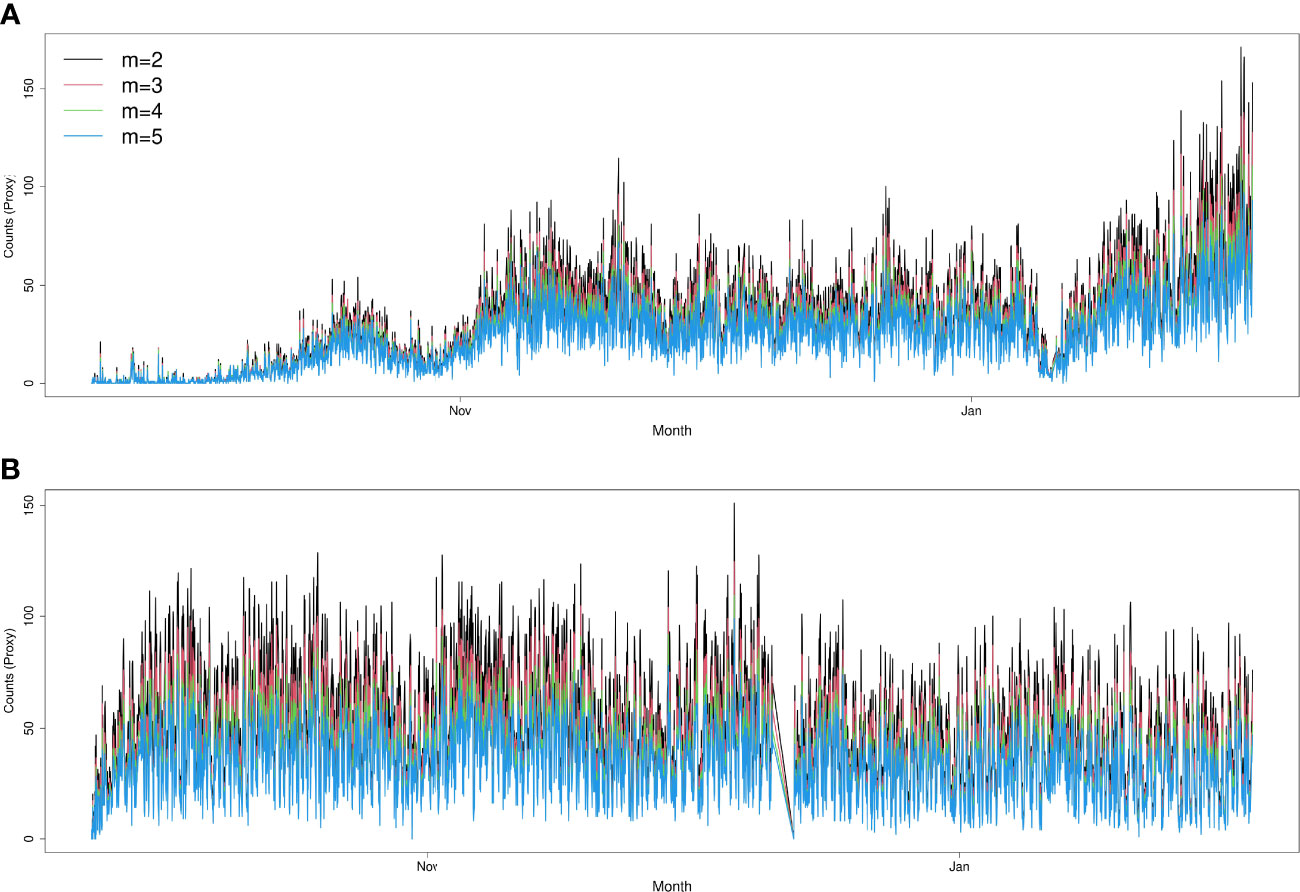
Figure 8 Sensitivity analysis of automatic count calculations, by varying the parameter “m” (maximum number of consecutive empty frames to declare a track lost) of the tracking algorithm. Increasing the value of “m” leads to more conservative results. Sites: Node (A) and Axis (B).
4. Discussion
The results obtained by our machine learning (deep-learning combined with tracking algorithm) approach successfully generated a pipeline of automated detection, classification, and proxy abundance estimation of sablefish. The good agreement in temporal trends of the automated and manually annotated sablefish counts demonstrates the value of this machine learning approach for measuring the local sablefish population dynamics in Barkley Canyon and adjacent Upper Slope. In particular, the machine learning pipeline was successful in detecting sablefish under highly variable environmental conditions; i.e., a depth gradient (420-970 m) which generally translates into variable regimes of seafloor detritus input and suspended particulate matter (sediments and organic matter). Those variable conditions, in turn, have a direct effect on the overall quality of the video imagery (seafloor color, illumination field, etc.). Furthermore, the automated identification of only a few individuals of sablefish at the shallower site (Upper Slope), which overall agrees with the manual identification of sablefish individuals, provides us with valuable information about the upper habitat boundaries for this deep dwelling species.
4.1 Methodological remarks
While the synergy between the video camera infrastructure and machine learning has the big advantage of harnessing vast amounts of monitoring data (Boom et al., 2014; Malde et al., 2020; Beyan and Browman, 2020), we shall nevertheless recall that the resulting animal count estimates are only a proxy for total abundance due to both intrinsic and contingent limitations. Intrinsic limitations deal with the difficulty of any automated detection method to perform a capture-recapture approach; i.e., to discern a specific individual across consecutive video clips, or when a single individual exits and reenters the framed scene (Francescangeli et al., 2022).
In any case, this problem is common with this type of video-monitoring studies and data, that might be processed with the MaxN method for manual counting (Martinez et al., 2011; Linley et al., 2017). Here, the contingent limit was due to the camera-based recording, which did not follow any probability scheme and is therefore open to possible bias. Other possible sources of selection bias include disturbance effects of the newly positioned infrastructures and their artificial lights (Rountree et al., 2020).
Although the abundance of specimens cannot be exactly estimated, the proposed methodology provides consistent temporal dynamics at the three sites that can be used for further multivariate analysis involving physical and bio-chemical variables aimed at explaining and comparing the different dynamics in the three sites. Moreover, the raw counts provided by the methodology can be further used in a variety of ways. For instance, for applying MaxN or other estimators to the automatic counts obtained.
The classifier’s 5-fold cross-validation AP of 93% is mainly driven by very high precision values. In other words, the classifier shows good predictive performance when confronted with new data characterized by changing environmental conditions, species make-up, and animal movement dynamics. On the contrary, the observed lower values of recall (52%), or the higher misclassification of ground-truth annotations, is acceptable and compatible with a low degree of model over-fitting (and high generalization capability), which is desirable in our real-world conditions.
Nevertheless, the precision of the classifier did vary from site to site and in particular we observed a drop in precision at the Upper Slope site. This phenomenon required a higher confidence threshold during tracking in order to eliminate the wrong false positive detections possibly caused by the underrepresentation of examples in the training set for the Upper Slope site.
4.2 Practical applications
The developed AI pipeline helps the transformation of a cabled observatory’s camera into a biological sensor for the automated delivery of numerical information about the observed ecosystem (Aguzzi and Company, 2010; Aguzzi et al., 2011; Rountree et al., 2020). Such “intelligent” observatories become appealing to process the rising amount of imaging data for the production of fishery-independent metrics supporting management of economically-relevant stock resources (Cappo et al., 2004; Bicknell et al., 2016; Langlois et al., 2018; Aguzzi et al., 2021). Moreover, the use of the transfer learning approach combined with the tracking algorithm makes the proposed pipeline usable in different application contexts where footage needs to be analyzed and complementing invasive methods such as trawling, and it is particularly suited for megafauna monitoring in combination with optoacoustic or molecular life-tracing technologies (Aguzzi et al., 2019; Levin et al., 2019; Danovaro et al., 2020).
Our work presents a further step towards the integration of automated tracking and classification of animals with AI routines embedded in robotic platforms (Aguzzi et al., 2022). The automation achieved here allows cameras to deliver time-series of data for a species of commercial interest, in agreement with the socioeconomic need for growing permanent robotic networks worldwide (Danovaro et al., 2017; Aguzzi et al., 2019 Science). Imaging approaches are currently the chief technological application in ecological monitoring (Durden et al., 2016), but the transformation of cameras into true sensors is facing difficulties due to the lack of automated routines to extract relevant ecological information on species and their abundances (Durden et al., 2016; Bicknell et al., 2016; Aguzzi et al., 2019). Bandwidth is another limiting factor for the transmission of images from remote autonomous platforms to land stations, therefore the next steps would include embedding the processing steps in the platforms in order to reduce the output to numeric data which is easier to transfer. Fishery-independent stock assessment programs (e.g., the Norway lobster as an iconic fishery resource for the EU monitored by Under-Water Tele-Vision surveys; Aguzzi et al., 2021) can benefit from such advancements. Moreover, as the envisaged development of industrial-level activities such as deep-sea mining raises the need for effective and efficient assessment of their environmental impact, data achieved with image-based monitoring by networks of fixed and mobile platforms (Rountree et al., 2020 OMBAR; Weaver et al., 2022) can provide fast and flexible solutions. Finally, the same methodologies could be applied to other strategic sectors of marine industry such as aquaculture monitoring (e.g., Muñoz-Benavent et al., 2018), as well as offshore hydrocarbon and energy-generating platforms (e.g., Gates et al., 2019; McLean et al., 2020).
5. Conclusions
This pilot study showed that the methodology has overall benefits in automatically processing big data, which is more often generated in marine sciences applications. Automatically generated proxy abundances of the sablefish subpopulation at Barkley Canyon, are interpretable and prove to be reasonable, while validated with manually generated counts. Therefore, we believe the full potential of the approach can be next used to process yet larger amounts of archived video data and produce a 10 years time series of proxy abundance, which could support the comprehension of long-term stock change, especially in light of rapidly changing climatic and environmental conditions.
Data availability statement
The datasets presented in this study can be found in online repositories. The names of the repository/repositories and accession number(s) can be found in the article/Supplementary Material. We made all training computations on the Google Colab notebook12. To repeat the training, please clone the Google Drive repository containing the annotated data at13. All detection, tracking, and time-series analyses are freely available for reproduction at14.
Ethics statement
Ethical review and approval was not required for the animal study because this was an observational study using video data recording animals in their wild habitat.
Author contributions
SM, FC, and JA conceptualized the project. FC pre-processed the video footage to be analyzed and provided the expertise of the ONC infrastructure; SM and FB conceived the automated image analysis approach based on machine learning. FB and CY manually annotated a subset of the video data; FB implemented the algorithms for the video data analysis; FC, DC, and JA provided their biological expertise on the data tagging and the result interpretation and validation. All authors contributed to the article writing and revision and approved the submitted version.
Funding
Ocean Networks Canada is funded through Canada Foundation for Innovation-Major Science Initiative (CFI-MSI) fund 30199. Ideas for this paper resulted from discussions during the international workshop “Marine cabled observatories: moving towards applied monitoring for fisheries management, ecosystem function and biodiversity”, funded by Ocean Networks Canada and co-hosted by ICM-CSIC, in Barcelona, Spain on 4–5 October 2018.
Acknowledgments
This work was developed within the framework of the Research Unit Tecnoterra (ICM-CSIC/UPC) and the following project activities: ARIM (Autonomous Robotic sea-floor Infrastructure for benthopelagic Monitoring; MarTERA ERA-Net Cofound); RESBIO (TEC2017-87861-R; Ministerio de Ciencia, Innovación y Universidades); PLOME (PLEC2021-007525/AEI/10.13039/501100011033; Ministerio de Ciencia, Innovación y Universidades); JERICO-S3: (Horizon 2020; Grant Agreement no. 871153); ENDURUNS (Research Grant Agreement H2020-MG-2018-2019-2020 n.824348). We also profited from the funding of the Spanish Government through the ‘Severo Ochoa Centre of Excellence’ accreditation (CEX2019-000928-S). We are also thankful for the support from ONC’s marine and digital operations staff for servicing and maintaining the NEPTUNE observatory and for the curation and quality control of all video imagery data used in this study.
Conflict of interest
The authors declare that the research was conducted in the absence of any commercial or financial relationships that could be construed as a potential conflict of interest.
Publisher’s note
All claims expressed in this article are solely those of the authors and do not necessarily represent those of their affiliated organizations, or those of the publisher, the editors and the reviewers. Any product that may be evaluated in this article, or claim that may be made by its manufacturer, is not guaranteed or endorsed by the publisher.
Supplementary material
The Supplementary Material for this article can be found online at: https://www.frontiersin.org/articles/10.3389/fmars.2022.842946/full#supplementary-material
Footnotes
- ^ https://en.unesco.org/ocean-decade
- ^ https://www.oceannetworks.ca/multimedia/maps/
- ^ https://data.oceannetworks.ca/,
- ^ https://wiki.oceannetworks.ca/display/O2A/Oceans+3.0+API+Home
- ^ https://github.com/tzutalin/labelImg
- ^ https://github.com/ultralytics/yolov3
- ^ https://github.com/jinfagang/yolov7
- ^ https://github.com/ultralytics/yolov5
- ^ https://cocodataset.org
- ^ https://colab.research.google.com/
- ^ Section 5-7 of the online Colab notebook, See data availability statement below.
- ^ https://drive.google.com/drive/folders/1OnY2MlhUcQjefCfsU8cgxl_aJzFDr6GA?usp=sharing
- ^ https://drive.google.com/drive/folders/10JtFCofWq16-foQFiOlTCQk4bXk2Vom7?usp=sharing
- ^ https://github.com/bonorico/analysis-of-ONC-video-data
References
Aguzzi J., Bahamon N., Doyle J., Lordan C., Tuck I. D., Chiarini M., et al. (2021). Burrow emergence rhythms of nephrops norvegicus by UWTV and surveying biases. Sci. Rep. 11 (1), 5797. doi: 10.1038/s41598-021-85240-3
Aguzzi J., Chatzievangelou D., Company J. B., Thomsen L., Marini S., Bonofiglio F., et al. (2020a). Fish-stock assessment using video imagery from worldwide cabled observatory networks. ICES. J. Mar. Sci. 77, 2396–2410. doi: 10.1093/icesjms/fsaa169
Aguzzi J., Chatzievangelou D., Marini S., Fanelli E., Danovaro R., Flögel S., et al. (2019). New high-tech interactive and flexible networks for the future monitoring of deep-sea ecosystems. Environ. Sci. Technol. 53, 6616–6631. doi: 10.1021/acs.est.9b00409
Aguzzi J., Company J. B. (2010). Chronobiology of deep-water decapod crustaceans on continental margins. Adv. Mar. Biol. 58, 155–225. doi: 10.1016/B978-0-12-381015-1.00003-4
Aguzzi J., Company J. B., Costa C., Matabos M., Azzurro E., Mànuel A., et al. (2012). Challenges to assessment of benthic populations and biodiversity as a result of rhythmic behaviour: video solutions from cabled observatories. Oceanography. Mar. Biol.: Annu. Rev. (OMBAR). 50, 235–286. doi: 10.1201/b12157
Aguzzi J., Company J. B., Costa C., Menesatti P., Garcia J. A., Bahamon N., et al. (2011b). Activity rhythms in the deep-sea: a chronobiological approach. Front. Bioscience-Landmark. 16, 131–150. doi: 10.2741/3680
Aguzzi J., Costa C., Robert K., Matabos M., Antonucci F., Juniper K., et al. (2011a). Automated image analysis for the detection of benthic crustaceans and bacterial mat coverage using the VENUS undersea cabled network. Sensors-Basel 11, 10534–10556. doi: 10.3390/s111110534
Aguzzi J., Doya C., Tecchio S., De Leo F. L., Azzurro E., Costa C., et al. (2015a). Coastal observatories for monitoring of fish behaviour and their responses to environmental changes. Rev. Fish. Biol. Fish. 25, 463–483. doi: 10.1007/s11160-015-9387-9
Aguzzi J., Flögel S., Marini S., Thomsen L., Albiez J., Weiss P., et al. (2022). Developing technological synergies between deep-sea and space research. Elementa 10 (1). doi: 10.1525/elementa.2021.00064
Aguzzi J., Iveša N., Gelli M., Costa C., Gavrilovic A., Cukrov N., et al. (2020b). Ecological video monitoring of marine protected areas by underwater cabled surveillance cameras. Mar. Policy 119, 104052. doi: 10.1016/j.marpol.2020.104052
Aguzzi J., Sbragaglia V., Tecchio S., Navarro J., Company J. B. (2015b). Rhythmic behaviour of marine benthopelagic species and the synchronous dynamics of benthic communities. Deep-Sea. Res. I. 95, 1–11. doi: 10.1016/j.dsr.2014.10.003
Azimjonov J., Özmen A. (2022). Vision-based vehicle tracking on highway traffic using bounding-box features to extract statistical information computers and electrical engineering 97, 107560. doi: 10.1016/j.compeleceng.2021.107560
Aziz L., Salam M. S. B. H., Sheikh U. U., Ayub S. (2020). Exploring deep learning-based architecture, strategies, applications and current trends in generic object detection: A comprehensive review. IEEE Access 8, 170461–170495. doi: 10.1109/ACCESS.2020.3021508
Beyan C., Browman H. I. (2020). Setting the stage for the machine intelligence era in marine science. ICES. J. Mar. Sci. 77 (4), 1267–1273. doi: 10.1093/icesjms/fsaa084
Bicknell A. W., Godley B. J., Sheehan E. V., Votier S. C., Witt M. J. (2016). Camera technology for monitoring marine biodiversity and human impact. Front. Ecol. Environ. 14 (8), 424–432. doi: 10.1002/fee.1322
Bonofilgio F. (2021) Analysis-of-ONC-video-data. Available at: https://github.com/bonorico/analysis-of-ONC-video-data.
Boom B. J., He J., Palazzo S., Huang P. X., Beyan C., Chou H. M., et al. (2014). A research tool for long-term and continuous analysis of fish assemblage in coral-reefs using underwater camera footage. Ecol. Inf. 23, 83–97. doi: 10.1016/j.ecoinf.2013.10.006
Cappo M., Speare P., De’ath G. (2004). Comparison of baited remote underwater video stations (BRUVS) and prawn (shrimp) trawls for assessments of fish biodiversity in inter-reefal areas of the great barrier reef marine park. J. Exp. Mar. Biol. Ecol. 302, 123–152. doi: 10.1016/j.jembe.2003.10.006
Chapman B. B., Skov C., Hultén K., Brodersen J., Nilsson P. A., Hansson L., et al. (2012). Partial migration in fishes: definitions, methodologies and taxonomic distribution. J. Fish. Biol. 81, 479–499. doi: 10.1111/j.1095-8649.2012.03349.x
Chatzievangelou D., Aguzzi J., Ogston A., Suárez A., Thomsen L. (2020). Visual monitoring of key deep-sea megafauna with an Internet operated crawler as a tool for ecological status assessment. Prog. Oceanogr. 184, 102321. doi: 10.1016/j.pocean.2020.102321
Chatzievangelou D., Doya C., Thomsen L., Purser A., Aguzzi J. (2016). High-frequency patterns in the abundance of benthic species near a cold-seep – an internet operated vehicle application. PloS One 11 (10). doi: 10.1371/journal.pone.0163808
Chauvet P., Metaxas A., Hay A. E., Matabos M. (2018). Annual and seasonal dynamics of deep-sea megafaunal epibenthic communities in barkley canyon (British Columbia, canada): A response to climatology, surface productivity and benthic boundary layer variation. Prog. Oceanography. 169, 89–105. doi: 10.1016/j.pocean.2018.04.002
Chuang M. C., Hwang J. N., Williams K. (2016). A feature learning and object recognition framework for underwater fish images. IEEE Trans. Image. Process. 25, 1862–1872. doi: 10.1109/TIP.2016.2535342
Colloca F., Scarcella G., Libralato S. (2017). Recent trends and impacts of fisheries exploitation on Mediterranean stocks and ecosystems. Front. Mar. Sci. 4, 244. doi: 10.3389/fmars.2017.00244
Costello M. J., Basher Z., McLeod L., Asaad I., Claus S., Vandepitte L., et al. (2017). “Methods for the study of marine biodiversity,” in The GEO handbook on biodiversity observation networks (Springer, Cham), 129–163. doi: 10.1007/978-3-319-27288-7_6
Danovaro R., Aguzzi J., Fanelli E., Billett D., Gjerde K., Jamieson A., et al. (2017). A new international ecosystem-based strategy for the global deep ocean. Science 355, 452–454. doi: 10.1126/science.aah7178
Danovaro R., Fanelli E., Aguzzi J., Billett D., Carugati L., Corinaldesi C., et al. (2020). Small matters, but large organisms remain the highest priority in current deep-sea monitoring and conservation efforts. Nat. Ecol. Evol. 5, 30–31. doi: 10.1038/s41559-020-01337-4
De Leo F. C., Ogata B., Sastri A. R., Heesemann M., Mihaíly S., Galbraith M., et al. (2018). High-frequency observations from a deep-sea cabled observatory reveal seasonal overwintering of neocalanus spp. in barkley canyon, NE pacific: Insights into particulate organic carbon flux. Prog. Oceanography. 169, 120–137. doi: 10.1016/j.pocean.2018.06.001
De Mendonça S. N., Metaxas A. (2021). Comparing the performance of a remotely operated vehicle, a drop camera, and a trawl in capturing deep-Sea epifaunal abundance and diversity. Front. Mar. Sci. 8. doi: 10.3389/fmars.2021.631354
Doya C., Aguzzi J., Pardo M., Matabos M., Company J. B., Costa C., et al. (2014). Diel behavioral rhythms in the sablefish (Anoplopoma fimbria) and other benthic species, as recorded by deep-sea cabled observatories in barkley canyon (NEPTUNE-Canada). J. Mar. Syst. 130, 69–78. doi: 10.1016/j.jmarsys.2013.04.003
Doya C., Chatzievangelou D., Bahamon N., Purser A., De Leo F. C., Juniper S. K., et al. (2017). Seasonal monitoring of deep-sea megabenthos in barkley canyon cold seep by internet operated vehicle (IOV). PloS One 12 (5). doi: 10.1371/journal.pone.0176917
Durden J. M., Schoening T., Althaus F., Friedman A., Garcia R., Glover A. G., et al. (2016). Perspectives in visual imaging for marine biology and ecology: From acquisition to understanding. Oceanography. Mar. Biol.: Annu. Rev. 54, 1–72. doi: 10.1201/9781315368597
Du S., Wang S. (2022). “An overview of correlation-filter-based object tracking ieee transactions on computational social systems,” in IEEE Transactions on Computational Social Systems9 (1), 18–31. doi: 10.1109/TCSS.2021.3093298
Fawcett T. (2006). An introduction to ROC analysis. Pattern Recognition. Lett. 27, 861–874. doi: 10.1016/j.patrec.2005.10.010
Fiaz M., Mahmood A., Javed S., Jung S. K. (2019). Handcrafted and deep trackers: Recent visual object tracking approaches and trends ACM computing surveys. ACM Comput. Surv (New York, NY, USA: Association for Computing Machinery) 52, 2. doi: 10.1145/3309665
Fier R., Albu A. B., Hoeberechts M. (2014). Automatic fish counting system for noisy deep-sea videos. 2014 Oceans. - St. John’s., 1–6. doi: 10.1109/OCEANS.2014.7003118
Filho L. ,. W., Abubakar I. R., Nunes C., Platje J., Ozuyar P. G., Will M., et al. (2021). Deep seabed mining: a note on some potentials and risks to the sustainable mineral extraction from the oceans. J. Mar. Sci. Eng. 9, 521. doi: 10.3390/jmse9050521
Flannery E., Przeslawski R. (2015). Comparison of sampling methods to assess benthic marine biodiversity: are spatial and ecological relationships consistent among sampling gear? record (Canberra: NSW: Geoscience Australia). doi: 10.11636/Record.2015.007
Francescangeli M., Sbragaglia V., Del Río J., Trullols E., Antonijuan J., Massana I., et al. (2022). The video-monitored temporal niche of dentex dentex, a top Mediterranean fish predator. Front. Mar. Sci. 9, 837216. doi: 10.3389/fmars.2022.837216
Gates A. R., Horton T., Serpell-Stevens A., Chandler C., Grange L. J., Robert K., et al. (2019). Ecological role of an offshore industry artificial structure. Front. Mar. Sci. 6. doi: 10.3389/fmars.2019.00675
Girshick R. (2015). “Fast r-CNN,” in Proceedings of the IEEE international conference on computer vision (Santiago, Chile: IEEE), 1440–1448.
Goetz F. W., Jasonowicz A. J., Roberts S. B. (2018). What goes up must come down: diel vertical migration in the deep-water sablefish (Anoplopoma fimbria) revealed by pop-up satellite archival tags. Fish. Oceanography. 27, 127–142. doi: 10.1111/fog.12239
Hanselman D. H., Heifetz J., Echave K. B. (2015). Move it or lose it: movement and mortality of sablefish tagged in Alaska. Can. J. Fish. Aquat. Sci. 72, 238–251. doi: 10.1139/cjfas-2014-0251
Han F., Yao J., Zhu H., Wang C. (2020). Underwater image processing and object detection based on deep CNN method. J. Sensors. 2020, 6707328. doi: 10.1155/2020/6707328
Harris D., Johnston D., Yeoh D. (2021). More for less: Citizen science supporting the management of small-scale recreational fisheries. 48, 102047. doi: 10.1016/j.rsma.2021.102047
Harrison D., De Leo F. C., Galin W. J., Mir F., Marini S., Leys S. P. (2021). Machine learning applications of convolutional neural networks and unet architecture to predict and classify demosponge behavior. Multidiscip. Digital. Publishing. Inst. Water 13, 2512. doi: 10.3390/w13182512
Harvey E. S., Cappo M., Butler J. J., Hall N., Kendrick G. A. (2007). Bait attraction affects the performance of remote underwater video stations in assessment of demersal fish community structure. Mar. Ecol. Prog. Ser. 350, 245–254. doi: 10.3354/meps07192
Hiddink J. G., Jennings S., Kaiser M. J., Queirós A. M., Duplisea D. E., Piet G. J. (2006). Cumulative impacts of seabed trawl disturbance on benthic biomass, production, and species richness in different habitats. Can. J. Fish. Aquat. Sci. 63, 721–736. doi: 10.1139/f05-266
Hsiao Y. H., Chen C. C., Lin S. I., Lin F. P. (2014). Real-world underwater fish recognition and identification, using sparse representation. Ecol. Inf. 23, 13–21. doi: 10.1016/j.ecoinf.2013.10.002
Islam N. (2020). “An image processing based approach to analyse ski-jump’s length, height and velocity of an athlete,” in ICISCT 2020 - 2nd international conference on information science (Karachi, Pakistan: IEEE). doi: 10.1109/ICISCT49550.2020.9080054
Jacobson L. D., Brodziak J., Rogers J. (2001). Depth distributions and time-varying bottom trawl selectivities for Dover sole (Microstomus pacificus), sablefish (Anoplopoma fimbria), and thornyheads (Sebastolobus alascanus and s. altivelis) in a commercial fishery. Fish. Bull. 99 (2), 309–327.
Jahanbakht M., Xiang W., Hanzo L., Rahimi Azghadi M. (2021). Internet Of underwater things and big marine data analytics–a comprehensive survey. IEEE Commun. Surveys. Tutorials. 23 (2), 904–956. doi: 10.1109/COMST.2021.3053118
Jamieson A. J., Boorman B., Jones D. O. (2013). Deep-Sea benthic sampling. Methods Study. Mar. Benthos., 285–347. doi: 10.1002/9781118542392.ch7
Kearney B., Hilborn R. (2022). Solutions to world-wide fisheries problems are mostly local or regional? ICES. J. Mar. Sci 79, 997–1004. doi: 10.1093/icesjms/fsac033
Kildow J. T. (2022). The importance of understanding the ocean’s economic value for a sustainable world. Mar. Technol. Soc. J. 56 (1), 8–11. doi: 10.4031/MTSJ.56.1.9
Kimura D. K., Shimada A. M., Shaw F. R. (2018). Stock structure and movement of tagged sablefish, anoplopoma fimbria, in offshore northeast pacific waters and the effects of El nino southern oscillation on migration and growth. Fish. Bull. 96 (3), 462–481.
Koirala A., Walsh K. B., Wang Z., McCarthy C. (2019). Deep learning – method overview and review of use for fruit detection and yield estimation, computers and electronics in agriculture. Computers and Electronics in Agriculture 162, 219–234. doi: 10.1016/j.compag.2019.04.017
Konovalov D. A., Saleh A., Bradley M., Sankupellay M., Marini S., Sheaves M. (2019). Underwater fish detection with weak multi-domain supervision. Int. Joint Conf. Neural Networks (IJCNN)., 1–8. doi: 10.1109/IJCNN.2019.8851907
Langenkämper D., van Kevelaer R., Purser A., Nattkemper T. W. (2020). Gear-induced concept drift in marine images and its effect on deep learning classification. Front. Mar. Sci. 7. doi: 10.3389/fmars.2020.00506
Langlois T., Williams J., Monk J., Bouchet P., Currey L., Goetze J., et al. (2018). “Marine sampling field manual for benthic stereo BRUVS (Baited remote underwater videos,” in Field manuals for marine sampling to monitor Australian waters. Eds. Przeslawski R., Foster S. (National Environmental Science Programme (NESP), 82–104.
Levin L. A., Bett B. J., Gates A. R., Heimbach P., Howe B. M., Janssen F., et al. (2019). Global observing needs in the deep ocean. Front. Mar. Sci. 6, 241. doi: 10.3389/fmars.2019.00241
Levin L. A., Wei C.-L., Dunn D. C., Amon D. J., Ashford O.S., Cheung W. W. L., et al. (2020). Climate change considerations are fundamental to management of deep-sea resource extraction. Glob. Change Biol. 26, 4664–4678. doi: 10.1111/gcb.15223
Linley T. D., Lavaleye M., Maiorano P., Bergman M., Capezzuto F., Cousins N. J., et al. (2017). Effects of cold-water corals on fish diversity and density (European continental margin: Arctic, NE Atlantic and Mediterranean sea): Data from three baited lander systems deep-Sea research part II. Topical. Stud. Oceanography. 145, 8–21. doi: 10.1016/j.dsr2.2015.12.003
Liu H., Liu T., Gu Y., Li P., Zhai F., Huang H., et al. (2021). A high-density fish school segmentation framework for biomass statistics in a deep-sea cage. Ecol. Inf. 64. doi: 10.1016/j.ecoinf.2021.101367
Lopez-Marcano S. ,. L., Jinks ,. E., Buelow C. A., Brown C. J., Wang D., Kusy B., et al. (2021). Automatic detection of fish and tracking of movement for ecology. Ecol. Evol 11, 8254–8263. doi: 10.1002/ece3.7656
Lopez-Vazquez V., Lopez-Guede J.-M., Marini S., Fanelli E., Johnsen E., Aguzzi J. (2020). Video-imaging enhancement and machine learning pipeline for animal tracking and classification at cabled observatories. Sensors 20, 726. doi: 10.3390/s20030726
Malde K., Handegard N. O., Eikvil L., Salberg A. B. (2020). Machine intelligence and the data-driven future of marine science. ICES. J. Mar. Sci. 77 (4), 1274–1285. doi: 10.1093/icesjms/fsz057
Maloney N. E., Sigler M. F. (2008). Age-specific movement patterns of sablefish (Anoplopoma fimbria) in Alaska. Fish. Bull. 106 (3), 305–316.
Marini S., Corgnati L., Mantovani C., Bastianini M., Ottaviani E., Fanelli E., et al. (2018a). Automated estimate of fish abundance through the autonomous imaging device GUARD1. Measurement 126, 72–75. doi: 10.1016/j.measurement.2018.05.035
Marini S., Fanelli E., Sbragaglia V., Azzurro E., Fernandez J. D. R., Aguzzi J. (2018b). Tracking fish abundance by underwater image recognition. Sci. Rep. 8 (1), 1–12. doi: 10.1038/s41598-018-32089-8
Martinez I., Jones E. G., Davie S. L., Neat F. C., Wigham B. D., Priede I. G. (2011). Variability in behaviour of four fish species attracted to baited underwater cameras in the north Sea. Hydrobiologia 670, 23–34. doi: 10.1007/s10750-011-0672-x
Matabos M., Hoeberechts M., Doya C., Aguzzi J., Nephin J., Reimchen T. E., et al. (2017). Expert, crowd, students or algorithm: who holds the key to deep-sea imagery ‘big data’ processing? Methods Ecol. Evol. 8, 996–1004. doi: 10.1111/2041-210X.12746
McLean D. L., Parsons M. J. G., Gates A. R., Benfield M. C., Bond T., Booth D. J., et al. (2020). Enhancing the scientific value of industry remotely operated vehicles (rovs) in our oceans. Front. Mar. Sci. 7. doi: 10.3389/fmars.2020.00220
Mena J., Pujol O., Vitrià J. (2022). A survey on uncertainty estimation in deep learning classification systems from a bayesian perspective acm computing surveys. ACM Comput. Surv. 54 (9), 35. doi: 10.1145/3477140
Morita S. H., Morita K., Nishimura A. (2012). Sex-biased dispersal and growth in sablefish (Anoplopoma fimbria) in the northeastern pacific ocean. Environ. Biol. Fishes. 94 (3), 505–511. doi: 10.1007/s10641-010-9613-1
Muñoz-Benavent P., Andreu-García G., Valiente-González J. M., Atienza-Vanacloig V., Puig-Pons V., Espinosa V. (2018). Automatic bluefin tuna sizing using a stereoscopic vision system. ICES. J. Mar. Sci. 75 (1), 390–401. doi: 10.1093/icesjms/fsx151
MSFD European Commission (2008). Directive 2008/56/EC of the European Parliament and of the Council of 17 June 2008 establishing a framework for community action in the field of marine environmental policy. (Marine Strategy Framework Directive), https://eur-lex.europa.eu/legal-content/en/ALL/?uri=CELEX%3A32008L0056.
Nishida Y., Ura T., Hamatsu T., Nagahashi K., Inaba S., Nakatani T. (2014). Fish recognition method using vector quantization histogram for investigation of fishery resources. Oceans. - St. John’s. 1–5. doi: 10.1109/OCEANS.2014.7003268
Orlov A. M. (2003). Possible ways of exchange between Asian and American ichthyofaunas in the north pacific ocean. ICES paper theme session q: Regional long-term changes in the spatial distribution, abundance, and migration of pelagic and demersal resources (CM 2003/Q:09).
Osterloff J., Nilssen I., Järnegren J., Van Engeland T., Buhl-Mortensen P., Nattkemper T. W. (2020). Computer vision enables short-and long-term analysis of lophelia pertusa polyp behaviour and colour from an underwater observatory. Sci. Rep. 9, 1–12. doi: 10.1038/s41598-019-41275-1
Osterloff J., Nilssen I., Nattkemper T. W. (2016). A computer vision approach for monitoring the spatial and temporal shrimp distribution at the LoVe observatory. Methods Oceanog. 15, 114–128. doi: 10.1016/j.mio.2016.03.002
Ottaviani E., Francescangeli M., Gjeci N., del Rio Fernandez J., Aguzzi J., Marini S. (2022). Assessing the image concept drift at the obsea coastal underwater cabled observatory. Front. Mar. Sci. 9. doi: 10.3389/fmars.2022.840088
Ovando D., Free C. M., Jensen O. P., Hilborn R. (2022). A history and evaluation of catch-only stock assessment models. Fish. Fish. 23, 616–630. doi: 10.1111/faf.12637
Painting S. J., Collingridge K. A., Durand D., Grémare A., Créach V., Bernard G. (2020). Marine monitoring in europe: is it adequate to address environmental threats and pressures? Ocean. Sci. 16 (1), 235–252. doi: 10.5194/os-16-235-2020
Palomares M. L. D., Froese R., Derrick B., Meeuwig J. J., Nöel S. L., Tsui G., et al. (2020). Fishery biomass trends of exploited fish populations in marine ecoregions, climatic zones and ocean basins. Estuarine. Coast. Shelf. Sci. 243. doi: 10.1016/j.ecss.2020.106896
Pentz B., Klenk N. (2022). Why do fisheries management institutions circumvent precautionary guidelines? J. Environ. Manage. 311, 114851. doi: 10.1016/j.jenvman.2022.114851
Pitcher C. R., Hiddink J. G., Jennings S., Collie J., Parma A. M., Amoroso R., et al. (2022). Trawl impacts on the relative status of biotic communities of seabed sedimentary habitats in 24 regions worldwide. Proc. Natl. Acad. Sci. United. States America 119 (2). doi: 10.1073/pnas.2109449119
Priede I. G., Bagley P. M., Smith A., Creasey S., Merrett N. R. (1994). Scavenging deep demersal fishes of the porcupine seabight, north-east Atlantic: Observations by baited camera, trap and trawl. J. Mar. Biol. Assoc. United. Kingdom. 74, 481–498. doi: 10.1017/S0025315400047615
Rayner R., Jolly C., Gouldman C. (2019). Ocean observing and the blue economy. Front. Mar. Sci. 6. doi: 10.3389/fmars.2019.00330
Redmon J., Divvala S., Girshick R., Farhadi A. (2016). “You only look once: Unified, real-time object detection,” in Proceedings of the IEEE conference on computer vision and pattern recognition (Las Vegas, NV, USA: IEEE), 779–788).
Ren S., He K., Girshick R., Sun J. (2015). Faster r-cnn: Towards real-time object detection with region proposal networks. Adv. Neural Inf. Process. Syst. 28, 91–99. doi: 10.1109/TPAMI.2016.2577031
Riera A., Rountree R. A., Agagnier L., Juanes F. (2020). Sablefish (Anoplopoma fimbria) produce high frequency rasp sounds with frequency modulation. J. Acoustical. Soc. America 147 (4), 2295–2307. doi: 10.1121/10.0001071
Rountree R., Aguzzi J., Marini S., Fanelli E., De Leo F., Del Rio J., et al. (2020). Towards an optimal design for ecosystem-level ocean observatories. Oceanography. Mar. Biol.: Annu. Rev. (OMBAR). 58, 79–106.
Rousseau Y., Watson R. A., Blanchard J. L., Fulton E. A. (2019). Evolution of global marine fishing fleets and the response of fished resources. Proc. Natl. Acad. Sci. 116, 12238–12243. doi: 10.1073/pnas.1820344116
Schobernd Z. H., Bacheler N. M., Conn P. B. (2014). Examining the utility of alternative video monitoring metrics for indexing reef fish abundance. Can. J. Fish. Aquat. Sci. 71, 464–471. doi: 10.1139/cjfas-2013-0086
Schoening T., Bergmann M., Ontrup J., Taylor J., Dannheim J., Gutt J., et al. (2012). Semi-automated image analysis for the assessment of megafaunal densities at the Arctic deep-sea observatory HAUSGARTEN. PloS One 7. doi: 10.1371/journal.pone.0038179
Sciberras M., Hiddink J. G., Jennings S., Szostek C. L., Hughes K. M., Kneafsey B., et al. (2018). Response of benthic fauna to experimental bottom fishing: a global meta-analysis. Fish. Fish. 19, 698–715. doi: 10.1111/faf.12283
Sigler M. F., Echave K. B. (2019). Diel vertical migration of sablefish (Anoplopoma fimbria). Fish. Oceanography. 28, 517–531. doi: 10.1111/fog.12428
Simonyan K., Zisserman A. (2015). Very deep convolutional networks for large-scale image recognition. (2015) 3rd International Conference on Learning Representations, ICLR 2015 - Conference Track Proceedings.
Sokolova M., Mompó Alepuz A., Thompson F., Mariani P., Galeazzi R., Krag L. A. (2021b). A deep learning approach to assist sustainability of demersal trawling operations. Sustainabil. (Switzerland). 13 (22), 12362. doi: 10.3390/su132212362
Sokolova M., Thompson F., Mariani P., Krag L. A. (2021a). Towards sustainable demersal fisheries: NepCon image acquisition system for automatic nephrops norvegicus detection. PloS One 16 (6 June), e0252824. doi: 10.1371/journal.pone.0252824
Tan C., Sun F., Kong T., Zhang W., Yang C., Liu C. (2018). “A survey on deep transfer learning,” in International conference on artificial neural networks (Switzerland AG: Springer), 270–279.
Tills O., Spicer J. I., Grimmer A., Marini S., Jie V. W., Tully E., et al. (2018). A high-throughput and open-source platform for embryo phenomics. PloS Biol. 16 (12). doi: 10.1371/journal.pbio.3000074
Vigo M., Navarro J., Masmitja I., Aguzzi J., García J. A., Rotllant G., et al. (2021). Spatial ecology of Norway lobster (Nephrops norvegicus) in Mediterranean deep-water environments: implications for designing no-take marine reserves. Mar. Ecol. Prog. Ser. 674, 173–188. doi: 10.3354/meps13799
Warpinski S., Herrmann M., Greenberg J. A., Criddle K. R. (2016). Alaska’s sablefish fishery after individual fishing quota (IFQ) program implementation: an international economic market model. North Am. J. Fish. Manage. 36 (4), 864–875. doi: 10.1080/02755947.2016.1165766
Weaver P. P. E., Aguzzi J., Boschen-Rose R. E., Colaço A., de Stigter H., Gollner S., et al. (2022). Assessing plume impacts caused by polymetallic nodule mining vehicles. Mar. Policy 139, 105011. doi: 10.1016/j.marpol.2022.105011
Whitmarsh S. K., Fairweather P. G., Huveneers C. (2022). What is Big BRUVver up to? Methods and uses of baited underwater video. Rev Fish Biol Fisheries 27 (1), 53–73. doi: 10.1007/s11160-016-9450-1
Wong P. L., Osman M. A., Talib A. Z., Yahya K., Burie J. C., Ogier J. M., et al. (2015). “Recognition of fish based on generalized color fourier descriptor,” in 2015 science and information conference (SAI) (London, UK: IEEE), 680–686.
Workman G., Surry M., Haggarty D. (2019). British Columbia Groundfish fisheries and their investigations in 2018. prepared for the 60th annual meeting of the technical Sub-committee of the Canada-united states groundfish committee April 23-24, 2019, double tree by Hilton Olympia 415 capitol way Olympia (WA, USA).
Yang L., Liu Y., Yu H., Fang X., Song L., Li D., et al. (2021). Computer vision models in intelligent aquaculture with emphasis on fish detection and behavior analysis: A review. Arch. Comput. Methods Eng. 28 (4), 2785–2816. doi: 10.1007/s11831-020-09486-2
Yeh J., Drazen J. C. (2009). Depth zonation and bathymetric trends of deep-sea megafaunal scavengers of the Hawaiian islands. Deep-Sea. Res. I. 56, 251–266. doi: 10.1016/j.dsr.2008.08.005
Zhao Z., Liu Y., Sun X., Liu J., Yang X., Zhou C. (2021). Composited fishnet: fish detection and species recognition from low-quality underwater videos. IEEE Trans. Image. Process. 30, 4719–4734. doi: 10.1109/TIP.2021.3074738
Keywords: big data, machine learning, marine observatories, automated video analysis, fishery independent monitoring, ocean network Canada, intelligent marine observing systems, neural network
Citation: Bonofiglio F, De Leo FC, Yee C, Chatzievangelou D, Aguzzi J and Marini S (2022) Machine learning applied to big data from marine cabled observatories: A case study of sablefish monitoring in the NE Pacific. Front. Mar. Sci. 9:842946. doi: 10.3389/fmars.2022.842946
Received: 24 December 2021; Accepted: 29 July 2022;
Published: 26 August 2022.
Edited by:
Paolo Favali, ERIC foundation, ItalyReviewed by:
Abdullah-Al Arif, Yokohama City University, JapanMarjolaine Matabos, Institut Français de Recherche pour l’Exploitation de la Mer (IFREMER), France
Copyright © 2022 Bonofiglio, De Leo, Yee, Chatzievangelou, Aguzzi and Marini. This is an open-access article distributed under the terms of the Creative Commons Attribution License (CC BY). The use, distribution or reproduction in other forums is permitted, provided the original author(s) and the copyright owner(s) are credited and that the original publication in this journal is cited, in accordance with accepted academic practice. No use, distribution or reproduction is permitted which does not comply with these terms.
*Correspondence: Simone Marini, simone.marini@sp.ismar.cnr.it