Temporal variability of particle flux and its components in the Gotland Basin, eastern Baltic Sea
 Oscar Dario Beltran-Perez
 Maren Voss
 Falk Pollehne
  Joanna Jadwiga Waniek
- Leibniz Institute for Baltic Sea Research Warnemünde, Rostock, Germany
Sinking particles were studied by analyzing samples collected in a sediment trap at 180 m depth in the Gotland Basin, eastern Baltic Sea between 1999 and 2020. The aim of this study was to determine the temporal variability of the particle flux and its components and how their changes are linked to phytoplankton blooms. The variables studied included total particle flux, particulate organic carbon and nitrogen, biogenic silica, C:N ratio and the isotopic composition of organic carbon and nitrogen. The total particle flux and its components reached maximum values in 2003, 2012 and 2015. Long-term means over the 22-year period of the total particle flux and its components particulate organic carbon and nitrogen, biogenic silica were estimated at around 152, 22, 3 and 8 mg m−2 d−1, respectively. The C:N ratio and the isotopic composition of organic carbon and nitrogen showed high variability around their long-term means of 9, -25‰ and 4‰, respectively. The annual variability of the components of the flux particulate organic carbon (3–65 mg m−2 d−1), particulate organic nitrogen (0.4–9 mg m−2 d−1) and biogenic silica (1–24 mg m−2 d−1) exhibited the same general pattern as the total particle flux (11–450 mg m−2 d−1) over the study period. On the seasonal scale, sinking material in summer contributed roughly one-third (31%) to the total particle flux, followed by winter (27%), spring (24%) and autumn (19%). The highest particle flux occurred mostly in April, July and November, during and after the appearance of phytoplankton blooms in the Gotland Basin. The phytoplankton community changed from silicon-rich species to nitrogen-fixing cyanobacteria, indicating a shift in nitrogen sources from nitrate-based to N2-based over the year. The spring bloom, dominated by diatoms, was characterized by a lighter carbon and heavier nitrogen isotopic composition, while the summer bloom, mainly of diazotrophic cyanobacteria, was characterized in contrary by heavier carbon and lighter nitrogen isotopes. Although no trend was found in the data, the variability observed in the sinking material was related to the changes over time in the phytoplankton community in the Gotland Basin. The findings of this study provide new and valuable information for our understanding of the temporal variability of sinking material linked to the development of phytoplankton blooms and nutrient sources in the Gotland Basin, and underscore the importance of continued monitoring to understand the potential impacts of environmental changes on this fragile ecosystem.
1 Introduction
Particle flux measurements provide important insights into the pelagic system and the productivity of surface waters. This is especially true for systems like the Baltic Sea, a brackish, shallow, semi-enclosed sea in northern Europe (Figure 1), which is affected by eutrophication (Fleming-Lehtinen et al., 2008), rapid warming (Belkin, 2009; HELCOM/Baltic Earth, 2021) and acidification (Havenhand, 2012). The Baltic Sea is strongly stratified relative to other continental shelf seas with a strong seasonal pycnocline at around 10–20 m depth (Gustafsson et al., 2004). The long residence time influenced by the limited water exchange with the North Sea and the long-term excessive nutrient loading (Schneider and Müller, 2018) have contributed to the reduced phosphorus binding capacity of the sediment under anoxic conditions (Lehtoranta et al., 2008). Eutrophication and excess deposition of particles in environments with slow water renewal, as in the Baltic Sea, may have adverse effects on ecosystem structure and functioning (e.g., hypoxia of near-bottom water and sediment) (Vahtera et al., 2007; Diaz and Rosenberg, 2008; Carstensen et al., 2014; Tamelander et al., 2017).
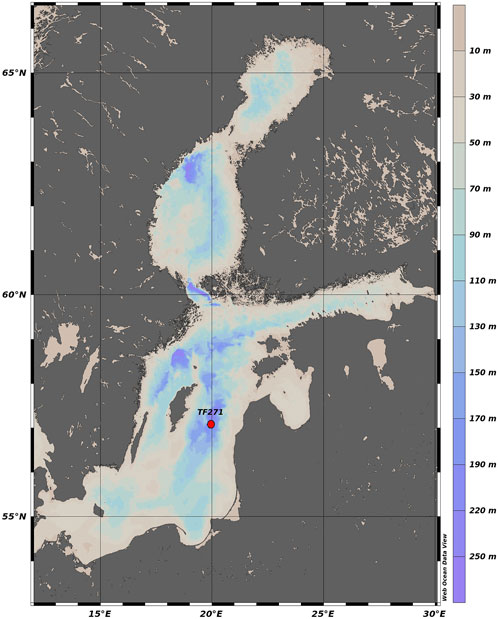
FIGURE 1. Position of moored sediment-trap in the Gotland Basin, Baltic Sea. Map produced with Web Ocean Data View (Schlitzer, 2023).
Stagnation periods frequently occur in the deep basins of the Baltic Sea as a result of both the limited water exchange with the North Sea and the permanent stratification (Carstensen et al., 2014). Changes in stagnation periods strongly affect nutrient conditions (Mohrholz et al., 2015). Phosphate remains fixed in the sediment under oxic conditions, otherwise phosphate and iron ions are released, changing the chemistry of the water column (e.g., increasing phosphate concentration in the water and decreasing the N:P ratio). Moreover, inorganic nitrogen compounds are present mainly as nitrate under oxic conditions. However, under anoxic conditions, nitrate is denitrified to molecular nitrogen gas (N2). Ammonium from the sediments or produced during mineralization cannot be oxidized under these conditions and is enriched. Enriched nutrients can be transported upwards by vertical mixing (Reissmann et al., 2009), reaching the euphotic surface layer and therefore determining to a large extent the intensity of phytoplankton blooms (Vahtera et al., 2007; Murray et al., 2019).
Deep water ventilation in the central Baltic basins can only take place by extreme inflow events - called Major Baltic Inflows (MBIs) - which transport large amounts of salt and oxygen into the deep basins of the Baltic Sea (Mohrholz, 2018). MBIs were recorded frequently in the last century, however since the mid-1970s their frequency and intensity have decreased (Mohrholz et al., 2015). A strong inflow event in January 1993 along with smaller inflows in winter 1993/1994 terminated the longest stagnation period ever recorded in the Baltic Sea (from the beginning of 1983 until the end of 1992). Subsequent MBIs occurred in 2003, 2011 and 2014. The strong inflow at the end of 2014 was even able to renew the bottom water in the eastern Gotland Basin (Mohrholz et al., 2015).
The Gotland Basin is the major basin of the Baltic Proper, with a maximum depth of 249 m. It is characterized by a permanent halocline at 60–80 m depth, which functions as a barrier between anoxic bottom waters and the surface near layer (Schneider et al., 2000; Klais et al., 2011). Diatom-dominated blooms occur in spring and autumn, while cyanobacteria blooms are more common in summer. These blooms connect the surface with the seafloor, as phytoplankton dominate primary production and are the major source of organic matter exported to the bottom. The estimated annual export of particulate organic carbon varies between 18 and 60 gCm−2year−1 over the entire Baltic Sea (Tamelander et al., 2017), considering only the central Baltic Sea, the annual export is around 50 gCm−2year−1 according to a study between 1998 and 2000 (Gustafsson et al., 2013). The sinking material increases during and after the phytoplankton bloom, i.e., when primary production is at its highest (Leipe et al., 2008; Schneider et al., 2017). However, the sinking material varies more strongly in summer than in spring (Tamelander et al., 2017), probably due to the greater sensitivity of cyanobacteria to environmental changes than diatom-dominated spring blooms (Beltran-Perez and Waniek, 2022).
Climate projections indicate that phytoplankton biomass in the Baltic Sea is likely to increase in the future due to higher nutrient loading (Meier et al., 2011) and an increase in wind stress, as well as continued loss of seasonal sea ice (Christensen et al., 2015), which may increase resuspension in coastal areas. In fact, resuspended particles represent about 50% of the material deposited on the seafloor in a coastal area of the Baltic Sea, as measured by sediment traps (Blomqvist and Larsson, 1994). Model simulations have also confirmed that resuspension events are likely to become more frequent and severe in the future (Eilola et al., 2013). As a result, sinking material may settle again locally or be transported offshore contributing to deposition in deeper areas as well (Almroth-Rosell et al., 2011). The freshwater runoff is projected to increase by 15%–22% due to higher precipitation in the Baltic Sea (Meier et al., 2012), however, in the open Baltic Sea waters the influence of terrestrial sources is minimal (Tamelander et al., 2017).
Previous studies of organic matter export in the Baltic Sea have indicated its spatial and temporal variability in relation to primary production (Elmgren, 1984), phytoplankton dynamics (Heiskanen and Kononen, 1994; Tamelander and Heiskanen, 2004), pelagic food web structure (Smetacek et al., 1984) and hydrodynamic forcing (Blomqvist and Heiskanen, 2001; Tamelander and Heiskanen, 2004). However, the temporal changes of the particle flux have not been comprehensively addressed so far in the Gotland Basin. Understanding the changes to which the particle flux is exposed in a permanently stratified basin with regular phytoplankton blooms, low water renewal and anoxic conditions at the bottom provide insights into the factors that dominate the particle flux, its components and impacts on ecosystems increasingly affected by climate change. Therefore, the aim of this study is to determine the temporal variability of the particle flux and its components as well as its relationship with phytoplankton blooms and environmental changes using sediment trap data collected at ca. 180 m depth between 1999 and 2020 in the Gotland Basin, eastern Baltic Sea (Figure 1).
2 Material and methods
2.1 Sediment trap and sample analyses
The particle flux was measured in sediment trap samples from ca. 180 m depth at mooring station TF271 (57°18.3N, 20°0.46E) in the Gotland Basin between 1999 and 2020. The instrument used was a funnel-shaped automated Kiel sediment trap (type S/MT 234, KUM, Germany) with aperture of 0.5 m2 and a revolver holding twenty-one collecting cups of 400 mm (Kremling et al., 1996). The sampling intervals were 7–10 days. Collecting cups were filled with formalin (4%) as fixative to retard microbial activity. After recovery, the samples were sieved through a 400-µm gauze to remove large organisms and stored separately in formalin (4%). The samples were split into subsets using a 4-fold sample-splitter for bulk analyses. To determine the total particle flux, a representative volume of the sample was filtered onto a pre-weighed membrane filter (0.45 µm pore size), dried in an oven at 60°C and weighed to calculate the particle flux.
Samples were filtered on precombusted glass fiber filters (GF/F, 500°C, 2 h) for analysis of particulate organic carbon (POC) and nitrogen (PON) according to the procedure described by Nieuwenhuize et al. (1994). The POC was determined after the filters were treated with concentrated HCl for 24 h to remove inorganic carbon. A second filter was prepared for PON analysis. After drying at 60°C, POC, PON and stable carbon and nitrogen isotopes were measured using an elemental analyzer (Thermo Scientific) connected to a Delta isotope ratio mass spectrometer (Thermo Scientific) via a Conflow interface (Thermo Fisher Scientific, US). Acetanilide (manufactured by Merck) was used as the calibration material for C and N analysis. The analytical precision of the measurement was
2.2 Additional data
Chlorophyll a concentration (Chla) was downloaded from the SHARKweb database provided by the Swedish Meteorological and Hydrological Institute (SMHI). Discrete measurements of Chla at the surface of the Gotland Basin were used to calculate monthly mean values between January 1999 and December 2020. The partial pressure of carbon dioxide (pCO2) was estimated from in-situ observations and provided by the Copernicus Marine Service through the Global Ocean Surface Carbon product. Monthly pCO2 data were used from 15 January 1999 to 15 December 2020 with a spatial resolution of 1° × 1°. The pCO2 data were interpolated to the deployment area of the sediment trap for the analysis.
2.3 Data analysis
A total of 740 sediment trap samples were collected at intervals of 7–10 days according to total exposition time and season between 15 May 1999 and 14 November 2020. Sampling periods of more than 10 days with no measurements were identified and excluded from the analysis (Table 1). These gaps were caused by malfunctioning of the trap, its loss or available ship time for mooring turnover. A moving median over a 10 days window was used to fill gaps of less than 10 days. Monthly, seasonal and annual means of total particle flux, particulate organic carbon and nitrogen, biogenic silica, molar C:N ratio, isotopic composition of organic carbon and nitrogen were calculated based on the sediment trap data at each interval. Monthly, seasonal and annual means of chlorophyll a and partial pressure of carbon dioxide were estimated from water column measurements in the Gotland Basin. The long-term, inter-annual and seasonal variability were estimated as the arithmetic average of values in the same month, year and season between 1999 and 2020, respectively. For the seasonal variability, sinking particles were grouped into spring (1 March to 31 May), summer (1 June to 31 August), autumn (1 September to 30 November) and winter (1 December to 28 February) using the pelagic seasons in the eastern Baltic Sea. The annual cycle was estimated as monthly means between 1999 and 2020. Mean δ15N and δ13C values were estimated based on a weighted mean over the sampling interval (i) (Equation 1; Voss et al., 2005). Single values outside the standard deviation of the mean were considered as outliers and were not used in further calculations and interpretations. The relationship and interplay of sinking material with primary production were explored by calculating linear correlations between the total particle flux and its components (POC, PON, PSi), isotopic composition, chlorophyll a and partial pressure of carbon dioxide. Correlations were considered significant at a p-value of less than or equal to 0.05. All calculations and analyses were performed in MATLAB (version R2018b).
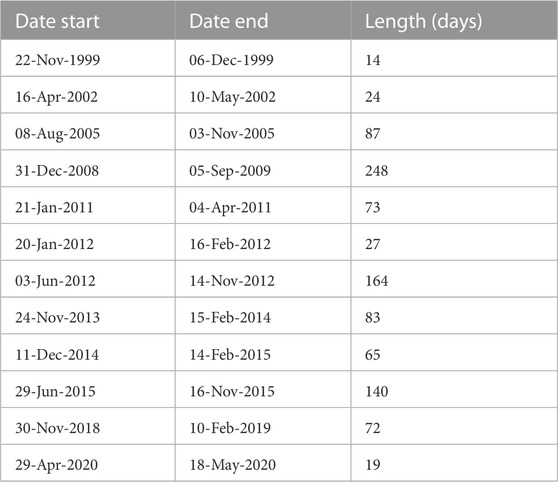
TABLE 1. Sediment trap sampling periods of more than 10 days with no measurements due to trap malfunction, loss or available ship time for mooring turnover.
3 Results
3.1 Long-term variability
The total particle flux and its components were measured for a total of 22 years, from 1999 to 2020, in the Gotland Basin. Monthly means of the total particle flux showed differences in the magnitude and timing of sinking particles (Figure 2A). The absolute maximum of the total particle flux during the entire observation period occurred in July 2003 reaching up to 1907 mg m−2 d−1, whereas the long-term mean was 152 mg m−2 d−1. Elevated particle flux was also occasionally observed in other years. The monthly particle flux was mainly above the long-term mean in 2000–2008, 2012 and between 2015 and 2017, with maxima once or twice a year usually observed in March (2000, 2001, 2003, 2004, 2007), April (2002, 2005), July (2003, 2004, 2007) and December (2004, 2008). In 2008, a peak occurred only at the end of the year. However, it was not possible to follow this maximum because measurements were missing between the end of 2008 and the first half of 2009. Furthermore, in February 2006, January 2012, June 2015 and November 2017, a high particle flux was observed with values of 481, 1,245, 1,354 and 503 mg m−2 d−1, respectively. The total particle flux in 2016 was above the average over the entire year with maximum values in January, March, June and November of 705, 744, 517 and 566 mg m−2 d−1, respectively. Elevated values of the total particle flux were also observed in 1999, 2009–2011, 2013–2014 and 2018–2020, but the total particle flux in 1999 was only measured from May onwards. The lowest monthly values were observed in May 2001, May 2005, May 2007, August 2013 and June 2014. Overall, the long-term variability of the total particle flux followed the periods of high primary production in the eastern Baltic Sea, usually driven by diatom blooms in spring and autumn and cyanobacteria blooms in summer, as shown in Supplementary Figure S1 and also reported by Wasmund et al. (2000); Kudryavtseva et al. (2011). The total particle flux decreased after October, as the primary production at the end of the year was generally lower than during the previous months.
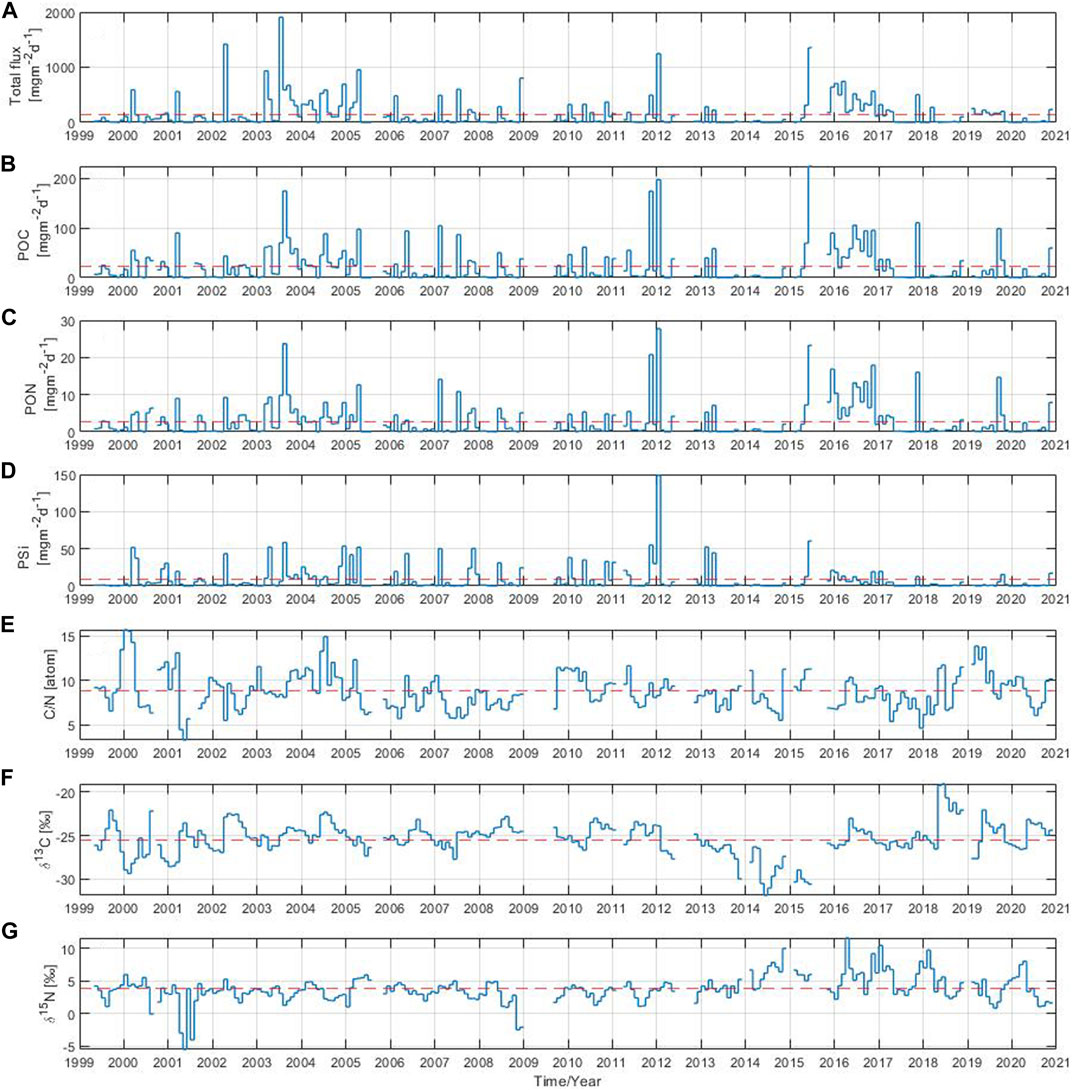
FIGURE 2. Monthly mean of (A) total particle flux, (B) particulate organic carbon, (C) particulate organic nitrogen, (D) biogenic silica, (E) C:N ratio, stable isotope ratios (F)13C:12C and (G)15N:14N. The red dashed line indicates the long-term mean over the 22-year period.
A high monthly POC component of the flux was observed in August 2003, November 2011, January 2012 and June 2015 with values above 100 up to a maximum of 225 mg m−2 d−1 reached in 2015 (Figure 2B). The long-term mean of POC over the study period was 22 mg m−2 d−1. Monthly POC values above the long-term mean were observed in February 2007, March 2001, April (2003, 2005, 2013), May (2006, 2010, 2011), July (2004, 2007), September 2019, November (2017, 2020) and December 2015. In addition, the POC component of the flux remained above the long-term mean throughout 2016 with elevated values in June, September and November. The POC contributed about 31% to the total particle flux (Supplementary Figure S2A). The monthly PON component of the flux had high values in August 2003, November 2011, January 2012 and June 2015 of 24, 21, 28, 23 mg m−2 d−1, respectively (Figure 2C). The long-term mean of PON was around 3 mg m−2 d−1. Monthly PON values exceeded the long-term mean in February 2007, March 2001, April (2002, 2003, 2005, 2013), July (2004, 2007), September 2019, November (2017, 2020) and December (2004, 2015). The PON remained above the long-term mean in 2016 with maximum values of 13, 14 and 18 mg m−2 d−1 in June, September and November, respectively. The PON contributed around 5% to the total particle flux (Supplementary Figure S2B). The long-term mean of PSi over the observation period was 8 mg m−2 d−1 contributing around 8% to the total particle flux (Figure 2D and Supplementary Figure S2C). The absolute maximum of the PSi component of the flux occurred in January 2012 reaching 149 mg m−2 d−1. High PSi values above the long-term mean were observed in January 2010, February (2005, 2007, 2013), March (2000), April (2002, 2003, 2005, 2013), May (2006, 2010), June (2008, 2015), August 2003, November (2007, 2010, 2011) and December 2004. Overall, the monthly POC, PON and PSi components of the total particle flux (Figures 2B–D) followed a similar pattern in most years with elevated values occurring around the same time period. The most striking difference appeared in the PSi component of the flux, which pronounced maxima were missing since 2016 to the end of the time series. However, no clear trend could be derived for the PSi component of the total particle flux, other components (POC and PON) or the total particle flux itself due to the high variability observed in the data over time.
The monthly C:N ratio showed a large variability (Figure 2E). Its long-term mean over the 22 year-period was 9. The C:N ratio was at its minimum in May 2001 and December 2017 with values close to 5. The maximum values were observed in January/February 2000, July 2004 and March/May 2019, in all of them with values around 15. There are some years in which the monthly C:N ratio was mostly below the long-term mean throughout the year as in 2007, 2008, 2013 and 2017, but in 2004 and 2019 it was the opposite. The stable isotope composition of organic carbon in the total particle flux varied on monthly basis between −32‰ and −19‰, with a long-term mean over the studied period of −25‰ (Figure 2F). Sinking material with slightly heavier δ13C values (around −23‰) was usually collected between June and September e.g., in 2002, 2004, 2006, 2008, 2010, 2011 and 2020, while sinking material with relatively light δ13C values (around −26‰) sank between January and March in 2000, 2001, 2002, 2019. The isotope composition of organic carbon in the total particle flux was above the long-term mean throughout the year in 2004, 2008 and 2011, and below for the entire year between 2013 and 2015. The nitrogen isotope composition of the total particle flux varied on monthly basis from −5‰ to 12‰, with a long-term mean over the 22-year period of 4‰ (Figure 2G). The nitrogen isotope composition reached minimum values of −5, −4, −3 and −2‰ in May 2001, July 2001, November 2008 and December 2008, respectively. The monthly nitrogen isotopic composition mostly fluctuated around 4‰, but in 2001 and 2003 the δ15N became lighter for the whole year. Since 2014, the monthly nitrogen isotopic composition has increased slightly, reaching isotopically heavy values (above 10‰) in November 2014, April 2016, January 2017 and February 2018. In general, the particle flux and its components showed large variability with values that stood out during certain periods without a recognizable pattern, indicating the need for further analysis at other time scales.
3.2 Inter-annual variability
The annual total particle flux showed significant inter-annual variability over the 22-year study period with three distinct periods of above-average flux. The first period occurred in 2003 with a moderate particle flux in March followed by the highest recorded particle flux of the entire time series in July of that year (Figure 2A; Figure 3A). The second period occurred 9 years later, driven by the elevated particle flux observed in January 2012. The last period took place 3 years later with above-average particle flux in June 2015 and throughout 2016. The annual total particle flux varied widely, ranging from 11 to 450 mg m−2 d−1, with the lowest and highest values observed in 2014 and 2003, respectively.
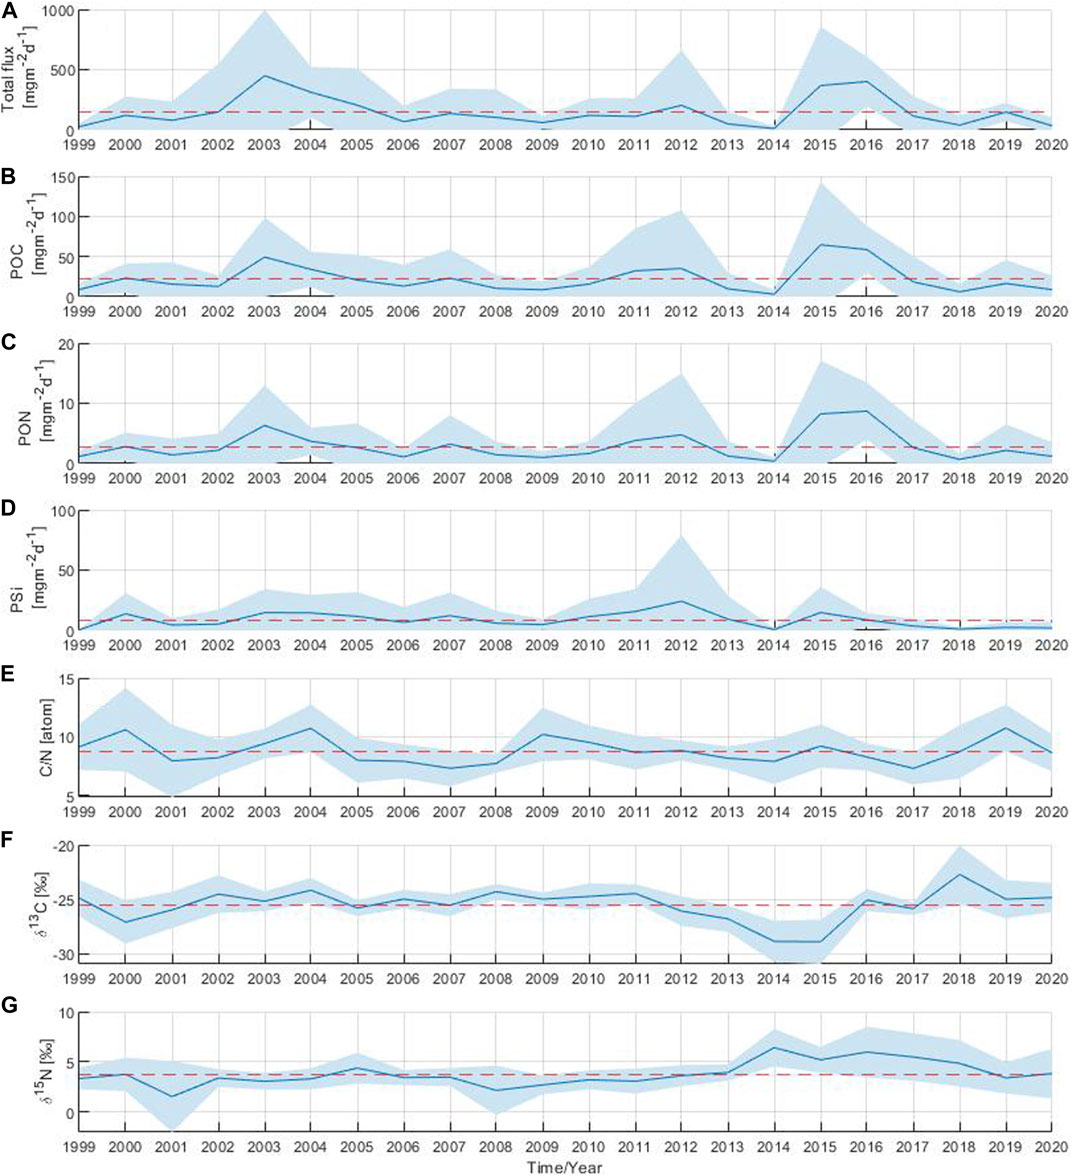
FIGURE 3. Annual mean of (A) total particle flux, (B) particulate organic carbon, (C) particulate organic nitrogen, (D) biogenic silica, (E) C:N ratio, stable isotope ratios (F)13C:12C and (G)15N:14N. The shaded area corresponds to the standard deviation. The red dashed line indicates the long-term mean over the 22-year period.
The annual POC and PON components of the flux showed similar periods of above-average flux as those observed in the annual total particle flux (Figures 3B,C). In years with high total particle flux such as 2003, 2012, 2015 and 2016, the annual POC component of the flux reached maximum values ranging from 35 to 65 mg m−2 d−1 (Figure 3B). The lowest annual POC value was observed in 2014 with a value of 3 mg m−2 d−1. The maximum annual PON value was observed in 2016, followed by the annual PON component of the flux in 2015, 2003 and 2012 with values of 9, 8, 6 and 5 mg m−2 d−1, respectively (Figure 3C). The minimum annual PON value occurred in 2014 (around 0.4 mg m−2 d−1), as was also previously observed for the total particle flux and the POC component of the flux. The annual PSi component of the flux fluctuated between 1 and 24 mg m−2 d−1 (Figure 3D). The absolute maximum of the annual PSi component of the flux was observed in 2012 reaching a value of 24 mg m−2 d−1. Maximum annual PSi values were also observed in 2015 and 2003 with values around 15 mg m−2 d−1. However, since 2016, the annual PSi component of the flux has decreased and remained at minimum values well below the average.
The annual C:N ratio fluctuated between 7 and 11 throughout the 22 year-period (Figure 3E). The maximum annual C:N ratios were observed in 2000, 2004, 2009 and 2019 close to 11, while the minimum annual values were found in 2007 and 2017 around 7. For the δ13C, a single annual maximum of −23‰ was identified in 2018, whereas annual minimum values of −29‰ were observed in 2014 and 2015 (Figure 3F). Minimum annual δ15N values of 2‰ were observed in 2001 and 2008 (Figure 3G). A single δ15N annual maximum of 6‰ was observed in 2014. An increase in δ15N annual values above the long-term mean (4‰) was observed from 2014 to 2018.
3.3 Seasonal variability
Monthly means of the total particle flux and its components were grouped by season. The contribution of each component by season was calculated as a percentage of the total seasonal signals (Table 2). The summer season had the largest contribution to the total particle flux with about one-third (31%) of the sinking material, followed by winter (27%), spring (24%) and autumn (19%). The seasonal particle flux was between 118 and 193 mg m−2 d−1. The seasonal variability of POC and PON followed a similar pattern, with higher POC and PON values in summer and autumn than in winter and spring. Seasonal means of POC and PON reached the highest values during summer, reflecting the contribution of the summer bloom to the seasonal particle flux. The POC contribution to the seasonal particle flux ranged between 16 and 30 mg m−2 d−1, whereas the PON component of the flux fluctuated between 2 and 4 mg m−2 d−1. The minimum and maximum of the seasonal PSi were between 6 and 11 mg m−2 d−1, with the maximum PSi values occurring in winter (December, January and February) and spring (March, April and May). The C:N ratio fluctuated between 8 and 9.5, with the highest value in winter and the lowest in summer. The seasonal PSi and C:N ratio showed an opposite pattern to the seasonal contributions of POC and PON in terms of the occurrence of maxima and minima, indicating the species succession from diatoms to cyanobacteria in the Gotland Basin (see Table 2). The seasonal mean of δ13C varied slightly between seasons with values between −26‰ and −25‰, whereas the seasonal mean of δ15N reached higher values in winter and spring rather than in summer and autumn. The maximum and minimum seasonal δ15N values were observed in spring (4.5‰) and autumn (3.2‰), respectively.
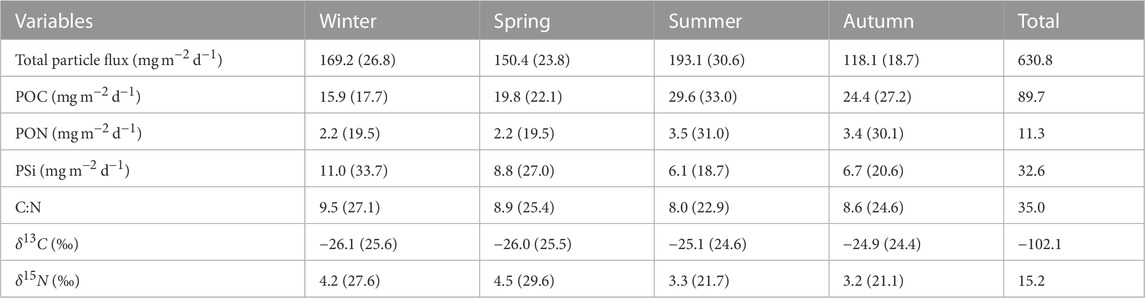
TABLE 2. Seasonal means of total particle flux, POC, PON, PSi, C:N, δ13C and δ15N from sediment traps moored at 180 m depth in the Gotland Basin between 1999 and 2020. The seasons were divided into spring (March-May), summer (June-August), autumn (September-November) and winter (December-February) (Supplementary Figure S4). Values in parentheses correspond to the percentage of the variable with respect to its total value over all seasons.
3.4 Annual cycle
The annual cycle of the total particle flux revealed three discernible periods with high values in April, July and November, reaching up to 97 mg m−2 d−1 in the Gotland Basin (Figure 4A). From December to March, there was a low particle flux with high variability. The annual cycle of the POC component of the flux reached maximum values in November (25 mg m−2 d−1), followed by April and July with values of 16 and 9 mg m−2 d−1, respectively (Figure 4B). The minimum POC in the flux (below 3 mg m−2 d−1) was mostly observed between January and March. Maximum PON values of 2.1, 1.1 and 2.6 mg m−2 d−1 occurred in April, July and November, respectively, with large variability observed throughout the year (Figure 4C). The POC and PON components of the flux showed similar patterns to the total particle flux (Figures 4A–C), coinciding the maximum values during the same months. The PSi in the flux had two maxima, the first one in April (4 mg m−2 d−1) and the second one in November (6 mg m−2 d−1) (Figure 4D). The PSi component of the flux was characterized by low values and variability in the remaining months, especially between June and September, with minimum PSi values occurring in July. The C:N ratio showed a bimodal cycle with values fluctuating between 7 and 9. The highest C:N ratios were observed above the molar Redfield ratio (106:16) between November and February, while the lowest C:N ratios occurred in July, August and September (Figure 4E). The changes in the annual cycle of the total particle flux and POC marked the contribution of phytoplankton blooms to the sinking material in the Gotland Basin, while PON, PSi and C:N ratio reflected the species succession from silica-rich species like diatoms to species able to fix nitrogen from the atmosphere such as cyanobacteria and vice versa (as in autumn), with the corresponding effects on the nutrient pool (Figure 4E and Supplementary Figure S3). Nitrate concentration showed high values prior to the onset of spring (March-April), summer (June) and autumn (October) blooms in the Gotland Basin with the additional contribution of nitrogen fixed by cyanobacteria observed in August (Supplementary Figure S3A). Phosphate showed a similar behavior with higher pre-bloom phosphate concentrations in April, June and September (Supplementary Figure S3B). Thus, periods of nutrient depletion and availability in the water column are driven by the development of blooms and species succession throughout the annual cycle.
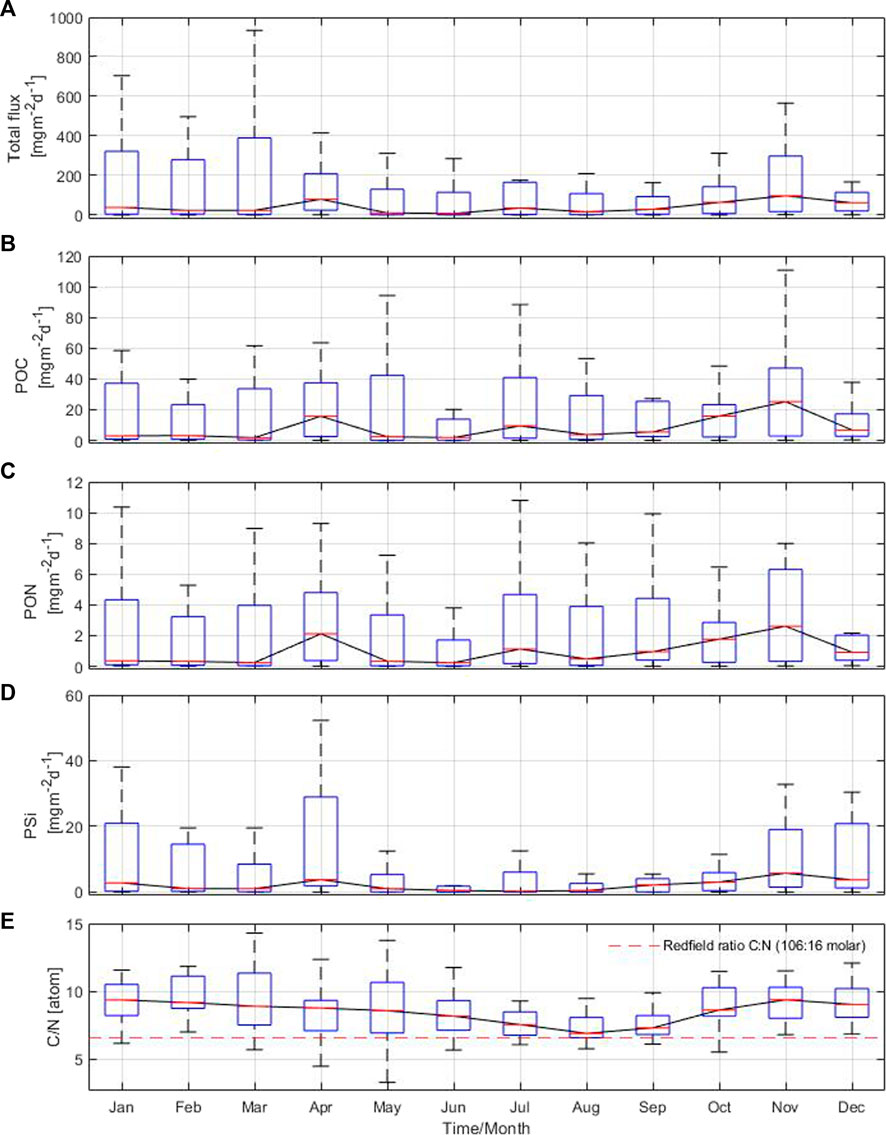
FIGURE 4. Annual cycle based on monthly means of (A) total particle flux, (B) particulate organic carbon, (C) particulate organic nitrogen, (D) biogenic silica and (E) C:N ratio from sediment traps moored at 180 m depth in the Gotland Basin between 1999 and 2020. The central red line in each box represents the median over 22 years. The bottom and top edges in each box indicate the 25th and 75th percentiles, respectively. The whiskers extend to the most extreme data points.
3.5 Changes in the isotopic composition of organic carbon and nitrogen at 180 m depth
The relationship between δ13C and δ15N reflected the primary production cycle in the Gotland Basin (Figure 5). In January and February, both δ13C and δ15N remained uniform, likely related to low primary production resulting from the limited light and low temperature during winter. In March, primary production started as shown by the light δ13C (CO2 uptake) and heavy δ15N values (nutrient consumption). During April and June, δ15N values were similar reflecting the nitrate-δ15N value as the nitrogen pool was fully consumed, but primary production continued with slightly heavier δ13C values during this period. The gradual change to heavier δ13C and lighter δ15N values between June and August indicated the occurrence of the cyanobacteria bloom characterized by high nitrogen fixation and CO2 uptake rates, the latter dominated initially more by the increase in temperature than by primary production (Montoya et al., 2002; Schneider et al., 2017). From September onwards, δ15N started to return to heavier values and δ13C to lighter values as a result of the change in the phytoplankton community from cyanobacteria to diatoms and the transport of deeper CO2-enriched water to the surface (Schneider et al., 2017).
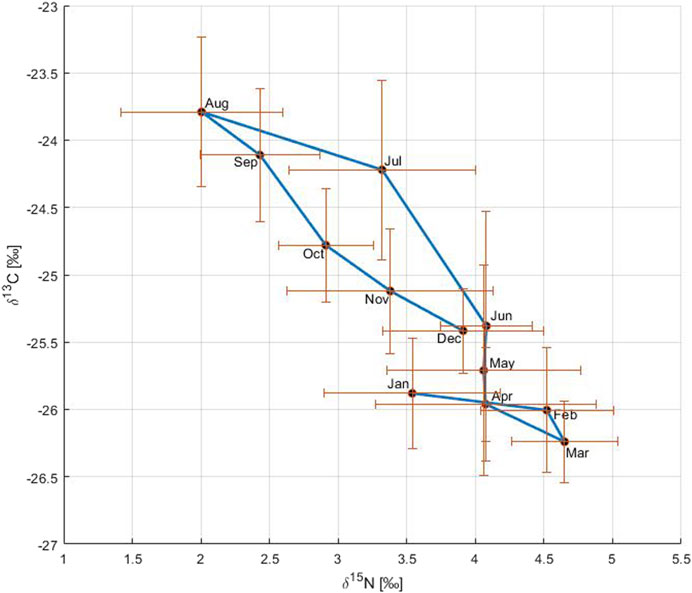
FIGURE 5. Relationship between δ13C and δ15N on an annual basis. The circles connected by a blue solid line correspond to monthly means of carbon and nitrogen stable isotopes over the period 1999 to 2020. The blue solid line shows the annual cycle of changes in both δ13C and δ15N. The bars represent the standard deviation with respect to the variable on the axis.
4 Discussion
Primary production in the surface layer is reflected in the seasonality of the particle flux (Antia et al., 2001; Leipe et al., 2008). Diatoms dominate the export of organic particles in spring and autumn, whereas cyanobacteria do this in summer (Schneider et al., 2017). The total particle flux and its components showed a large variability in the long-term and inter-annual time scale as previously observed (Figures 2, 3). The main particle flux events were observed in 2003, 2012 and 2015, which coincided with the periods of Major Baltic Inflow events (MBIs) in the Baltic Sea (Mohrholz et al., 2015). The transport of large amounts of saline water into the Baltic Sea has an influence on the environmental conditions below the permanent halocline and therefore on the exported particles (Voss et al., 1997). A MBI occurred in January 2003, ending the stagnation period that had started in 1995. A moderate inflow event took place in 2011, followed by one of the strongest MBIs ever observed in December 2014. The MBIs are the sole source of deep water renewal and ventilation in the central Baltic basins, transporting water rich in oxygen, nutrients and salinity. The inflow pushes the anoxic water partly also across sills into the northern basins. Hence, phosphate-rich water is advected into shallower depths and leads to stronger cyanobacteria blooms after the inflow, which may contribute to the high particle flux observed with sediment traps in 2003, 2012 and 2015. The effects of the MBI in December 2014 were mainly observed in the Gotland Basin in June 2015, with the drastic increase in the total particle flux and its components in this year. In 2016, the inflow’s effects were still noticed with above average flux throughout the year.
According to Struck et al. (2004), lateral advection is the main source of particulate matter in the Gotland Basin. They compared the annual accumulation rates of organic carbon, nitrogen and phosphorus at 241-m depth with the vertical particle flux between summer of 1996 and 1997. Schneider et al. (2000) supports these results, suggesting that an additional source of carbon, e.g., via advection, is necessary to balance the carbon budget in the Gotland Basin. This might imply that the high particle flux observed in 2003, 2012 and 2015 in the Gotland Basin may have been generated by advection processes likely fueled by MBIs. However, Cisternas-Novoa et al. (2019) associate the high transfer efficiency of POC to aggregates of particulate organic matter and manganese oxide-like (MnOx-like) particles formed after the inflow of oxygen-rich water into the Gotland Basin in 2015. Thereby, aggregates containing MnOx-like particles and organic matter may reach the sediments more quickly changing the biogeochemistry of the water column, the composition and vertical flux of particulate material. Further research is needed to confirm these hypotheses since they are beyond the scope of this study.
The seasonal and annual cycle of the particle flux in the Gotland Basin is led by primary production, which is reflected in the chlorophyll a concentration. Chlorophyll a, which serves as a proxy for primary production, exhibited a similar annual cycle to that of the particle flux and its components. The highest concentrations of chlorophyll a were observed in April and July with values of 6 and 4 μg L−1, respectively (Figure 6A). These elevated values in chlorophyll a coincided with the occurrence of spring and summer blooms as well as high particle flux in the Gotland Basin (Supplementary Figure S1). The slow decline in chlorophyll a concentration after the summer bloom may be related to the occurrence of the diatom bloom in autumn (Wasmund and Uhlig, 2003), as shown by the increase in total particle flux, POC, PON and PSi in November. Chlorophyll a concentration was low with little variability between December and February, likely associated to light limitations and deep mixing during this period of the year. Sinking material produced by the spring and autumn blooms was enriched in PSi, indicating the presence of diatoms in the sinking particles. This observation was confirmed by the moderate chlorophyll a concentration and high POC and PSi in April and November (Figures 4B–D), as well as by microscopic analyses (Schneider et al., 2017).
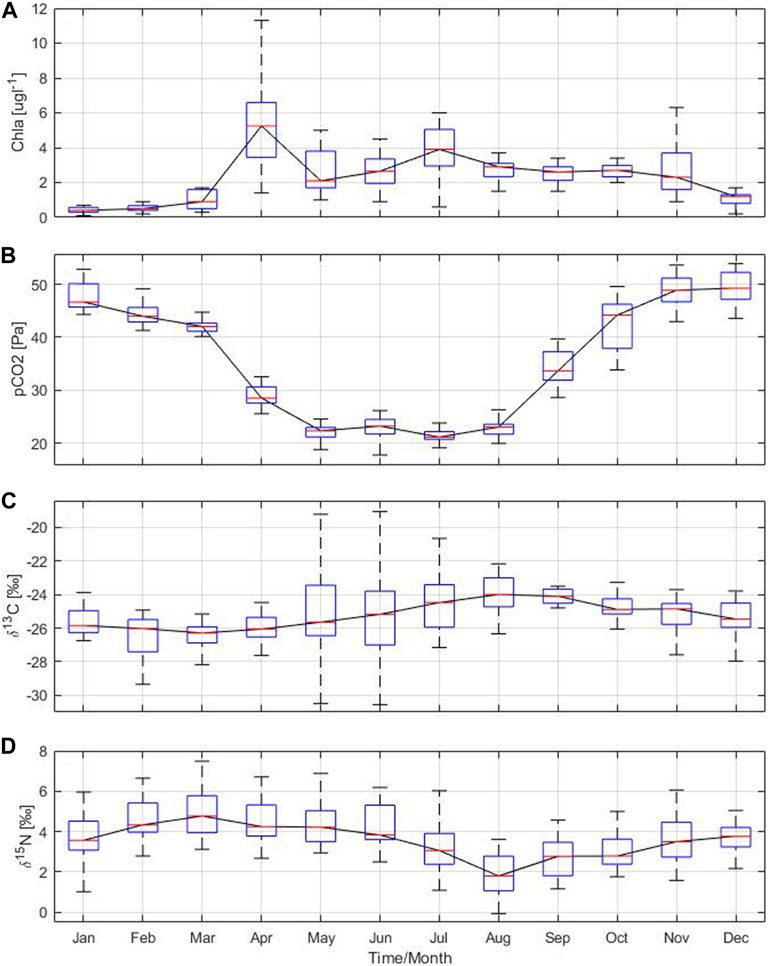
FIGURE 6. Annual cycle based on monthly means of (A) chlorophyll a and (B) partial pressure of carbon dioxide derived from water column measurements, stable isotope ratios (C)13C:12C and (D)15N:14N from sediment traps moored at 180 m depth in the Gotland Basin between 1999 and 2020. The central red line in each box represents the median over 22 years. The bottom and top edges in each box indicate the 25th and 75th percentiles, respectively. The whiskers extend to the most extreme data points.
Seasonal production was mainly dominated by carbon over-consumption, with a minor shift to nitrogen over-consumption in summer as observed in Figure 4E (Körtzinger et al., 2001). Thus, the C:N ratio allowed to identify three stages in the nutrient pool cycle where nitrate deficiency leads to a less nitrogen-rich organic matter (Körtzinger et al., 2001). First, a high concentration of inorganic nutrients was observed in March after winter-time mixing, followed by their consumption by the spring bloom in April (Spilling et al., 2019). Second, the contribution of isotopically light atmospheric nitrogen by cyanobacteria to the nutrient pool was observed in July. Lastly, there was a recharge of the nutrient pool due to remineralization and re-supply of nutrients by e.g., wind induced mixing in November. There is a correlation between the sinking material, its isotopic composition and nutrients. The total particle flux correlated positively and significantly with its components POC, PON and PSi. Therefore, a higher/lower total particle flux leads to a higher/lower POC, PON and PSi (see Table 3). The POC in the flux is most strongly correlated with PON and PSi because nitrogen and silicate are essential elements used by diatoms and other planktonic species for growth and cell wall formation, which also explains the strong correlation observed between PON and PSi. Chlorophyll a showed a positive and significant correlation with PON, indicating its relationship with the summer bloom containing mainly diazotrophic cyanobacteria. The negative but significant relationship between chlorophyll a and δ15N confirmed that the summer bloom formed by cyanobacteria species like Nodularia spumigena and Aphanizomenon flos-aquae contributes light δ15N values to the Gotland Basin, as also indicated by Struck et al. (2000) using sediment cores from the southern and central Baltic Sea. Overall, the total particle flux and its components POC, PON and PSi were weakly correlated with δ13C and δ15N. Comparing the mean annual nitrogen isotope composition estimated by Struck et al. (2004) (3.7‰) and by Korth et al. (2014) (3.6‰ ± 1‰) with the long-term mean over the 22-year period from this study (4‰), it seems that the source of nitrogen in the sediment traps remains unchanged. This implies, first, that most of the nitrogen comes from the surface particle flux (i.e., pelagic origin) rather than from nitrogen-enriched coastal waters, as suggested by Struck et al. (2004); Voss et al. (2005). Second, the depleted nitrogen signal is spreading through all marine organisms (from bacteria to fish) (Voss et al., 2005; Wannicke et al., 2013; Lesutiene et al., 2014; Karlson et al., 2015).
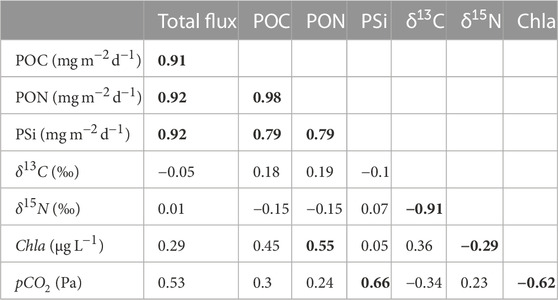
TABLE 3. Pearson correlation coefficients of monthly mean total particle flux, POC, PON, PSi, δ13C, δ15N from sediment traps moored at 180 m depth, and chlorophyll a and partial pressure of carbon dioxide derived from water column measurements in the Gotland Basin between 1999 and 2020. Correlations that are statistically significant are shown in bold (p-value
Changes in the isotopic composition of organic matter are driven by internal and external factors. Internal factors include cell size, growth, membrane permeability and enzymatic pathways for carbon uptake (Khim et al., 2018, and references therein), while external factors comprise the isotopic signature of dissolved inorganic carbon (DIC) and/or degradation routes of organic particles (Altabet, 1988; Altabet and Francois, 1994). Carbon isotopes indicate the content of dissolved CO2 in the water column [CO2(aq)], as the dissolved CO2 is the main source of carbon for most of phytoplankton species (Rau, 1994). Therefore, patterns of δ13C may be attributed to the seasonal changes in CO2(aq) as has also been observed in other ecosystems (Lehmann et al., 2004). The partial pressure of carbon dioxide showed a bimodal behavior with minimum values close to 20 Pa between May and August and maximum values around 50 Pa between November and January (Figure 6B). CO2(aq) concentration in surface water is inversely related to δ13C values in marine plankton because the carbon isotopic values reflect the increase in δ13C-DIC (Lehmann et al., 2004) in response to CO2 reduction by phytoplankton uptake (Figures 6B,C). There was no correlation found between pCO2 and δ13C and δ15N. However, pCO2 had a moderate to strong correlation with the total particle flux, PSi and chlorophyll a, implying that more phytoplankton production results in more CO2 uptake and therefore higher δ13C-CO2(aq) in surface water and higher particle flux (see Table 3). The low δ13C values observed during spring (Figure 6C) may be related to cold, CO2-rich surface water due to the temperature-dependent fractionation between bicarbonate and dissolved CO2. δ13C values during summer and autumn suggest low CO2-levels due to ongoing production, which was confirmed by direct measurements of CO2 in the surface waters of the Gotland Sea (Thomas, 1997). δ13C and δ15N followed an opposite pattern (Figures 6C,D). While the δ13C is at its minimum in March, the δ15N is at its maximum, and vice versa in August.
δ15N-PON at 180 m water depth reflects the pattern of pelagic production, as there is a shift from higher to lower δ15N values between spring, summer and autumn (Leipe et al., 2008). δ15N increased in February and March as a result of fractionation during nitrate uptake (Altabet, 1988). This may theoretically result in a fractionation of up to 12‰ - depending on the species - as described by Montoya and Mccarthy (1995). However, the euphotic zone is an open system in which such a fraction is not expressed, and therefore the fractionation is much lower as such reflected in the sinking organic matter (Voss et al., 1996). Thus, the high δ15N values in spring during the high production period may be related to the residual nitrate produced during nutrient utilization by phytoplankton (Altabet and Francois, 1994). In summer, decreasing δ15N values in organic matter indicated nitrogen fixation, as nitrate contains more δ15N than elemental nitrogen used by cyanobacteria (Leipe et al., 2008). Thereby, the variation in δ15N values seems seasonal reflecting the transition from spring to summer driven by the species succession. During the transition from summer to autumn (August/September), the δ15N reached its minimum value just after the maximum in cyanobacteria (Figure 6D). During late autumn and winter, degradation processes of organic matter and the resupply of nitrate to the surface waters re-establish a δ15N value of nitrate that is around 3.7‰ and nicely reflect the δ15N of the spring bloom sinking to the bottom. Additional factors that may contribute to changes in δ15N include nitrogen contributions from terrestrial sources, phytoplankton growth and/or degradation, lateral transport of particles and particle residence times (Khim et al., 2018, and references therein). The δ15N values in sinking material are mostly impacted by the signatures of nitrate reflected in phytoplankton and by nitrogen fixation.
Analyses of sediment traps from the Gotland Basin by Wasmund et al. (1998) and Cisternas-Novoa et al. (2019) reveled that the POC consisted of recently produced biogenic material. Therefore, the high POC flux observed in spring, summer and autumn may be related to the new production from the surface layer. Groetsch et al. (2016) and Beltran-Perez and Waniek (2022) confirmed based on in-situ observations and modeling results the occurrence of phytoplankton blooms during these periods of the year. The averaged climatology of phytoplankton biomass revealed explicit seasonality with spring blooms mostly composed of diatoms from March to April and summer blooms of cyanobacteria during June and August. An autumn diatom bloom also occurred, but of lesser magnitude compared to the spring and summer blooms. Additionally, Kahru et al. (2016) reported the spatial variability of primary production in terms of estimated chlorophyll a concentration using satellite images in the Baltic Sea. It was observed that the high summer POC in the flux corresponded to seasonal peaks in the estimated chlorophyll a concentration, indicating the seasonal presence of cyanobacteria blooms. The apparent increase in particle flux matches a general increasing trend in net sediment accumulation rates of carbon and nitrogen over the past 50 years in the Baltic Sea (Leipe et al., 2008). Based on sediment cores from the southern and central Baltic Sea, Struck et al. (2000) reported a clear shift to higher organic carbon concentrations and δ13C values over the last 30 years in the Gotland Basin. Although high productivity in the Gotland Basin has been observed in the last decades, the tendency to heavier δ13C values was not observed on either the long-term or inter-annual time scales analyzed in this study.
According to Leipe et al. (2008), the annual carbon flux between 1995 and 2003 was dominated by diazotrophic cyanobacteria in the Gotland Basin, which made up to two-thirds of the yearly flux. Nowadays, the export of carbon to the sea floor is still dominated by cyanobacteria, but its contribution to the total flux is close to one-third (Table 2). Several studies have reported earlier and longer cyanobacteria blooms in the Baltic Sea (Kahru and Elmgren, 2014; Kahru et al., 2016; Beltran-Perez and Waniek, 2022), which may partly explain the reduction observed in this study. However, there is still no consensus about the increase or decrease of cyanobacteria blooms in the coming years, their future remains uncertain considering the continuous changes in the environment (Wasmund and Uhlig, 2003; Meier et al., 2019). Given the decrease in PSi flux since 2016, there appears to be a shift from diatoms to dinoflagellates as the dominant bloom species. However, since both species may co-occur and therefore contribute to the particle flux, it is not possible to determine from the available sediment trap data whether the sinking material originates from diatoms or dinoflagellates to confirm this hypothesis. Using data on phytoplankton abundance and biomass (1979–1999) and chlorophyll a (1979–2000) from surface samples, Wasmund and Uhlig (2003) found a decrease in diatoms during spring blooms in the Gotland Sea and an upward trend in dinoflagellate abundance in all seasons in the Baltic Proper. Similarly; Klais et al. (2011) reported that the proportion of dinoflagellates relative to diatoms increased between 1995 and 2004, especially in the Gulf of Bothnia (from 0.1 to 0.4) and the Gulf of Finland (from 0.4 to 0.6). Shifts in the dominant bloom forming species have significant effects on the functioning of the Baltic Sea ecosystem. Changes in the food web may be expected as the efficiency of energy transfer to higher trophic levels might be reduced due to the timing of food availability (match-mismatch hypothesis, Smith and Hollibaugh, 1993; Winder and Schindler, 2004). A shift in phytoplankton may also inhibit the survival of zooplankton and fish, affecting the recruitment of larvae, as larval spawning continues to match the original timing of the bloom prior to changes (Cole, 2014; Gittings et al., 2018). Therefore, shifts in the phytoplankton community along with current environmental changes may have potentially large impacts on the Baltic Sea. Overall, the long-term sediment trap data used in this study allowed us to identify changes in sinking particles that would not otherwise be possible, given the difficulty of modeling and predicting the behavior of sinking particles with such high variability over time.
5 Conclusion
Sinking particles provide the major connection between processes in the upper part of the water column and sediments. In spite of the high temporal variability in the particle flux and its components, three distinct periods driven by primary production at the surface were identified in the Gotland Basin. Sinking material in spring and autumn is derived from the diatom bloom. The large particle export from the surface in summer is driven by the growth of nitrogen fixing cyanobacteria, mainly of the species Aphanizomenon and Nodularia, which take up and store phosphate for use when it is already depleted from the water column. The contribution of isotopically light atmospheric nitrogen by diazotrophic cyanobacteria to the sinking material is evidenced by the changes in the δ15N values in summer, reflecting as well the succession between diatom and cyanobacteria species in the annual cycle. The succession in the phytoplankton community and the occurrence of phytoplankton blooms are important factors determining the seasonal pattern of sinking material in the Gotland Basin. Unusual high particle flux from surface blooms occurred in 2003, 2012 and 2015, showing the capability of sediment traps to reflect changes in primary production that would otherwise be difficult to observe due to the patchiness of these events. There are some indications that MBIs lead to increased particle flux after their occurrence. However, a comprehensive analysis of the effects of MBIs throughout the water column is still needed.
The Baltic Sea has undergone significant changes, the reduction in carbon exported to the sediment in summer compared to past decades is a sign of these changes. Sinking particles may be influenced by factors not directly related to the surface, such as mixing or advection processes within the water column. In addition, the complete pathway of nutrient sources is unknown, as a low δ15N signal in the sinking material may be related to multiple processes such as nitrogen fixation, N-release or ammonium uptake. Therefore, while the findings of this study provide valuable insights into the carbon exported at different seasons and years linked to the development of phytoplankton blooms in the Gotland Basin, they should be interpreted in the context of the broader changes that are occurring in the Baltic Sea. Furthermore, given the temporal variability exhibited by the particle flux and its components, this study demonstrates the importance of continued monitoring of the Baltic Sea and the challenges of modeling and making future predictions in such a highly variable system.
Data availability statement
The data sets analyzed in this study can be found in: the Global Ocean Surface Carbon product provided by the Copernicus Marine Service (https://data.marine.copernicus.eu/products), the oceanographic database of the Leibniz Institute for Baltic Sea Research Warnemünde (IOWDB and ODIN) (https://odin2.io-warnemuende.de/) and the SHARKweb database administered by the Swedish Meteorological and Hydrological Institute (SMHI) (https://sharkweb.smhi.se/hamta-data/).
Author contributions
FP was the scientist in charge of the sediment trap deployments for many years and provided the bulk parameters of the sediment trap data set. MV and IL provided the isotope data, MV also contributed to their interpretation and discussion. JW supervised all data analyses and interpretation of results for this study. OB-P explored, harmonized and analyzed the data, prepared the figures and wrote the manuscript. All authors contributed to the article and approved the submitted version.
Funding
The Funding was granted by the DAAD program: Research Grants—Doctoral Programmes in Germany 2018/19, as well as by the Leibniz Institute for Baltic Sea Research Warnemünde (IOW) and the Bundesamt für Seeschifffahrt und Hydrographie (BSH) as part of the long-term data collection and monitoring program of the Baltic Sea.
Acknowledgments
The authors would like to thank the DAAD and the IOW for the funding and support provided during the preparation of the manuscript. The authors thank the BSH for the funding provided during the collection of data over the past decades, the scientists and technicians involved in deploying the sediment trap during various cruises and the ship crews for their technical support. Special thanks to Uwe Hehl and Regina Hansen, without their effort over decades this data set would not exist. We would also like to thank the reviewers for their constructive comments, which helped us to improve the quality of the manuscript.
Conflict of interest
The authors declare that the research was conducted in the absence of any commercial or financial relationships that could be construed as a potential conflict of interest.
The handling editor GH declared a shared committee with the author MV at the time of review.
Publisher’s note
All claims expressed in this article are solely those of the authors and do not necessarily represent those of their affiliated organizations, or those of the publisher, the editors and the reviewers. Any product that may be evaluated in this article, or claim that may be made by its manufacturer, is not guaranteed or endorsed by the publisher.
Supplementary material
The Supplementary Material for this article can be found online at: https://www.frontiersin.org/articles/10.3389/feart.2023.1171917/full#supplementary-material
References
Almroth-Rosell, E., Eilola, K., Hordoir, R., Meier, H. E., and Hall, P. O. (2011). Transport of fresh and resuspended particulate organic material in the Baltic Sea - a model study. J. Mar. Syst.87, 1–12. doi:10.1016/j.jmarsys.2011.02.005
Altabet, M. A., and Francois, R. (1994). Sedimentary nitrogen isotopic ratio as a recorder for surface ocean nitrate utilization. Glob. Biogeochem. Cycles8, 103–116. doi:10.1029/93GB03396
Altabet, M. A. (1988). Variations in nitrogen isotopic composition between sinking and suspended particles: Implications for nitrogen cycling and particle transformation in the open ocean. Deep Sea Res. Part A, Oceanogr. Res. Pap.35, 535–554. doi:10.1016/0198-0149(88)90130-6
Antia, A. N., Koeve, W., Fischer, G., Blanz, T., Schulz-Bull, D., Scholten, J., et al. (2001). Basin-wide particulate carbon flux in the Atlantic Ocean: Regional export patterns and potential for atmospheric CO 2 sequestration. Glob. Biogeochem. Cycles15, 845–862. doi:10.1029/2000GB001376
Belkin, I. M. (2009). Rapid warming of large marine ecosystems. Prog. Oceanogr.81, 207–213. doi:10.1016/j.pocean.2009.04.011
Beltran-Perez, O. D., and Waniek, J. J. (2022). Inter-annual variability of spring and summer blooms in the eastern Baltic Sea. Front. Mar. Sci.9. doi:10.3389/fmars.2022.928633
Blomqvist, S., and Heiskanen, A. (2001). “A systems analysis of the Baltic Sea ecological studies,” in Chall. Sediment. Balt. Sea Editors F. Wulff, L. Rahm, and P. Larsson (Berlin, Heidelberg: Springer).
Blomqvist, S., and Larsson, U. (1994). Detrital bedrock elements as tracers of settling resuspended particulate matter in a coastal area of the Baltic Sea. Limnol. Oceanogr.39, 880–896. doi:10.4319/lo.1994.39.4.0880
Bodungen, B. V., Wunsch, M., and Fürderer, H. (1991). Sampling and analysis of suspended and sinking particles in the northern North atlantic Editors D. C. Hurd, and D. W. Spencer63 edn. (Washington, DC: Geophysical Monograph Series, American Geophysical Union), 47–56. doi:10.1029/GM063P0047
Carstensen, J., Conley, D. J., Bonsdorff, E., Gustafsson, B. G., Hietanen, S., Janas, U., et al. (2014). Hypoxia in the Baltic Sea: Biogeochemical cycles, benthic fauna, and management. Ambio43, 26–36. doi:10.1007/s13280-013-0474-7
Christensen, O. B., Kjellström, E., and Zorita, E. (2015). “Projected change — atmosphere,” in Second assess clim chang balt sea basin reg clim stud. Editor T. B. I. A. Team (Cham: Springer), 217–233. doi:10.1007/978-3-319-16006-1
Cisternas-Novoa, C., Le Moigne, F. A., and Engel, A. (2019). Composition and vertical flux of particulate organic matter to the oxygen minimum zone of the central Baltic Sea: Impact of a sporadic North Sea inflow. Biogeosciences16, 927–947. doi:10.5194/bg-16-927-2019
Cole, H. S. (2014). The natural variability and climate change response in phytoplankton. England: University of Southampton. Doctoral dissertation.
Diaz, R. J., and Rosenberg, R. (2008). Spreading dead zones and consequences for marine ecosystems. Sci. (80-. )321, 926–929. doi:10.1126/science.1156401
Eilola, K., Mårtensson, S., and Meier, H. E. (2013). Modeling the impact of reduced sea ice cover in future climate on the Baltic Sea biogeochemistry. Geophys. Res. Lett.40, 149–154. doi:10.1029/2012GL054375
Elmgren, R. (1984). Trophic dynamics in the enclosed, brackish Baltic Sea. Rapp. P.-v. Réun. - Cons. Int. Explor. Mer.1984, 152–169.
Fleming-Lehtinen, V., Laamanen, M., Kuosa, H., Haahti, H., and Olsonen, R. (2008). Long-term development of inorganic nutrients and chlorophyll α in the open Northern Baltic Sea. Ambio37, 86–92. doi:10.1579/0044-7447(2008)37[86:LDOINA]2.0.CO;2
Gittings, J. A., Raitsos, D. E., Krokos, G., and Hoteit, I. (2018). Impacts of warming on phytoplankton abundance and phenology in a typical tropical marine ecosystem. Sci. Rep.8, 2240. doi:10.1038/s41598-018-20560-5
Groetsch, P. M., Simis, S. G., Eleveld, M. A., and Peters, S. W. (2016). Spring blooms in the Baltic Sea have weakened but lengthened from 2000 to 2014. Biogeosciences13, 4959–4973. doi:10.5194/bg-13-4959-2016
Gustafsson, Ö., Andersson, P., Roos, P., Kukulska, Z., Broman, D., Larsson, U., et al. (2004). Evaluation of the collection efficiency of upper ocean sub-photic-layer sediment traps: A 24-month in situ calibration in the open Baltic Sea using 234Th. Limnol. Oceanogr. Methods2, 62–74. doi:10.4319/lom.2004.2.62
Gustafsson, Ö., Gelting, J., Andersson, P., Larsson, U., and Roos, P. (2013). An assessment of upper ocean carbon and nitrogen export fluxes on the boreal continental shelf: A 3-year study in the open Baltic Sea comparing sediment traps, 234Th proxy, nutrient, and oxygen budgets. Limnol. Oceanogr. Methods11, 495–510. doi:10.4319/lom.2013.11
Havenhand, J. N. (2012). How will ocean acidification affect Baltic Sea ecosystems? An assessment of plausible impacts on key functional groups. Ambio41, 637–644. doi:10.1007/s13280-012-0326-x
Heiskanen, A. S., and Kononen, K. (1994). Sedimentation of vernal and late summer phytoplankton communities in the coastal Baltic Sea. Arch. fur Hydrobiol.131, 175–198. doi:10.1127/archiv-hydrobiol/131/1994/175
HELCOM/Baltic Earth (2021). Climate change in the Baltic Sea 2021 fact sheet. Tech. rep. Helsinki, Finland: Helsinki Commission – HELCOM.
Kahru, M., and Elmgren, R. (2014). Multidecadal time series of satellite-detected accumulations of cyanobacteria in the Baltic Sea. Biogeosciences11, 3619–3633. doi:10.5194/bg-11-3619-2014
Kahru, M., Elmgren, R., and Savchuk, O. P. (2016). Changing seasonality of the Baltic Sea. Biogeosciences13, 1009–1018. doi:10.5194/bg-13-1009-2016
Karlson, A. M., Duberg, J., Motwani, N. H., Hogfors, H., Klawonn, I., Ploug, H., et al. (2015). Nitrogen fixation by cyanobacteria stimulates production in Baltic food webs. Ambio44, 413–426. doi:10.1007/s13280-015-0660-x
Khim, B. K., Otosaka, S., Park, K. A., and Noriki, S. (2018). δ13C and δ15N values of sediment-trap particles in the Japan and yamato basins and comparison with the core-top values in the east/Japan sea. Ocean. Sci. J.53, 17–29. doi:10.1007/s12601-018-0003-5
Klais, R., Tamminen, T., Kremp, A., Spilling, K., and Olli, K. (2011). Decadal-scale changes of dinoflagellates and diatoms in the anomalous Baltic Sea spring bloom. PLoS One6, e21567. doi:10.1371/journal.pone.0021567
Korth, F., Deutsch, B., Frey, C., Moros, C., and Voss, M. (2014). Nitrate source identification in the Baltic Sea using its isotopic ratios in combination with a Bayesian isotope mixing model. Biogeosciences11, 4913–4924. doi:10.5194/bg-11-4913-2014
Körtzinger, A., Koeve, W., Kähler, P., and Mintrop, L. (2001). C: N ratios in the mixed layer during the productive season in the northeast atlantic ocean. Deep. Res. Part I Oceanogr. Res. Pap.48, 661–688. doi:10.1016/S0967-0637(00)00051-0
Kremling, K., Lentz, U., Zeitzschel, B., Schulz-Bull, D. E., and Duinker, J. C. (1996). New type of time-series sediment trap for the reliable collection of inorganic and organic trace chemical substances. Rev. Sci. Instrum.67, 4360–4363. doi:10.1063/1.1147582
Kudryavtseva, E. A., Pimenov, N. V., Aleksandrov, S. V., and Kudryavtsev, V. M. (2011). Primary production and chlorophyll content in the southeastern Baltic Sea in 2003-2007. Oceanology51, 27–35. doi:10.1134/S0001437011010103
Lehmann, M. F., Bernasconi, S. M., McKenzie, J. A., Barbieri, A., Simona, M., and Veronesi, M. (2004). Seasonal variation of the δ13C and δ15N of particulate and dissolved carbon and nitrogen in Lake Lugano: Constraints on biogeochemical cycling in a eutrophic lake. Limnol. Oceanogr.49, 415–429. doi:10.4319/lo.2004.49.2.0415
Lehtoranta, J., Ekholm, P., and Pitkänen, H. (2008). Eutrophication-driven sediment microbial processes can explain the regional variation in phosphorus concentrations between Baltic Sea sub-basins. J. Mar. Syst.74, 495–504. doi:10.1016/j.jmarsys.2008.04.001
Leipe, T., Harff, J., Meyer, M., Hille, S., Pollehne, F., Schneider, R., et al. (2008). “Sedimentary records of environmental changes and anthropogenic impacts during the past decades,” in State evol. Balt. Sea, 1952-2005 A detail. 50-Year surv. Meteorol. Clim. Physics, chem. Biol. Mar. Environ. (New Jersey, United States: John Wiley and Sons, Ltd). chap 14 395–439. doi:10.1002/9780470283134.CH14
Lesutiene, J., Bukaveckas, P. A., Gasiunaite, Z. R., Pilkaityte, R., and Razinkovas-Baziukas, A. (2014). Tracing the isotopic signal of a cyanobacteria bloom through the food web of a Baltic Sea coastal lagoon. Estuar. Coast. Shelf Sci.138, 47–56. doi:10.1016/j.ecss.2013.12.017
Mariotti, A. (1983). Atmospheric nitrogen is a reliable standard for natural N abundance measurements. Nature1983, 8–10.
Meier, H. E., Andersson, H. C., Eilola, K., Gustafsson, B. G., Kuznetsov, I., Mller-Karulis, B., et al. (2011). Hypoxia in future climates: A model ensemble study for the Baltic Sea. Geophys. Res. Lett.38, 1–6. doi:10.1029/2011GL049929
Meier, H. E., Dieterich, C., Eilola, K., Gröger, M., Höglund, A., Radtke, H., et al. (2019). Future projections of record-breaking sea surface temperature and cyanobacteria bloom events in the Baltic Sea. Ambio48, 1362–1376. doi:10.1007/s13280-019-01235-5
Meier, H. E., Hordoir, R., Andersson, H. C., Dieterich, C., Eilola, K., Gustafsson, B. G., et al. (2012). Modeling the combined impact of changing climate and changing nutrient loads on the Baltic Sea environment in an ensemble of transient simulations for 1961-2099. Clim. Dyn.39, 2421–2441. doi:10.1007/s00382-012-1339-7
Mohrholz, V. (2018). Major baltic inflow statistics - revised. Front. Mar. Sci.5, 1–16. doi:10.3389/fmars.2018.00384
Mohrholz, V., Naumann, M., Nausch, G., Krüger, S., and Gräwe, U. (2015). Fresh oxygen for the Baltic Sea - an exceptional saline inflow after a decade of stagnation. J. Mar. Syst.148, 152–166. doi:10.1016/j.jmarsys.2015.03.005
Montoya, J. P., Carpenter, E. J., and Capone, D. G. (2002). Nitrogen fixation and nitrogen isotope abundances in zooplankton of the oligotrophic North Atlantic. Limnol. Oceanogr.47, 1617–1628. doi:10.4319/lo.2002.47.6.1617
Montoya, J. P., and Mccarthy, J. J. (1995). Isotopic fractionation during nitrate uptake by phytoplankton grown in continuous culture. J. Plankton Res.17, 439–464. doi:10.1093/plankt/17.3.439
Murray, C. J., Müller-Karulis, B., Carstensen, J., Conley, D. J., Gustafsson, B. G., and Andersen, J. H. (2019). Past, present and future eutrophication status of the Baltic Sea. Front. Mar. Sci.6, 1–12. doi:10.3389/fmars.2019.00002
Nieuwenhuize, J., Maas, Y., and Middelburg, J. (1994). Rapid analysis of organic carbon and nitrogen in particulate materials. Mar. Chem.45, 217–224. doi:10.1016/0304-4203(94)90005-1
Rau, G. (1994). “Variations in sedimentary organic δ13C as a proxy for past changes in ocean and atmospheric CO2 concentrations,” in Carbon cycl glacial ocean constraints ocean role glob chang. Editors R. Zahn, T. Pedersen, M. Kaminski, and L. Labeyrie (Berlin, Heidelberg: Springer).
Reissmann, J. H., Burchard, H., Feistel, R., Hagen, E., Lass, H. U., Mohrholz, V., et al. (2009). Vertical mixing in the Baltic Sea and consequences for eutrophication - a review. Prog. Oceanogr.82, 47–80. doi:10.1016/j.pocean.2007.10.004
Schlitzer, R. (2023). Ocean Data View. Available at: odv.awi.de.
Schneider, B., Dellwig, O., Kuliński, K., Omstedt, A., Pollehne, F., Rehder, G., et al. (2017). “Biogeochemical cycles,” in Biol. Oceanogr. Balt. Sea Editors H. Schubert, and T. Radziejewska (Dordrecht: Springer). doi:10.1007/978-94-007-0668-2_3/COVER
Schneider, B., and Müller, J. D. (2018). “The main hydrographic characteristics of the Baltic Sea,” in Biogeochem. Transform. Balt. Sea (Cham: Springer Oceanography), 35–41. doi:10.1007/978-3-319-61699-5_3
Schneider, B., Nagel, K., and Struck, U. (2000). Carbon fluxes across the halocline in the eastern Gotland Sea. J. Mar. Syst.25, 261–268. doi:10.1016/S0924-7963(00)00020-8
Smetacek, V., von Bodungen, B., Knoppers, B., Peinert, R., Pollehne, F., Stegmann, P., et al. (1984). Seasonal stages characterizing the annual cycle of an inshore pelagic system. Rapp. P.-v. Réun. Cons. Int. Explor. Mer.183, 126–135.
Smith, S. V., and Hollibaugh, J. T. (1993). Coastal metabolism and the oceanic organic carbon balance. Rev. Geophys.31, 75–89. doi:10.1029/92RG02584
Spilling, K., Fuentes-Lema, A., Quemaliños, D., Klais, R., and Sobrino, C. (2019). Primary production, carbon release, and respiration during spring bloom in the Baltic Sea. Limnol. Oceanogr.64, 1779–1789. doi:10.1002/lno.11150
Struck, U., Emeis, K. C., Voss, M., Christiansen, C., and Kunzendorf, H. (2000). Records of southern and central Baltic Sea eutrophication in δ13C and δ15N of sedimentary organic matter. Mar. Geol.164, 157–171. doi:10.1016/S0025-3227(99)00135-8
Struck, U., Pollehne, F., Bauerfeind, E., and Bodungen, B. V. (2004). Sources of nitrogen for the vertical particle flux in the Gotland Sea (Baltic Proper) - results from sediment trap studies. J. Mar. Syst.45, 91–101. doi:10.1016/j.jmarsys.2003.11.012
Tamelander, T., and Heiskanen, A. S. (2004). Effects of spring bloom phytoplankton dynamics and hydrography on the composition of settling material in the coastal northern Baltic Sea. J. Mar. Syst.52, 217–234. doi:10.1016/j.jmarsys.2004.02.001
Tamelander, T., Spilling, K., and Winder, M. (2017). Organic matter export to the seafloor in the Baltic Sea: Drivers of change and future projections. Ambio46, 842–851. doi:10.1007/s13280-017-0930-x
Thomas, H. (1997). Anorganischer Kohlenstoff im Oberflächenwasser der Ostsee. Tech. Rep.23. Institut für Ostseeforschung Warnemünde.
Vahtera, E., Conley, D. J., Gustafsson, B. G., Kuosa, H., Pitkänen, H., Savchuk, O. P., et al. (2007). Internal ecosystem feedbacks enhance nitrogen-fixing cyanobacteria blooms and complicate management in the Baltic Sea. Ambio36, 186–194. doi:10.1579/0044-7447(2007)36[186:IEFENC]2.0.CO;2
Voss, M., Altabet, M. A., and Bodungen, B. V. (1996). δ15N in sedimenting particles as indicator of euphotic-zone processes. Deep. Res. Part I Oceanogr. Res. Pap.43, 33–47. doi:10.1016/0967-0637(95)00099-2
Voss, M., Emeis, K. C., Hille, S., Neumann, T., and Dippner, J. W. (2005). Nitrogen cycle of the Baltic Sea from an isotopic perspective. Glob. Biogeochem. Cycles19, 1–15. doi:10.1029/2004GB002338
Voss, M., Nausch, G., and Montoya, J. P. (1997). Nitrogen stable isotope dynamics in the central Baltic Sea: Influence of deep-water renewal on the N-cycle changes. Mar. Ecol. Prog. Ser.158, 11–21. doi:10.3354/meps158011
Wannicke, N., Korth, F., Liskow, I., and Voss, M. (2013). Incorporation of diazotrophic fixed N2 by mesozooplankton - case studies in the southern Baltic Sea. J. Mar. Syst.117-118, 1–13. doi:10.1016/j.jmarsys.2013.03.005
Wasmund, N., Alheit, J., Pollehne, F., Siegel, H., and Zettler, M. L. (1998). Ergebnisse des Biologischen Monitorings der Ostsee im Jahre 1997 im Vergleich mit bisherigen Untersuchungen. Tech. Rep.32. Institut für Ostseeforschung Warnemünde.
Wasmund, N., Nausch, G., Postel, L., Witek, Z., Zalewski, M., Gromisz, S., et al. (2000). Trophic status of coastal and open areas of the south-eastern Baltic Sea based on nutrient and phytoplankton data from 1993-1997. Tech. Rep.86.
Wasmund, N., and Uhlig, S. (2003). Phytoplankton trends in the Baltic Sea. ICES J. Mar. Sci.60, 177–186. doi:10.1016/S1054-3139(02)00280-1
Keywords: sediment trap, temporal variability, particle flux, phytoplankton, bloom, Baltic Sea
Citation: Beltran-Perez OD, Voss M, Pollehne F, Liskow I and Waniek JJ (2023) Temporal variability of particle flux and its components in the Gotland Basin, eastern Baltic Sea. Front. Earth Sci. 11:1171917. doi: 10.3389/feart.2023.1171917
Received: 22 February 2023; Accepted: 07 June 2023;
Published: 22 June 2023.
Edited by:
Gerhard Josef Herndl, University of Vienna, AustriaReviewed by:
Carolina Cisternas-Novoa, Memorial University of Newfoundland, CanadaSusanne Neuer, Arizona State University, United States
Copyright © 2023 Beltran-Perez, Voss, Pollehne, Liskow and Waniek. This is an open-access article distributed under the terms of the Creative Commons Attribution License (CC BY). The use, distribution or reproduction in other forums is permitted, provided the original author(s) and the copyright owner(s) are credited and that the original publication in this journal is cited, in accordance with accepted academic practice. No use, distribution or reproduction is permitted which does not comply with these terms.
*Correspondence: Oscar Dario Beltran-Perez, oscar.beltran@io-warnemuende.de