

Abstract
During the last deglaciation (18–8 kyr BP), shelf flooding and warming presumably led to a large-scale decomposition of permafrost soils in the mid-to-high latitudes of the Northern Hemisphere. Microbial degradation of old organic matter released from the decomposing permafrost potentially contributed to the deglacial rise in atmospheric CO2 and also to the declining atmospheric radiocarbon contents (Δ14C). The significance of permafrost for the atmospheric carbon pool is not well understood as the timing of the carbon activation is poorly constrained by proxy data. Here, we trace the mobilization of organic matter from permafrost in the Pacific sector of Beringia over the last 22 kyr using mass-accumulation rates and radiocarbon signatures of terrigenous biomarkers in four sediment cores from the Bering Sea and the Northwest Pacific. We find that pronounced reworking and thus the vulnerability of old organic carbon to remineralization commenced during the early deglaciation (∼16.8 kyr BP) when meltwater runoff in the Yukon River intensified riverbank erosion of permafrost soils and fluvial discharge. Regional deglaciation in Alaska additionally mobilized significant fractions of fossil, petrogenic organic matter at this time. Permafrost decomposition across Beringia's Pacific sector occurred in two major pulses that match the Bølling-Allerød and Preboreal warm spells and rapidly initiated within centuries. The carbon mobilization likely resulted from massive shelf flooding during meltwater pulses 1A (∼14.6 kyr BP) and 1B (∼11.5 kyr BP) followed by permafrost thaw in the hinterland. Our findings emphasize that coastal erosion was a major control to rapidly mobilize permafrost carbon along Beringia's Pacific coast at ∼14.6 and ∼11.5 kyr BP implying that shelf flooding in Beringia may partly explain the centennial-scale rises in atmospheric CO2 at these times. Around 16.5 kyr BP, the mobilization of old terrigenous organic matter caused by meltwater-floods may have additionally contributed to increasing CO2 levels.
Export citation and abstract BibTeX RIS

Original content from this work may be used under the terms of the Creative Commons Attribution 3.0 licence. Any further distribution of this work must maintain attribution to the author(s) and the title of the work, journal citation and DOI.
1. Introduction
Circumarctic permafrost soils preserve large quantities of organic matter and presently store twice as much carbon as the atmosphere (Hugelius et al 2014, Strauss et al 2017). Future Arctic warming and sea-level rise are expected to induce widespread permafrost thaw and massive erosion of permafrost along arctic coastlines allowing for microbial degradation of the presently freeze-locked organic matter (Vonk et al 2012, Strauss et al 2017). As a consequence, large quantities of greenhouse gases (CO2 and CH4) may be emitted into the atmosphere thereby amplifying global warming in a positive feedback (Koven et al 2011, Schuur et al 2015, Kleinen and Brovkin 2018). Projections of the magnitude and time-scales of future greenhouse-gas emissions related to permafrost degradation are highly uncertain as the pathways of carbon in changing permafrost landscapes are insufficiently understood (Schuur et al 2015).
Investigating the role of permafrost decomposition for the atmospheric carbon pool during past episodes of climate change helps to better constrain the projected permafrost feedback during the 21st century and beyond.
During the last deglaciation (8–18 kyr BP) atmospheric CO2 concentrations rose by ∼90 ppm (Marcott et al 2014) while atmospheric Δ14C concurrently declined by ∼400‰ (Reimer et al 2013). Large parts of these changes occurred in three sudden steps (at 16.5, 14.6, and 11.5 kyr BP), during which CO2 rose by 10–15 ppm within 100–200 years (Marcott et al 2014). Emissions of old CO2 resulting from a combination of different dominantly marine processes are thought to have driven these deglacial atmospheric changes (e.g. Köhler et al 2005, Brovkin et al 2012). For the three sudden events, the carbon isotopic composition (13C and 14C) of atmospheric CO2 suggests a significant contribution from old terrestrial carbon (Köhler et al 2014, Bauska et al 2016). Since the permafrost extent shrank by ∼50 % over the deglaciation (Lindgren et al 2015)—likely caused by coastal erosion during sea-level rise and permafrost thaw due to warming—the resulting mobilization of old, permafrost carbon is considered the major component of the terrestrial contribution (Ciais et al 2012, Köhler et al 2014, Crichton et al 2016). Yet, the impact of permafrost on the atmospheric carbon is poorly resolved (Lindgren et al 2018). Most studies investigating the contributions of terrestrial carbon to the atmospheric changes are indirect, as they rely on interpreting atmospheric records with carbon-cycle models (Köhler et al 2014, Bauska et al 2016, Crichton et al 2016). However, the assumed timing of carbon release from degrading permafrost is very poorly constrained by proxy data as deglacial records of carbon mobilization are very sparse (Tesi et al 2016, Winterfeld et al 2018, Martens et al 2019).
Biomarker records from the Laptev, Chukchi and Okhotsk Seas provide evidence for rapid thaw-induced mobilization of permafrost carbon and subsequent river discharge (Tesi et al 2016) as well as for coastal erosion of permafrost associated with rapid sea-level rise (Winterfeld et al 2018, Martens et al 2019).
Experiments with carbon-cycle models suggest that flooding of the extensive East Siberian Arctic, Chukchi and Bering Shelves during melt-water pulses 1A and 1B (mwp-A1, mwp-1B) may have substantially contributed to the centennial-scale rises in CO2 at 14.6 and 11.5 kyr BP (Köhler et al 2014, Winterfeld et al 2018). Hence, a key region to understand the deglacial permafrost-carbon feedback is Beringia, the area stretching from the Lena River in Siberia to the Mackenzie River in Alaska (figure 1). During the last glacial, when sea-level low stands exposed the East Siberian Arctic, Bering and Chukchi Shelves, the Bering Land Bridge connected Alaska and Siberia (figure 1) to form an extensive, largely unglaciated land mass (Balascio et al 2005, Barr and Clark 2012) where thick, carbon rich deposits (Yedoma) accumulated over the late Pleistocene (Strauss et al 2017). During the last glacial maximum (LGM), continuous permafrost extended from Siberia (including the Kamchatka Peninsula) over the Bering Land Bridge to Alaska (Lindgren et al 2015). Over the deglaciation continuous permafrost became discontinuous and sporadic over wide areas in Alaska and completely disappeared from the Bering Land Bridge and the lowlands in Kamchatka (Brown et al 1998, Lindgren et al 2015). As such, Beringia may have been relevant for both, the sea-level associated component of the deglacial permafrost feedback (Köhler et al 2014, Winterfeld et al 2018) and greenhouse-gas emissions related to inland permafrost thaw induced by warming. So far, evidence has been obtained for massive remobilization of permafrost carbon from the Lena River catchment (at 11.5 kyr BP) (Tesi et al 2016) as well as from the East Siberian Arctic and Chukchi Shelves (after ∼9.5 and around ∼13 kyr BP) (Keskitalo et al 2017, Martens et al 2019).
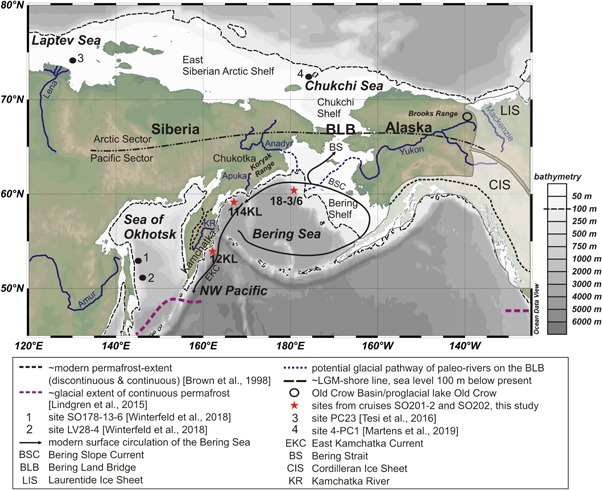
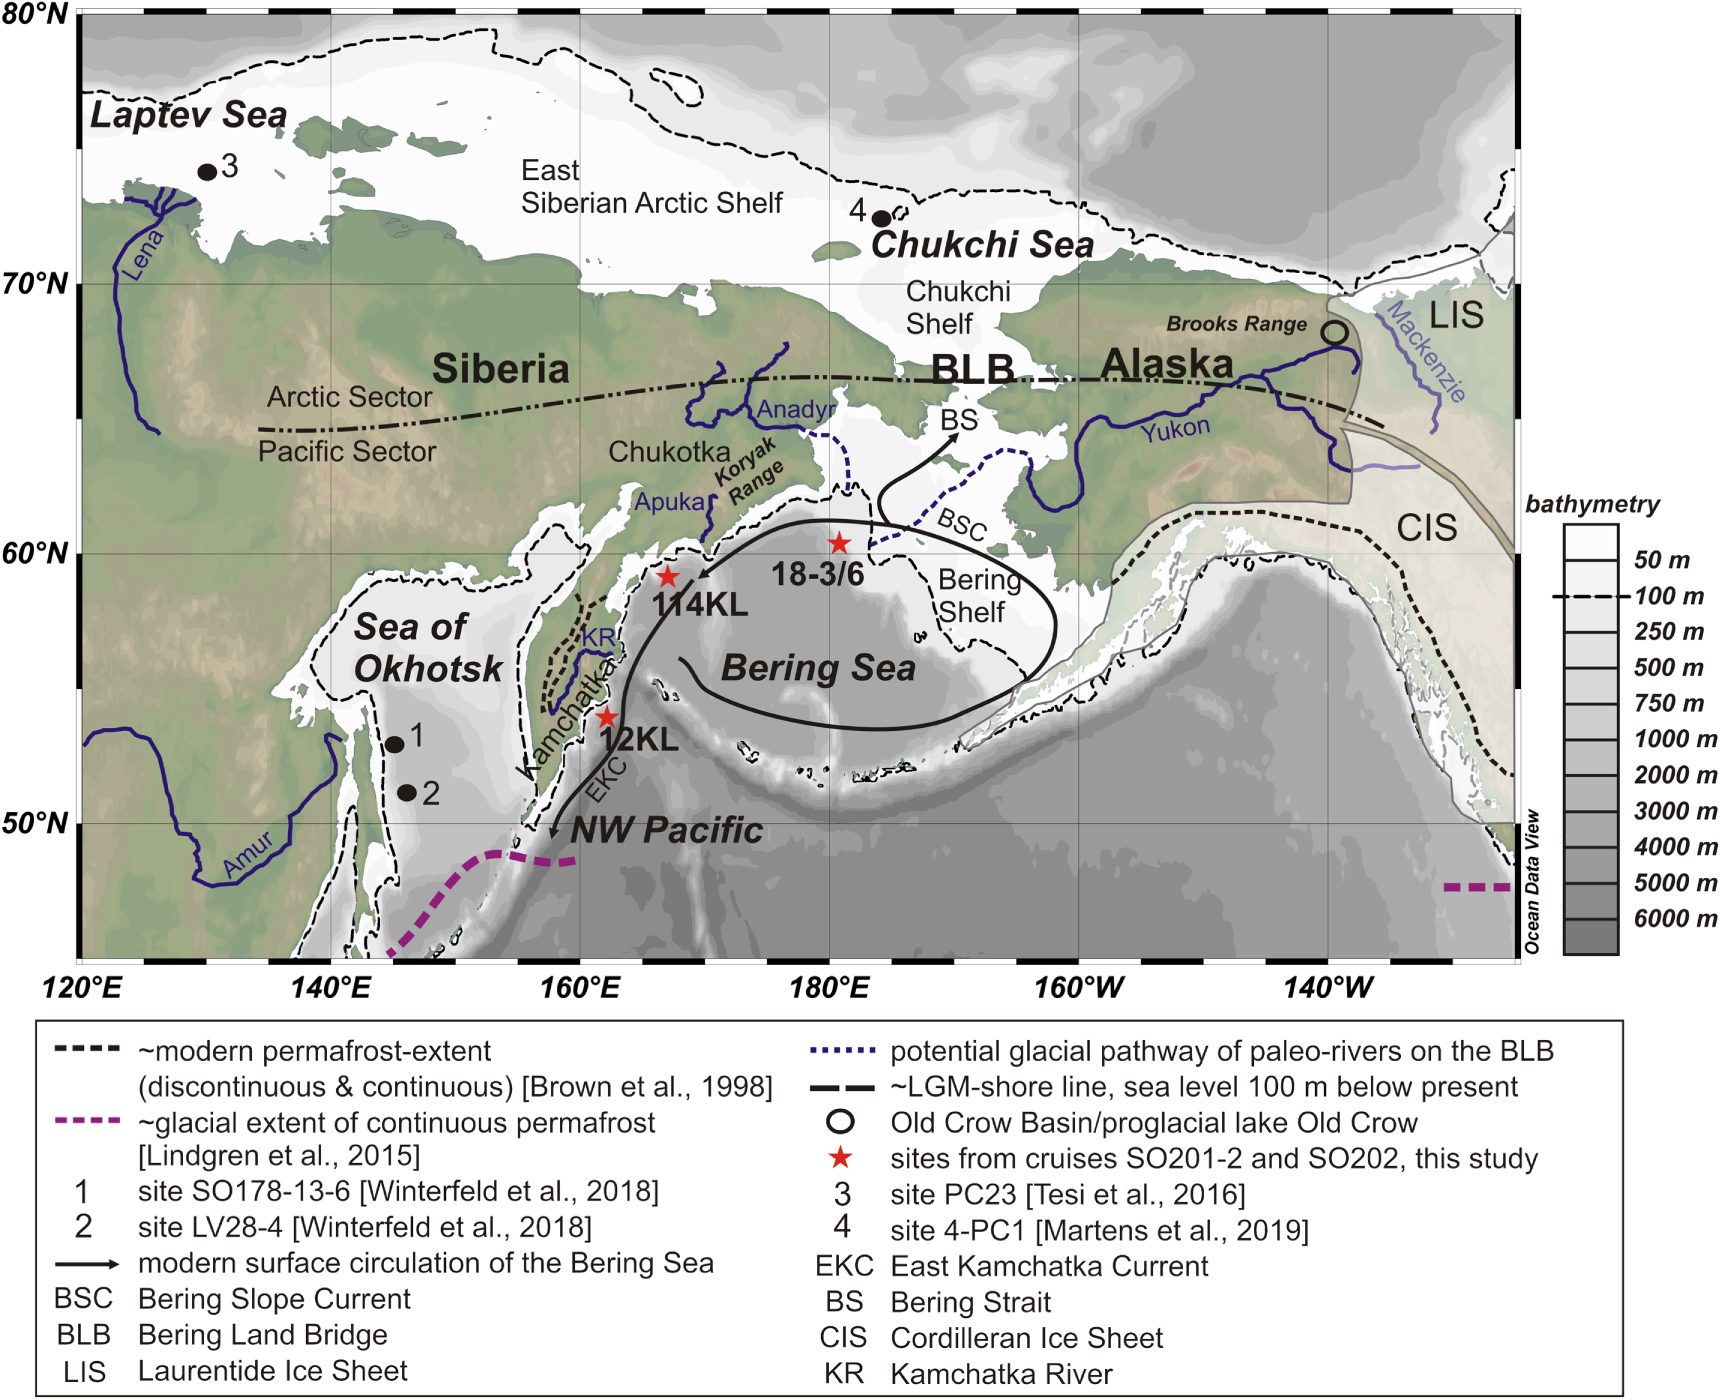
Figure 1. Map of the study area. White shaded areas mark the positions of the American Ice Sheets during the LGM. Additionally, mountain glaciation existed in the Brooks Range, the Koryak Range and on the Kamchatka Peninsula. For details, the reader is referred to (Balascio et al 2005, Barr and Clark 2012). The annotations '12KL' and '114KL' refer to cores SO201-2-12KL and SO201-2-114KL, '18-3/6' to cores SO202-18-3 and SO202-18-6. The map was created using Ocean Data View (Schlitzer 2018).
Download figure:
Standard image High-resolution imageYet, the timing of carbon mobilization from degrading permafrost in this region still remains elusive since existing records do not reach beyond ∼13 kyr BP (Tesi et al 2016, Keskitalo et al 2017, Martens et al 2019) and some are not continuous (Keskitalo et al 2017, Martens et al 2019).
Here, we trace permafrost erosion in Beringia's Pacific sector (figure 1) since the LGM by analyzing terrigenous biomarkers and their radiocarbon signature in three marine sediment cores from the Bering Sea (cores SO202-18-3, SO202-18-6 and SO201-2-114KL, figure 1) and one from the subarctic Northwest Pacific (core SO201-2-12KL, figure 1). The catchments of these cores comprise the drainage basins of the Yukon and paleo-Anadyr Rivers (i.e. Alaska, the Bering Land Bridge and Chukotka (cores SO202-18-3/SO202-18-6)), the southern flanks of the Koryak Range and adjacent lowlands, drained by the small Apuka River in Siberia (core SO201-2-114KL), and the Kamchatka Peninsula drained by the Kamchatka River (core SO201-2-12KL).
2. Scientific approach
Degradation of permafrost is accompanied by various complex processes comprising destabilization of hillslopes, lake shores and riverbanks (including large thaw slumps), active-layer deepening, development of thermokarst lakes and wetlands as well as intensified overland drainage (e.g. Vonk and Gustafsson 2013). As a consequence, fluvial transport of permafrost-derived particulate organic matter amplifies. Moreover, rising sea-level and warming can induce massive destruction of permafrost along coastlines by physical erosion and thermal collapse of coastal bluffs (Vonk et al 2012, Jones et al 2018). Together these processes increase the deposition rates of permafrost carbon in marine sediments (Vonk and Gustafsson 2013). At the same time, remineralization of the unlocked organic carbon takes place in thawed soils, lakes, during riverine transport, in the marine water column and during cross-shelf transport prior to final burial (Gustafsson et al 2011, Vonk et al 2012, 2014, Bröder et al 2018). Terrigenous biomarkers deposited in marine sediments are usually older than the respective deposition age due to intermediate storage in terrestrial reservoirs (e.g. soils) or the duration of transport processes prior to final burial (Kusch et al 2010, Bröder et al 2018). The so-called pre-depositional ages describe the age of terrigenous biomarkers at the time of deposition (Winterfeld et al 2018) providing an estimate on the time-scales of those reservoir effects. Due to the long preservation in frozen soils, permafrost-derived organic matter found in marine sediments is identifiable by high pre-depositional ages (Vonk et al 2012, Winterfeld et al 2018). Thus, mass accumulation rates combined with pre-depositional ages of terrigenous biomarkers in marine sediments are qualitative proxies of past permafrost decomposition and indicate the vulnerability of permafrost carbon to remineralization (Tesi et al 2016, Winterfeld et al 2018).
In order to reconstruct the timing of deglacial permafrost retreat in Beringia we determine the mass accumulation rates of high molecular weight n-alkanoic acids (hereafter referred to as fatty acids) and high molecular weight n-alkanes (hereafter referred to as alkanes), both constituents of epicuticular wax layers (leaf wax lipids) of higher land plants (Eglinton and Hamilton 1967). Additionally, branched glycerol dialkyl glycerol tetraethers (brGDGTs) are quantified. BrGDGTs are bacterial biomarkers and in coastal marine sediments serve as indicator for input of soil and riverine organic matter (Hopmans et al 2004, DeJonge et al 2015). Compound-specific radiocarbon analysis of fatty acids and alkanes is performed to determine pre-depositional ages (Winterfeld et al 2018). The Paq (Ficken et al 2000), a proxy of the relative contribution of aquatic to terrestrial plants, is applied to trace wetland development in the hinterland as this is a characteristic feature of degrading permafrost landscapes (AMAP 2012, Lindgren et al 2018). Existing records on thermokarst lake expansion (Walter Anthony et al 2014) are used as indicators of thaw-induced processes in the hinterland.
Since the Yukon-River catchment holds various fossil, thermally degraded (mature) deposits (e.g. coal or oil shales, e.g. Alaska State Office 2009), 14C-depleted organic matter eroded from those ancient deposits is a potential source of old terrigenous biomarkers next to thermally immature Yedoma. In order to distinguish between contributions of petrogenic and Yedoma-derived carbon we analyze the fractional abundances of homohopane isomers—bacterial biomarkers—(fββ, see supplementary material available online at stacks.iop.org/ERL/14/085003/mmedia) which can be used as indicator of thermal maturity of organic matter in the geological record (e.g. Farrimond et al 1998). The fββ is combined with the carbon preference indices of alkanes and fatty acids (CPIalk; CPIFA,) which are also common indicators of degradation and thermal maturity (Bray and Evans 1961, Kvenvolden 1966). For more analytical details including core chronologies, the reader is referred to the supplementary material.
3. Results and discussion
3.1. The LGM (23–19 kyr BP)
Pre-depositional ages of the alkanes and fatty acids deposited during the LGM at the three core location are >16 000 years (figures 2(i)–(k), table 1). Nowadays, leaf-wax lipids found off Arctic drainage basins underlain by continuous permafrost as well as lipids deposited off Siberian coastlines that currently undergo massive erosion are several thousand years old due to substantial contributions of ancient organic matter from Yedoma (∼5500–∼13 000 years; Lena, Kolyma, Indigirka Rivers (Feng et al 2013, Gustafsson et al 2011); up to ∼18 000 years off eroded coasts (Vonk et al 2014)). By contrast, lipids deposited off permafrost-free catchments are much younger (∼900–4400 years) (Kusch et al 2010). Thus, the relatively high LGM pre-depositional ages in our cores may indicate large proportions of old organic carbon from ancient Yedoma. This interpretation is in line with relatively high values in fββ, CPIalk and CPIFA (figures 3(b), (d) and (h)) which render old but little degraded organic matter the dominant source for the alkanes and fatty acids at this time. Our CPIalk and CPIFA values (∼4–8) are in the range of CPI-values reported in Siberian and Alaskan Yedoma deposits (3–13) (Sánchez-García et al 2014, Jongejans et al 2018).
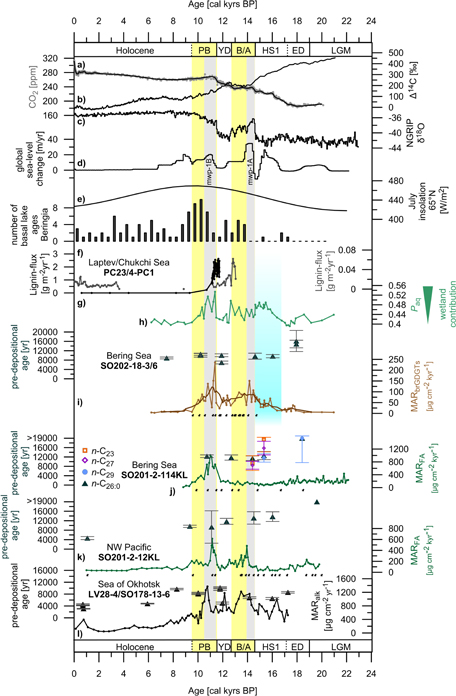
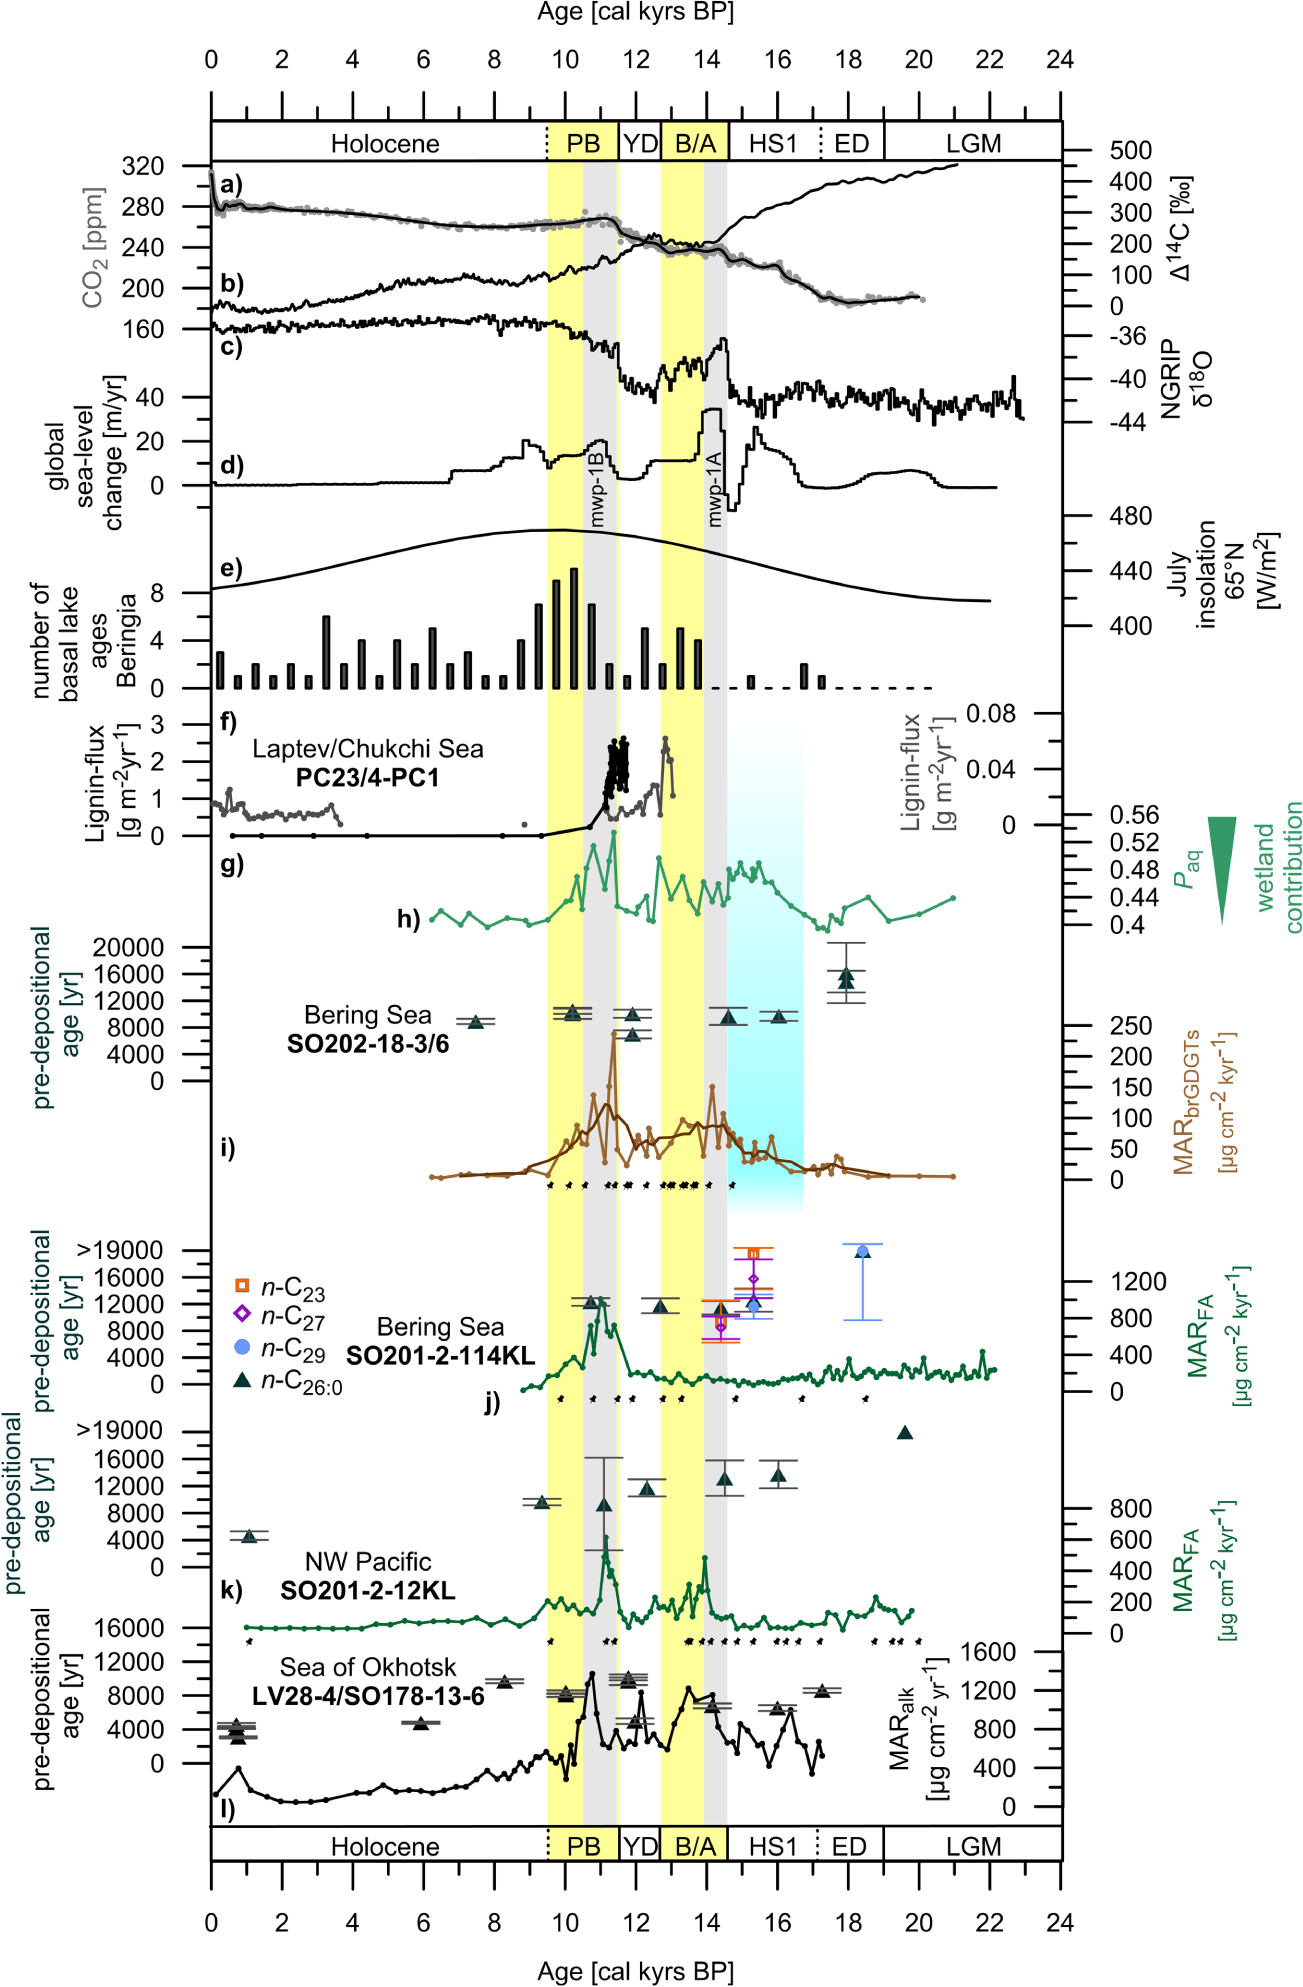
Figure 2 Proxy data to constrain environmental changes in Beringia. (a) Atmospheric CO2 mixing ratio from ice cores as given in Köhler et al (2017). (b) Atmospheric ∆14C according to IntCal13 (Reimer et al 2013). (c) Oxygen isotope record from Greenland ice cores (NGRIP 2004). (d) Global rate of sea-level change (Lambeck et al 2014). (e) July insolation at 65 °N (Berger and Loutre 1991). (f) Compilation of basal ages of thermokarst lakes (number within 500 year bins) in Siberia and Alaska as in Walter Anthony et al (2014). (g) Lignin-flux data from core PC23 (black)/Laptev Sea (Tesi et al 2016) and core 4-PC1 (gray)/Chukchi Sea (Martens et al 2019). Core locations are indicated in figure 1. (h) Paq values from cores SO202-18-3/SO202-18-6 (this study). (i) Age at the time of deposition (pre-depositional age) of the n-C26:0 alkanoic acid together with the mass accumulation rate (MAR) of branched GDGTs (MARΣbrGDGT; ΣbrGDGT-IIIa, brGDGT-IIa, brGDGT-Ia) from cores SO202-18-3/SO202-18-6 (this study). (j) Pre-depositional ages of the n-C26:0 alkanoic acid, n-C29, n-C27, and n-C23 alkanes together with the MAR of fatty acids (MARFA; Σn-C22:0, n-C24:0, n-C28:0, n-C30:0) of core SO201-2-114KL (this study). (k) Pre-depositional ages of the n-C26:0 alkanoic acid given together with the MARFA (Σn-C22:0, n-C24:0, n-C28:0, n-C30:0) of core SO201-2-12KL (this study). (l) Pre-depositional ages of the n-C26:0 alkanoic acid combined with the mass accumulation rate of alkanes (MARAlk; Σn-C27, n-C29, n-C31, n-C33) from cores LV28-4-4 and SO178-13-6 (figure 1) from the Okhotsk Sea (Winterfeld et al 2018). Black dots represent age control points of cores SO202-18-3/SO202-18-6, SO201-2-114KL and SO201-2-12KL (Max et al 2012, Kuehn et al 2014). Yellow shaded areas illustrate the Bølling-Allerød and Preboreal warm-spells that are well documented in Greenland ice core data (NGRIP 2004). The blue rectangle indicates the timing of the deglaciation of the Brooks Range and final drainage of proglacial lake Old Crow, Alaska (Zazula et al 2004 Badding et al 2013). Gray bars mark the timing of mwp-1A and mwp-1B according to (Lambeck et al 2014).
Download figure:
Standard image High-resolution imageTable 1. Compound-specific radiocarbon data of terrigenous biomarkers, i.e. fatty acids (n-C26:0 alkanoic acid) and n-alkanes (n-C23, n-C27 and n-C29 alkanes) from cores SO202-18-6, SO202-18-3, SO201-2-114KL and SO201-2-12KL obtained by accelerator mass spectrometry (AMS).
| Sample depth (cm) | Deposition age (mid-point) (cal kyr BP) | Compound | Corrected F14C ± 1σa | ∆14C ± 1σ (‰)a | Pre-depositional age ± 1σ (cal years) |
|---|---|---|---|---|---|
| SO202-18-6 | |||||
| 55-57 | 7.47 | n-C26:0 | 0.1882 ± 0.0068 | −813 ± 7 | 8900 ± 400 |
| 200-202 b | 10.21 | n-C26:0 | 0.1208 ± 0.0055 | −880 ± 5 | 10 450 ± 450 |
| 200-202 b | 10.21 | n-C26:0 | 0.1287 ± 0.0100 | −872 ± 10 | 10 050 ± 770 |
| 460-462 b | 11.90 | n-C26:0 | 0.1075 ± 0.0059 | −893 ± 6 | 10 050 ± 610 |
| 460-462 b | 11.90 | n-C26:0 | 0.1493 ± 0.0104 | −852 ± 10 | 6960 ± 600 |
| SO202-18-3 | |||||
| 739-742 | 14.60 | n-C26:0 | 0.0857 ± 0.0106 | −915 ± 11 | 9670 ± 1200 |
| 995-997 | 16.03 | n-C26:0 | 0.0730 ± 0.0051 | −928 ± 5 | 9630 ± 680 |
| 1146-1149 b | 17.94 | n-C26:0 | 0.0305 ± 0.0065 | −970 ± 6 | 14 850 ± 1600 |
| 1146-1149 b | 17.94 | n-C26:0 | 0.0282 ± 0.0136 | −972 ± 14 | 16 150 ± 4500 |
| SO201-2-114KL | |||||
| 39-41.5 | 10.72 | n-C26:0 | 0.0925 ± 0.0053 | −908 ± 5 | 12 300 ± 560 |
| 101-103.5 | 12.69 | n-C26:0 | 0.0792 ± 0.0091 | −921 ± 9 | 11 700 ± 1100 |
| 144-146.5 | 14.40 | n-C26:0 | 0.0686 ± 0.0080 | −932 ± 8 | 11 400 ± 1000 |
| 144-146.5 | 14.40 | n-C27 | 0.1006 ± 0.0173 | −900 ± 17 | 8450 ± 1600 |
| 144-146.5 | 14.40 | n-C23 | 0.0968 ± 0.0320 | −904 ± 32 | 9390 ± 3100 |
| 174-176.5 | 15.33 | n-C26:0 | 0.0506 ± 0.0105 | −950 ± 10 | 12 600 ±1700 |
| 174-176.5 | 15.33 | n-C29 | 0.0669 ± 0.0148 | −934 ± 15 | 11 600 ± 1800 |
| 174-176.5 | 15.33 | n-C27 | 0.0396 ± 0.0131 | −961 ± 13 | 15 750 ± 2900 |
| 174-176.5 | 15.33 | n-C23 | 0.0276 ± 0.0150 | −973 ± 15 | 19 400 ± 5200 |
| 301-303.5 | 18.41 | n-C26:0 | <0.0164 | <−985 | >18 000 |
| 301-303.5 | 18.41 | n-C29 | 0.0229 ± 0.0198 | −977 ± 20 | 19 800 ± 10 300 |
| 301-303.5 | 18.41 | n-C27 | <0.0480 | <−952 | >9000 |
| 301-303.5 | 18.41 | n-C23 | <0.1095 | <−891 | >3000 |
| SO201-2-12KL | |||||
| 1-4.5 | 1.07 | n-C26:0 | 0.5389 ± 0.0350 | −465 ± 35 | 4660 ± 630 |
| 203-205 | 9.22 | n-C26:0 | 0.1405 ± 0.0074 | −861 ± 7 | 9640 ± 470 |
| 295-297 | 11.08 | n-C26:0 | 0.1149 ± 0.0736 | −886 ± 74 | 9340 ± 6800 |
| 419-422 | 12.30 | n-C26:0 | 0.0830 ± 0.0105 | −918 ± 10 | 11 700 ± 1200 |
| 609-612 | 14.43 | n-C26:0 | 0.0536 ± 0.0171 | −947 ± 17 | 13 100 ± 2600 |
| 693-696 | 15.90 | n-C26:0 | 0.0410 ± 0.0110 | −959 ± 11 | 13 700 ± 2000 |
| 896-898 | 19.82 | n-C26:0 | <0.0357 | <−965 | >19 000 |
aCorrected for procedure blanks, i.e. contaminating carbon introduced during sample processing, (fatty acids and alkanes) and for methylation (fatty acids only). For methodological details, see supplementary material. The AMS raw data are presented in table S1. bSplit up for vacuum-line handling in order to keep the sample size (i.e. gas volume) appropriate for the AMS measurements. a 70%-split, b 30%-split.

Figure 3. (a) Mass-accumulation rates (MAR) of fatty acids (MARFA; Σn-C22:0, n-C24:0, n-C28:0, n-C30:0) and alkanes (MARAlk; Σn-C23, n-C25, n-C27, n-C29, n-C31, n-C33) of cores SO202-18-3/SO202-18-6 (this study). (b) CPIAlk (n-C23-n-C31 alkanes considered) together with the CPIFA (n-C18:0-n-C28:0 alkanoic acid considered) from cores SO202-18-3/SO202-18-6 (this study). (c) Fractional abundance of the biologic C31ββR-homohopane relative to the diagenetic C31βαS, C31βαR, C31αβS and C31αβR-homohopane isomers (fββ, see methods in the supplementary information for details) in cores SO202-18-3/SO202-18-6 (this study). (d) MARFA and MARAlk of core SO201-2-114KL (this study). (e) CPIAlk together with CPIFA of core SO201-2-114KL (this study). (f) fββ in core SO201-2-114KL (this study). (g) MARFA and MARAlk of core SO201-2-12KL (this study). (h) CPIAlk together with CPIFA of core SO201-2-12KL (this study). (i) fββ in core SO201-2-12KL (this study). The gray bar marks the deglaciation of the Brooks Range and final drainage of proglacial lake Old Crow, Alaska (Zazula et al 2004, Badding et al 2013).
Download figure:
Standard image High-resolution image
Minimal mass accumulation rates of terrigenous biomarkers at all sites (figures 2(i)–(k)) point to relatively little coastal erosion and fluvial discharge of permafrost carbon during the LGM. This is in line with the presence of intact continuous permafrost in Beringia (Lindgren et al 2015), cold sea surface temperatures (SST) in the subarctic North Pacific (Meyer et al 2016, Méheust et al 2018, Maier et al 2018) and a continental climate with very cold winters (Elias 2001, Anderson and Lozhkin 2015).
3.2. The early deglaciation (19–15 kyr BP)
The early deglaciation is characterized by dissimilar patterns in mass accumulation rates of the different biomarkers. All cores record enhanced burial of old alkanes (pre-depositional age: >11 600 years) between ∼16.8 and 15 kyr BP coincident with Heinrich Stadial 1 (figures 2(i)–(k), 3(b), (d) and (h)). Off the Bering Shelf (cores SO202-18-3/SO202-18-6) this increase is accompanied by enhanced burial of old fatty acids (pre-depositional age: >9600 years) and brGDGT while off the Apuka River (core SO201-2-114KL) and Kamchatka (core SO201-2-12KL) the fatty acids do not follow the increase reported in the alkanes but remain constant until ∼14.6 kyr BP (figures 2(i)–(k), 3(a), (d) and (g)). Distinct minima in CPIalk (∼3–4) occur concurrently with the enhanced accumulation of alkanes at all sites (figures 3(b), (e) and (h)). These minima indicate that the amplification of alkane export is associated with a drastic increase in the degree of degradation of the alkanes. By contrast, all cores display constant CPIFA-values across the LGM and early deglaciation (figures 3(b), (e) and (h)) indicating that the degradation state of the fatty acids remains unaltered. These discrepancies in mass-accumulation rates and CPI-values of alkanes and fatty acids imply that the compounds derive from different sources and record different erosion and transport processes.
Possible explanations for the lowering of CPIalk include biogeochemical degradation of alkanes during land-ocean transport (e.g. Bröder et al 2016), changes in the composition of the vegetation (Bush and McInerney 2013), or contributions of petrogenic organic matter (Bray and Evans 1961). At all cores, the minima in CPIalk are congruent with pronounced minima in fββ which decreases by 0.3–0.6 units reaching values as low as 0.2–0.4 (figures 3(c), (f) and (i)). These minima in fββ hint at massive reworking of petrogenic organic matter since the lowering of fββ stems from a distinct increase in the diagenetic C31αβS and C31αβR epimers (figure S1) which form under elevated temperatures during burial (van Duin et al 1997, Farrimond et al 1998) and dominate over the biologic C31ββR isomer in our cores (figure S1). Given the coincidence of the minima in CPIalk and fββ it is most likely that the low CPIalk results from significant contributions of petrogenic alkanes. As the CPIalk values (3–4) still exceed the characteristic value of petrogenic organic matter (∼1) (Bray and Evans 1961), the old alkanes (pre-depositional age of 11 600–19 400 years) deposited at the core locations during the early deglaciation probably derive from a mixture of fossil petrogenic organic matter and old but less degraded material, most likely derived from Yedoma.
In contrast to the alkanes, the source of the fatty acids likely did not change significantly after the LGM considering that the CPIFA is relatively constant across the LGM and the early deglaciation. The high pre-depositional ages of the fatty acids (9600–13 700 years, figures 2(i)–(k)) point to Yedoma deposits as the predominant source, during the LGM as well as the early deglaciation.
As such, the concurrent increase in fatty acids and brGDGT off the Bering Shelf (cores SO202-18-3/SO202-18-6; figures 2(i)–(k) and 3(a)) points to an initial destabilization of permafrost soils and subsequent organic matter remobilization in Alaska and on the Bering Land Bridge. By contrast, low export-rates of old fatty acids from the Apuka catchment and Kamchatka (cores SO201-2-114KL and SO201-2-12KL) indicate that permafrost likely remained stable in these regions throughout the early deglaciation until ∼14.6 kyr BP (figures 2(j) and (k)).
The onset of increased accumulation of old terrigenous biomarkers off the Bering Shelf (cores SO202-18-3/SO202-18-6; figures 2(i) and 3(a)) between ∼16.8 and 15 kyr BP coincides with the beginning retreat of the Cordilleran and Laurentide ice sheets and Alaskan mountain glaciers at ∼19–16 kyr BP (Dyke 2004, Badding et al 2013, Maier et al 2018). A related massive meltwater input into the Yukon River system (Duk-Rodkin and Hughes 1994, Kennedy et al 2010), might have caused severe riverbank erosion of the organic-rich Yedoma deposits in Alaska and on the Bering Land Bridge, subsequently enhancing the accumulation of permafrost-derived organic matter off the Bering Shelf (cores SO202-18-3/SO202-18-6). Also, the enhanced burial of petrogenic carbon at all sites matches the deglaciation of the Brooks Range and the final drainage of the proglacial Lake Old Crow (∼16.8–15 kyr BP; figures 1 and 3) (Zazula et al 2004, Badding et al 2013). As mature deposits have been found at both locations (Barnes 1967, Alaska State Office 2009), it is likely that the massive reworking of petrogenic carbon is associated with these local deglaciation events in Alaska. The simultaneous deposition of petrogenic carbon along the core transect (figures 3(b), (e) and (h)) suggests that the petrogenic fraction of the Yukon load spilled out into the Northwest Pacific, and was likely transported by the counterclockwise surface circulation of the Bering Sea (figure 1). A profound influence from the Yukon load on the fatty acids deposited off the Apuka catchment and Kamchatka (cores SO201-2-114KL and SO201-2-12KL) seems unlikely considering that cores SO201-2-114KL and SO201-2-12KL display a different pattern in mass accumulation rates of fatty acids than cores SO202-18-3/SO202-18-6 (figures 2(i)–(k) and 3(a)).
The increased accumulation of fatty acids and brGDGTs off the Bering Shelf (cores SO202-18-3/SO202-18-6) is also synchronous with a first maximum in the global rate of sea-level rise (Lambeck et al 2014) (figure 2). The synchrony implies that rapid sea-level rise may have eroded permafrost deposits on the Bering Shelf during this interval (figures 2(d) and (i)).
Thawing of permafrost in the hinterland (Lindgren et al 2018) would be another mechanism increasing the fluvial export of old permafrost carbon from the Yukon and Anadyr drainage basins by active layer deepening, thaw-slumps along riverbanks and intensified overland drainage. This view is in line with rising summer insolation (figure 2(d)) (Berger and Loutre 1991) and air temperature in some parts of interior Alaska at this time (Kurek et al 2009). However, cold SST in the Bering Sea and the North Pacific (Meyer et al 2016, Méheust et al 2018) suggest that at least in Pacific Beringia (i.e. the Apuka catchment, Kamchatka, and the southern Bering Land Bridge) low air temperatures may have prevented permafrost from thawing. This is corroborated by the low mass accumulation rates of the fatty acids off the Apuka River mouth and Kamchatka (cores SO201-2-114KL and SO201-2-12KL, figures 2(j) and (k)). Since only very few Beringian thaw lakes date back to the early deglaciation (Walter et al 2007, Walter Anthony et al 2014) (figure 2(f)), thermokarst processes were probably limited in Siberia and Alaska pointing to mostly intact permafrost conditions across Beringia. Paq shows a first maximum in wetland expansion at that time (figure 2(h)) congruent with the intensification of organic matter accumulation off the Bering Shelf (cores SO202-18-3/SO202-18-6; figure 2(i)). This may hint towards beginning ecosystem changes in the permafrost landscape of central/eastern Beringia associated with wetter conditions possibly due to the massive meltwater floods. However, in light of the substantial petrogenic contributions to the alkanes at that time, the Paq—which is built on the relative abundance of alkane homologs (see supplementary material)—probably reflects altered relative abundances of alkane homologs that are associated with the petrogenic portion rather than with changing vegetation. Thus, widespread permafrost decomposition and thaw-induced riverine transport of permafrost carbon during the early deglaciation seem unlikely.
3.3. The late deglaciation (15–9 kyr BP)
Around ∼15 kyr BP prominent increases in fββ and CPIalk (figures 3(b), (c), (e), (f), (h) and (i)) mark the cessation of major petrogenic contributions at all sites. Relatively high values in fββ, CPIalk, CPIFA throughout the late deglaciation and the Holocene (figures 3(b), (c), (e), (f), (h) and (i)) together with high pre-depositional ages (9600–12 300 years; figures 2(i)–(k); table 1) suggest that alkanes and fatty acids dominantly derive from old but less degraded deposits, most likely permafrost soils.
Our records display two major intervals of enhanced inflow of permafrost carbon, that are consistent with the Bølling-Allerød and Preboreal interstadials (figures 2(c), (i)–(k)). Both intervals are found in mass accumulation rates of terrestrial biomarkers off the Bering Shelf (cores SO202-18-3/SO202-18-6) and off Kamchatka (site SO201-2-12KL), while in core SO201-2-114KL only one peak during the Preboreal is detected (figure 2(k)). One may speculate that permafrost remained intact in the small Apuka catchment and adjacent shelves until ∼11.5 kyr BP.
The mass accumulation rates rapidly culminate in two maxima at ∼14.6 and ∼11.5 kyr BP (figures 2(i)–(k)). These coincide with mwp-1A and mwp-1B, (figure 2(d)) suggesting that rapid flooding of the Bering Land Bridge and the Pacific shelves adjacent to Siberia and Kamchatka caused massive coastal erosion of permafrost deposits. This is in accordance with the flooding scenario of the Bering Shelf (Manley 2002) which suggests that most of the shelf was flooded between 15 and 10 kyr BP, consistent with high rates of sea-level rise (Lambeck et al 2014).
The maxima of massive translocation of permafrost carbon are also synchronous with rapid warming in the North-Pacific realm (Kurek et al 2009, Meyer et al 2016, 2017, Méheust et al 2018) during the onsets of the Bølling-Allerød and Preboreal interstadials (NGRIP 2004) at 14.6 and 11.5 kyr BP. Together with elevated summer insolation (Berger and Loutre 1991) warming may have caused widespread permafrost thaw in the Kamchatka, Apuka, Anadyr and Yukon River watersheds. Subsequent fluvial discharge of the mobilized organic matter may have increased the accumulation of terrigenous biomarkers at our sites. Walter Anthony et al (2014) report pronounced expansion of thermokarst lakes in Siberia and Alaska during the interstadials which points to widespread abrupt permafrost thaw across Beringia. Concurrent wetland development in the Anadyr and Yukon catchments—as reported by the increased Paq values (cores SO202-18-3/SO202-18-6, figure 2(h))—suggests generally wetter conditions and possibly amplified overland drainage in Siberia and Alaska. However, the thermokarst-lake expansion peaked during the second half of the warm-spells (figure 2(f)) lagging the abrupt warming and melt-water pulses at 14.6 and 11.5 kyr BP (Reyes and Cooke 2011, Walter Anthony et al 2014) as well as the rapid amplification of biomarker accumulation at our sites (figure 2(d), (i)–(k)) at this time. Thus, widespread thaw-induced mobilization of permafrost carbon and subsequent fluvial transport most likely initiated after the melt-water pulses implying that the maxima in accumulation of permafrost carbon at our sites around 14.6 and 11.5 kyr BP (figures 2(i)–(k)) are probably primarily controlled by coastal erosion associated with mwp-1A and mwp-1B. Thaw-induced mobilization of permafrost carbon in the drainage basins of the rivers likely contributed to the elevated mass-accumulation rates of the biomarkers shortly after the melt-water pulses.
Additionally, riverbank erosion of permafrost due to retreating American ice sheets (Keigwin et al 2018) and mountain glaciers on Kamchatka (Bigg et al 2008) may have proceeded throughout the late deglaciation.
For the Younger Dryas (12.9-11.5 kyr BP), all cores indicate a slackening of the accumulation of terrigenous biomarkers (figures 2(i)–(k)) which coincides with reduced thaw lake development (Walter Anthony et al 2014), wetland vegetation (lowered Paq, cores SO202-18-3/SO202-18-6) and rates of sea-level change. Thus, permafrost decomposition in the interior and along the coast likely weakened, probably in response to cooling in the North Pacific realm (Meyer et al 2016, Méheust et al 2018) and decelerated sea-level rise (Lambeck et al 2014).
All cores display highest mass accumulation rates during the Preboreal indicating that the remobilization of permafrost carbon reached its maximum at this time (figures 2(i)–(k)). Coastal erosion of permafrost may have become maximal during mwp-1B since the flooding scenario for the Bering Shelf shows that mwp-1B inundated a larger area than mwp-1A (Manley 2002). Thermokarst-lake expansion (Walter Anthony et al 2014) and wetland extent (Paq; cores SO202-18-3/SO202-18-6, figures 2(f) and (h)) became maximal (Reyes and Cooke 2011). This observation likely attests to maximal permafrost thaw in Siberia and Alaska considering that during the Preboreal summer insolation and regional temperatures reached the highest values since the LGM (Berger and Loutre 1991, Kurek et al 2009, Meyer et al 2016).
3.4. The Holocene after 9–0 kyr BP
After the Preboreal (∼9–10 kyr BP), all cores display a distinct decrease and subsequent constancy of the mass-accumulation rates of terrigenous biomarkers (figures 2(i)–(k)) suggesting that the remobilization of old permafrost-derived organic carbon diminished and stabilized. Coastal erosion rates likely decreased as the inundation of the Bering Shelf was almost completed around 10 kyr BP (Manley 2002) after the opening of the Bering Strait (∼11 kyr BP; Jakobsson et al 2017) and mwp-1B (Lambeck et al 2014). Thermokarst lake (Walter Anthony et al 2014) and wetland formation (Paq cores SO202-18-3/SO202-18-6; figure 2(h)) weakened and stabilized after the Preboreal potentially marking a thorough reduction of inland permafrost thaw and the related discharge of permafrost carbon to our sites (figures 2(i)–(k)).
During the late Holocene, the pre-depositional ages found off Kamchatka (∼4500 years; core-top core SO201-2-12KL; figure 2, table 1) are significantly younger than during the deglaciation and the LGM (>6000 years; figure 2(k), table 1). The decrease in age is probably due to the rather limited permafrost extent on Kamchatka at present as most of the peninsula is permafrost free with only a few patches of sporadic and alpine permafrost (Brown et al 1998).
3.5. Implications for the carbon cycle
We identify two major intervals of massive land-ocean transfer of old permafrost carbon across Beringia's Pacific coast that occur during the Bølling-Allerød and Preboreal warm-spells. We find that these two intervals initiated rapidly in response to abrupt sea-level rise during mwp-1A and mwp-1B and likely received contributions from thaw-induced processes in the hinterland shortly after the melt-water pulses. Our mass-accumulation rates indirectly mark intervals of enhanced release of ancient CO2 from degrading permafrost (Winterfeld et al 2018) as exposure of previously freeze-locked carbon to microbial activity in the rivers, the marine water column and at the sediment-water interface of the ocean might have resulted in its rapid decomposition.
As such, the centennial-scale amplification of permafrost erosion during mwp-1A and mwp-1B is probably indicative of similarly rapid CO2 emissions into the atmosphere. Within the uncertainties of the chronologies (< ±300 years) (Max et al 2012, Kuehn et al 2014) this rapid carbon release is synchronous with the rapid rises in atmospheric CO2 at 14.6 and 11.5 kyr BP (Marcott et al 2014) (figure 2(b)). The same chronology of processes causing permafrost decomposition as found in our study (coastal erosion followed by inland permafrost thaw and river discharge) has also been inferred from biomarker records from the Okhotsk Sea off the Amur River mouth (Winterfeld et al 2018). The consistency implies that at least in the North-Pacific realm sea-level rise was a major control for abrupt remobilization of permafrost carbon at 14.6 and 11.5 kyr BP. As for the Arctic sector of Beringia, deglacial reworking of old permafrost carbon caused by inundation of the Chukchi Shelf (at ∼13 kyr BP, figure 2(f)) has been recently reported (Martens et al 2019). Yet, it remains unresolved whether Beringia's Arctic shelves (East Siberian Arctic and Chukchi Shelves, figure 1) released carbon at 14.6 and 11.5 kyr BP along with the Pacific shelves (Martens et al 2019). Tesi et al (2016) document massive fluvial discharge of permafrost carbon from the Lena River into the Laptev Sea around 11.5 kyr BP suggesting that thaw-induced degradation of permafrost in drainage basin of the Lena coincided with rapidly rising atmospheric CO2 levels (figure 2(f)). Altogether these data confirm model-based hypothesis according to which carbon release from coastal as well as inland permafrost decomposition contributed substantially to the rapid deglacial rises in atmospheric CO2 (Köhler et al 2014, Winterfeld et al 2018).
Extrapolating biomarker data from the small Okhotsk-Sea shelves to the extensive Bering, Chukchi and East Siberian Arctic Shelves Winterfeld et al (2018) estimated with a carbon cycle model that flooding of this area alone may have accounted for about half of the abrupt rises in atmospheric CO2 (∼6 ppm) at 14.6 and 11.5 kyr BP thereby causing a drop of 6–8‰ in atmospheric Δ14C. Our data reveal that the timing of carbon mobilization (peaks in mass-accumulation rates, figures 2(i), (j) and (l)) as well as the pre-depositional ages agree well between the Sea of Okhotsk (∼5000–10 000 years; figure 2(l)) and the Bering Sea (∼6900–10 500 years; figure 2(i), table 1, cores SO202-18-3/SO202-18-6) at these times. Given these consistencies our findings underpin the results of the carbon cycle simulation by Winterfeld et al (2018) highlighting the potential key role of Beringia in the deglacial permafrost-carbon feedback, particularly at 14.6 and 11.5 kyr BP.
At 16.5 kyr BP, flooding of the Bering, Chukchi and East Siberian Arctic Shelves may only explain up to a fourth of the observed sudden rise in atmospheric CO2 according to Winterfeld et al (2018). Our data suggest that next to incipient inundation of the Bering Shelf massive meltwater discharge due to glacier retreat caused riverbank erosion of permafrost soils in the Yukon catchment and concomitantly mobilized fossil, petrogenic carbon around that time (figures 3(a), (d) and (g)). This process could have additionally fueled the observed rise in atmospheric CO2 at 16.5 kyr BP, if the mobilized material was at least partly remineralized during transport processes prior to final burial in marine sediments and if the melt-water induced mobilization of old carbon was a broad-scale phenomenon around the large Eurasian and American ice sheets.
4. Conclusion
By analyzing mass accumulation rates and pre-depositional ages of terrigenous biomarkers in sediments from the Bering Sea and the Northwest Pacific, we provide the first proxy record constraining mobilization of old carbon during permafrost retreat in Beringia across the entire LGM-Holocene transition. We find that the activation of old, previously freeze-locked carbon rapidly initiated within centennial time-scales matching the rapid increases in atmospheric CO2 around 16.5, 14.6 and 11.5 kyr BP. The massive remobilization of old terrigenous organic carbon resulted from melt-water runoff, shelf flooding and permafrost thaw in the interior. We infer that, next to warming and subsequent permafrost thaw, rapid shelf flooding during mwp-1A and mwp-1B was an important driver of the enhanced accumulation of permafrost carbon in the N Pacific, particularly during mwp-1A and mwp-1B around 14.6 and 11.5 kyr BP. Our data corroborate recent model-based hypotheses according to which the inundation of the vast East Siberian Arctic, Chukchi and Bering shelves substantially contributed to the sudden rises of atmospheric CO2 at these times (Winterfeld et al 2018). We acknowledge that our data only represent Beringia's Pacific shelves including the Bering Shelf. As the deglacial mobilization of permafrost carbon along the East Siberian Arctic and Chukchi Shelves around the three rapid shifts in CO2 is largely unresolved at the present stage (Tesi et al 2016, Keskitalo et al 2017, Martens et al 2019), this hypothesis requires further testing.
Our study reveals that mobilization of petrogenic and permafrost-derived carbon induced by the retreat of continental ice-sheets and associated meltwater floods was a potential mechanism to rapidly unlock ancient terrestrial carbon, a process which has been unrecognized so far (e.g. Köhler et al 2014, Lindgren et al 2018). The mobilized material may have contributed to rising atmospheric CO2-levels already during the early deglaciation, potentially explaining parts of the rapid shift at 16.5 kyr BP.
Our study thus emphasizes the general vulnerability of permafrost to abrupt decomposition, in particular the sea-level induced erosion, and the related potential to cause centennial-scale rises in atmospheric CO2, which might similarly happen in the future.
Acknowledgments
The study is based on core material which was gained in the frame of the German-Russian research project 'KALMAR'—Kurile-Kamchatka and Aleutian Marginal Sea Island Arc Systems: Geodynamic and Climate Interaction in Space and Time' and the 'INOPEX—Innovative NOrth Pacific EXperiment' project (BMBF Grant 03G0202A). We thank the Master and the crew of R/V SONNE for their professional support during cruises SO201-2 and SO202. Dirk Nürnberg is acknowledged for providing sample material from site SO201-2-12KL. We thank Arnaud Nicolas, Sara Trojahn and Thorsten Riedel for their valuable assistance on the geochemical sample preparation in the laboratories. The study was funded by the Helmholtz association through the President's Initiative and Networking Fund. It contributes to PALMOD, the German Paleomodeling Research Project funded by the German Federal Ministry for Education and Research (BMBF). We thank two reviewers for their comments and suggestions on earlier version of our manuscript which helped to improve the quality of this article. The biomarker data generated in this study are accessible at the database Pangaea: https://doi.org/10.1594/PANGAEA.901962