

Abstract
Projected future trends in water availability are associated with large uncertainties in many regions of the globe. In mountain areas with complex topography, climate models have often limited capabilities to adequately simulate the precipitation variability on small spatial scales. Also, their validation is hampered by typically very low station density. In the Central Andes of South America, a semi-arid high-mountain region with strong seasonality, zonal wind in the upper troposphere is a good proxy for interannual precipitation variability. Here, we combine instrumental measurements, reanalysis and paleoclimate data, and a 57-member ensemble of CMIP5 model simulations to assess changes in Central Andes precipitation over the period AD 1000–2100. This new database allows us to put future projections of precipitation into a previously missing multi-centennial and pre-industrial context. Our results confirm the relationship between regional summer precipitation and 200 hPa zonal wind in the Central Andes, with stronger Westerly winds leading to decreased precipitation. The period of instrumental coverage (1965–2010) is slightly dryer compared to pre-industrial times as represented by control simulations, simulations from the past Millennium, ice core data from Quelccaya ice cap and a tree-ring based precipitation reconstruction. The model ensemble identifies a clear reduction in precipitation already in the early 21st century: the 10 year running mean model uncertainty range (ensemble 16–84% spread) is continuously above the pre-industrial mean after AD 2023 (AD 2028) until the end of the 21st century in the RCP2.6 (RCP8.5) emission scenario. Average precipitation over AD 2071–2100 is outside the range of natural pre-industrial variability in 47 of the 57 model simulations for both emission scenarios. The ensemble median fraction of dry years (defined by the 5th percentile in pre-industrial conditions) is projected to increase by a factor of 4 until 2071–2100 in the RCP8.5 scenario. Even under the strong reduction of greenhouse gas emissions projected by the RCP2.6 scenario, the Central Andes will experience a reduction in precipitation outside pre-industrial natural variability. This is of concern for the Central Andes, because society and economy are highly vulnerable to changes in the hydrological cycle and already have to face decreases in fresh water availability caused by glacier retreat.
Export citation and abstract BibTeX RIS

Content from this work may be used under the terms of the Creative Commons Attribution 3.0 licence. Any further distribution of this work must maintain attribution to the author(s) and the title of the work, journal citation and DOI.
Introduction
Sustainable management of water resources, long-term planning of water allocation and adaptation to climatic and environmental changes (e.g. Lynch 2012, IPCC 2014) requires knowledge of past, present and future variability and trends in hydroclimatic variables at the regional scale. However, at this scale, trends in observed (Hartmann et al 2013, Salzmann et al 2013) and future (e.g. Buytaert et al 2010, Deser et al 2012) water supply are highly uncertain or even unknown for many regions of the globe. Principal reasons for this lack of knowledge are the sparse distribution and often low quality of meteorological measurements, and the inability of climate models to simulate small-scale processes. While numerical and statistical downscaling approaches have helped improving regional predictions, even the sign of future trends in water availability remains difficult to estimate for many areas of the globe, in particular high mountain areas (Buytaert et al 2010, Deser et al 2012).
Here, we focus on possible future changes in precipitation in the Central Andes of South-America, a high elevation semi-arid region with a strong seasonality and little precipitation outside the summer season (Garreaud et al 2003, 2009, Garreaud 2009).
The precipitation regime of the Central Andes is characterized by a complex interplay of local orographic effects with large-scale circulation (Garreaud and Aceituno 2001, Garreaud et al 2003, Vuille and Keimig 2004), and the main moisture source for the region is the Easterly influx from the Amazon Basin (Garreaud 1999, Falvey and Garreaud 2005). The instrumental precipitation record in the Central Andes is relatively short. Most station data do not extend beyond 1960, and many stations have incomplete and inhomogeneous data series (Schwarb et al 2011). Assessments of this instrumental database indicate no spatially consistent trends in instrumental precipitation (figure S1 in the supplementary material SM, available at stacks.iop.org/ERL/10/084017/mmedia; Vuille et al 2003, Salzmann et al 2013, Seiler et al 2013a), unlike temperature records that show a steady increase during the last decades (Vuille et al 2015). Owing to the complex dynamic influence on local climate and the distinct, small-scaled topographic features of the Andes, general circulation models (GCMs) have very limited ability to adequately simulate precipitation variability and trends in the Central Andes (Minvielle and Garreaud 2011, Seiler et al 2013b) and also in the Amazonian source region of the moisture (Joetzjer et al 2013, Yin et al 2013).
More reliable is the simulation of the mid and upper tropospheric flow, as shown by comparing the model output with global reanalyses (Minvielle and Garreaud 2011, Thibeault et al 2012). This is comforting, because zonal wind at the 200 hPa pressure level has been shown to be a good proxy for precipitation in the Central Andes (Vuille 1999, Garreaud and Aceituno 2001, Garreaud et al 2003, Vuille and Keimig 2004, Minvielle and Garreaud 2011, Thibeault et al 2012). In fact, the amount of moisture received from the East in the Central Andes is strongly influenced by the strength of zonal winds and the dynamics of the Bolivian High in the upper troposphere (Lenters and Cook 1997, Vuille 1999, Garreaud and Aceituno 2001, Garreaud et al 2003, Vuille and Keimig 2004). Increased (decreased) Westerly upper level flow reduces (enhances) the upwards transport of moist air masses from the Amazon region leading to reduced (enhanced) precipitation in the Central Andes (Garreaud et al 2003).
This relationship between Central Andes precipitation and upper level zonal flow has been widely assessed and demonstrated in the literature using a range of instrumental, reanalysis and climate model data (Vuille 1999, Garreaud and Aceituno 2001, Garreaud et al 2003, Vuille and Keimig 2004, Minvielle and Garreaud 2011, Thibeault et al 2012). While the temporal stability of this relationship is difficult to assess using the short instrumental data, modeling studies indicate that it remains valid on intra-seasonal to glacial-interglacial time scales (Garreaud et al 2003) as well as in future projections (Minvielle and Garreaud 2011). For a detailed description of the mechanisms influencing precipitation in the Central Andes and the role of zonal wind we refer to Garreaud (2009) and Garreaud et al (2009) and the references provided therein.
Minvielle and Garreaud (2011) and Thibeault et al (2012) used 11 GCMs from the CMIP3 simulation effort to identify an increase in 200 hPa zonal wind and, accordingly, a decrease of 10%–30% in Central Andes precipitation towards the end of the 21st century as compared to present-day conditions. For the past, a tree-ring based precipitation reconstruction of the Southern Central Andes covering the last 700 years revealed a persistent drying trend since the 1930s (Morales et al 2012). While this suggests that future trends are consistent with the tendency observed in the recent past, the relation between past and future changes in the precipitation regime of the Central Andes has not be addressed in a comprehensive manner as of to date.
Here, we use paleoclimate proxy data, instrumental measurements from South-Eastern Peru and a 57-member ensemble of the last generation (CMIP5; Taylor et al 2012) of GCMs to analyze past, present and future precipitation conditions in the Central Andes. To put projections for the late 21st century in the context of natural variability, we first assess the ability of GCMs to hindcast Central Andes precipitation in the observational and pre-industrial periods. To do so we compare GCM outputs with instrumental precipitation measurements, reanalysis data of upper tropospheric Westerly flow, oxygen isotope data from an Andean ice core record and a regional tree-ring based precipitation reconstruction. Simulations of present and late 21st century climate are then compared to natural pre-industrial conditions on interannual to multi-decadal time-scales to put future changes in mean precipitation, the occurrence of dry years and precipitation variability in perspective.
Data and methods
An overview of all datasets used in this study is presented in table 1.
Table 1. Overview of the datasets used in this study. n is the internal replication of ensembles/composites. The last column indicates, for which figures the datasets were used. More details about the model simulations are provided in tables S1 and S2.
| Dataset name | Time period | Variable | Resolution | n | Forcing | Figure |
|---|---|---|---|---|---|---|
| Observational datasets | ||||||
| Instrumental precipitation | AD 1965–2010 | precipitation (mm) | monthly (DJF) | 3 | 1, 2(a) | |
| ERA 40 reanalysis | AD 1958–2002 | Uwind (m s−1) | monthly (DJF) | 1 | 1, 2(b), 4 | |
| Quelccaya ice core | AD 470-2002 | d18O [‰] | annual | 2a | 2(a), 3 | |
| Tree-ring reconstruction | AD 1300–2006 | precipitation [% w.r.t. 1982–2000] | annual (November–October) | 353 | 2(a), 3 | |
| GCM experiments | ||||||
| Pre-industrial control ('picontrol') | 251–2112 years | Uwind (m s−1) | monthly (DJF) | 57 | 'frozen' at pre-industrial level | 2(b), 5, 7 |
| 'Past1000' | AD 1000–1850 | Uwind (m s−1) | monthly (DJF) | 8 | transient | 2(b), 3, 5 |
| 'Historical' | AD 1850–2005 | Uwind (m s−1) | monthly (DJF) | 57 | transient | 2(b), 3, 6, 7 |
| RCP2.6 | AD 2006–2100 | Uwind (m s−1) | monthly (DJF) | 57 | transient | 3, 5, 6, 7 |
| RCP8.5 | AD 2006–2100 | Uwind (m s−1) | monthly (DJF) | 57 | transient | 3, 4, 5, 6, 7 |
| GCM spliced | ||||||
| 'Full' ensemble RCP2.6: 'historical' and RCP2.6 | AD 1850–2100 and 'picontrol' | Uwind (m s−1) | monthly (DJF) | 57 | transient | 3, 5, 6, 7 |
| 'Full' ensemble RCP8.5: 'historical' and RCP8.5 | AD 1850–2100 and 'picontrol' | Uwind (m s−1) | monthly (DJF) | 57 | transient | 3, 4, 5, 6, 7 |
| 'Past 1000' ensemble RCP2.6: 'past1000' and 'historical' and RCP2.6 | AD 1000–2100 and 'picontrol' | Uwind (m s−1) | monthly (DJF) | 8 | transient | 5 |
| 'Past 1000' ensemble RCP8.5: 'past1000' and 'historical' and RCP8.5 | AD 1000–2100 and 'picontrol' | Uwind (m s−1) | monthly (DJF) | 8 | transient | 3, 5 |
aComposite of two cores covering the period AD 488–1984 and AD 1540–2002, respectively (Thompson et al 2006).
To quantify precipitation variability in the Central Andes during the observational period, we use a composite of three meteorological stations from South-Eastern Peru (location indicated with a green circle in figure 1): 'Chinchayllapa' (72.73°W/14.92°S, 4497m a.s.l.), 'La Angostura' (71.65°W/15.18°S, 4256m a.s.l.) and 'Orcopampa' (72.34°W/15.26°S, 3801m a.s.l.). Monthly precipitation totals covering 1965–2010 (all years AD) were obtained from the Servicio Nacional de Meteorología e Hidrología del Perú (SENAMHI). Previous work has extensively demonstrated the strong and stable relationship between upper-level Uwind and precipitation across the Central Andes (Vuille 1999, Garreaud and Aceituno 2001, Garreaud et al 2003, Vuille and Keimig 2004, Minvielle and Garreaud 2011, Thibeault et al 2012). For our study, we therefore considered data quality more important than spatial coverage for the selection of representative climate data. The above-mentioned three stations were selected because they offer comparatively long and complete time series that are highly intercorrelated (r > 0.46) and are in short distance to each other, which allows cross-checking of the data. Because precipitation magnitudes strongly differ among the stations, precipitation data are standardized to a mean of zero and unit standard deviation over the period 1965–2010 and then averaged to form a single composite time series.
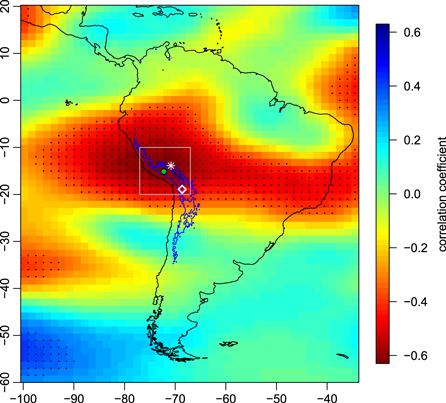
Figure 1. Correlation between Central Andes precipitation and 200 hPa zonal wind (Uwind; ERA-40; Uppala et al 2005) for DJF between 1965 and 2002 (shaded). Areas with significant correlations are highlighted with black dots. Green circle indicates the location of the instrumental precipitation composite (averaged coordinates over the three stations). White asterisk (diamond) shows the location of the Quelccaya ice cap (tree-ring reconstruction). Gray rectangle marks the area used to average Uwind data for time-series comparisons. Blue lines represent the 4000 m a.s.l. contour.
Download figure:
Standard image High-resolution imageDuring the dry season, water use in the Central Andes is largely depending on water that precipitated during the wet summer season and had been stored in natural reservoirs such as snow and ice. Throughout the entire year, agriculture, industry and drinking water availability predominantly depend on the moisture input from the austral summer period. For this reason, we focus our attention on December to February (DJF) seasonal precipitation sums. On average, 55% of annual precipitation occurs during the DJF season at the selected stations. figure S2 shows the standardized instrumental DJF precipitation data.
To quantify upper tropospheric zonal wind, we use three global reanalysis datasets: ERA 40 (Uppala et al 2005), NCEP-NCAR (Kalnay et al 1996) and MERRA (Rienecker et al 2011). Results reported in the main text are based on ERA 40, but results are similar for NCEP-NCAR and MERRA (figures S3 and S4). We use the zonal wind component at the 200 hPa level (Uwind) as explanatory variable, with positive/negative Uwind values representing Westerly/Easterly flow. To obtain single, representative time series for the Central Andes, we spatially averaged DJF Uwind over the domain 67°–77°W/10°–20°S (indicated by the gray rectangle in figure 1). Results using an alternative domain based on the magnitude of the Uwind-precipitation correlation are presented in the SM (figures S5–S10).
To put recent precipitation variability into a long-term context, we use ice core δ18O values from Quelccaya ice cap (white asterisk in figure 1) extending back to the year 470 (Thompson et al 1985, 2006). While the interpretation of the climatic signal in isotope data from the tropical Andes remains complex, summer precipitation is documented to be a key factor driving δ18O variability in the Quelccaya record (Vimeux et al 2009). As a second paleoclimate record, we use the precipitation reconstruction of Morales et al (2012) from the Southern Central Andes covering the period 1300–2006 (white diamond in figure 1). The reconstruction is based on a composite of 353 tree-ring width measurements from Polylepis tarapacana and explains 55% of regional annual rainfall variability (Morales et al 2012). These two datasets are currently the only publicly available long-term, annually resolved precipitation records for the Central Andes (Neukom and Gergis 2012).
In conjunction with the observational data, we use GCM data from the CMIP5 simulation effort (Taylor et al 2012). From the CMIP5 data repository, we selected all simulations disposing of complete data for Uwind for all of the following experiments: pre-industrial control ('picontrol'), 'historical' (1850–2005), and, concerning the future, RCP2.6 scenario (representative concentration pathways; 2006–2100; Vuuren et al 2011) and RCP8.5 scenario (2006–2100). RCP2.6 (RCP8.5) is the most optimistic (pessimistic) greenhouse gas emission scenario used in IPCC AR5 (IPCC 2013). With this, we obtained an ensemble of 57 simulations from 23 different models ('full' ensemble; table 1; list of all simulations in table S1). Out of this dataset, we use a second, smaller ensemble of eight simulations from six different models, which additionally have data for the 'past1000' experiment ('past1000 ensemble'; 1000–1850; table 1 and table S2).
In the 'picontrol' experiment, external climate forcing (solar variability, volcanic eruptions, greenhouse gas and aerosol concentrations, land use/land cover changes and orbital changes) is kept constant at pre-industrial levels. This means that all climatic changes in this experiment can be allocated to internal climate system variability. Hence, 'natural pre-industrial variability' in Uwind (and other variables) can be defined based on the range of simulated values within the 'picontrol' runs. In contrast, the 'past1000' experiment (and subsequent 'historical' and RCP runs) uses transient forcing based on reconstructions (and future scenarios) of the individual forcing factors. Hence, the range of simulated values in the 'past1000' experiment represents internally and externally forced 'natural' variations over the past period AD 1000–1850 including pre-industrial anthropogenic influence. The 'past1000' ensemble allows a long-term comparison of simulated Uwind with the paleoclimate proxy data over the past 700 years and to estimate the 'real' (transient) pre-industrial conditions experienced in the Central Andes. In contrast, the 'full' ensemble is much larger in size but only allows to quantify pre-industrial conditions based on the control runs.
In the 'full' ensemble ('past1000' ensemble), the 'historical' and RCP scenario ('past1000', 'historical' and RCP scenario) records of the individual simulations were spliced together to form a long time series covering 1850–2100 (1000–2100). The 'picontrol' runs are used to assess pre-industrial versus future conditions and for comparison with the 'past1000' run. Uwind data from the GCMs were also aggregated to DJF values and averaged over the domain 67°–77°W/10°–20°S.
We first compare the reanalysis and paleoclimate records to the instrumental data to assess their quality as precipitation predictors. Second, we compare the distributions of the paleoclimate proxy data and model simulations over the observational and pre-industrial periods to assess whether the relative occurrence of average and dry years is similar in the different datasets and thus to evaluate the skill of the GCMs in simulating long-term changes in Central Andes precipitation. Third, we calculate the long-term evolution of Uwind in our model ensemble and compare past, present and future conditions. 'Natural' pre-industrial conditions are quantified based on the pre-industrial control runs for the large 57-member ensemble and based on the 1000–1850 period for the 'past1000' ensemble and the paleoclimate proxy data. Present versus future conditions are compared using the periods 1971–2000 and 2071–2100, respectively.
To quantify past and future precipitation levels, all Uwind and paleoclimate proxy data are normalized to the instrumental composite. This is achieved by scaling each record individually to the mean and standard deviation of the (previously normalized) instrumental precipitation data over the common period of overlap.
The definition of 'dry years' in this study is based on the 5th percentile of precipitation and on the 95th percentile of Uwind (due to its negative relationship with precipitation).
Results
Relationship between instrumental precipitation and regional Uwind
Our data show a significant negative correlation between instrumental precipitation and regional Uwind confirming the findings of earlier studies. Shading in figure 1 shows the spatial correlations of precipitation from the instrumental composite with gridded ERA-40 200 hPa Uwind during DJF over the overlap period 1965-2002. Significant (p < 0.05) negative correlations are found over a latitudinal band between 12°S and 20°S and extending northward nearly to the equator between 65°W and 85°W. Strongest correlations are found slightly North of the location of the instrumental precipitation stations and a few degrees West. A time series comparison of instrumental precipitation and area averaged Uwind is provided in figure S2. The two time series correlate with r = −0.58, p < 0.01. This confirms that about a third (r2 = 0.33) of interannual precipitation variability in the Western part of the Central Andes can be explained by the strength of the zonal flow in the upper troposphere (Minvielle and Garreaud 2011). The relationship is stable across different reanalysis datasets and over the observational period (figures S3 and S4) confirming independent stability-assessments based on model data (Garreaud et al 2003, Minvielle and Garreaud 2011). The relationship between our instrumental composite and Quelccaya δ18O (r = −0.34, p = 0.03) and the tree-ring reconstruction (r = 0.34, p = 0.03) is also significant over the short period of overlap 1965–2002 (figure S2).
Comparison of present-day and pre-industrial conditions
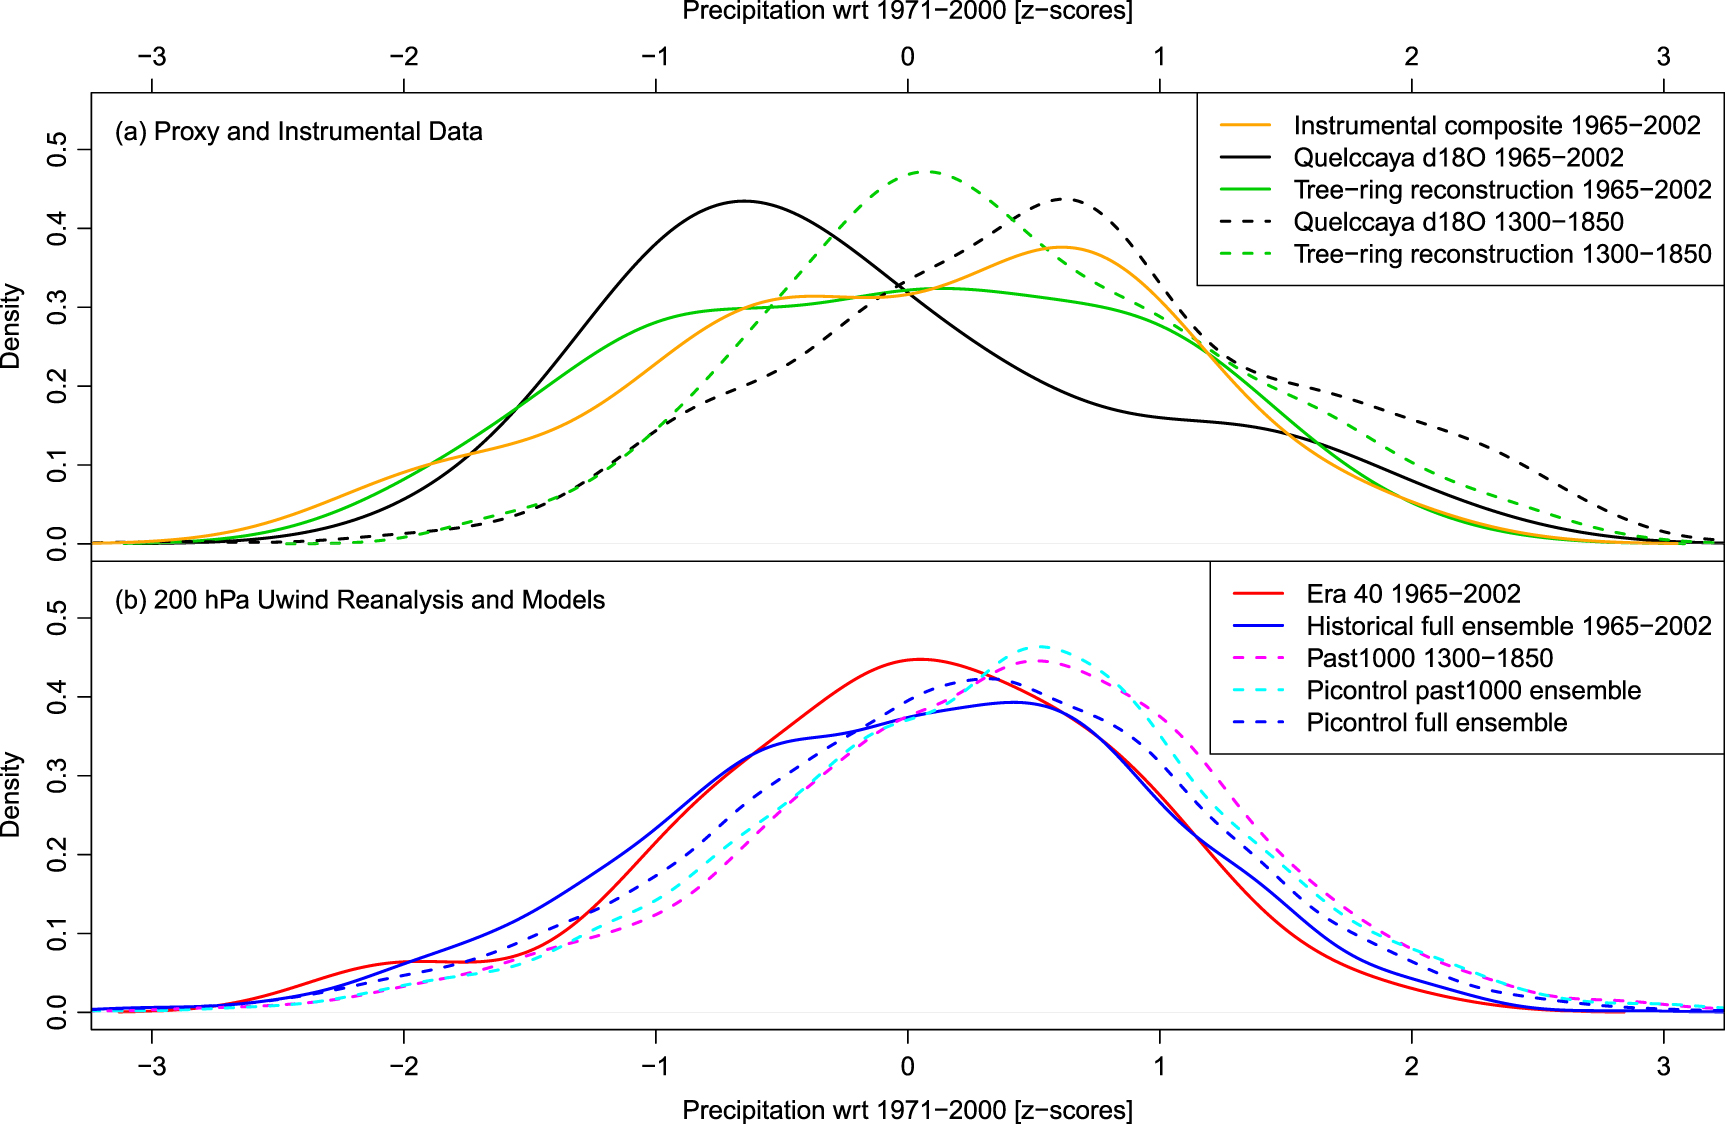
Having confirmed the relationship between Uwind and precipitation in the Central Andes, we next compare present and pre-industrial conditions in the different datasets. Figure 2 shows the distributions of the different rainfall predictors in the observational and pre-industrial periods. The proxy data indicate a clear shift towards drier conditions between the periods 1300–1850 and 1965–2002, while the widths of the distributions remain similar (see also table 2). For the model simulations (figure 2(b)) the differences between the two periods are of the same sign, but smaller in magnitude. Table 2 summarizes the changes for the mean values, standard deviations and dry years and confirms that all datasets agree in terms of the sign of the changes. Quelccaya δ18O and the tree-ring reconstruction show a stronger decrease in mean precipitation compared to the 'past1000' simulations, but the uncertainty range of the 'past1000' ensemble shows a very coherent picture (all values below zero). All datasets suggest that there was no significant change in the standard deviations between the two periods, indicating a relatively robust behavior of interannual precipitation variability. The δ18O and 'past1000' Uwind data suggest a similar shift of the 5th percentile towards lower values (around one quarter of the present-day instrumental standard deviation). For the tree-ring data, this change is even larger (−0.56 standard deviation units). This shows that the fraction of dry years, as defined by the 5th percentile during pre-industrial conditions, has increased. Figure 2 and table 2 also show that in general, the estimates of pre-industrial conditions are very similar in the 'past1000' and 'picontrol' simulations. However, the magnitude of the changes in the mean values between pre-industrial and present day obtained from comparing 'historical' with 'picontrol' is smaller than estimated from comparing 'historical' with 'past1000'. This should be valid also for the comparison between future conditions and pre-industrial baseline, implying that our assessment of future conditions based on the 'picontrol' simulations (see below) can be considered as conservative.

Figure 2. Distribution of instrumental and paleoclimate proxy data (a) and Uwind datasets (b) in present and pre-industrial conditions. All data are scaled to the mean and standard deviation of instrumental precipitation over the period of overlap and shown relative to the 1971–2000 base period. Model data include the entire ensembles.
Download figure:
Standard image High-resolution imageTable 2. Changes between pre-industrial and present-day conditions in DJF precipitation reconstructed by Uwind in model simulations, δ18O in the Quelccaya ice core and tree-ring data. For the model data, the ensemble median is indicated, as well as the 16–84% uncertainty range in brackets. Unit is standardized precipitation w.r.t. 1971–2000 (z-scores). 'Past1000': 1000–1850; 'picontrol': duration of control run.
| Present-'past1000' | Present-'picontrol' | |
|---|---|---|
| Mean | ||
| CMIP5—'full' | −0.15 [−0.34,0.04] | |
| CMIP5—'past1000' | −0.29 [−0.50,−0.18] | −0.21 [−0.54,0.01] |
| Quelccaya δ18O | −0.72 | |
| Tree-ring recon | −0.43 | |
| Standard deviation | ||
| CMIP5—'full' | 0.03 [−0.05,0.12] | |
| CMIP5—'past1000' | 0.03 [−0.06,0.13] | 0.04 [−0.06,0.17] |
| Quelccaya δ18O | −0.11 | |
| Tree-ring recon | 0.02 | |
| 5th percentile | ||
| CMIP5—'full' | −0.15 [−0.54,0.22] | |
| CMIP5—'past1000' | −0.22 [−0.51,0.03] | −0.24 [−0.51,0.11] |
| Quelccaya δ18O | −0.26 | |
| Tree-ring recon | −0.56 |
Future projections of Uwind
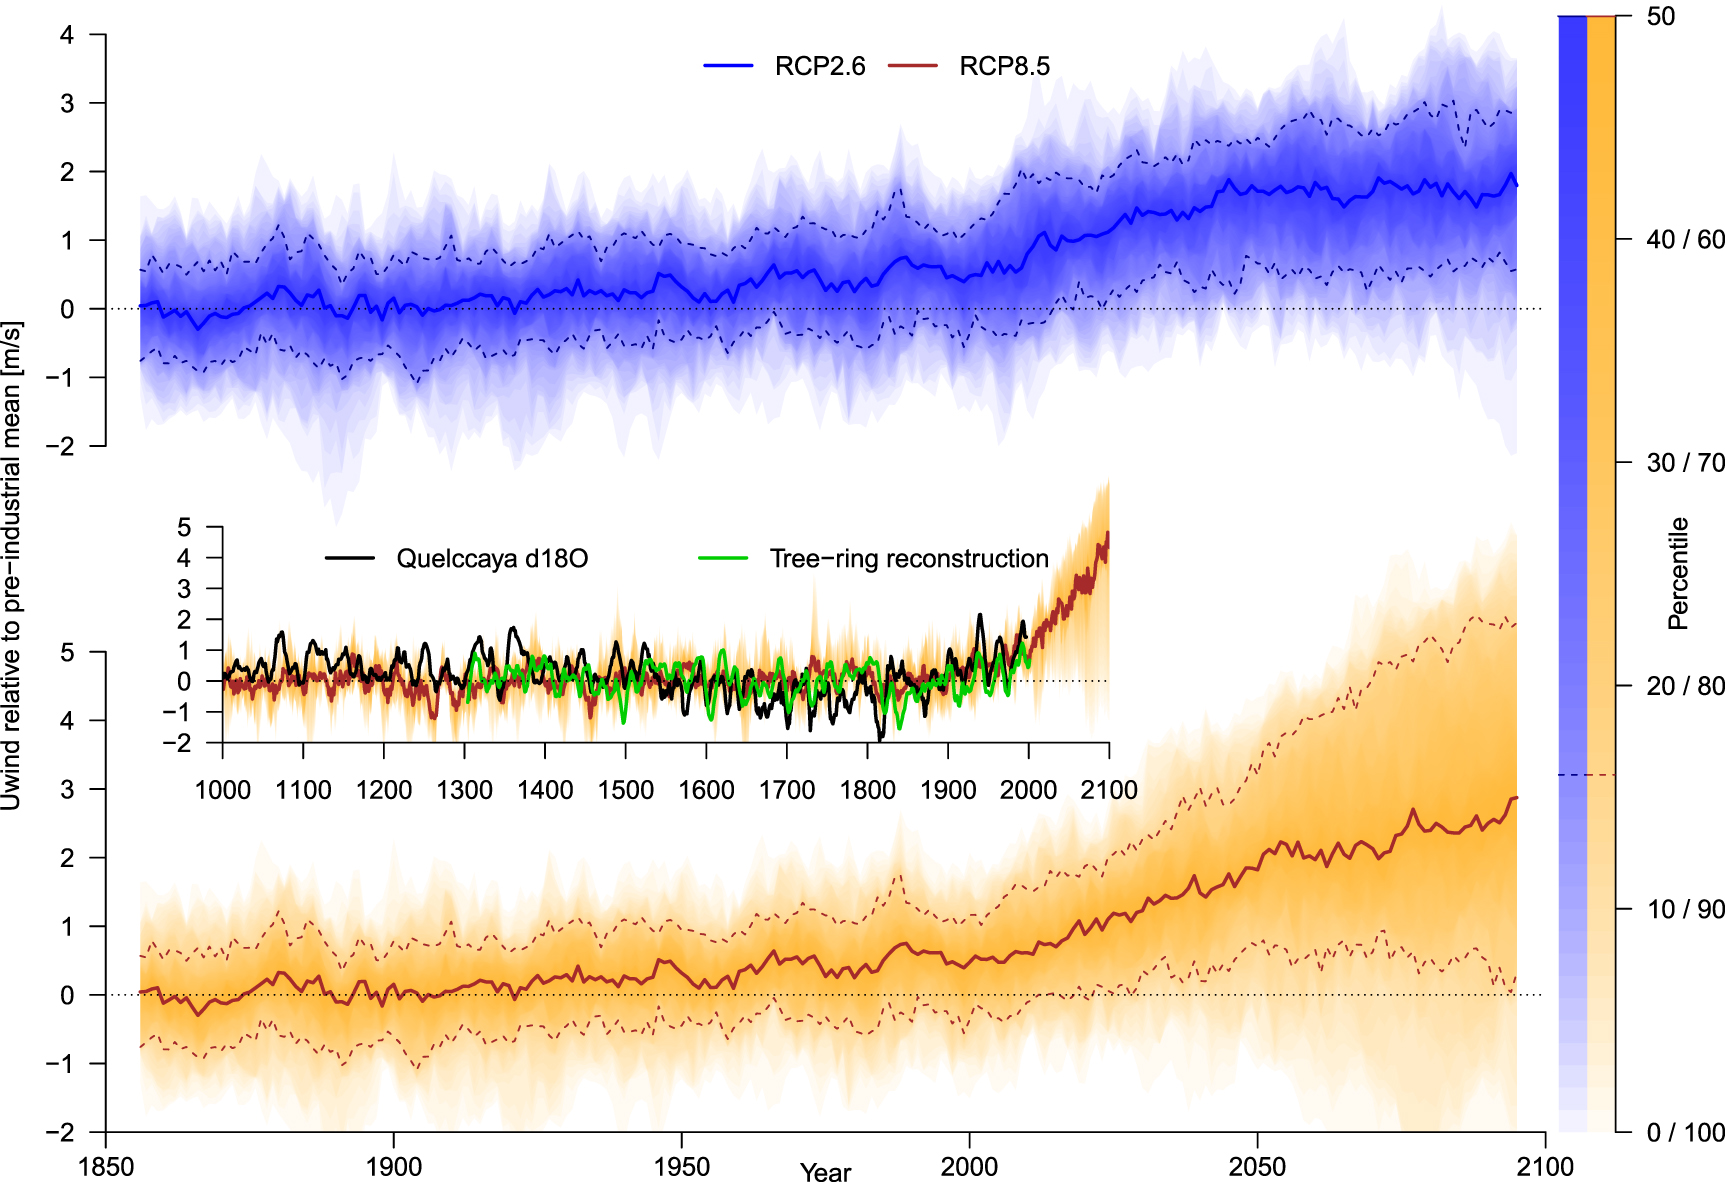
Figure 3 shows the temporal evolution of simulated Uwind until 2100 relative to the pre-industrial baseline. Comparison of the proxy data and the 'past1000' simulations shows a larger pre-industrial low frequency variability in the natural proxies compared to simulated Uwind, particularly for Quelccaya δ18O, which is consistent with previous comparisons of proxy and model data (Laepple and Huybers 2014). The figure confirms the very similar increase (decrease) in simulated Uwind and δ18O (tree-ring reconstructed precipitation) between 1850 and 2002. This suggests that the model simulations realistically capture the changes between pre-industrial and present-day conditions. The increase in Uwind continues towards the future and the 10 year running mean of the ensemble median remains consistently above the pre-industrial average after 1921 for both the lowest (RCP2.6) and highest (RCP8.5) emission scenarios. The increase gets stronger after the end of the historical period (2005) but remains constant after ca. 2050 for RCP2.6. The 16–84% ensemble uncertainty range (see e.g. Hawkins et al 2014) of the 10 year running mean remains constantly above the pre-industrial mean after 2023 (2028) until 2100 in the RCP2.6 (RCP8.5) scenario. This indicates that differences to natural average conditions will be experienced within the next 15 years.

Figure 3. Temporal evolution of Uwind 1850–2100 for the 'full' ensemble. Model ensemble median (bold lines), 16%–84% range (dashed) and ensemble percentiles (shaded). Blue: RCP2.6, orange: RCP8.5. Inset shows the RCP8.5 data for the 'past1000' ensemble covering 1000–2100 in comparison with Quelccaya δ18O (unit ‰) and the tree-ring reconstruction (standardized anomalies, inversed for easier comparison). All data are 10 year running means and shown relative to the pre-industrial mean ('picontrol' simulations; 1300–1850 for the inset plot).
Download figure:
Standard image High-resolution imageThe spatial pattern of the projected changes in Uwind is illustrated by arrows in figure 4. The increase in zonal wind strength is consistent across the entire Central Andes region, with strongest changes in the Southern part of the domain.
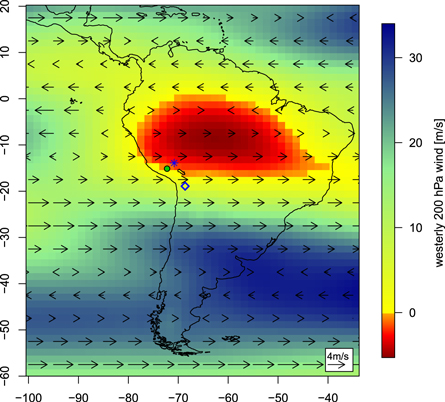
Figure 4. Present-day and future Uwind conditions over South America. Shading represents average DJF Uwind in the ERA40 reanalysis dataset over 1958–2002. Arrows indicate projected changes in Uwind, calculated as ensemble median difference between 2071–2100 and 1971–2000 over each 5° × 5° grid cell in RCP8.5. Arrows pointing towards the East (West) indicate more Westerly (Easterly) flow. Green circle: location of the instrumental precipitation composite. Blue asterisk (diamond): location of the Quelccaya ice cap (tree-ring reconstruction).
Download figure:
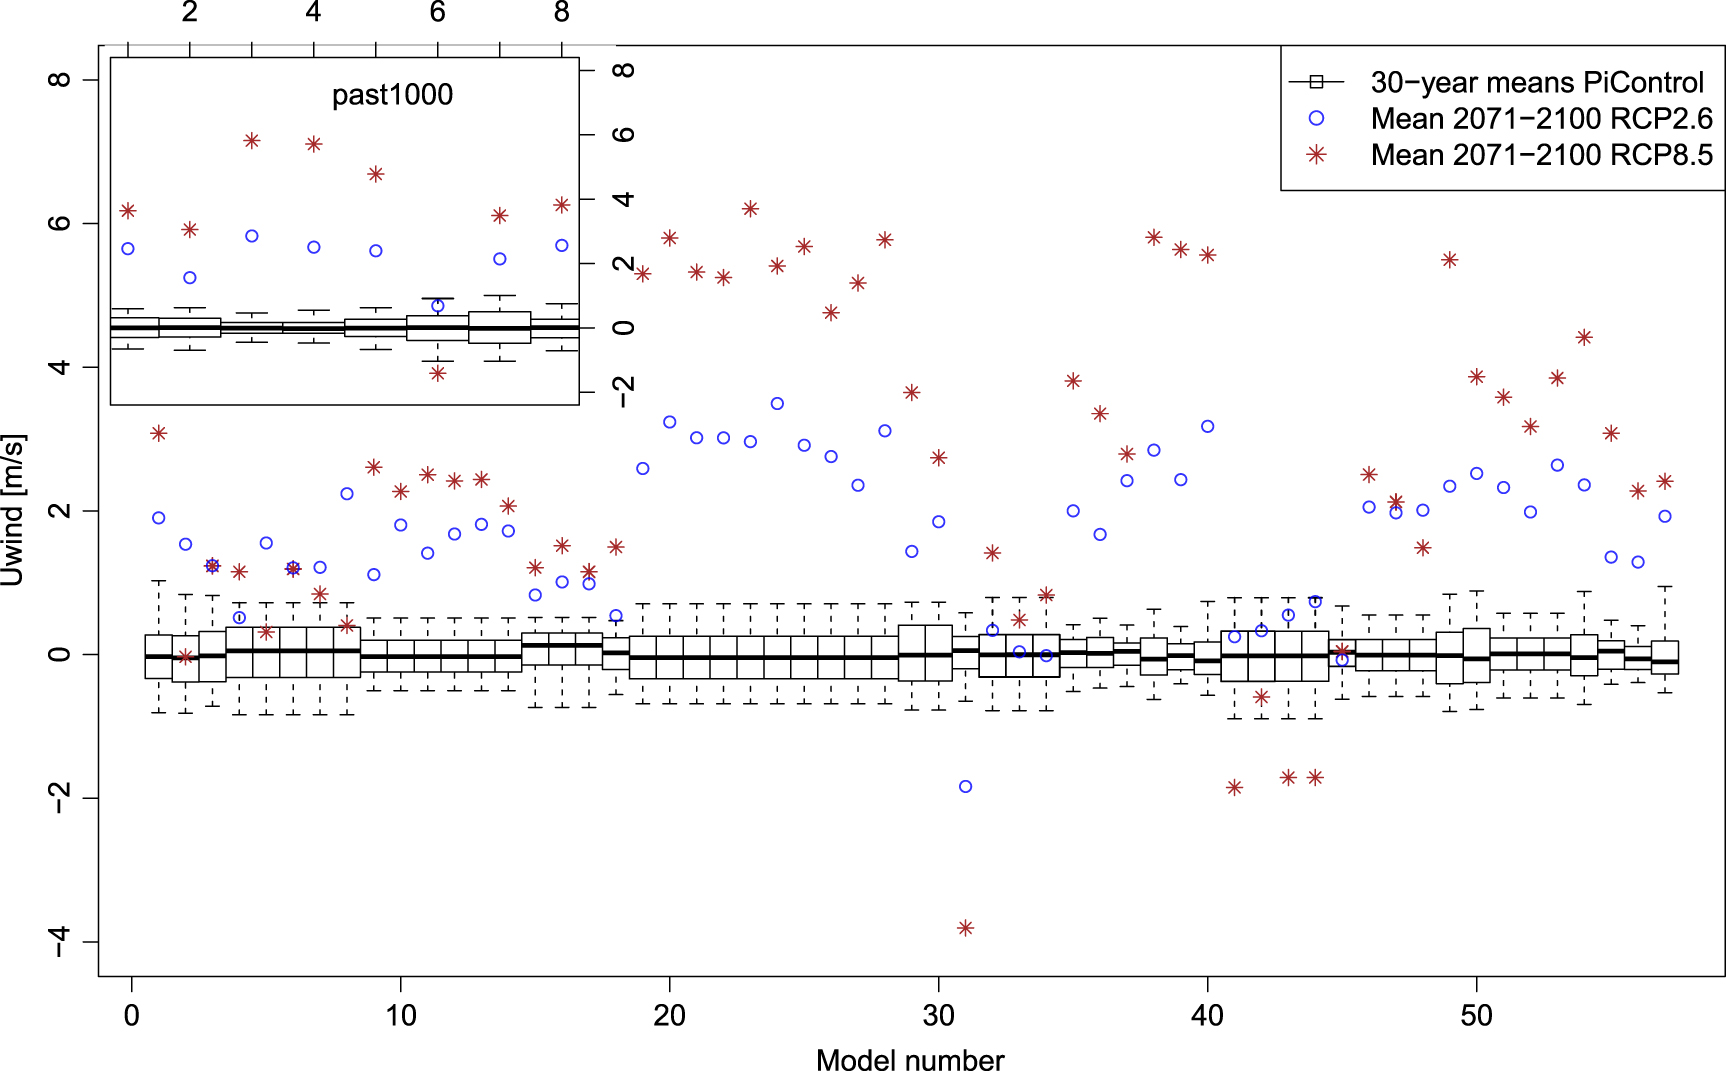
Standard image High-resolution imageFigure 5 compares the mean Uwind over 2071–2100 to the range of 30 year averages in the 'picontrol' experiment for each model simulation. In 47 of the 57 simulations the 2071–2100 means are above the 95% range of the 'picontrol' data for both the RCP2.6 and RCP8.5 scenarios, hence suggesting that average conditions at the end of the 21st century will exceed natural pre-industrial variability. Two models (FGOALS-g2, simulation no.31 and IPSL-CM5A-LR, simulations no. 41-44) out of 23 simulate a significant decrease in Uwind in RCP8.5 leading to relatively large ensemble spread (see also figure 3). On average, 2071–2100 Uwind is 2.2 (1.4) standard deviations above the pre-industrial mean in RCP8.5 (RCP2.6). The results are confirmed by the 'past1000' simulations (figure 5), where seven out of eight simulations indicate a significant increase in Uwind for both scenarios suggesting that 2071–2100 conditions will be unprecedented over the last Millennium.

Figure 5. Average Uwind over 2071–2100 compared to consecutive 30 year periods in the 'picontrol' runs. Boxplots represent all 30 year period averages in the control run. Each boxplot represents one simulation (numbers on the x-axis as in table S1). Anomalies are relative to the mean of the 'picontrol' experiment. Boxes and whiskers indicate the interquartile and 5%–95% range, respectively. Blue circles (red asterisks) are the 2071–2100 means in the RCP2.6 (RCP8.5) scenario. Inset shows the same for the 'past1000' ensemble, where the boxplots represent the 1000–1850 baseline.
Download figure:
Standard image High-resolution imageThe projected increase in Uwind illustrated by figures 3–5 suggests drier average conditions in the Central Andes towards the end of the 21st century.
Future evolution of dry year occurrence
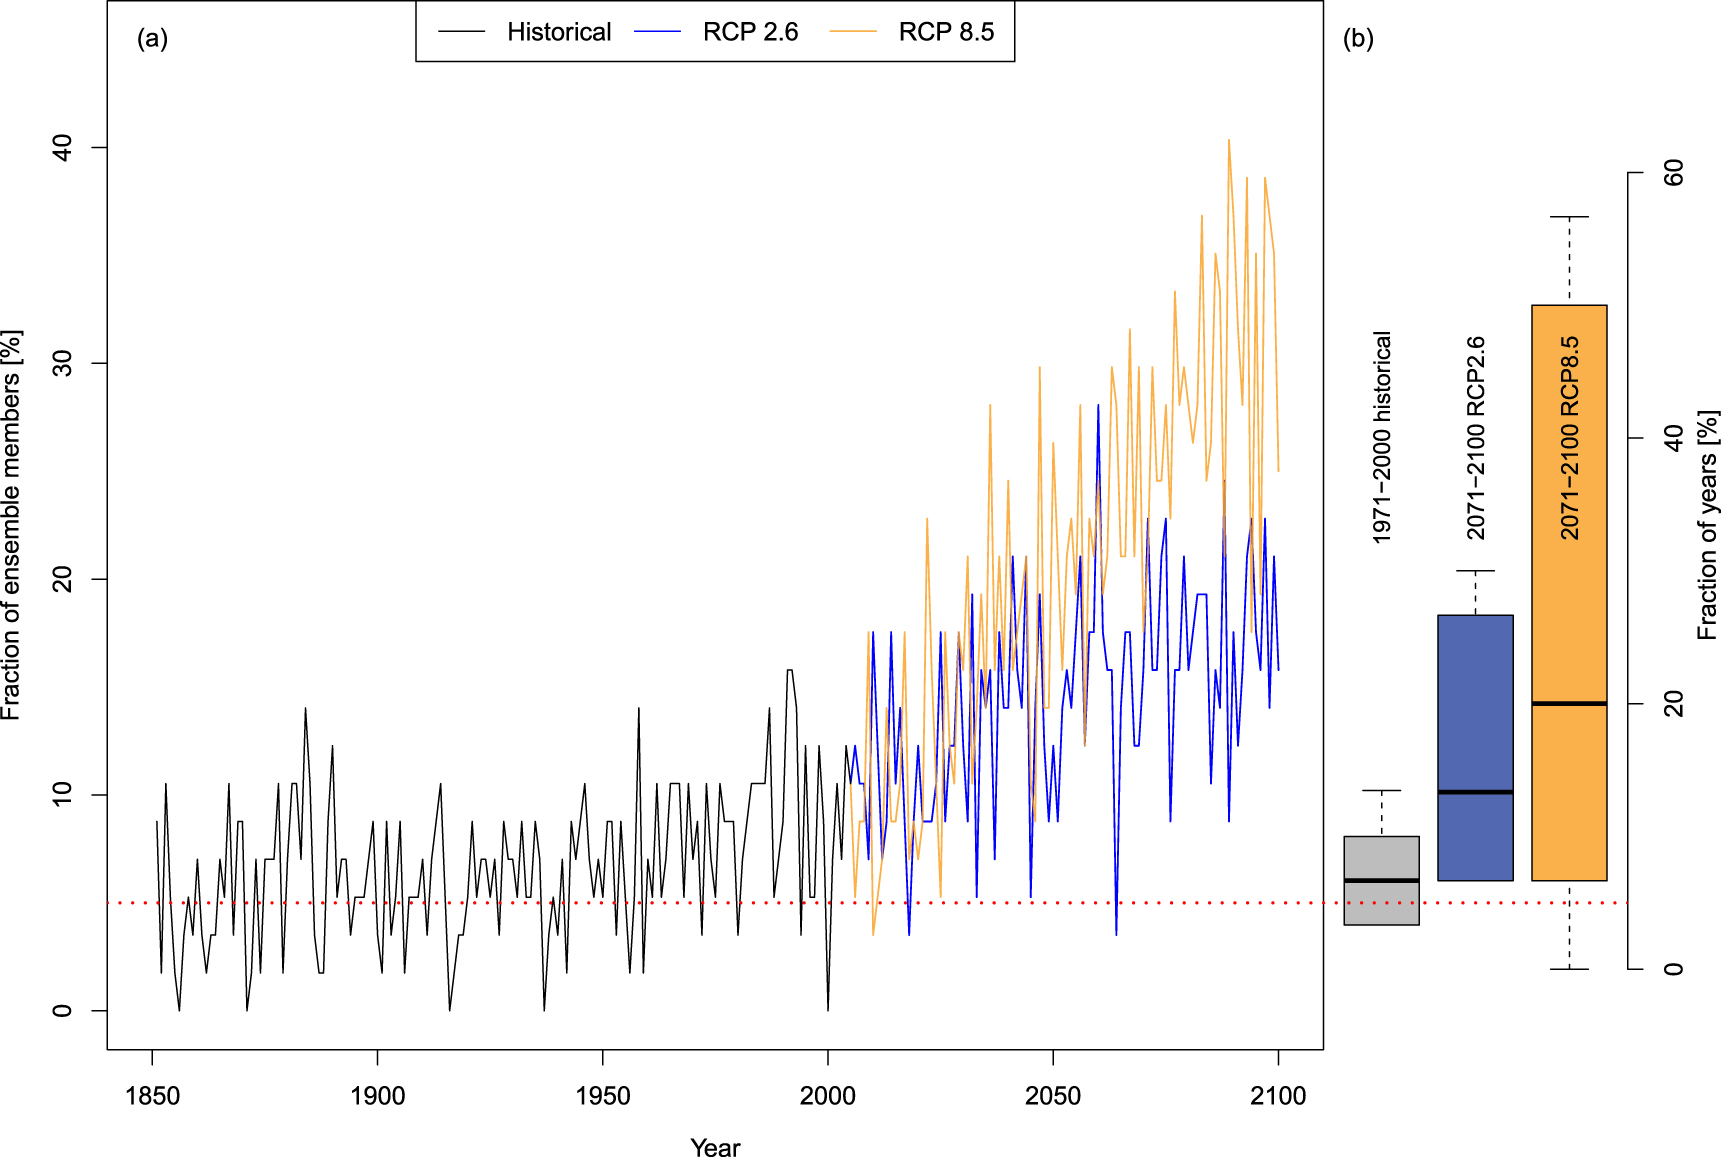
Next, we examine the future evolution in the occurrence of dry years. Figure 6(a) shows the fraction of model simulations exceeding their individual threshold (95th percentile of Uwind in 'picontrol') in each year. In RCP8.5, this fraction remains consistently above 5% (the expected value in natural pre-industrial conditions) after 2010, confirming the exceedance of pre-industrial conditions already relatively early in the century. While the fraction increases continuously in the RCP8.5 scenario, it stabilizes after ca. 2050 in RCP 2.6. In 2071–2100, the annual average fraction of simulations with dry conditions is 17% (RCP2.6) and 29% (RCP8.5). Figure 6(b) illustrates the fraction of dry years in the 1971–2000 and 2071–2100 periods. In RCP8.5 the ensemble median fraction of dry years increases to 20% in 2071–2100 meaning a projected increase of the occurrence of dry years by a factor of 4 relative to pre-industrial conditions. The ensemble spread is considerable for RCP8.5, with an interquartile range covering 7% to 50%. In other words, one out of four simulations indicates a chance of 50% for a year to be dry during 2071–2100. However, the (16–84%) uncertainty range of simulations encloses the defined threshold for dry years (red dotted line). For the RCP2.6 scenario both the median increase in dry years and ensemble spread are noticeably smaller than for RCP8.5.
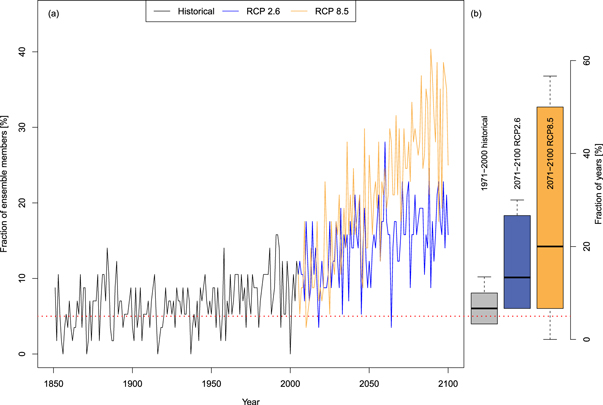
Figure 6. (a) Fraction of model simulations with Uwind above the pre-industrial 95% threshold in each year between 1850 and 2100. Black: 'historical' simulation, blue RCP2.6, orange: RCP8.5. (b) Fraction of years in the 1971–2000 and 2071–2100 periods exceeding the pre-industrial 95% threshold. The boxplots represent the 'full' model ensemble. Whiskers indicate the 16–84% range. Note the different scaling on the y-axis. The red dotted line represents the 'expected' value of 5% in natural pre-industrial conditions in both panels.
Download figure:
Standard image High-resolution imageFuture changes of precipitation distribution
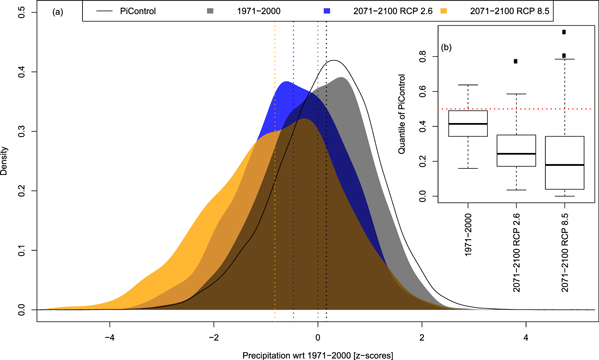
Last, we address the question, how the interannual precipitation distribution will change until the end of the 21st century. Figure 7(a) shows the pre-industrial, present and future precipitation distributions represented by the scaled Uwind values over the 'full' ensemble. For both future scenarios there is a shift toward lower z-scores. For example, the ensemble median average precipitation 2071–2100 in RCP8.5 corresponds to the 18th percentile in 'picontrol' (figure 7(b)). Average precipitation and the 5th percentile are projected to decrease by up to one standard deviation of present-day precipitation depending on the emission scenario (figure 7 and table 3). Expressed in units of millimeters, the projected ensemble median RCP8.5 precipitation decrease between present-day (1971–2000) and future (2071–2100) conditions is equivalent to a reduction of 33% (from 412 to 278 mm) for the station of Chinchayllapa, of 19% (483–392 mm) for the station of La Angostura and of 26% (262–193 mm) for the station of Orcocampa. The sign of projected changes in interannual standard deviation is not consistent across the model ensemble (table 3), confirming the small long-term changes in precipitation variability identified in table 2. Note that the apparent increase in variability indicated by the density plots in figure 7 is caused by the increased model ensemble spread (figures 3, 6(b) and 7(b)) rather than increased variance within the individual simulations (table 3).
Figure 7. (a) Precipitation distribution in the 'picontrol' run (black line), 1971–2000 period of the 'historical' simulations (gray shading), 2071–2100 in RCP2.6 (blue) and RCP8.5 (orange). The distributions are calculated over all values of all model ensemble members. Vertical dotted lines denote mean values. (b) Percentile of the 'picontrol' data, which the mean values over 1971–2000 and 2071–2100 are equal to. Red horizontal dotted line marks the 'expected natural' value of the 50th percentile. Boxplots represent the ensemble members.
Download figure:
Standard image High-resolution image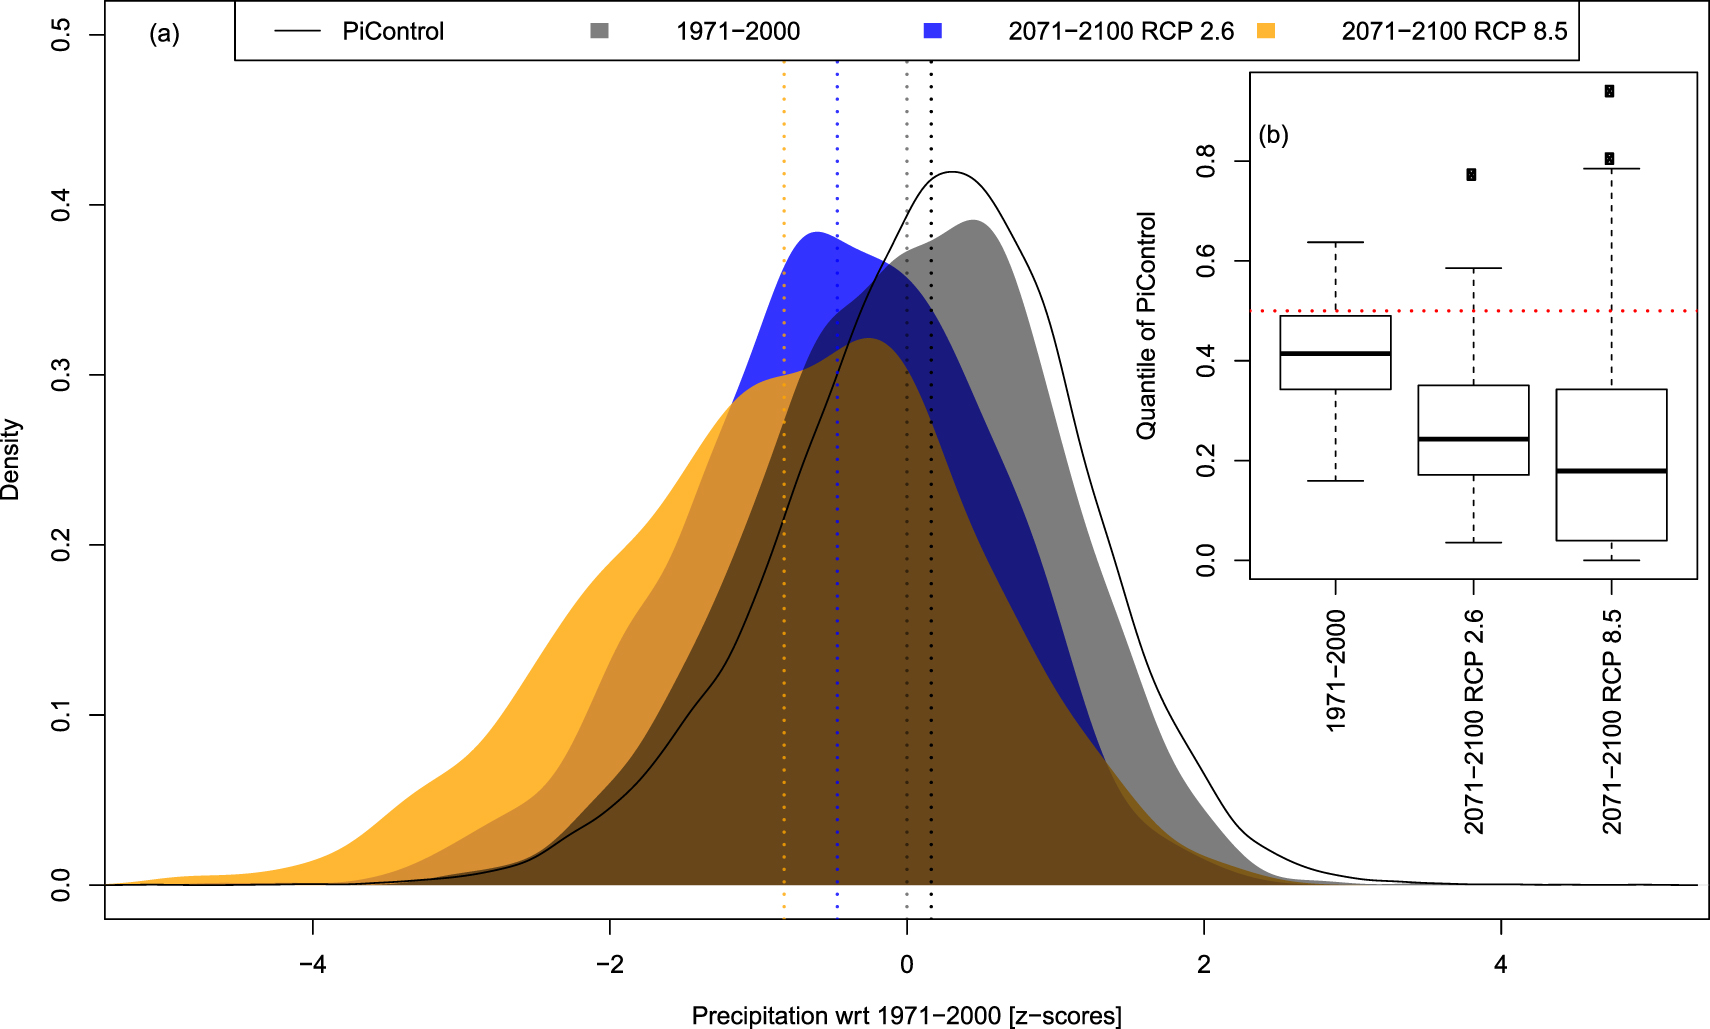
Table 3. Projected changes in precipitation statistics expressed as future (2071–2100) minus pre-industrial ('picontrol') values. Ensemble median and 16%–84% range (in brackets) are provided for the 'full' 57-member ensemble. Unit is standardized precipitation w.r.t. 1971–2000 (z-scores).
| RCP2.6 | RCP8.5 | |
|---|---|---|
| Mean | −0.66 [−1.02,−0.26] | −0.85 [−1.89,−0.25] |
| Standard deviation | −0.06 [−0.17,0.13] | −0.14 [−0.30,0.20] |
| 5th percentile | −0.50 [−0.99,0.07] | −1.05 [−1.83,0.24] |
Discussion
In line with previous studies (Minvielle and Garreaud 2011, Thibeault et al 2012), our analysis identified a future drying in Central Andes associated with a strengthening of the upper-tropospheric Westerlies. Here, however, we used updated scenarios and considerably larger model ensembles, and put the future projections into the context of natural pre-industrial variability. In terms of magnitude of the drying, the projected DJF precipitation decrease (19%–33% in RCP8.5) is slightly larger than the 10%–30% identified by Minvielle and Garreaud (2011).
As expected from the prescribed decrease in greenhouse gas emissions in the RCP2.6 scenarios, projected precipitation remains mostly constant for this scenario during the second half of the 21st century (figures 3 and 5). While interannual variability remains stable for the individual ensemble members (table 3), the ensemble spread increases towards the end of the 21st century in the RCP8.5 scenario (figures 3, 6 and 7). This indicates some inconsistency between the different models in simulating the magnitude of the drying effect with increasing greenhouse gas emissions.
Despite differences in the ability of the individual models to simulate absolute values and spatial patterns of Uwind (Yin et al 2013), the identified increase in Uwind is robust across the model ensembles (figures 3 and 5), which is coherent with previous experiments (Minvielle and Garreaud 2011). Moreover, our study confirms earlier results that the precipitation-Uwind relationship is stable over time (Garreaud et al 2003, Minvielle and Garreaud 2011). Yet, this large-scale pattern explains only ca. 20%–60% of the total variability in Central Andes precipitation (figures S2, S3 and Minvielle and Garreaud 2011). The remainder is probably controlled by local and regional variability and thus more difficult to simulate and predict, introducing additional uncertainties to the projected trend.
For example, the projected increase in moisture content of the air originating from the Amazon basin under climate changes scenarios (Minvielle and Garreaud 2011, Joetzjer et al 2013) may be less pronounced than expected. For instance, deforestation (e.g. Costa and Foley 1997, Medvigy et al 2011) can lead to decreased water availability, which would counteract the moisture content increase associated with higher evapotranspiration (e.g. Pokhrel et al 2014). In contrast to Uwind projections, the projected moisture content increase exhibits thus a much weaker consensus across the CMIP5 model ensemble and even a decreased agreement compared to CMIP3 (Joetzjer et al 2013). While recent work suggests that changes in the air moisture content will not affect the wind-driven drying trend in the Central Andes (Minvielle and Garreaud 2011), further inquiry is required to provide quantitative estimates of the interplay between these factors.
Another factor introducing uncertainties concerning the future relation between Uwind and Central Andes DJF precipitation is the El Niño-Southern Oscillation (ENSO), which is documented to strongly influence circulation patterns over the study area (Vuille et al 2000, Garreaud and Aceituno 2001). A projected SST increase in the tropical Pacific (IPCC 2014) would lead to stronger Uwind, hence more blocking of the moisture input from the Eastern tropical lowlands and drier conditions on the Central Andes. ENSO may therefore even strengthen the negative relationship between Uwind and precipitation in the future.
Short-term trends in precipitation over the instrumental period exhibit strong differences among the stations in the Central Andes (figure S1). Therefore, the underlying large-scale and long-term trend in precipitation induced by increased Uwind may be superimposed by considerable spatial variability. This complicates quantitative estimates of water availability on the local scale. Changes in seasonality are an additional uncertainty factor for water resources planning.
Conclusions and outlook
In this paper, we undertook an attempt to put present-day summer precipitation in the Central Andes into a multi-centennial context and link past conditions to the future. Our results confirm earlier findings that upper tropospheric Westerly flow is a suitable predictor of Central Andes precipitation (Vuille 1999, Garreaud and Aceituno 2001, Garreaud et al 2003, Vuille and Keimig 2004, Minvielle and Garreaud 2011, Thibeault et al 2012). However, we substantially expand this perspective by showing that late 21st century conditions may be unprecedented over the last Millennium and thus pose considerable challenges to Andean societies and ecosystems.
The 57-member model ensemble from the CMIP5 repository suggests a clear tendency towards less precipitation under both an optimistic as well as a pessimistic RCP scenario. Disclosed differences to pre-industrial conditions are relatively small for the instrumental period (1965–2010) but comparatively large already in the early 21st century. Under the assumption of a stable and linear relationship between precipitation and Uwind, a precipitation decrease of 19%–33% is projected for 2071–2100 relative to present-day conditions (RCP8.5). Results further indicate that, compared to pre-industrial conditions, the occurrence of dry years may increase by a factor of 4 by the end of the century. Even under the very conservative RCP2.6 scenario, the Central Andes are expected to experience drier conditions compared to pre-industrial times within the next few decades.
The projected drying is of particular relevance in the semi-arid region of the Central Andes, which is particularly vulnerable to climate change and where human society has already to cope with the socio-economic impacts of the negative trend in precipitation over the past century (Sietz et al 2012). Hence, even small changes in water supply can have major socio-economic consequences. Water availability has always been critical in this area (Sietz et al 2012) and water scarcity and allocation conflicts have accompanied and challenged societies over centuries. Our study is, to our knowledge, the first to put future precipitation projections in a pre-industrial perspective.
To face the projected decrease in average precipitation and increase in the probability of dry years, water allocation planning, increased water use efficiency, rainfall harvesting and water storage will be crucial elements of climate change adaptation policies for the Central Andes. Additional factors such as the projected increase in temperature, reduced availability of melt water caused in the medium term by glacier retreat, and increased competition for water resources among various economic sectors, are expected to accentuate the challenges associated with the management of water resources in the future (Lynch 2012). We conclude that already for mid-term planning, climate change adaptation and water management are key factors for the future socio-economic development of this region.
Acknowledgments
The authors acknowledge financial support by the Swiss Agency for Development and Cooperation (SDC) through the Programa de Adaptación al Cambio Climático (PACC) in Peru. RN is supported by the Swiss NSF grant PZ00P2_154802. DC is supported by FONDAP1511009. MSM is supported by CONICET and IAI (CRN2047). The authors thank the editor and the two anonymous reviewers for their time and comments on this study.