 Kefyalew Negisho1†
 Andrea Matros
 Klaus Pillen
 Frank Ordon
 Gwendolin Wehner
- 1National Agricultural Biotechnology Research Center, Ethiopian Institute of Agricultural Research (EIAR), Holeta, Ethiopia
- 2Melkassa Research Center, Ethiopian Institute of Agricultural Research (EIAR), Melkassa, Ethiopia
- 3Julius Kühn Institute (JKI), Institute for Resistance Research and Stress Tolerance, Quedlinburg, Germany
- 4Institute of Agricultural and Nutritional Sciences, Martin Luther University, Halle, Germany
Ethiopia is a major producer of durum wheat in sub-Saharan Africa. However, its production is prone to drought stress as it is fully dependent on rain, which is erratic and unpredictable. This study aimed to detect marker-trait associations (MTAs) and quantitative trait loci (QTLs) related to indices. Six drought tolerance indices, i.e., drought susceptibility index (DSI), geometric mean productivity (GMP), relative drought index (RDI), stress tolerance index (STI), tolerance index (TOL), and yield stability index (YSI) were calculated from least-square means (lsmeans) of grain yield (GY) and traits significantly (p < 0.001) correlated with grain yield (GY) under field drought stress (FDS) and field non-stress (FNS) conditions. GY, days to grain filling (DGF), soil plant analysis development (SPAD) chlorophyll meter, seeds per spike (SPS), harvest index (HI), and thousand kernel weight (TKW) were used to calculate DSI, GMP, RDI, STI, TOL, and YSI drought indices. Accessions, DW084, DW082, DZ004, C037, and DW092 were selected as the top five drought-tolerant based on DSI, RDI, TOL, and YSI combined ranking. Similarly, C010, DW033, DW080, DW124-2, and C011 were selected as stable accessions based on GMP and STI combined ranking. A total of 184 MTAs were detected linked with drought indices at –log10p ≥ 4.0,79 of which were significant at a false discovery rate (FDR) of 5%. Based on the linkage disequilibrium (LD, r2 ≥ 0.2), six of the MTAs with a positive effect on GY-GMP were detected on chromosomes 2B, 3B, 4A, 5B, and 6B, explaining 14.72, 10.07, 26.61, 21.16, 21.91, and 22.21% of the phenotypic variance, respectively. The 184 MTAs were clustered into 102 QTLs. Chromosomes 1A, 2B, and 7A are QTL hotspots with 11 QTLs each. These chromosomes play a key role in drought tolerance and respective QTL may be exploited by marker-assisted selection for improving drought stress tolerance in wheat.
Introduction
Globally, drought is a serious abiotic factor challenging crop production, productivity, and quality. It is enhanced by climate change leading to food and livelihood crises (Lobell et al., 2011). Singh et al. (2016) reported total crop failure and death of livestock due to drought in Ethiopia affecting nearly 10 million people, especially in the northern part of the country. Hence, Ethiopia is experiencing significant climate-induced drought and water-related stresses on crop and livestock productivity (Brown et al., 2017). Durum wheat (2n = 28, AABB, Triticum turgidum L. ssp. durum) is the most commonly cultivated form of allotetraploid wheat and is grown in 8% of the world's wheat area (FAO, 2016). In Ethiopia, durum wheat nearly accounts for 15–20% of wheat production and covers 30% of wheat cultivated land areas (Negassa et al., 2013). In Ethiopia, durum wheat is not only a staple crop for food security but also it becomes a major cash crop having 10–20% higher prices than bread wheat (Sall et al., 2019).
Ethiopia is one of the world's eight major Vavilovian centers of origin of crop plants, such as durum wheat and a major durum wheat producer, in sub-Sharan Africa (Vavilov, 1951; Sall et al., 2019). However, its production is fully dependent on rain, which is erratic and unpredictable, particularly in the low altitude regions (Simane et al., 1994). Ethiopia is currently harvesting crops only from 14 million out of 51.3 million hectares of arable lands [Tsegaye, 2017; Central Statistical Agency of Ethiopia (CSA)., 2018]. This is primarily due to drought stress and the lack of irrigation facilities among other production constraints. Therefore, the selection of drought-tolerant durum wheat genotypes has paramount importance in expanding its production to the untapped potential production areas and to use drought-tolerant genotypes in wheat improvement programs. The huge genetic diversity in Ethiopian durum wheat landraces could be a potential gene pool for national and international wheat improvements (Mengistu et al., 2015; Negisho et al., 2021). Thereby, the identification and use of drought-tolerant accessions from the existing genetic diversities could help to overcome the drastic effect of drought (Van Oosten et al., 2016).
Drought indices provide a mathematical measure for yield loss under drought stress conditions as compared to non-stress conditions in screening drought-tolerant genotypes (Fernandez, 1992; Mitra, 2001). They have been widely used for screening drought-tolerant genotypes in durum wheat (Patel et al., 2019), bread wheat (Abdolshahi et al., 2012; Song et al., 2017), barley (Sallam et al., 2019), and maize (Naghavi et al., 2013; Yousefi, 2015). The drought susceptibility index (DSI) is used to measure yield stability in wheat genotypes that apprehends the changes in both drought stress and non-stress environments (Fischer and Maurer, 1978). Guttieri et al. (2001) suggested genotypes with DSI values of <1 showing tolerance to drought stress. Genotypes with high values for yield stability index (YSI) (Bouslama and Schapaugh, 1984) and relative drought index (RDI) (Fischer et al., 1998) are generally regarded as stable under stress and non-stress conditions. Rosielle and Hamblin (1981) also proposed drought stress tolerance (TOL) criteria based on mean yield from drought stress and non-stress conditions. Similarly, the stress tolerance index (STI) (Fernandez, 1992) and geometric mean productivity (GMP) (Ramirez-Vallejo and Kelly, 1998) are useful indices for the identification of stable genotypes, which produce high yield under drought stress and higher or optimum yield under non-stress.
Quantitative trait loci have been detected for grain yield-related drought tolerance indices traits in wheat (Edae et al., 2014; Maccaferri et al., 2015; Qaseem et al., 2019) and chickpea (Kale et al., 2015). However, research on the identification of QTLs associated with drought tolerance indices for traits other than grain yield is scarce. For instance, Sukumaran et al. (2018) detected QTLs associated with drought indices (SSI, TOL, STI) calculated from grain yield (GY), thousand-grain weight (TGW), and grain number in durum wheat. Similarly, Ballesta et al. (2020) identified QTL-rich regions associated with drought indices (SSI, TOL, STI, and YSI) derived from grain yield (GY), TKW, and kernels per spike in bread wheat.
Association mapping was applied to identify QTLs for drought indices that were derived from GY and agro-physiological traits positively and strongly correlated (p < 0.001) with GY as an alternative selection approach to improve drought tolerance in wheat. Therefore, the objectives of this study were to detect MTAs and QTLs significantly associated with drought indices and to identify drought-tolerant as well as stable genotypes from a durum wheat study panel.
Materials and Methods
Study Panel
The study panel included 215 Ethiopian durum wheat landraces, 10 released durum wheat varieties and 10 advanced durum wheat lines from the Ethiopian Institute of Agricultural Research (EIAR), and 50 durum wheat lines from the International Wheat and Maize Improvement Centre (CIMMYT) (Negisho et al., 2021).
Field Experiments
The field phenotyping experiments were conducted in four locations for three seasons (2016–2018) in Ethiopia. The locations were grouped into two moisture variants, field drought stress (FDS) and field non-stress (FNS). An incomplete block alpha lattice design with 3 replications per location per accession was used. A detailed summary of field experiments and evaluated traits was presented in the study of Negisho et al. (2022).
Drought Indices Analysis
Phenotypic traits with significant (p < 0.05) ANOVA results for accessions, treatments, and accessions x treatment interaction, with moderate (52.25%) to high (74.91%) heritability for HI and SPS, respectively, were used. Also, traits with positive and significant (p < 0.001) correlation with GY under FDS and FNS conditions were selected to calculate drought indices (Negisho et al., 2022). These traits were GY, DGF, SPAD, SPS, HI, and TKW. Data across years and locations per FNS and FDS were combined to analyze the lsmeans. The lsmeans of these traits were estimated for each accession using the lme4 package in R (Lenth, 2016). Variance components of selected traits were computed by restricted maximum likelihood following the model of Yu et al. (2006). Then, drought indices (DSI, GMP, RDI, STI, TOL, and YSI) were calculated from lsmeans values of these traits. Pearson correlation coefficients (r) were analyzed by cor and Corstars function in R and plotted by the R package “corrplot” (Wei et al., 2017). Principal component analysis (PCA) for the drought tolerance indices was analyzed by R package FactoMineR (Husson et al., 2010). The description of drought indices and their corresponding equation are indicated in Table 1.
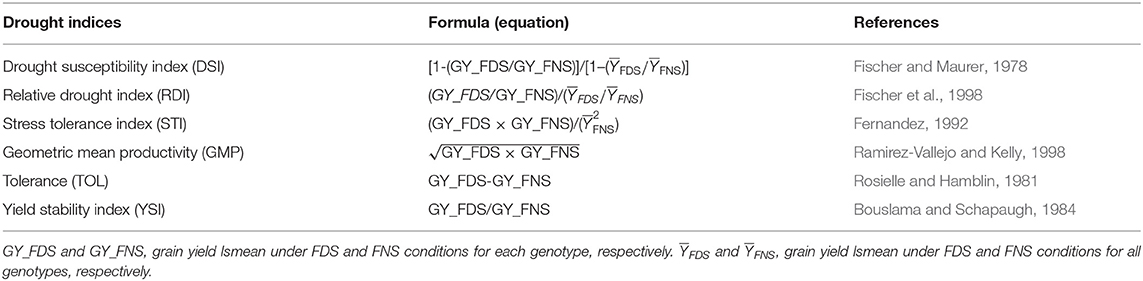
Table 1. Drought indices calculated from grain yield and from traits with a significant positive correlation (p < 0.001) with grain yield (GY) under FDS and FNS conditions.
Genotyping
Genotyping was conducted by SGS Trait Genetics, Gatersleben, Germany using the wheat 90k iSelect single-nucleotide polymorphism (SNP) array (Wang et al., 2014). The consensus linkage map of tetraploid wheat (Maccaferri et al., 2015) and the IWGSC RefSeq v1.0 genomic assembly (International Wheat Genome Sequencing Consortium, 2018) were applied to assign a genomic location to each SNP marker. SNP markers with minor allele frequency (MAF) of < 5%, missing data > 10%, and heterozygosity >12.5% were omitted, and SNP markers were imputed by the Beagle software package in R (Browning and Browning, 2007). A total of 11,919 SNPs with physical positions were taken from the reference sequence of durum wheat (Maccaferri et al., 2019). Population structure and genome-wide association study (GWAS) were taken from our previous study (Negisho et al., 2021). STRUCTURE HARVESTER (Earl and vonHoldt, 2012) was used to determine the q-matrix based on the results obtained for population structure by the STRUCTURE 2.3.4 software (Evanno et al., 2005). Linkage disequilibrium (LD), LD decay, and LD plots within and across chromosomes of durum wheat genomes (A and B) were analyzed using R packages “genetics,” “LDheatmap,” and “trio” (Shin et al., 2006; Warnes, 2013; R Development Core Team, 2014). Inter-marker genetic distances were assessed using the consensus physical position of durum wheat with 11,919 SNPs (Maccaferri et al., 2019). The critical r2 value was set at r2 ≥ 0.2 (Voss-Fels et al., 2015; Oyiga et al., 2017).
Genome-Wide Association Study
Genome-wide association study was conducted using the genome association and prediction integrated tool (GAPIT) in R (Lipka et al., 2012). FarmCPU method, which is iteratively using the fixed-effect model and the random effect model for powerful and efficient GWAS (Liu et al., 2016; de Souza et al., 2018), was used. MTAs were analyzed using calculated drought indices lsmeans as a phenotypic trait, filtered SNP markers, kinship matrix, and q-matrix (Yu et al., 2006). In this study, the Bonferroni correction test was too stringent to detect MTAs, thus, a threshold for significant MTAs was adjusted at –log10p ≥ 4.0 (Bai et al., 2016; Ma et al., 2016; Bhatta et al., 2018), and MTAs at FDR 5% were assessed (Benjamini and Hochberg, 1995). The PVE was calculated following (Teslovich et al., 2010). The detected MTAs were clustered into QTLs using the critical (r2 ≥ 0.2) LD decay value (4.78 Mb) (Negisho et al., 2022), and MTAs not in the LD were taken as an independent QTL (Kidane et al., 2017; Negro et al., 2019).
Based on the lsmeans of the combined analysis, each SNP locus in the MTAs with a positive phenotypic effect (ai > 0) was identified as a favorable allele, and those with a negative phenotypic effect (ai < 0) were identified as an unfavorable allele for the respective drought indices (Chong et al., 2019).
Even though it is difficult to make a comparison between the previously reported QTLs at the chromosomal position level, current and previous reports on QTLs related to drought indices in wheat were assessed and discussed (Dashti et al., 2007; Edae et al., 2014; Sukumaran et al., 2018; Qaseem et al., 2019; Arif et al., 2020; Ballesta et al., 2020).
Candidate Gene Analysis
Significant (–log10p ≥ 4.0) MTAs for drought index traits were aligned with the annotated sequence of Durum Wheat (cv. Svevo) RefSeq Release 1.0 at GrainGenes (Maccaferri et al., 2019). In addition, detected MTAs were further assessed for their association with drought tolerance using previously published literature. Finally, in case, the annotation is not found in Durum Wheat (cv. Svevo) RefSeq Release 1.0 at GrainGenes and also not reported so far in the previously published literature, and then, the detected MTAs were considered as novel.
Results
Mean grain yield under field non-stress (GY_FNS) and field drought stress (GY_FDS) conditions were 77.09 and 49.5 g/plot showing 35.79% GY reduction with 20.25 and 23.25% coefficient of variation, respectively (Table 2). The mean values of drought indices were 0.97, 1.01, 0.66, 61.49, 27.61, and 0.65 for DSI, RDI, STI, GMP, TOL, and YSI, respectively. Deviation of the data from the mean was expressed in percentage of standard deviation (SD%). A higher percentage of SD was observed for GY under FNS (15.61%) as compared to FDS (11.49%). Similarly, a higher percentage value of SD was detected for GMP (12.13%) and TOL (12.33%) as compared to the other drought indices. The coefficient of variation for the drought indices ranged from 19.27 (GY-STI) to 44.64% (GY-TOL) (Table 2). The 52% of the accessions (147) in the SP revealed GY-DSI values <1 that indicates the existence of drought-tolerant accessions. Out of drought-tolerant accessions, 96 were from Ethiopian durum wheat landraces, 9 from advanced lines, 7 from released varieties, and 35 were from the CIMMYT durum wheat collection, and the top 26 (9%) are visualized in Figure 1. DW084, DW082, DZ004, C037, and DW092 were selected as the top five drought-tolerant accessions based on the combined rank of GY-DSI, GY-RDI, GY-TOL, and GY-YSI (Figure 1, Supplementary Table S1). Additionally, accessions with high value based on the combined rank of GY-GMP and GY-STI are considered as stable genotypes under FDS and FNS. Based on GMP and STI drought indices ranking C010, DW033, DW080, DW124-2, and C011 were selected as the top five stable accessions. The remaining 138 (48%) accessions in the SP showed a GY-DSI value higher than one indicating the susceptibility of the accessions to drought.
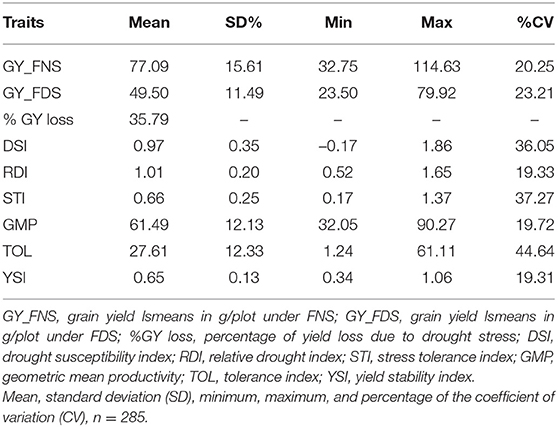
Table 2. Descriptive statistics for grain yield (GY) drought indices.
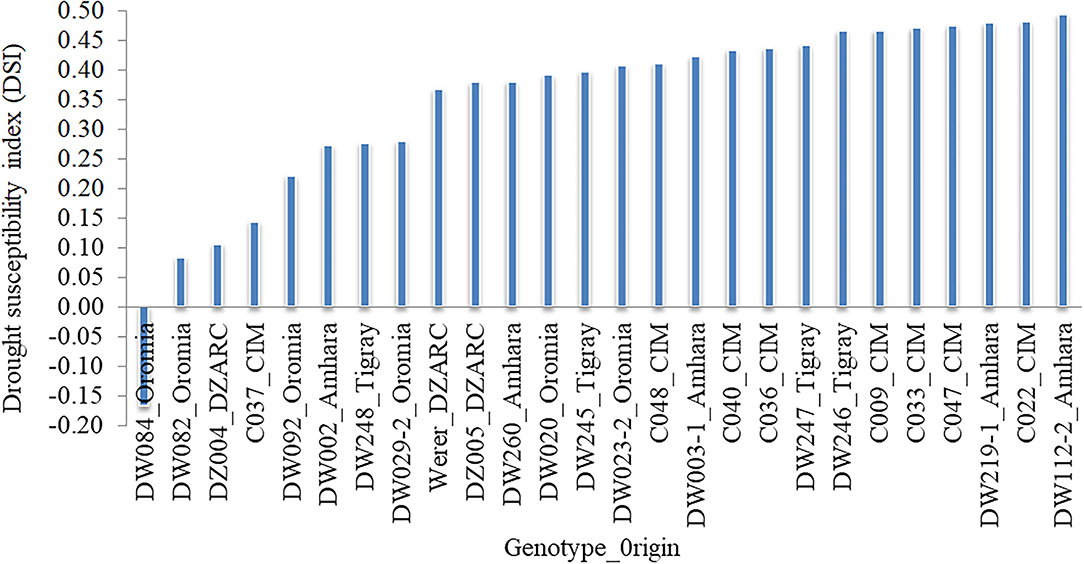
Figure 1. Top 26 drought tolerant accessions identified based on the drought susceptibility index calculated from grain yield (GY). The x-axis indicates selected genotypes and seed origin with DSI < 0.5 and the y-axis shows DSI values.
Correlation Analysis
A significant positive correlation was observed between GY_FNS and GY_FDS (r = 0.62) (Figure 2). Likewise, GY_FNS and GY_FDS were significantly and positively correlated with GMP (r = 0.88 and 0.92) and STI (r = 0.86 and 0.92), respectively.
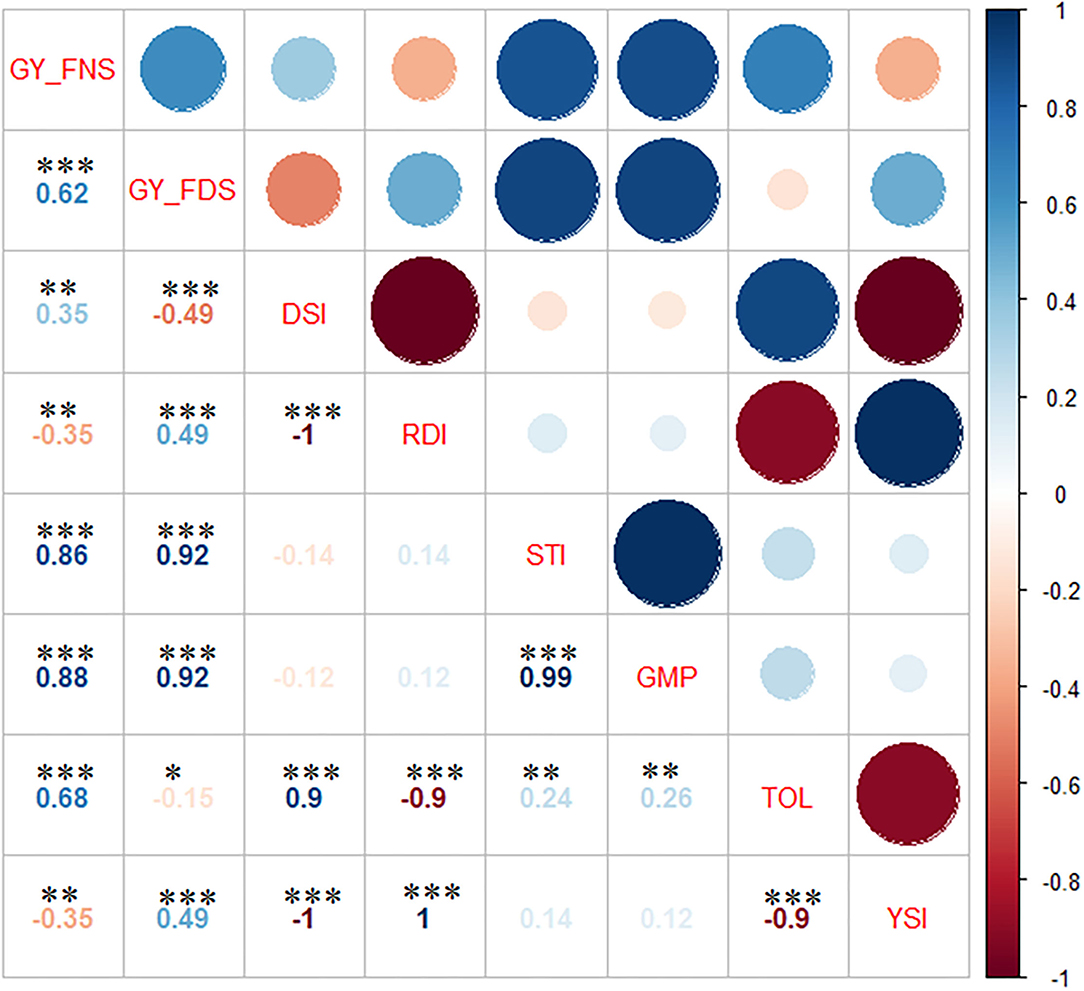
Figure 2. Pearson correlation between the drought indices traits. GY_FNS, lsmeans from FNS at Holeta and Debre Zeit; GY_FDS, lsmeans from FDS at Dera and Melkassa; DSI, Drought susceptibility index; RDI, relative drought index; STI, stress tolerance index; GMP, geometric mean productivity; TOL, tolerance index; YSI, yield stability index. *, **, and *** significance at p < 0.05, p < 0.01, and p < 0.001, respectively.
GY_FNS was significantly and positively correlated with DSI (r = 0.35) and TOL (r = 0.68), but a significant (r = −0.35) negative correlation was observed with RDI and YSI. GY_FDS was significantly (r = 0.49) and positively correlated with RDI and YSI but significantly and negatively correlated with DSI (r = −0.49) and TOL (r = −0.15). There was a significant positive correlation between DSI and TOL (r = 0.9). A highly significant (r = −1.0) negative correlation was observed between RDI and YSI. RDI was significantly and positively correlated with YSI (r = 1.0) but showed a strong significant negative correlation with TOL (r = −0.9). STI and GMP showed a significant (r = 0.99) positive correlation. STI and GMP revealed a significant positive correlation with TOL (0.24 and 0.26), respectively. Finally, there was a strong significant negative (r = −0.9) correlation between TOL and YSI.
PCA
PCA1 and PCA2 explained 52.9 and 46.3% of the variation among drought indices, respectively (Figure 3). PCA clustered the drought indices into three groups (G1, G2, and G3). G1 indicated drought-tolerant accessions with higher values of YSI and RDI, G2 indicated stable accessions with higher values of GY_FNS, GY_FDS, GMP, and STI, and G3 showed drought-tolerant accessions with lower values of DSI and TOL. A narrow angle (<90°) shows a positive correlation within each group, whereas a wide angle (>90°) indicates a negative correlation, e.g., between G1 and G3. Hence, GY_FNS was positively correlated with GY_FDS, STI, GMP, TOL, and DSI, but negatively correlated with YSI and RDI. Similarly, GY_FDS was positively correlated with GY_FNS, YSI, RDI, STI, and GMP but negatively correlated with DSI and TOL as was revealed by Pearson correlation analysis (Figure 2; Supplementary Figure S1).
Figure 3. PCA showing the contribution of drought indices. PCA1 and PCA2 accounted for 99.2% of total variations among drought indices.
Marker-Trait Association Analysis for Drought Indices
A total of 184 MTAs were detected across the durum wheat genome for the analyzed drought indices at –log10p ≥ 4.0 (Table 3) explaining up to 26.61% of the total phenotypic variation. The Manhattan plots for MTAs were indicated in Supplementary Figures S2–S7. A total of 41 (22.28%) of the significant MTAs detected were associated with two or more drought indices highlighted in blue color (Supplementary Table S2). Predominantly, 16 (39.02%) of these stable MTAs were associated with GMP and STI drought indices.
Table 3. Significant (–log10p ≥ 4.0) marker-trait associations (MTAs) and quantitative trait loci (QTL) that were detected for the drought indices traits calculated from grain yield and traits significantly (p < 0.001) positively correlated with grain yield under FNS and FDS.
In this study, SNP alleles with positive effects that led to increased drought index traits were defined as “favorable alleles.” Accordingly, five major MTAs were detected associated with GY-GMP as favorable SNP alleles (>10% PVE): RFL_Contig2569_2187 on chromosome 3B at 752,249,328 bp, Kukri_c22602_704 on chromosome 4A at 733,371,835, IAAV2346 on chromosome 5B at 17,863,862 bp, wsnp_Ex_c3940_7144946 on chromosome 6B at 508,076,861 bp, and Tdurum_contig4658_346 on chromosome 7B at 663,797,774 bp. On the other hand, four major MTAs were detected associated with GY-GMP as unfavorable SNP alleles: Tdurum_contig10785_2433 on chromosome 2A at 12,102,513 bp, Kukri_rep_c116526_98 on chromosome 5A at 112,213,041 bp, BobWhite_C21378_234 on chromosome 7A at 693,389,984 bp, and wsnp_Ex_c5839_10246915 on chromosome 7A at 709,145,347 bp. From these, three major MTAs with favorable SNP alleles located on chromosomes 2B, 5B, and 7B, and two major MTAs with unfavorable SNP alleles located on chromosomes 7A were novel MTAs. Generally, in this study, the phenotypic effect size on drought indices ranged from −5 to 5 (Supplementary Table S2).
Candidate Genes
Candidate genes for MTAs linked with drought tolerance were calculated from grain yield with identified positive phenotypic effect size, particularly U-box domain-containing protein on chromosome 4A associated with GY-GMP, potassium transporter on chromosome 3B associated with GY-GMP, MODIFIER OF SNC1 1 G on chromosome 5A associated with GY-GMP, and cytochrome P450 family protein on chromosome 7A associated with GY-RDI. As regards the MTAs associated with drought indices calculated from DGF, the genes identified were methyltransferase on chromosome 4A and leucine-rich repeat receptor-like kinase (LRK2) on chromosome 6B associated with DGF-TOL. In this study, other important MTAs identified associated with drought tolerance were as follows: UNC93-like protein on chromosome 5A associated with SPAD-GMP, ribosomal protein on chromosome 4B associated with HI-TOL, HI-RDI, HI-YSI, Acyl-CoA dehydrogenase-related family protein on chromosome 2B associated with TKW-TOL, and RNA-binding protein on chromosome 1A associated with HI-DSI.
MTA Cluster Into QTL
The detected MTAs for drought tolerance indices were clustered into 102 QTLs (Supplementary Table S3). The numbers of QTLs detected from the highest to the lowest were 28, 27, 13, 13, 11, and 10 for STI, GMP, DSI, RDI, TOL, and YSI drought indices, respectively (Supplementary Table S3; Figure 4). Out of which, 43 stable QTLs harbor more than one drought tolerance index (up to four drought indices), for instance, four drought indices QTLs were co-located on chromosome 4B between 487,222,406–497,250,660 and 4,927,519–9,941,646 bp shown in red color. In contrast, some detected QTLs like those located on chromosome 1A between 478,563,347–488,591,601 and 66,026,146–76,054,400 bp are examples of individual QTLs for STI and GMP, respectively, as indicated by black color (Figure 4).
Figure 4. Linkage map showing number of QTLs detected for drought indices. Co-clustered QTLs were marked in red color and in parenthesis, and individual QTLs were marked in black color.
A total of twenty-eight detected QTLs for STI were calculated from SPS, SPAD, GY, DGF, TKW, and HI traits, out of which, ten stable QTLs are co-located with QTL for GMP, DSI, RDI, and YSI located on chromosomes 1A, 2B, 3B, 4B, 5A, 7A, and 7B. The remaining 18 were individual QTLs for STI. Out of 28 selected QTLs for STI located on chromosomes 1A (3 QTLs), 2B (3 QTLs), 3B (2 QTLs), 4B (3 QTLs), 5A, 6B, and 7B (3 QTLs), 16 were not reported so far and are likely to be novel. A total of twenty-seven QTLs were detected for GMP calculated from HI, TKW, SPAD, GY, SPS, and DGF traits, out of which, ten stable QTLs were co-located with QTL for STI, DSI, YSI, and RDI on chromosomes 1A, 1B, 2A, 2B, 3A, 5A,6A, 6B, and 7A, whereas the other 17 detected QTLs were individual QTLs for GMP. Out of the 27 detected QTLs for GMP, 26 could be novel.
As regarded the 13 detected QTLs for DSI were calculated from HI, SPS, TKW, SPAD, DGF, and GY traits, of which six stable QTLs are co-located with QTL for RDI and YSI on chromosomes 1A, 1B, 2B, 3B, and 4A. The remaining seven were individual QTLs for DSI. From the six co-located QTLs for DSI, three QTLs were associated with RDI located on chromosomes 1A, 2B, and 3B between 449,301,491–459,329,745, 44,634,623–54,662,877, and 654,733,402–664,761,656 bp, respectively. Similarly, DSI QTLs were co-located with RDI and YSI located on chromosomes 1B between 5,764,433–15,792,687 bp and on 4A between 722,943,476–732,971,730 and 612,075,413–622,103,667 bp. Seven QTLs detected for DSI located on chromosomes 1A, 1B, 2A (2 QTLs), 2B, 3B, and 6A were not reported so far and are novel putatively QTLs.
The 13 detected QTLs for RDI were calculated from DGF, SPAD, GY, HI, and TKW traits, of which seven stable QTLs included were co-located with GMP, DSI, YSI, and STI on chromosomes 1A, 2A, 4B, 6B, 7A, and 7B, whereas the others six detected were individual QTLs. The ten QTLs detected for RDI, located on chromosomes 1A (2 QTLs), 1B (2 QTLs), 2A, 5A, 6B, 7A (2 QTLs), and 7B, were could be new.
The 11 detected QTLs for TOL were calculated from HI, TKW, and DGF. Three QTLs are co-located with QTL for YSI and RDI on chromosomes 2A, 5B, and 6B, and the remaining eight are individual QTLs for TOL. In particular, five QTLs for TOL that were located on chromosomes 2A (2 QTLs), 4A, 6B, and 7A, were putatively novel.
The 10 detected QTLs for YSI were calculated from SPAD, DGF, HI, and GY, of which seven QTLs located on chromosomes 1A, 3A, 4B, 6B, and 7A were co-located with QTLs for DSI, GMP, RDI, TOL, and STI. The remaining eight QTLs for YSI were likely to be new.
The distribution of single MTA/QTL on genomes A and B was 48%/47% and 52%/53%, respectively (Table 3). Chromosomes 1A, 2B, and 7A each harbor eleven QTLs, which is the highest number of QTLs detected per chromosome followed by ten QTLs each were detected on chromosomes 4B and 6B, and nine QTLs were detected on chromosome 2A (Figure 5). In our study, these chromosomal regions were considered as QTL hotspots for drought tolerance in durum wheat. The lowest numbers of QTLs (3) each were detected on chromosomes 3A and 6A. Six (5.88%) of the detected QTLs were major QTLs and all of them were associated with GY-GMP drought index between 658,783,647–668,811,901, 503,062,734–513,090,988, 107,198,914–117,227,168, 678,867,539–688,895,793, 7,088,386–17,116,640, and 688,375,857–698,404,111 bp and located on chromosomes 7B, 6B, 5A, 2B, 2A, and 7A with 22.21, 21.91, 17.00, 14.72, 14.59, and 13.59% PVE, respectively (Supplementary Table S3).
Figure 5. The number of detected marker-trait associations (MTAs) and quantitative trait loci (QTLs) that were detected for drought indices across the durum wheat genome.
Discussion
Drought tolerance is a complex quantitative trait, which is affected by the timing and severity of drought stress relative to plant development and growth. In this study, 35.79% GY reduction was observed under field conditions in durum wheat due to drought stress. In agreement with this, depending on plant growth stage and severity of drought, 60% in durum wheat (Sukumaran et al., 2018) and 10–76% grain yield reduction in bread wheat have been reported (Grzesiak et al., 2019). Nevertheless, studies revealed that in wheat, the effect of drought stress is more pronounced during the reproductive stage (Nezhadahmadi et al., 2013). In our study, 147 (52%) accessions from the study panel revealed a GY-DSI value of <1, indicating drought tolerance, whereas 138 (48%) showed a GY-DSI higher than 1, implying that these genotypes are drought susceptible. This suggests that in this study, drought stress was moderate but enough to facilitate the selection of drought-tolerant accessions. Moderate drought stress was reported as recommended to select drought-tolerant wheat lines (Ali and El-Sadek, 2016; Patel et al., 2019).
From our previous experimental procedures under FDS and FNS conditions, traits from which drought indices were calculated showed significant (p < 0.05) differences among durum wheat accessions, between treatments, and for accession x treatment interaction. This illustrates the broad genetic diversity present in the panel herein used for drought tolerance in general and in Ethiopian durum wheat landraces in particular (Negisho et al., 2021). Also, moderate to high heritability values and a significant (p < 0.001) correlation with GY under FDS and FNS conditions have been found in this study. This relation provides the basis for utilizing drought tolerance indices as a means to explain the phenotypic variation. It has been also reported that drought tolerance indices can be derived from GY and traits that are strongly and positively correlated with GY as a measure for selecting the best genotypes (Farshadfar et al., 2012; Patel et al., 2019; Ayed et al., 2021).
The significant (r = 0.62) positive correlation between GY_FNS and GY_FDS suggests that high GY performance under the FNS condition is generally closely connected with stable and high GY under FDS conditions. Similarly, studies depicted a positive and significant correlation between GY under favorable and drought stress conditions in durum wheat (Patel et al., 2019), bread wheat (Ali and El-Sadek, 2016), and rice (Mau et al., 2019). The strong and positive correlation of GY_FNS and GY_FDS: GMP (r = 0.88 and 0.92) and STI (r = 0.86 and 0.92), respectively, suggests that GMP and STI may be potential drought indices to select stable and relatively higher-yielding accessions under drought stress conditions. Respectively, GMP and STI were reported as convenient drought indices parameter to select stable and high-yielding durum wheat genotypes under drought stress and non-stress conditions (Patel et al., 2019; Ayed et al., 2021). Interestingly, in this study, three out of the top five accessions selected based on the combined rank of drought indices were from Ethiopian durum wheat landraces and could be recommended as parents for wheat drought-tolerant improvement breeding with other cultivars.
The first two PCAs explained 99.2% of the total variation among drought indices and clustered the drought indices into three groups, G1 indicating drought-tolerant accessions with high values of RDI and YSI, G2 indicating yield-stable and drought-tolerant accessions with high values of GY_FNS, GY_FDS, GMP, and STI, and G3 indicating drought-tolerant accessions with lower values for DSI and TOL. The PCA angles in our study also allowed us to interpret the interrelationships among the drought indices and were confirmed with correlation analysis and scatter plot results (Figure 3; Supplementary Figure S1).
In this study, a total of 102 QTLs were detected at –log10p ≥ 4.0. The number of QTLs on A and B genomes was (48%) and (52%), respectively. In accordance, research results showed a larger number of QTLs on the B genome as compared to the A genome in durum wheat (Soriano et al., 2017; Desiderio et al., 2019; Alemu et al., 2020; Ballesta et al., 2020). Similarly, using simple sequence repeat (SSR) and diversity array technology (DArT) markers, Maccaferri et al. (2014) mapped a higher number of markers on the B genome as compared to the A genome. Our result showed at the chromosomal level, a higher number of QTLs (11.78%) each were located on chromosomes 1A, 2B, and 7A, suggesting that these genome regions are QTL hotspots and play a pivotal role in drought tolerance in wheat. In this study, a considerable number of QTLs, namely, 6 (5.88%), were detected for drought indices on chromosome 4A, which is in agreement with the result reported by Ballesta et al. (2020).
In our study, six of the 13 QTLs detected for DSI were on chromosomes 2B, 4A (2 QTLs), 4B, 6B, and 7A between 44,634,623–54,662,877, 612,075,413–622,103,667, 722,943,476–732,971,730, 587,392,128–597,420,382, 534,453,653–544,481,907, and 658,941,965–668,970,219 bp, respectively (Supplementary Table S3). Accordingly, studies reported QTLs for DSI located on chromosomes 2B, 4A (2 QTLs), 4B, 6B, and 7A (Dashti et al., 2007; Edae et al., 2014; Sukumaran et al., 2018; Ballesta et al., 2020). To the best of our knowledge, seven QTLs detected for DSI located on chromosomes 1A, 1B, 2A (2 QTLs), 2B, 3B, and 6A between 449,301,491–459,329,745, 5,764,433–15,792,687, 24,208,804–34,237,058, 766,212,336–776,240,590, 52,165,550–62,193,804, 654,733,402–664,761,656, and 3,084,526–80,98,653 bp were not reported so far and could be novel.
Edae et al. (2014) detected QTLs for SPS-DSI located on chromosomes 7A and 7B using DArT markers. However, we did not find QTL for SPS-DSI on these chromosomes. In this study, QTLs for SPS-STI were detected on chromosomes 1A, 2A, 3B, 4B, 5A, and 7A. Edae et al. (2014) also detected QTL GY-DSI located on chromosome 4A, but no QTL was detected for GY-DSI on this chromosome.
In this study, three out of the 13 QTLs for RDI were detected on chromosomes 4A, 4B, and 5B between 704,477,416–714,505,670, 487,222,406–497,250,660, and 630,323,029–64,0351,283 bp, respectively. Similarly, studies reported QTLs for RDI on chromosomes 4A (Arif et al., 2020) and 4B (Ballesta et al., 2020) and chromosome 5B (Arif et al., 2020). The other QTLs detected for RDI could be new. A QTL was detected associated with GMP on chromosome 3B between 512,345,933–522,374,187 bp. In agreement with, Dashti et al. (2007) reported a QTL on chromosome 3B using SSR marker in doubled haploid bread wheat associated with GMP. In our study, 12 of the 28 detected QTLs for STI were on chromosomes 1A, 2B (2 QTLs), 2A, 2B, 4A, 5A, 5B, 6B, and 7A (2 QTLs) between 478,563,347–488,591,601, 627,518,169–637,546,423, 663,977,245–674,005,499, 752607375–762,635,629, 698,319,457–708,347,711, 621,025,922–631,054,176, 76,490,700–86,518,954, 12,849,735–22,877,989, 683,730,386–693,758,640, 340,762,156–350,790,410, 368,439,457–378,467,711, and 704,181,285–714,209,539 bp, in that order. In agreement with this, studies in wheat QTLs were reported for STI on chromosomes 1A, 1B, 2A, 2B, 4A, 5A, 5B, 6B, and 7A (Dashti et al., 2007; Sukumaran et al., 2018; Qaseem et al., 2019; Arif et al., 2020; Ballesta et al., 2020). The remaining 18 detected QTLs for STI were likely to be novel QTLs.
Moreover, six out of the 11 QTLs identified for TOL were detected on chromosomes 2B, 3A, 5A, 5B (2 QTLs), and 7B between 91,393,993–101,422,247, 529,677,366–539,705,620, 513,570,349–523,598,603, 433,014,029–443,042,283, 540,970,848–550,999,102, and 695,007,223–705,035,477 bp, respectively. Consistent with this result, studies revealed QTLs for TOL located on chromosomes 2B, 3A, 5A, 5B, and 7B (Dashti et al., 2007; Sukumaran et al., 2018; Arif et al., 2020; Ballesta et al., 2020). However, five of the 11 detected QTLs for TOL located on chromosomes 2A (2 QTLs), 4A, 6B, and 7A were not reported so far and could be novel. Out of the detected 10 QTLs for YSI, two were located on chromosomes 4B and 6B between 649,804,818–659,833,072 and 563,024,848–573,053,102 bp, correspondingly. Similarly, Ballesta et al. (2020) reported QTLs for YSI on chromosomes 4B and 6B, whereas the remaining eight are likely new QTLs.
In general, 30 out of the 102 detected QTLs for drought indices were previously reported (Dashti et al., 2007; Sukumaran et al., 2018; Qaseem et al., 2019; Arif et al., 2020; Ballesta et al., 2020), whereas 72 QTLs reported in this study are likely novel QTLs.
In this study, MTAs that were previously reported associated with drought stress tolerance and/or their annotation show associations with drought stress tolerance are considered as candidate genes. Accordingly, one MTA was identified associated with GY-GMP on chromosome 4A (Kukri_c22602_704) at 733,371,835 bp, annotated as a U-box domain-containing protein. In agreement, studies indicated the involvement of these proteins in drought stress in barley (Ryu et al., 2019) and in drought and salinity stresses in Arabidopsis (Cho et al., 2006). Another MTA was detected associated with GY-GMP on chromosome 6B (wsnp_Ex_c3940_7144946) at 508,076,861 bp, annotated as a DNA topoisomerase 2. Similarly, studies showed the upregulation of DNA topoisomerase 2 under abiotic stresses, such as cold and salinity in tobacco and pea (John et al., 2016; Tammaro et al., 2016). An MTA was detected associated with GY-GMP on chromosome 3B (RFL_Contig2569_2187) at 752,249,328 bp, annotated as a potassium transporter. Congruent to this, Ouyang et al. (2010) and Cheng et al. (2018) reported overexpression of a potassium transporter (OsHAK1) in rice enhanced drought tolerance at both vegetative and reproductive stages via decreasing the levels of lipid peroxidation, increasing proline accumulation, and improving the activities of antioxidant enzymes. One MTA was detected on chromosome 5A (Kukri_rep_c116526_98) associated with GY-GMP at 112,213,041 bp, annotated as a Protein MODIFIER OF SNC1 1 G. In line with this, the research report showed the involvement of MOS14 (protein modifier of snc1-1, 14) in drought tolerance in Arabidopsis (Xu et al., 2016). As regards, the MTA was detected associated with GY-GMP and GY-STI on chromosome 2A (Tdurum_contig10785_2433) at 12,102,513 bp, annotated as an NBS-LRR-like resistance protein. It is known that NBS-LRR-like resistance protein is particularly involved in resistance to various diseases (Shao et al., 2014; Dubey and Singh, 2018), as well as in drought stress tolerance (Chini et al., 2004; Rampino et al., 2017).
An MTA was identified associated with GY-RDI and HI-DSI on chromosome 1A (Ra_c2895_591) at 454,315,618 bp, annotated as an RNA-binding protein (RBP). Similarly, Marondedze et al. (2019) reported that RBPs operate as a post-transcriptional modulator in drought stress in Arabidopsis by controlling the stability of metabolic processes for short and long-term stress adaptations. The other MTA was detected associated with GY-STI, HI-GMP, HI-STI, SPAD-GMP, and SPS-GMP on chromosome 5A (Tdurum_contig76578_537) at 110,830,599 bp, annotated as UNC93-like protein. Likewise, a study indicated that UNC93 functions as a positive regulator of drought stress tolerance via ABA-dependent signal transduction pathways (Xiang et al., 2018). An MTA was detected associated with GY-RDI on chromosome 7A (Excalibur_c24593_1217) at 7,721,495 bp, annotated as cytochrome P450 family protein. In agreement, research reports elucidated that cytochrome P450 family protein involves in drought and salinity stresses (Narusaka et al., 2004; Ehlting et al., 2008; Jun et al., 2015). Particularly, Melloul et al. (2014) showed the upregulation of cytochrome P450 proteins in durum wheat leaves under drought stress. Another MTA was identified associated with DGF-TOL on chromosome 4A (IAAV1775) at 590,188,609 bp, annotated as a methyltransferase. Respectively, Lu et al. (2020) indicated that this protein enhances drought resistance in poplar plants by leading to a higher density of trichomes and a better-developed root system.
Marker-trait association was detected associated with DGF-RDI, DGF-TOL, and DGF-YSI on chromosome 6B (Tdurum_contig61383_627) at 36,557,072 bp, annotated as a leucine-rich repeat receptor-like protein kinase family protein. Similarly, a study on rice revealed that this family protein increases drought tolerance via promoting root growth while reducing plant height (Kang et al., 2017). Another MTA was detected associated with HI-RDI, HI-TOL, and HI-YSI, on chromosome 4B (tplb0050b23_546) at 4,927,519 bp, annotated as a Ribosomal protein. In agreement, research results indicated the upregulation of ribosomal proteins under drought stress in the root of drought tolerant bread wheat cultivar (Arg) (Ma et al., 2016). MTA was identified associated with TKW-TOL on chromosome 2B (Kukri_c36879_83) at 96,408,120 bp, annotated as acyl-CoA dehydrogenase-related family protein. Similarly, a study revealed that this protein is one of the drought-responsive protein species in leaves and is altered under dehydration (Wang et al., 2016).
Chromosomes 1A, 2B, and 7A are identified as QTL hotspots each encompassing 11 QTLs between 2,116,602–577,966,934, 10,629,564–745,910,537, and 172,269–704,181,285 bp, respectively (Supplementary Table S3). Despite the identification of several QTLs that were associated with drought indices in our study, further validations and investigations are needed to understand the molecular functions of the associated genes in drought stress-response mechanisms in wheat. Major QTLs with favorable SNP alleles identified in this study could be used to develop polymerase chain reaction (PCR)-based markers, such as cleaved amplified polymorphic sequence (CAPS) and competitive allele-specific polymerase chain reaction (KASP) markers, to facilitate future marker-assisted breeding in wheat.
Conclusion
Durum wheat Triticum turgidum ssp. durum accessions used in our study showed large natural variation (p < 0.0001) for drought tolerance as assessed based on six agro-physiological traits, including GY. Among the investigated drought indices, significant correlations were observed and criteria defining drought-tolerant accessions could be defined. Based on the combined rank of GY-DSI, GY-RDI, GY-TOL, and GY-YSI, DW084, DW082, DZ004, C037, and DW092 were identified as the most drought-tolerant accessions. Similarly, based on the combined rank of GY-GMP and GY-STI, C010, DW033, DW080, DW124-2, and C011 were selected as the best stable accessions both under FDS and FNS conditions. Major MTAs with favorable SNP alleles identified in this study may be used to develop DNA markers, such as CAPS and KASP markers, for marker-assisted breeding for drought stress tolerance in wheat. The detected MTAs were further clustered into 102 QTLs. Chromosomes 1A, 2B, and 7A are QTL hotspots with 11 QTLs each. A higher number of QTLs (52%) linked to drought indices were detected on the B genome. Six (5.88%) of the identified QTLs represent major QTLs with higher than 10% PVE. The detected major QTLs were particularly associated with GY-GMP and located on chromosomes 4A, 7B, 6B, 5B, and 2B, with 22.21, 21.91, and 14.72% PVE, respectively. Our study successfully elucidated the significance and alternative means of identifying genetic loci for drought tolerance via drought indices using the GWAS technique.
Data Availability Statement
The original contributions presented in the study are included in the article/Supplementary Materials, further inquiries can be directed to the corresponding author/s.
Author Contributions
Material preparation, data collection, and analysis were performed by KN, SS, and GW. The first draft of the manuscript was written by KN and revised by AM. All authors commented on previous versions of the manuscript. All authors contributed to the study conception and design. All authors read and approved the final manuscript.
Funding
The manuscript was part of a PhD thesis (KN) financially supported by the Federal Ministry of Food and Agriculture [Bundesministerium für Ernährung und Landwirtschaft (BMEL), Germany (FKZ 2813FS01)].
Conflict of Interest
The authors declare that the research was conducted in the absence of any commercial or financial relationships that could be construed as a potential conflict of interest.
Publisher's Note
All claims expressed in this article are solely those of the authors and do not necessarily represent those of their affiliated organizations, or those of the publisher, the editors and the reviewers. Any product that may be evaluated in this article, or claim that may be made by its manufacturer, is not guaranteed or endorsed by the publisher.
Acknowledgments
The authors wish to thank the Ethiopian Biodiversity Institute (EBI), Debre Zeit Agricultural Research Center (DZARC), and CIMMYT for sharing durum wheat accessions for the study panel. We would like to thank the technical staff of EIAR at respective experimental sites for providing experimental plots and assistance. We would also like to thank Julius Kühn Institute technical, greenhouse, and laboratory staff for their guidance and support.
Supplementary Material
The Supplementary Material for this article can be found online at: https://www.frontiersin.org/articles/10.3389/fpls.2022.838088/full#supplementary-material
Supplementary Table S1. Least square means (lsmeans) comparison of drought tolerance indices based on grain yield of durum wheat study panel under FDS and FNS conditions combined from three seasons (2016–2018). Pedigree, GY_FNS: lsmeans of grain yield from FNS treatments at Holeta and Debre Zeit, GY_FDS, lsmeans of grain yield from FDS treatments at Dera and Melkassa, DSI, drought susceptibility index, RDI, relative drought index, STI, stress tolerance index, GMP, geometric mean productivity, TOL, tolerance index, and YSI, yield stability index. Drought indices values and their respective ranks were indicated. Yellow formatting indicates the top five selected accessions based on combined ranks of DSI, RDI, TOL, and YSI (A), as well as based on combined ranks of STI and GMP (B).
Supplementary Table S2. Marker-trait associations (MTAs) were detected at–log10p ≥ 4.0 for drought indices calculated from grain yield and traits that were significantly (p < 0.001) positively correlated with grain yield under FDS and FNS.
Supplementary Table S3. Significant (–log10p ≥ 4.0) MTAs grouped into QTLs for drought indices calculated from grain yield (GY) and traits that were significantly (p < 0.001) andpositively correlated with grain yield under FDS and FNS. The chromosome interval of the hotspots is indicated by a red rectangle.
Supplementary Figure S1. Scatter plot matrix showing the relationships among drought indices and grain yield (GY) from which drought indices were calculated. GY_FNS, grain yield lsmeans from FNS at Holeta and Debre Zeit; GY_FDS, grain yield lsmeans from FDS at Dera and Melkassa; DSI, drought susceptibility index; RDI, relative drought index; STI, stress tolerance index; GMP, geometric mean productivity; TOL, tolerance index; YSI, yield stability index.
Supplementary Figure S2. Manhattan plots of single-nucleotide polymorphism (SNP) marker-trait associations for drought susceptible index (DSI), geometric mean productivity (GMP), relative drought index (RDI), stress tolerance index (STI), tolerance index (TOL), and yield stability index (YSI) derived from grain yield (GY). The x-axis indicates 14 chromosomes from (left to right) and y-axis represents –log10p value. Marker-trait associations (MTAs) are significant at –log10p ≥ 6 (solid green line).
Supplementary Figure S3. Manhattan plots of single-nucleotide polymorphism (SNP) marker-trait associations for drought susceptible index (DSI), geometric mean productivity (GMP), relative drought index (RDI), stress tolerance index (STI), tolerance index (TOL), and yield stability index (YSI) derived from days to grain filling (DGF). The x-axis indicates 14 chromosomes from (left to right) and y-axis represents –log10p value. Marker-trait associations (MTAs) are significant at –log10p ≥ 6 (solid green line).
Supplementary Figure S4. Manhattan plots of single-nucleotide polymorphism (SNP) marker-trait associations for drought susceptible index (DSI), geometric mean productivity (GMP), relative drought index (RDI), stress tolerance index (STI), tolerance index (TOL), and yield stability index (YSI) calculated from SPAD. The x-axis indicates 14 chromosomes from left to right and y-axis represents –log10p value. Marker-trait associations (MTAs) are significant at –log10p ≥ 6 (solid green line).
Supplementary Figure S5. Manhattan plots of single-nucleotide polymorphism (SNP) marker-trait associations for drought susceptible index (DSI), geometric mean productivity (GMP), relative drought index (RDI), stress tolerance index (STI), tolerance index (TOL), and yield stability index (YSI) derived from seed per spike (SPS). The x-axis indicates 14 chromosomes from left to right and y-axis represents –log10p value. Marker-trait associations (MTAs) are significant at –log10p ≥ 6 (solid green line).
Supplementary Figure S6. Manhattan plots of single-nucleotide polymorphism (SNP) marker-trait associations for drought susceptible index (DSI), geometric mean productivity (GMP), relative drought index (RDI), stress tolerance index (STI), tolerance index (TOL), and yield stability index (YSI) derived from harvesting index (HI). The x-axis indicates 14 chromosomes from left to right and y-axis represents –log10p value. Marker-trait associations (MTAs) are significant at –log10p ≥ 6 (solid green line).
Supplementary Figure S7. Manhattan plots of single-nucleotide polymorphism (SNP) marker-trait associations for drought susceptible index (DSI), geometric mean productivity (GMP), relative drought index (RDI), stress tolerance index (STI), tolerance index (TOL), and yield stability index (YSI) calculated from thousand kernel weight (TKW). The x-axis indicates 14 chromosomes from left to right and y-axis represents –log10p value. Marker-trait associations (MTAs) are significant at –log10p ≥ 6 (solid green line).
Abbreviations
DGF, Days to grain filling; DSI, Drought susceptibility index; EBI, Ethiopian Biodiversity Institute; EIAR, Ethiopian Institute of Agricultural Research; FDR, False discovery rate; FDS, Filed drought stress; FNS, Field non-stress; GMP, Geometric mean production; GWAS, Genome-wide association study; GY, Grain yield; HI, Harvest index; LD, Linkage disequilibrium; LOD, Logarithm of odds; Lsmeans, Least square means; MTA, Marker-trait analysis; P, Probability value; PCA, Principal component analysis; PVE, Phenotypic variance explained; QTLs, Quantitative trait loci; r, Pearson's correlation coefficient; RDI, Relative drought index; SNP, Single-nucleotide polymorphism; SPAD, Soil plant analysis development; SPS, Seeds per spike; STI, Stress tolerance index; TKW, Thousand kernel weight; TOL, Tolerance index; YSI, Yield stability index.
References
Abdolshahi, R., Safarian, A., Nazari, M., Pourseyedi, S., and Mohamadi-Nejad, G. (2012). Screening drought-tolerant genotypes in bread wheat (Triticum aestivum L.) using different multivariate methods. Arch. Agron. Soil Sci. 59, 685–704. doi: 10.1080/03650340.2012.667080
Alemu, A., Feyissa, T., Letta, T., and Abeyo, B. (2020). Genetic diversity and population structure analysis based on the high-density SNP markers in Ethiopian durum wheat (Triticum turgidum ssp. durum). BioMed Cent. Genet. 21, 1–12. doi: 10.1186/s12863-020-0825-x
Ali, M. B., and El-Sadek, A. N. (2016). Evaluation of drought tolerance indices for wheat (Triticum aestivum L.) under irrigated and rainfed conditions. Commun. Biometry Crop Sci. 11, 77–89.
Arif, M. A. R., Attaria, F., Shokat, S., Akram, S., Waheed, M. Q., Arif, A., et al. (2020). Mapping of QTLs associated with yield and yield related traits in durum wheat (Triticum durum Desf.) under irrigated and drought conditions. Int. J. Mol. Sci. 21, 2372. doi: 10.3390/ijms21072372
Ayed, S., Othmani, A., Bouhaouel, I., and da Silva, J. A. T. (2021). Multi-environment screening of durum wheat genotypes for drought tolerance in changing climatic events. Agronomy. 11, 875. doi: 10.3390/agronomy11050875
Bai, X., Zhao, H., Huang, Y., Xie, W., Han, Z., Zhang, B., et al. (2016). Genome-wide association analysis reveals different genetic control in panicle architecture between indica and japonica rice. Plant Genome 9, 1–10. doi: 10.3835/plantgenome2015.11.0115
Ballesta, P., Mora, F., and Pozo, A. (2020). Association mapping of drought tolerance indices in wheat: QTL-rich regions on chromosome 4A genetics and plant breeding. Scientia Agricola. 77, 1–8. doi: 10.1590/1678-992X-2018-0153
Benjamini, Y., and Hochberg, Y. (1995). Controlling the false discovery rate: a practical and powerful approach to multiple testing. J. R. Stat. Soc. Ser. B 57, 289–300.
Bhatta, M., Morgounov, A., Belamkar, V., and Baenziger, P. S. (2018). Genome-wide association study reveals novel genomic regions for grain yield and yield-related traits in drought-stressed synthetic hexaploid wheat. Int. J. Mol. Sci. 19, 3011. doi: 10.3390/ijms19103011
Bouslama, M., and Schapaugh, W. T. (1984). Stress tolerance in soybean. Part 1: evaluation of three screening techniques for heat and drought tolerance. Crop Sci. J. 24, 933–937. doi: 10.2135/cropsci1984.0011183X002400050026x
Brown, M. E., Funk, C., Pedreros, D., Korecha, D., Lemma, M., Rowland, J., et al. (2017). A climate trend analysis of Ethiopia: examining sub-seasonal climate impacts on crops and pasture conditions. Clim. Change 142, 169–182. doi: 10.1007/s10584-017-1948-6
Browning, B. L., and Browning, S. R. (2007). Efficient multilocus association mapping for whole genome association studies using localized haplotype clustering. Genet. Epidemiol. 31, 365–375. doi: 10.1002/gepi.20216
Central Statistical Agency (CSA). (2018). The Federal Democratic Republic of Ethiopia Central Statistical Agency Agricultural Sample Survey. Report on Area and Production of Crops. Statistical Bulletin No. 586. Addis Abeba, Ethiopia.
Cheng, X., Liu, X., Mao, W., Zhang, X., Chen, S., Zhan, K., et al. (2018). Genome-wide identification and analysis of HAK/KUP/KT potassium transporters gene family in wheat (Triticum aestivum L.). Int. J. Mol. Sci. 19, 3969. doi: 10.3390/ijms19123969
Chini, A., Grant, J. J., Seki, M., Shinozaki, K., and Loake, G. J (2004). Drought tolerance established by enhanced expression of the CC-NBS-LRR gene, ADR1, requires salicylic acid, EDS1 and ABI1. Plant J. 38, 810–822. doi: 10.1111/j.1365-313X.2004.02086.x
Cho, S. K., Chung, H. S., Ryu, M. Y., Park, M. J., Lee, M. M., Bahk, Y. Y., et al. (2006). Heterologous expression and molecular and cellular characterization of CaPUB1 encoding a hot pepper U-Box E3 ubiquitin ligase homolog. Plant Physiol. 142, 1664–1682. doi: 10.1104/pp.106.087965
Chong, X., Su, J., Wang, F., Wang, H., Song, A., Guan, Z., et al. (2019). Identification of favorable SNP alleles and candidate genes responsible for inflorescence-related traits via GWAS in chrysanthemum. Plant Mol. Biol. 99, 407–420. doi: 10.1007/s11103-019-00826-w
Dashti, H. S., Ghannadha, M., Naghavi, M. R., and Quarri, S. (2007). QTL analysis for drought resistance in wheat using doubled haploid lines. Int. J. Agric. Biol. 9, 98–102.
de Souza, J., Preseault, C. L., and Lock, A. L. (2018). Altering the ratio of dietary palmitic, stearic, and oleic acids in diets with or without whole cottonseed affect nutrient digestibility, energy partitioning, and production responses of dairy cows. J. Dairy Sci. 101, 172–185. doi: 10.3168/jds.2017-13460
Desiderio, F., Zarei, L., Licciardello, S., Cheghamirza, K., Farshadfar, E., Virzi, N., et al. (2019). Genomic regions from an Iranian landrace increase kernel size in durum wheat. Front. Plant Sci. 10, 448. doi: 10.3389/fpls.2019.00448
Dubey, N., and Singh, K. (2018). “Role of NBS-LRR proteins in plant defense,” in Molecular Aspects of Plant-Pathogen Interaction (Singapore: Springer), 115–138. doi: 10.1007/978-981-10-7371-7_5
Earl, D. A., and vonHoldt, B. M. (2012). Structure harvester: a website and program for visualizing STRUCTURE output and implementing the Evanno method. Conserv. Genet. Resour. 4, 359–361. doi: 10.1007/s12686-011-9548-7
Edae, E. A., Byrne, P. F., Haley, S. D., Lopes, M. S., and Reynolds, M. P. (2014). Genome-wide association mapping of yield and yield components of spring wheat under contrasting moisture regimes. Theor. Appl. Genet. 127, 791–807. doi: 10.1007/s00122-013-2257-8
Ehlting, J., Sauveplane, V., Olry, A. J., Ginglinger, F., and Pr-ovart, N. J. D. (2008). Werck-Reichhart, an extensive (co-) expression analysis tool for the cytochrome P450 superfamily in Arabidopsis thaliana. BMC Plant Biol. 8, 47. doi: 10.1186/1471-2229-8-47
Evanno, G., Regnaut, S., and Goudet, J. (2005). Detecting the number of clusters of individuals using the software structure: a simulation study. Mol. Ecol. 14, 2611–2620. doi: 10.1111/j.1365-294X
FAO (2016). Food and Agriculture Organization of the United Nations, Rome, Italy. Available online at: http://faostat.fao.org/default.aspx (accessed August 20, 2021).
Farshadfar, E., Moradi, Z., Elyasi, P., Jamshidi, B., and Chaghakabodi, R. (2012). Effective selection criteria for screening drought-tolerant landraces of bread wheat (Triticum aestivum L.). Ann. Biol. Res. 3, 2507–2516.
Fernandez, G. C. J. (1992). “Effective selection criteria for assessing stress tolerance,” in Proceedings of the International Symposium on Adaptation of Vegetables and Other Food Crops in Temperature and Water Stress, ed C. G. Kuo (Tainan, Taiwan).
Fischer, R. A., and Maurer, R. (1978). Drought resistance in spring wheat cultivars. I. Grain yield responses. Aust. J. Agric. Res. 29, 897–912. doi: 10.1071/AR9780897
Fischer, R. A., Rees, D., Sayre, K. D., Lu, Z. M., Condon, A. G., and Saavedra, A. L. (1998). Wheat yield progress associated with higher stomatal conductance and photosynthetic rate, and cooler canopies. Crop Sci. 38, 1467–1475.
Grzesiak, S., Hordyńska, N., Szczyrek, P., Grzesiak, M. T., Noga, A., and Szechyńska-Hebda, M. (2019). Variation among wheat (Triticum easativum L.) genotypes in response to the drought stress: I-selection approaches. J. Plant Interact. 14, 30–44. doi: 10.1080/17429145.2018.1550817
Guttieri, M., Stark, J., O'Brien, K., and Souza, E. (2001). Relative sensitivity of spring wheat grain yield and quality parameters to moisture deficit. Crop Sci. 41, 327–335. doi: 10.2135/cropsci2001.412327x
Husson, F., Le, S., and Pages, J. (2010). Exploratory Multivariate Analysis by Example Using R. London: Chapman and Hall. doi: 10.1201/b21874
International Wheat Genome Sequencing Consortium (2018). Shifting the limits in wheat research and breeding using a fully annotated reference genome. Science 361, eaar7191. doi: 10.1126/science.aar7191
John, R., Ganeshan, U., Singh, B. N., Kaul, T., Reddy, M. K., Sopory, S. K., et al. (2016). Over-expression of topoisomerase II enhances salt stress tolerance in tobacco. Front. Plant Sci. 7, 1280. doi: 10.3389/fpls.2016.01280
Jun, X. U., Xin-yu, W., and Wang-zhen, G. (2015). The cytochrome P450 superfamily: key players in plant development and defense. J. Integ. Agric. 14, 1673–1686. doi: 10.1016/S2095-3119(14)60980-1
Kale, S. M., Jaganathan, D., Ruperao, P., Chen, C., Punna, R., Kudapa, H., et al. (2015). Prioritization of candidate genes in “QTL-hotspot” region for drought tolerance in chickpea (Cicer arietinum L.). Sci. Rep. 5, 15296. doi: 10.1038/srep15296
Kang, J., Li, J., Gao, S., Tian, C., and Zha, X. (2017). Overexpression of the leucine-rich receptor-like kinase gene LRK2 increases drought tolerance and tiller number in rice. Plant Biotechnol. J. 15, 1175–1185. doi: 10.1111/pbi.12707
Kidane, Y. G., Mancini, C., Mengistu, D. K., Frascaroli, E., Fadda, C., Pe, M. E., et al. (2017). Genome wide association study to identify the genetic base of smallholder farmer preferences of Durum wheat traits. Front. Plant Sci. 8, 1230. doi: 10.3389/fpls.2017.01230
Lenth, R. V. (2016). Least-Squares means: the R package lsmeans. J. Stat. Softw. 69, 1–33. doi: 10.18637/jss.v069.i01
Lipka, A. E., Tian, F., Wang, Q., Peiffer, J., Li, M., Bradbury, P. J., et al. (2012). GAPIT: genome association and prediction integrated tool. Bioinformatics 28, 2397–2399. doi: 10.1093/bioinformatics/bts444
Liu, X., Huang, M., Fan, B., Buckler, E. S., and Zhang, Z. (2016). Iterative usage of fixed and random effect models for powerful and efficient genome-wide association studies. PLoS Genet. 12, e1005767. doi: 10.1371/journal.pgen.1005767
Lobell, D. B., Schlenker, W., and Costa-Roberts, J. (2011). Climate trends and global crop production since 1980. Science 333, 616–620. doi: 10.1126/science.1204531
Lu, L., Zhang, Y., He, Q., Qi, Z., Zhang, G., Xu, W., et al. (2020). MTA, an RNA m6A methyltransferase, enhances drought tolerance by regulating the development of trichomes and roots in poplar. 21, 2462. doi: 10.3390/ijms21072462
Ma, J., Dong, W., Zhang, D., Gao, X., Jiang, L., Shao, Y., et al. (2016). Proteomic profiling analysis reveals that glutathione system plays important roles responding to osmotic stress in wheat (Triticum aestivum L.) roots. Peer J. 4, e2334. doi: 10.7717/peerj.2334
Maccaferri, M., Cane, M. A., Sanguineti, M. C., Salvi, S., Colalongo, M. C., and Massi, A., et al. (2014) A consensus framework map of durum wheat (Triticum durum Desf.) suitable for linkage disequilibrium analysis genome-wide association mapping. BMC Genomics. 15, 1–21. doi: 10.1186/1471-2164-15-873.
Maccaferri, M., Harris, N. S., Twardziok, S. O., Pasam, R. K., Gundlach, H., Spannagl, M., et al. (2019). Durum wheat genome highlights past domestication signatures and future improvement targets. Nat. Genet. 51, 885–895. doi: 10.1038/s41588-019-0381-3
Maccaferri, M., Ricci, A., Salvi, S., Milner, S. G., Noli, E., Martelli, P. L., et al. (2015). A high-density, SNP-based consensus map of tetraploid wheat as a bridge to integrated durum and bread wheat genomics and breeding. Plant Biotechnol. J. 13, 648–663. doi: 10.1111/pbi.12288
Marondedze, C., Thomas, L., Gehring, C., and Lilley, K. (2019). Changes in the Arabidopsis RNA-binding proteome reveal novel stress response mechanisms. BMC Plant Biol. 19, 139. doi: 10.1186/s12870-019-1750-x
Mau, Y. S., Ndiwa, A. S. S., Oematan, S. S., and Markus, J. E. R. (2019). Drought tolerance indices for selection of drought-tolerant, high yielding upland rice genotypes. Aust. J. Crop Sci. 13, 170–178. doi: 10.21475/ajcs.19.13.01.p1778
Melloul, M., Iraqi, D., Alaoui, M., Erba, G., Alaoui, S., Ibriz, M., et al. (2014). Identification of differentially expressed genes by cDNA-AFLP technique in response to drought stress in Triticum durum. Food Technol. Biotechnol. 52, 479–488. doi: 10.17113/fitb.52.04.14.3701
Mengistu, D. K., Kiros, A. Y., and Pè, M. E. (2015). Phenotypic diversity in Ethiopian durum wheat (Triticum turgidum var. durum) landraces. Crop J. 3, 190–199. doi: 10.1016/j.cj.2015.04.003
Mitra, J. (2001). Genetics and genetic improvement of drought resistance in crop plants. Curr. Sci. 80, 758–762.
Naghavi, M. R., Aboughadareh, A. P., and Khalili, M. (2013). Evaluation of drought tolerance indices for screening some of corn (Zea mays L.) cultivars under environmental conditions. Notulae Scientia Biologicae. 5, 388–393. doi: 10.15835/nsb.5.3.9049
Narusaka, Y., Narusaka, M., Seki, M., Umezawa, T., Ishida, J., Nakajima, M., et al. (2004). Crosstalk in the responses to abiotic and biotic stresses in Arabidopsis: analysis of gene expression in cytochrome P450 gene superfamily by cDNA microarray. Plant Mol. Biol. 55, 327–342. doi: 10.1007/s11103-004-0685-163
Negassa, A., Shiferaw, B., Koo, J., Sonder, K., Smale, M., and Braun, H. J. (2013). The Potential for Wheat Production in Africa:Analysis of Biophysical Suitability and Economic Profitability. Mexico, D.F.: CIMMYT.
Negisho, K., Shibru, S., Matros, A., Pillen, K., Ordon, F., and Wehner, G. (2022). Genomic dissection reveals QTLs for grain biomass and correlated traits under drought stress in Ethiopian durum wheat (Triticum turgidum ssp. durum). Plant Breed. 2022, 1–17. doi: 10.1111/pbr.13010
Negisho, K., Shibru, S., Pillen, K., Ordon, F., and Wehner, G. (2021). Genetic diversity of Ethiopian durum wheat landraces. PLoS ONE 16, 247016. doi: 10.1371/journal.pone.0247016
Negro, S. S., Millet, E. J., Madur, D., Bauland, C., Combes, V., Welcker, C., et al. (2019). Genotyping-by-sequencing and SNP-arrays are complementary for detecting quantitative trait loci by tagging different haplotypes in association studies. BMC Plant Biol. 19, 1–22. doi: 10.1186/s12870-019-1926-4
Nezhadahmadi, A., Prodhan, Z. H., and Faruq, G. (2013). Drought tolerance in wheat. Sci. World J. 3, 610721. doi: 10.1155/2013/610721
Ouyang, S., Liu, Y. F., Liu, P., Lei, G., He, G., Biao, M., et al. (2010). Receptor-like kinase OsSIK1 improves drought and salt stress tolerance in rice (Oryza sativa) plants. Plant J. 62, 316–329. doi: 10.1111/j.1365-313X.04146.x
Oyiga, B. C., Sharma, R. C., Baum, M., Ogbonnaya, F. C., Léon, J., and Ballvora, A. (2017). Allelic variations and differential expressions detected at quantitative trait loci for salt stress tolerance in wheat. Plant Cell Environ. 41, 919–935. doi: 10.1111/pce.12898
Patel, J. M., Patel, A. S., Patel, C. R., Mamrutha, H. M., Pradeep, S., and Pachchigar, K. P. (2019). Evaluation of selection indices in screening durum wheat genotypes combining drought tolerance and high yield potential. Int. J. Curr. Microbiol. Appl. Sci. 8, 1165–1178. doi: 10.20546/ijcmas.804.134
Qaseem, M. F., Qureshi, R., Shaheen, H., and Shafqat, N. (2019). Genome-wide association analyses for yield and yield-related traits in bread wheat (Triticum aestivum L.) under pre-anthesis combined heat and drought stress in field conditions. PLoS ONE 14, e213407. doi: 10.1371/journal.pone.0213407
R Development Core Team (2014). R: A Language and Environment for Statistical Computing. Vienna, Austria: R Foundation for Statistical Computing.
Ramirez-Vallejo, P., and Kelly, J. D. (1998). Traits related to drought resistance in common bean. Euphytica 99, 127–136. doi: 10.1023/A:1018353200015
Rampino, P., De Pascali, M., De Caroli, M., Luvisi, A., De Bellis, L., Piro, G., et al. (2017). Td4IN2: a drought-responsive durum wheat (Triticum durum Desf.) gene coding for a resistance like protein with serine/threonine protein kinase, nucleotide binding site and leucine rich domains. Plant Physiol. Biochem. 120, 223–231. doi: 10.1016/j.plaphy.2017.10.010
Rosielle, A. A., and Hamblin, J. (1981). Theoretical aspects of selection for yield in stress and non-stress environment. Crop Sci. 21, 943–946. doi: 10.2135/cropsci1981.0011183X002100060033x
Ryu, M. Y., Cho, S. K., Hong, Y., et al. (2019). Classification of barley U-box E3 ligases and their expression patterns in response to drought and pathogen stresses. BMC Genomics 20, 326. doi: 10.1186/s12864-019-5696-z
Sall, A. T., Chiari, T., Legesse, W., Ahmed, S., Ortiz, R., van Ginkel, M., et al. (2019). Durum wheat (Triticum durum Desf.) origin, cultivation, and potential expansion in sub-Saharan Africa. Agronomy 9, 263. doi: 10.20944/preprints04.0149.v1
Sallam, A., Alqudah, A., M., Dawood, M. F. A., Baenziger, P. S., and Börner, A. (2019). Drought stress tolerance in wheat and barley: advances in physiology, breeding and genetics research. Int. J. Mol. Sci. 20, 3137. doi: 10.3390/ijms20133137
Shao, Z. Q., Zhang, Y. M., Hang, Y. Y., Xue, J. Y., Zhou, G. C., Wu, P., et al. (2014). Long-term evolution of nucleotide-binding site-leucine-rich repeat genes: understanding gained from and beyond the legume family. Plant Physiol. 166, 217–234. doi: 10.1104/pp.114.243626
Shin, J. H., Blay, S., McNeney, B., and Graham, J. (2006). LDheatmap: an R functions for graphical display of pairwise linkage disequilibria between single nucleotide polymorphisms. J. Stat. Softw. 16, 1–10. doi: 10.18637/jss.v000.i00
Simane, B., van Keulen, H., Stol, W., and Stuik, P. C. (1994). Application of a crop growth model (SUCROS-87) to assess the effect of moisture stress on yield potential of durum wheat in Ethiopia. Agric. Syst. 44, 337–353. doi: 10.1016/0308-521X(94)90226-6
Singh, R., Worku, M., Bogale, C. A., Adem, A., Irwin, B., Lim, S., et al. (2016). Reality of resilience: perspectives of the 2015-16 drought in Ethiopia. BRACED Resilience Intel: Issue 6. Ethiopia Overview, World Food Program, Rome, Italy. Available online at: https://www.worldweatherattribution.org/ethiopia-drought-2015/WFP (accessed July 18, 2021).
Song, Q., Liu, C., Goudia, D., Chen, L., and Hu, Y. (2017). Drought resistance of new synthetic hexaploid wheat accessions evaluated by multiple traits and antioxidant enzyme activity. Field Crop Res. 210, 91–103. doi: 10.1016/j.fcr.2017.05.028
Soriano, J. M., Malosetti, M., Roselló, M., Sorrells, M. E., and Royo, C. (2017). Dissecting the old Mediterranean durum wheat genetic architecture for phenology, biomass and yield formation by association mapping and QTL meta-analysis. PLoS ONE 12, 178290. doi: 10.1371/journal.pone.0178290
Sukumaran, S., Reynolds, M. P., and Sansaloni, C. (2018). Genome-wide association analyses identify QTL hotspots for yield and component traits in durum wheat grown under yield potential, drought, and heat tress environments. Front. Plant Sci. 9, 81. doi: 10.3389/fpls.2018.00081
Tammaro, M., Liao, S., Beeharry, N., and Yan, H. (2016). DNA double-strand breaks with 5′ adducts are efficiently channeled to the DNA 2-mediated resection pathway. Nucl. Acids Res. 44, 221–231. doi: 10.1093/nar/gkv969
Teslovich, T. M., Musunuru, K., Smith, A. V., Edmondson, A. C., Stylianou, I. M., Koseki, M., et al. (2010). Biological, clinical, and population relevance of 95 loci for blood lipids. Nature 466, 707–713. doi: 10.1038/nature09270
Tsegaye, M. (2017). Large-scale land acquisitions, state authority, and indigenous local communities: insights from Ethiopia. Third World Q. 38, 698–716. doi: 10.1080/01436597.1191941
Van Oosten, M. J., Costa, A., Punzo, P., Landi, S., Ruggiero, A., Batelli, G., et al. (2016). “Genetics of drought stress tolerance in crop plants,” in Drought Stress Tolerance in Plants, eds M. A. Hossain, S. H. Wani, S. Bhattachajee, D. J. Burrit, and L. S. P. Tran (Cham: Springer), 39–70.
Vavilov, N. I. (1951). The origin, variation, immunity, and breeding of cultivated plants. Chron. Bot. 13, 1–366.
Voss-Fels, K., Frisch, M., Qian, L., Kontowski, S., Friedt, W., Gottwald, S., et al. (2015). Sub genomic diversity patterns caused by directional selection in bread wheat gene pools. Plant Genome 8, 1–13. doi: 10.3835/plantgenome2015.03.0013
Wang, S., Wong, D., Forrest, K., Allen, A., Chao, S., Huang, B. E., et al. (2014). Characterization of polyploid wheat genomic diversity using a high-density 90 000 single nucleotide polymorphism array. Plant Biotechnol. J. 12, 787–796. doi: 10.1111/pbi.12183
Wang, X., Cai, X., Xu, C., Wang, Q., and Dai, S. (2016). Drought-responsive mechanisms in plant leaves revealed by proteomics. Int. J. Mol. Sci. 17, 1706. doi: 10.3390/ijms17101706
Warnes, G. (2013). Genetics:Population Genetics. R Package Version 1.3.8.1. Available online at: https://cran.r-project.org/package=genetics (accessed May 5, 2019).
Wei, T., Simko, V., Levy, M., Xie, Y., Jin, Y., and Zemla, J. (2017). Package ‘corrplot’. Statistician 56, 316–324.
Xiang, J., Zhou, X., Zhang, X., Liu, A., Xiang, Y., Yan, M., et al. (2018). The Arabidopsis AtUNC-93 acts as a positive regulator of abiotic stress tolerance and plant growth via modulation of ABA signaling and KC homeostasis. Front. Plant Sci. 9, 718. doi: 10.3389/fpls.2018.00718
Xu, P., Zang, A., Chen, H., and Cai, W. (2016). The small G protein AtRAN1 regulates vegetative growth and stress tolerance in Arabidopsis thaliana. PLoS ONE 11, e0154787. doi: 10.1371/journal.pone.0154787
Yousefi, B. (2015). Evaluation of genetic variations for drought tolerance in some advanced lines of barley (Hordeum vulgar). Int. J. Farming Allied Sci. 4, 177–184.
Keywords: Ethiopia, durum wheat, drought tolerance indices, GWAS, QTLs, field studies
Citation: Negisho K, Shibru S, Matros A, Pillen K, Ordon F and Wehner G (2022) Association Mapping of Drought Tolerance Indices in Ethiopian Durum Wheat (Triticum turgidum ssp. durum). Front. Plant Sci. 13:838088. doi: 10.3389/fpls.2022.838088
Received: 17 December 2021; Accepted: 25 April 2022;
Published: 26 May 2022.
Edited by:
N. K. Gupta, Sri Karan Narendra Agriculture University, IndiaReviewed by:
Huihui Li, Institute of Crop Sciences, (CAAS), ChinaAhmad Alsaleh, Bozok University, Turkey
Daniela Marone, CRA-CER, Italy
Copyright © 2022 Negisho, Shibru, Matros, Pillen, Ordon and Wehner. This is an open-access article distributed under the terms of the Creative Commons Attribution License (CC BY). The use, distribution or reproduction in other forums is permitted, provided the original author(s) and the copyright owner(s) are credited and that the original publication in this journal is cited, in accordance with accepted academic practice. No use, distribution or reproduction is permitted which does not comply with these terms.
*Correspondence: Gwendolin Wehner, gwendolin.wehner@julius-kuehn.de
†ORCID: Kefyalew Negisho orcid.org/0000-0001-5854-9256
Andrea Matros orcid.org/0000-0002-4399-6149
Klaus Pillen orcid.org/0000-0003-4646-6351
Frank Ordon orcid.org/0000-0002-1695-6395
Gwendolin Wehner orcid.org/0000-0003-3248-8517