Hawaii Coastal Seawater CO2 Network: A Statistical Evaluation of a Decade of Observations on Tropical Coral Reefs
 Gerianne J. Terlouw1
  Lucie A. C. M. Knor1*
  Eric Heinen De Carlo1
  Patrick S. Drupp1 Fred T. Mackenzie1 Yuan Hui Li1
  Adrienne J. Sutton2
  Albert J. Plueddemann3
  Christopher L. Sabine1
- 1Department of Oceanography, SOEST, University of Hawai‘i at Mānoa, Honolulu, HI, United States
- 2Pacific Marine Environmental Laboratory, National Oceanic and Atmospheric Administration, Seattle, WA, United States
- 3Woods Hole Oceanographic Institution, Woods Hole, MA, United States
A statistical evaluation of nearly 10 years of high-resolution surface seawater carbon dioxide partial pressure (pCO2) time-series data collected from coastal moorings around O’ahu, Hawai’i suggest that these coral reef ecosystems were largely a net source of CO2 to the atmosphere between 2008 and 2016. The largest air-sea flux (1.24 ± 0.33 mol m−2 yr−1) and the largest variability in seawater pCO2 (950 μatm overall range or 8x the open ocean range) were observed at the CRIMP-2 site, near a shallow barrier coral reef system in Kaneohe Bay O’ahu. Two south shore sites, Kilo Nalu and Ala Wai, also exhibited about twice the surface water pCO2 variability of the open ocean, but had net fluxes that were much closer to the open ocean than the strongly calcifying system at CRIMP-2. All mooring sites showed the opposite seasonal cycle from the atmosphere, with the highest values in the summer and lower values in the winter. Average coastal diurnal variabilities ranged from a high of 192 μatm/day to a low of 32 μatm/day at the CRIMP-2 and Kilo Nalu sites, respectively, which is one to two orders of magnitude greater than observed at the open ocean site. Here we examine the modes and drivers of variability at the different coastal sites. Although daily to seasonal variations in pCO2 and air-sea CO2 fluxes are strongly affected by localized processes, basin-scale climate oscillations also affect the variability on interannual time scales.
Introduction
Since the start of the industrial revolution, atmospheric CO2 concentrations have increased steadily from ∼280 ppm in preindustrial times, reaching 408 ppm in 2018 at the Mauna Loa Observatory, Hawai’i Island, Hawai’i1 (Keeling et al., 1976, 2001; Tans and Kieling, 2017; Dlugokencky and Tans, 2018). The average annual growth rate of atmospheric CO2 was 2 ppm yr−1 during the last decade (2007–2016), but varies from year to year (Dlugokencky and Tans, 2018). Through the process of air-sea gas exchange, the global ocean has taken up approximately one quarter of the CO2 emissions since the Industrial Revolution (Le Quéré et al., 2018). The trend of rising atmospheric CO2 concentrations has been well documented for several decades at various geographic locations (Keeling et al., 1976, 2001; Thoning et al., 1989; Chamard et al., 2003). Over the last 20 years, the uptake of CO2 by the ocean, the subsequent decrease in seawater pH (Ocean Acidification, OA), and the consequences of enhanced ocean acidity for the marine environment and its organisms has been an important topic of study (Kleypas et al., 1999; Caldeira and Wickett, 2003; Feely et al., 2004; Sabine et al., 2004; Kleypas and Langdon, 2006; Hoegh-Guldberg et al., 2007; Dore et al., 2009; Gattuso and Hansson, 2011; Andersson and Gledhill, 2013; Mackenzie and Andersson, 2013).
Quantifying CO2 fluxes in the coastal ocean and particularly in coral reef ecosystems can be more challenging than in the open ocean owing to a variety of factors, including especially the larger variability observed in the former. To help resolve this problem, high-resolution monitoring of seawater partial pressure of CO2 (pCO2sw) on surface buoys in coastal regions began late in 2005 (see Massaro et al., 2012). Ocean carbonate chemistry research conducted in various coastal settings (Drupp et al., 2011, 2013; Yan et al., 2011, 2016; Massaro et al., 2012; Bates et al., 2014; Shaw et al., 2014; Sutton et al., 2014a, 2016) has shown that, in order to understand the drivers of natural variability and identify long-term trends, it is necessary to gain better insight into the processes that control marine CO2 concentrations, including the direction and magnitude of the air-sea CO2 flux.
The high temporal variability of the CO2-carbonate system parameters in coral reefs is associated with changes in the magnitude of forcing mechanisms, and resultant changes in other water quality parameters (Kayanne et al., 1995; Gagliano et al., 2010; Drupp et al., 2011, 2013; Hofmann et al., 2011; Shamberger et al., 2011; Price et al., 2012; Shaw and McNeill, 2014; Courtney et al., 2017). Although great strides have been made over the past few years in adding time-series stations on coral reefs, and undertaking process-based studies at these locations (e.g., Yeakel et al., 2015; Drupp et al., 2016; Courtney et al., 2017; Page et al., 2017, 2018; Eyre et al., 2018), it is only at a relatively small number of sites that the biogeochemical conditions in waters of coral reefs have been successfully observed for extended periods of time. Hence, thorough characterization and unequivocal attribution of observed changes to ocean acidification (OA) remain elusive for most coral reef settings.
The biogeochemistry of Hawai’i’s coastal waters is strongly influenced by land-derived nutrient inputs (Ringuet and Mackenzie, 2005; De Carlo et al., 2007; Fagan and Mackenzie, 2007; Hoover and Mackenzie, 2009), which drive primary productivity and impact the CO2-carbonic acid system parameters (e.g., Fagan and Mackenzie, 2007; Drupp et al., 2011, 2013; Shamberger et al., 2011; Massaro et al., 2012). High-nutrient freshwater entering coastal waters causes increased phytoplankton growth, often leading to the drawdown of pCO2sw (Fagan and Mackenzie, 2007; Drupp et al., 2011; Massaro et al., 2012). The duration of such phytoplankton blooms depends strongly on physical processes including water residence time and mixing (e.g., De Carlo et al., 2007; Tomlinson et al., 2011), as well as biotic effects such as predation (e.g., Hoover et al., 2006).
In an effort to characterize the dynamics of the CO2–carbonic acid system in waters bathing coral reefs on short and long time scales, NOAA/PMEL and University of Hawai’i scientists established the first coastal seawater pCO2 monitoring station at Kaneohe Bay in 2005. The Coral Reef Instrumented and CO2 Monitoring Platform (CRIMP-CO2) was first deployed in southern Kaneohe Bay, but was moved in 2008 to the inner edge of the barrier reef. Two additional buoys were also deployed in 2008 on the south shore of O’ahu, Hawai’i (see Figure 1). A fourth buoy was added in 2011 on the off-shore side of the Kaneohe Bay barrier reef to help characterize the source waters entering the bay. The buoys collect high temporal resolution (3-hourly) CO2 time-series data that have been used to assess inorganic carbon variability (Massaro et al., 2012; Drupp et al., 2013). These now nearly decade-long time series provide a unique opportunity to quantify the influence of local climatic, geographic, and biogeochemical processes on CO2 dynamics. An open ocean mooring, WHOI Hawaii Ocean Time Series (WHOTS), operated by the Woods Hole Oceanographic Institution (WHOI), 100 km North of O’ahu, in the North Pacific Subtropical Gyre, also collects high-resolution surface seawater pCO2 (pCO2sw) observations and provides an open ocean reference to compare to data from the coastal O’ahu sites (Dore et al., 2003; Sutton et al., 2017). The WHOTS mooring is located at the station ALOHA (A Long-term Oligotrophic Habitat Assessment) oceanographic observatory (Karl and Church, 2018).
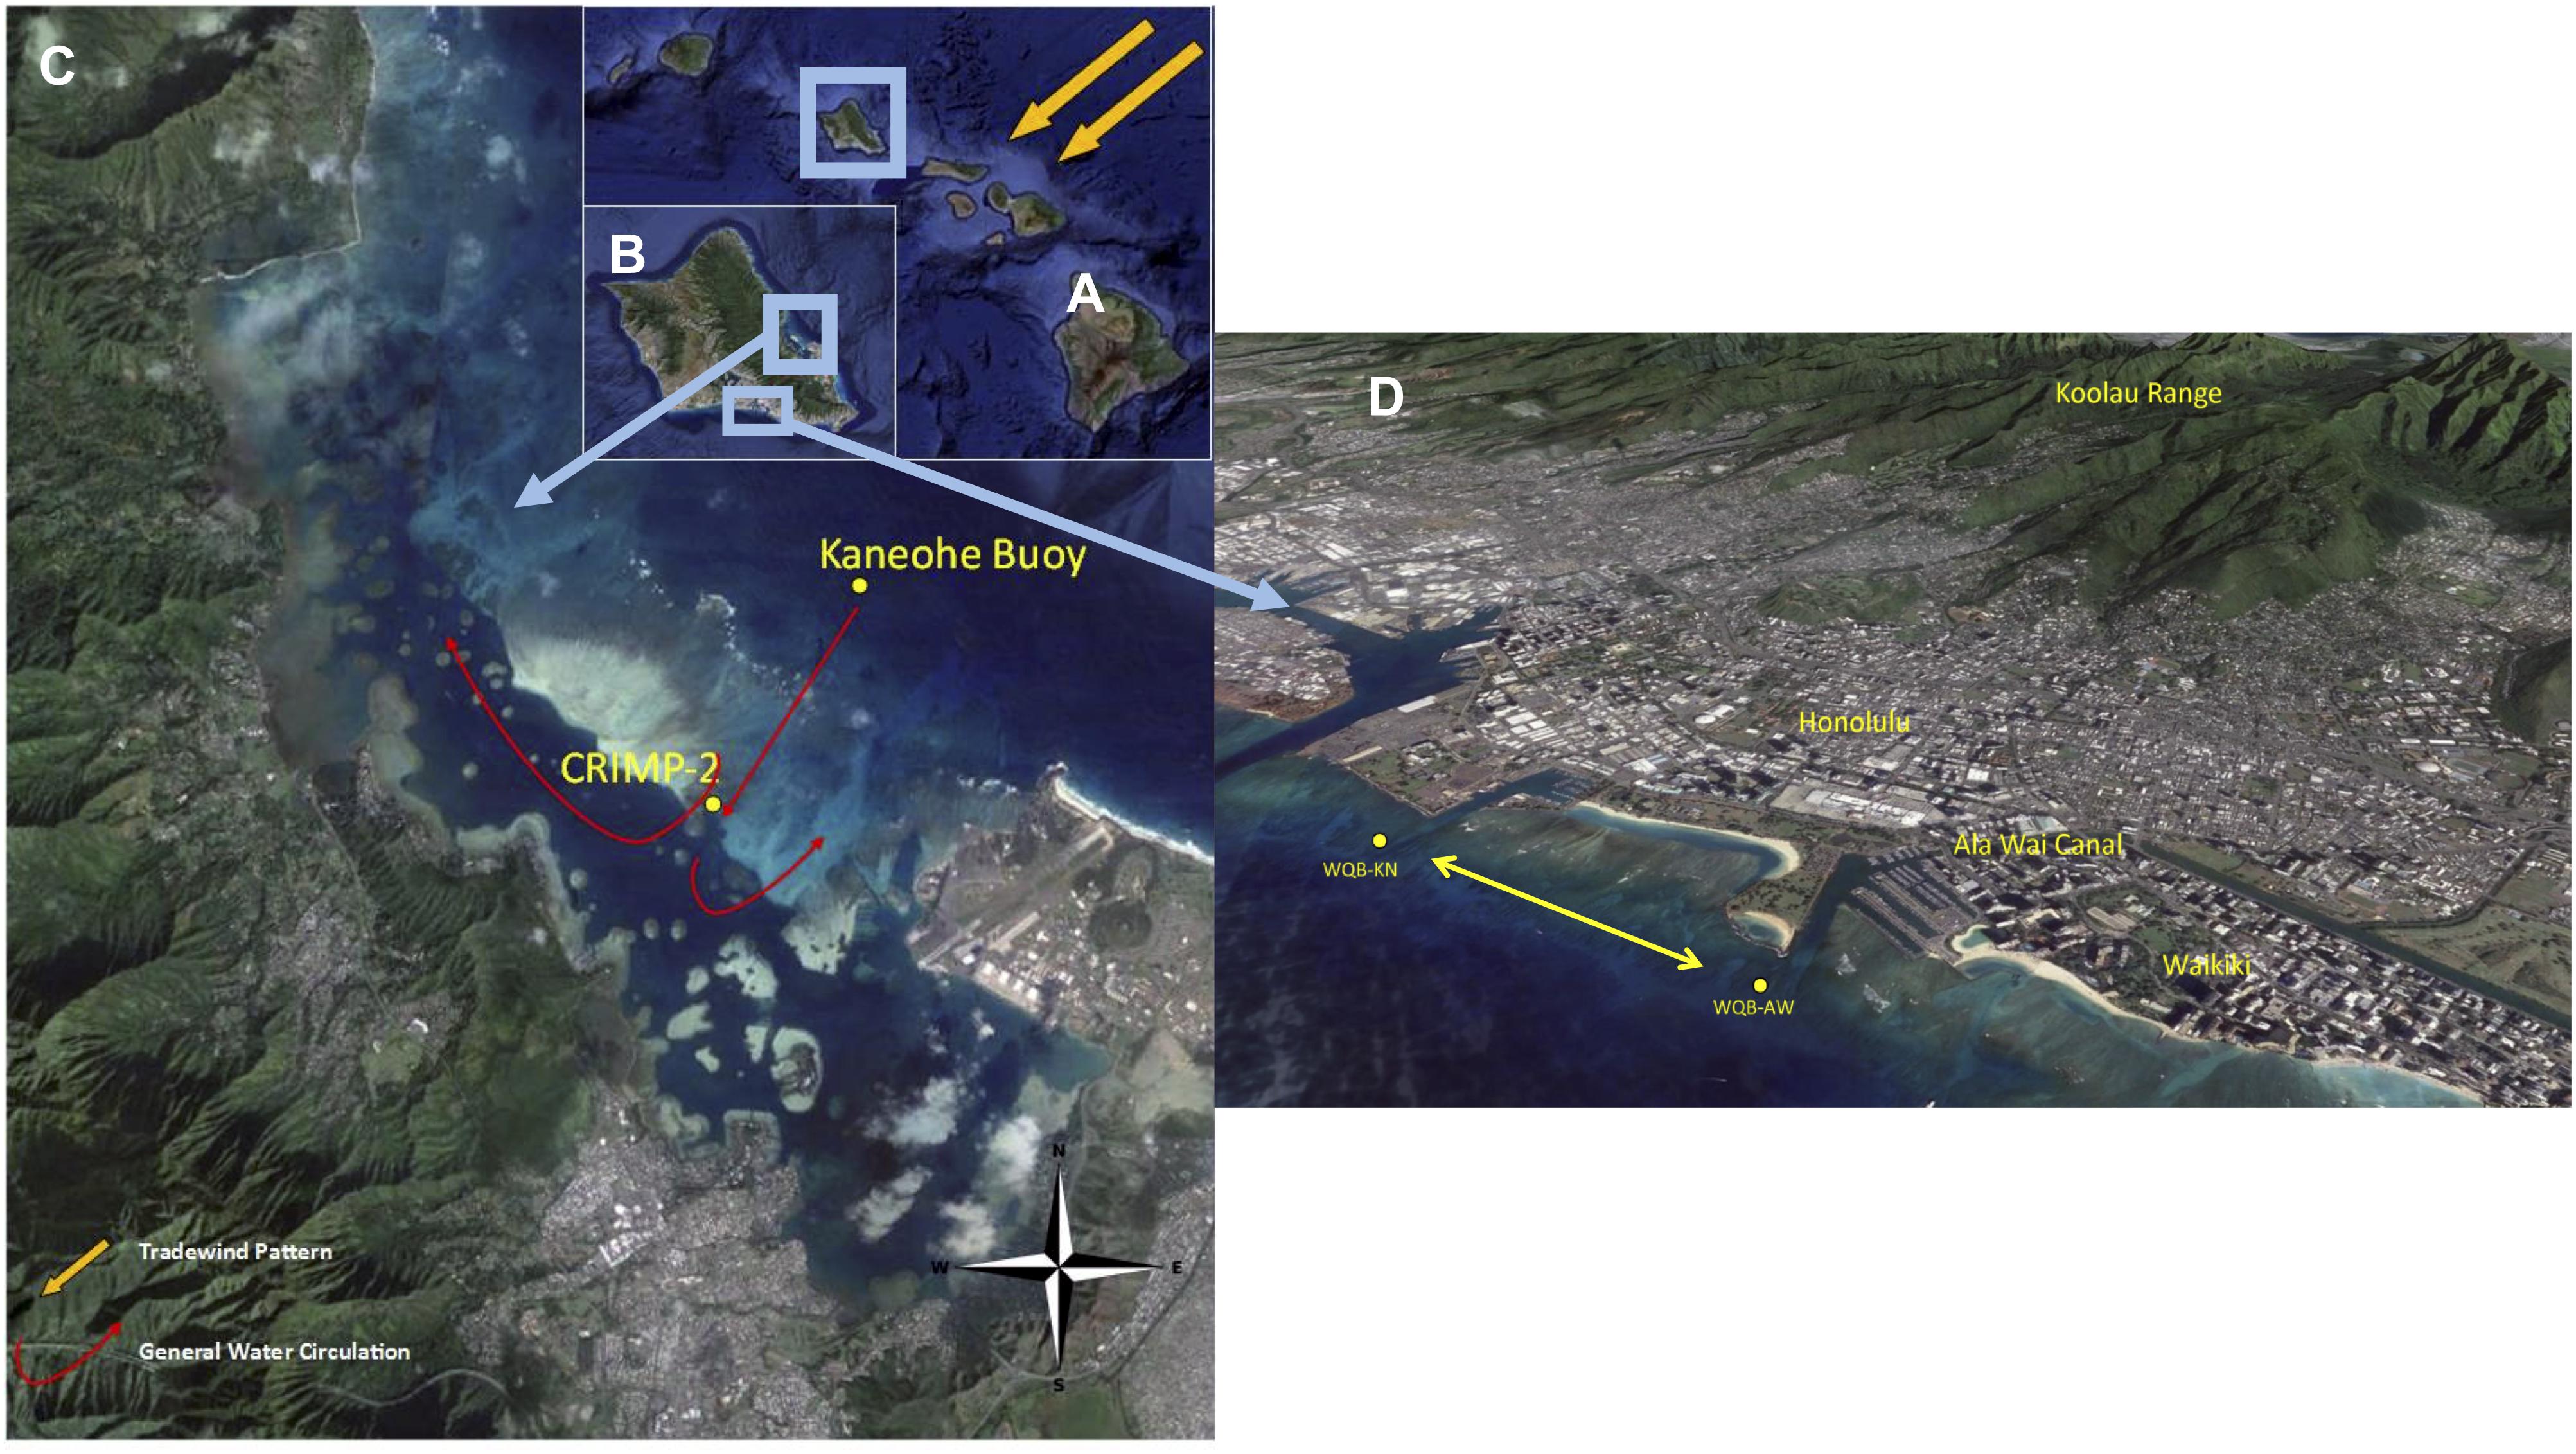
Figure 1. Locations of the four O’ahu coral reef MAPCO2 moorings. (A) The Hawaiian Islands, highlighting O’ahu. (B) The island of O’ahu, highlighting Kaneohe Bay on the windward (east) coast and the Honolulu watersheds on the southern coast. (C) Kaneohe Bay, with the CRIMP-2 buoy located on the back reef and the Kaneohe buoy on the deeper forereef. The red dot represents the previous CRIMP location. (D) Two south shore buoys, Ala Wai (WQB-AW) and Kilo Nalu (WQB-KN) are located 200 m offshore of urban Honolulu above fringing reefs. WQB-AW is located near the mouth of the Ala Wai Canal, which drains the Honolulu city watersheds. Adapted from Drupp et al. (2013).
This paper builds on earlier work (Drupp et al., 2013) and utilizes nearly 10 years of seawater pCO2 data to investigate long-term changes and differences in variability across sites around O’ahu, Hawai’i. Due to the low signal-to-noise ratio in these highly variable coastal locations, the datasets are too short to discern statistically significant long-term trends in pCO2sw, which underscores the importance of continuing high-quality observations. Regardless, data from these stations represent the longest running coordinated autonomous pCO2 time series characterizing differing coral environments around a single island. The high-resolution data permit a detailed description and analysis of the variability of pCO2sw in O’ahu’s coastal waters. The results of this study enhance our understanding of the behavior of the tropical coastal ocean with respect to the CO2-carbonic acid system and provide a basis to begin to refine regional coastal CO2 budgets. Our observations and interpretation also contribute to the goals of the Global Ocean Acidification Observing Network (GOA-ON) to determine spatio-temporal patterns in carbon chemistry, and provide information for state and federal agency managers and decision makers with respect to coastal management.
Materials and Methods
Environmental Setting
The CRIMP-2 buoy is a Moored Autonomous pCO2 (MAPCO2) buoy that was deployed in June 2008 over a sandy bottom in three meters of water depth on the landward edge of the barrier reef of Kaneohe Bay (Figure 1). Kaneohe bay is the largest semi-enclosed water body on O’ahu and is located on the windward side of the island, where northeasterly trade winds blow most of the year (Giambelluca et al., 1986, 2011). The entire bay is relatively shallow, with a mean depth of 9.5 m. The depth of the barrier reef is quite variable with a significant area characterized by approximately 2 m water depth, and the mean tidal amplitude in the bay is 68 cm (Ringuet and Mackenzie, 2005). Water at the CRIMP-2 location has a variable residence time (hours to days: Lowe et al., 2009a,b; Ho et al., 2019), which is long compared to the two buoy locations on the South Shore of O’ahu. Generally, open ocean water crosses the barrier reef before reaching CRIMP-2, then enters the deeper lagoon and returns to the ocean through the shallow Sampan Channel (Lowe et al., 2009a,b). A fraction of the water, however, does not complete its trajectory across the reef and advects toward the Sampan channel, complicating exact residence time estimates (Courtney et al., 2017). Subsequently some of the water exiting the bay during outgoing tides is recirculated over the barrier reef, the amount depending on wind strength and direction and wave conditions.
Two other MAPCO2 buoys, Ala Wai and Kilo Nalu, are located on sand patches within the spur and groove structure of fringing reefs offshore of Honolulu, in Mamala Bay on the South Shore of O’ahu (Figure 1). Compared to the CRIMP-2 location, this coastline is unprotected. It is directly affected by tides and winds, and is exposed to open ocean swells from the south, particularly during the Austral winter. The Ala Wai buoy (WQB-AW in Figure 1) is ∼300 m offshore of the mouth of the Ala Wai Canal, where freshwater discharge from a large part of urban Honolulu often delivers high nutrient and sediment loads to the buoy site (e.g., De Carlo et al., 2004; Tomlinson et al., 2011). The Kilo Nalu buoy (WQB-KN in Figure 1), located ∼400 m offshore, is not directly affected by stream discharge, although the local coastal waters receive urban overland runoff, input from nearby storm drains, and groundwater discharge. Depending on currents and wind conditions, some water from the Ala Wai canal occasionally advects toward the Kilo Nalu site. Water on the south shore fringing reefs is thought to have a short residence time because of significant tidal and wind-driven currents. Near bed current velocities at Kilo Nalu of nearly one knot have been reported (Fogaren et al., 2013). Stronger values are typically observed near the surface, particularly during rising tides, when the flow is in the same direction as the predominant wind driven flow. Data coverage for the 8-year record for all Hawaii sites ranged from 40% (Ala Wai) to 77% (CRIMP-2) for pCO2sw. Data gaps were due to time spent off station for annual servicing and sensor/platform malfunctions.
The WHOTS buoy is the surface element of an open ocean mooring, located within the Station ALOHA circle, centered at 22° 45′ N, 158° W approximately 100 km due north of O’ahu in the oligotrophic North Pacific Ocean2. A MAPCO2 system on the WHOTS buoy has provided a continuous time series since 2004, complementing the Hawai’i Ocean Time Series (HOT) ship-based program that has been operating at Station ALOHA for more than 25 years. OA and the fluxes of CO2 have been well characterized at the HOT site (Dore et al., 2003, 2009; Sutton et al., 2017).
To put the findings of this study in a more global context, the CRIMP-2 seawater pCO2 time-series data from three other coral reef MAPCO2 sites3 are directly compared. Two are located in the Atlantic Ocean (“La Parguera” in Puerto Rico, and “Crescent reef” in Bermuda) and one is in the Pacific (“Chuuk K1” in Micronesia). These three sites were chosen mainly because of their relatively long and continuous CO2 record and their different geographic locations. La Parguera and Crescent reef are both located in the North Atlantic Ocean. Crescent reef in Bermuda is a high latitude reef (32.40°N, 64.79°W), where the large seasonal sea surface temperature (SST) cycle drives the observed large seasonal pCO2 cycle. The La Parguera site in Puerto Rico (17.95°N, 67.05°W) is located within a natural reserve on a shallow (1.5–5 m) fore-reef. Chuuk K1 in the equatorial Pacific is a low latitude (7.46°N, 151.90°E) reef located in Micronesia within a semi- enclosed atoll in ∼23 m water depth. Time frames evaluated were 2009–2016 for La Parguera, 2011–2016 for Chuuk-K1, and 2010–2016 for Crescent reef.
Measurements
At the above described locations, a MAPCO2 system is deployed on each of the surface buoys. The MAPCO2 measures the mole fraction of CO2 (xCO2) in the marine boundary layer and in air in equilibrium with surface seawater every 3 h using a non-dispersive infrared (NDIR) sensor, which is calibrated with standard reference gasses in situ before each measurement. The pCO2 of air and seawater is calculated from the xCO2 following the method of Weiss and Price (1980) with a resulting uncertainty of < 2 μatm [see Sutton et al. (2014b) for a more detailed description of the MAPCO2 methodology]. Other water property data including sea surface temperature (SST), salinity (SSS), dissolved oxygen (DO), turbidity and fluorescence are collected by SeaBird 16V2 instruments at the same (or higher) frequency as the CO2 observations. Finalized quality-controlled data from the buoys are publicly available and can be found online4.
Ancillary Data
Wind data needed for CO2 flux calculations at coastal locations were obtained from the NOAA-National Ocean Service Station OOUH1 in Honolulu, at the Hawai’i Institute for Marine Biology weather station on Moku o Lo‘e (Coconut Island) in South Kaneohe Bay, and at the Kaneohe MCAS ID911760 (Kaneohe Marine Corps Base). Wind data for the WHOTS buoy are collected on site by an Air-Sea Interaction Meteorology (ASIMET) system (Weller, 2018).
Climate oscillation index data for the Pacific Decadal Oscillation (PDO) and the Oceanic Niño Index (ONI) were obtained from NOAA5,6 and for the North Pacific Gyre Oscillation from E. Di Lorenzo (Di Lorenzo et al., 2008; Chhak and Di Lorenzo, 2009)7.
Calculations
Air-sea CO2 fluxes are calculated from the gas transfer (piston) velocity using the parameterization of Ho et al. (2006) and the sea-air pCO2 difference (e.g., Weiss, 1974; Liss, 1983; Wanninkhof, 1992) according to equation (1):
where k is the gas transfer (piston) velocity, α is the solubility of CO2 in seawater at a specified salinity and temperature, and ΔpCO2 is the difference between seawater and air pCO2. The gas transfer velocity, k, was calculated using equation (2) (Ho et al., 2006):
where k (600) is a scaling factor for the gas transfer velocity and U10 is the wind speed at 10 m altitude above the water surface. If wind speed was not measured at 10 m, it was converted to U10 using the wind profile power law (equation 3, Peterson and Hennessey, 1978):
where in (3), z is the altitude of the wind speed measurement and 1/7 is a scaling factor that is used when assuming neutral stability conditions of the overlaying atmosphere. Wind speed data were provided as hourly average values, and each wind speed value was matched with the closest buoy pCO2 measurement. The uncertainty in the flux (1 standard deviation) was calculated by error propagation of 2 μatm uncertainty in the pCO2 measurement (Sutton et al., 2014b) and an uncertainty of 0.019 in the gas transfer velocity, k (Ho et al., 2006). Other studies have described uncertainties in coastal CO2 flux estimates due to the physical differences between nearshore and open ocean wind and current stresses (e.g., Tokoro et al., 2014). Although the gas transfer velocity is derived from an open ocean relationship, recent work by Ho et al. (2019) in Kaneohe Bay show its general applicability to coastal and lagoon waters. Further refinement of the gas exchange at shallow reef sites, however, would benefit from inclusion of the effect of current induced turbulence on k.
In order to isolate pCO2 changes due to biogeochemical and physical factors from the direct temperature effect on solubility, the observed values were normalized to the mean temperature at each buoy over the full study period, using equation 4 (Takahashi et al., 1993, 2002). This methodology assumes that for every degree Celsius increase in temperature, the pCO2sw will increase by 4.23%.
where in (4), T is the temperature in °C and the subscripts “mean” and “obs” refer to the annual mean and the individual observed values, respectively.
To plot weekly (monthly) means in averaged time series graphs, a moving average filter was applied over 56 (243) data points, which is the number of measurements made per week (month). Additionally, monthly means were calculated for each month of the study period, and “sub-monthly” variability (mostly diurnal and tidal fluctuation) was defined as the average of the standard deviations of the monthly means. Monthly means were then averaged over each year (to annual means), and “sub-annual” variability (mostly seasonal fluctuation) was defined as the average of the standard deviations of the annual means. Finally, annual means were averaged over two 4-year periods, and the standard deviation of these means was denoted “sub-decadal” variability, describing inter-annual changes.
Long-term trends were quantified using a linear least squares regression of monthly mean pCO2 values over time, with beginning and end points chosen in the same month, to avoid biases resulting from different phases of the seasonal cycle. Trend significance was calculated by doing a two sample T-test between the time series and the linear regression using a 5% significance level.
Results
Seawater pCO2
Descriptive statistics of pCO2sw at each site for the period from June 2008 through December 2016 are shown in Table 1. Mean (±1 standard deviation of the mean) of pCO2sw values at CRIMP-2, Ala Wai, Kilo Nalu, and WHOTS were 457 ± 91, 399 ± 29, 386 ± 21, and 378 ± 13 μatm, respectively. Mean pCO2sw values at Kilo Nalu and WHOTS were equal within one standard deviation, although the range in pCO2sw at Kilo Nalu was nearly twice as large as that at the open ocean WHOTS buoy (Table 1). The largest range in pCO2sw was observed at the CRIMP-2 buoy on the barrier reef of Kaneohe Bay, with an overall range of 950 μatm, which is nearly four times larger than the ranges at Ala Wai and Kilo Nalu (240 μatm, and 198 μatm, respectively) and about eight times the range of pCO2sw observed at the WHOTS buoy (94 μatm). Additionally, the mean daily range in pCO2sw at CRIMP-2 (Table 2) was nearly four times as large as at Ala Wai and Kilo Nalu, and more than an order of magnitude greater than that at WHOTS.
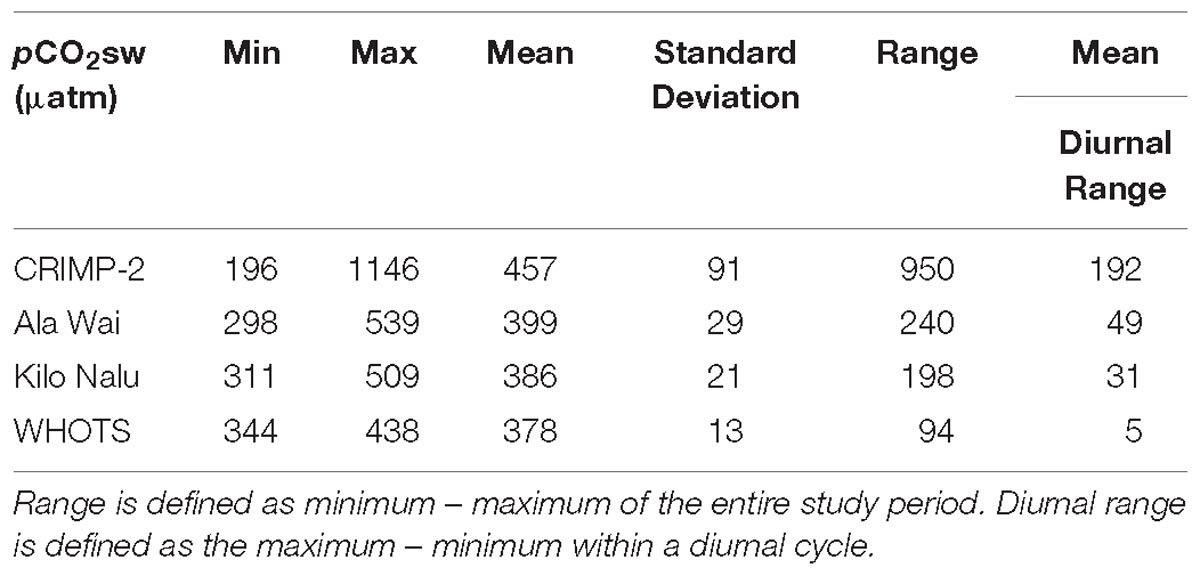
Table 1. Descriptive statistics for seawater pCO2 (pCO2sw) at CRIMP-2, Ala Wai, Kilo Nalu, and WHOTS for the entire study period.
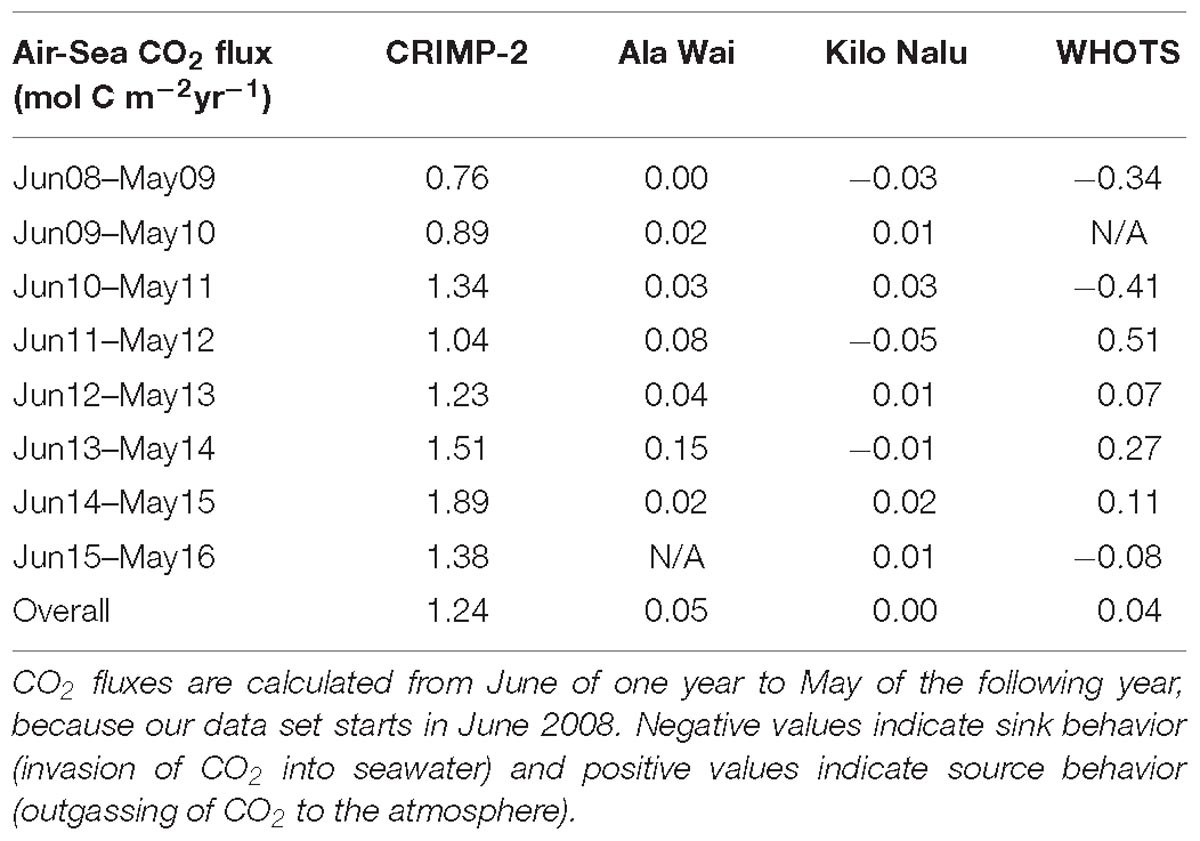
Table 2. Year to year air-sea CO2 fluxes (mol C m−2 yr−1) at CRIMP-2, Ala Wai, Kilo Nalu, and WHOTS buoys.
The time-series of pCO2sw at the four O’ahu locations, from June 2008 through December 2016, is shown in Figure 2A. The greatest daily variations in pCO2sw occurred at the CRIMP-2 buoy (green) while the smallest were at the WHOTS buoy (blue). A seasonal pattern was observed at all buoys, with generally higher pCO2sw in summer (May through October) than in winter (November through April). A clear deviation from the seasonal pattern is visible at Ala Wai during the period October 2013–April 2014, with pCO2sw increasing at Ala Wai, while decreasing at the other buoys. An opposite seasonal pattern was observed for atmospheric pCO2 (pCO2air), which is largely due to the large terrestrial carbon uptake (release) by vegetation during Northern Hemisphere summer (winter) (Keeling et al., 1976).
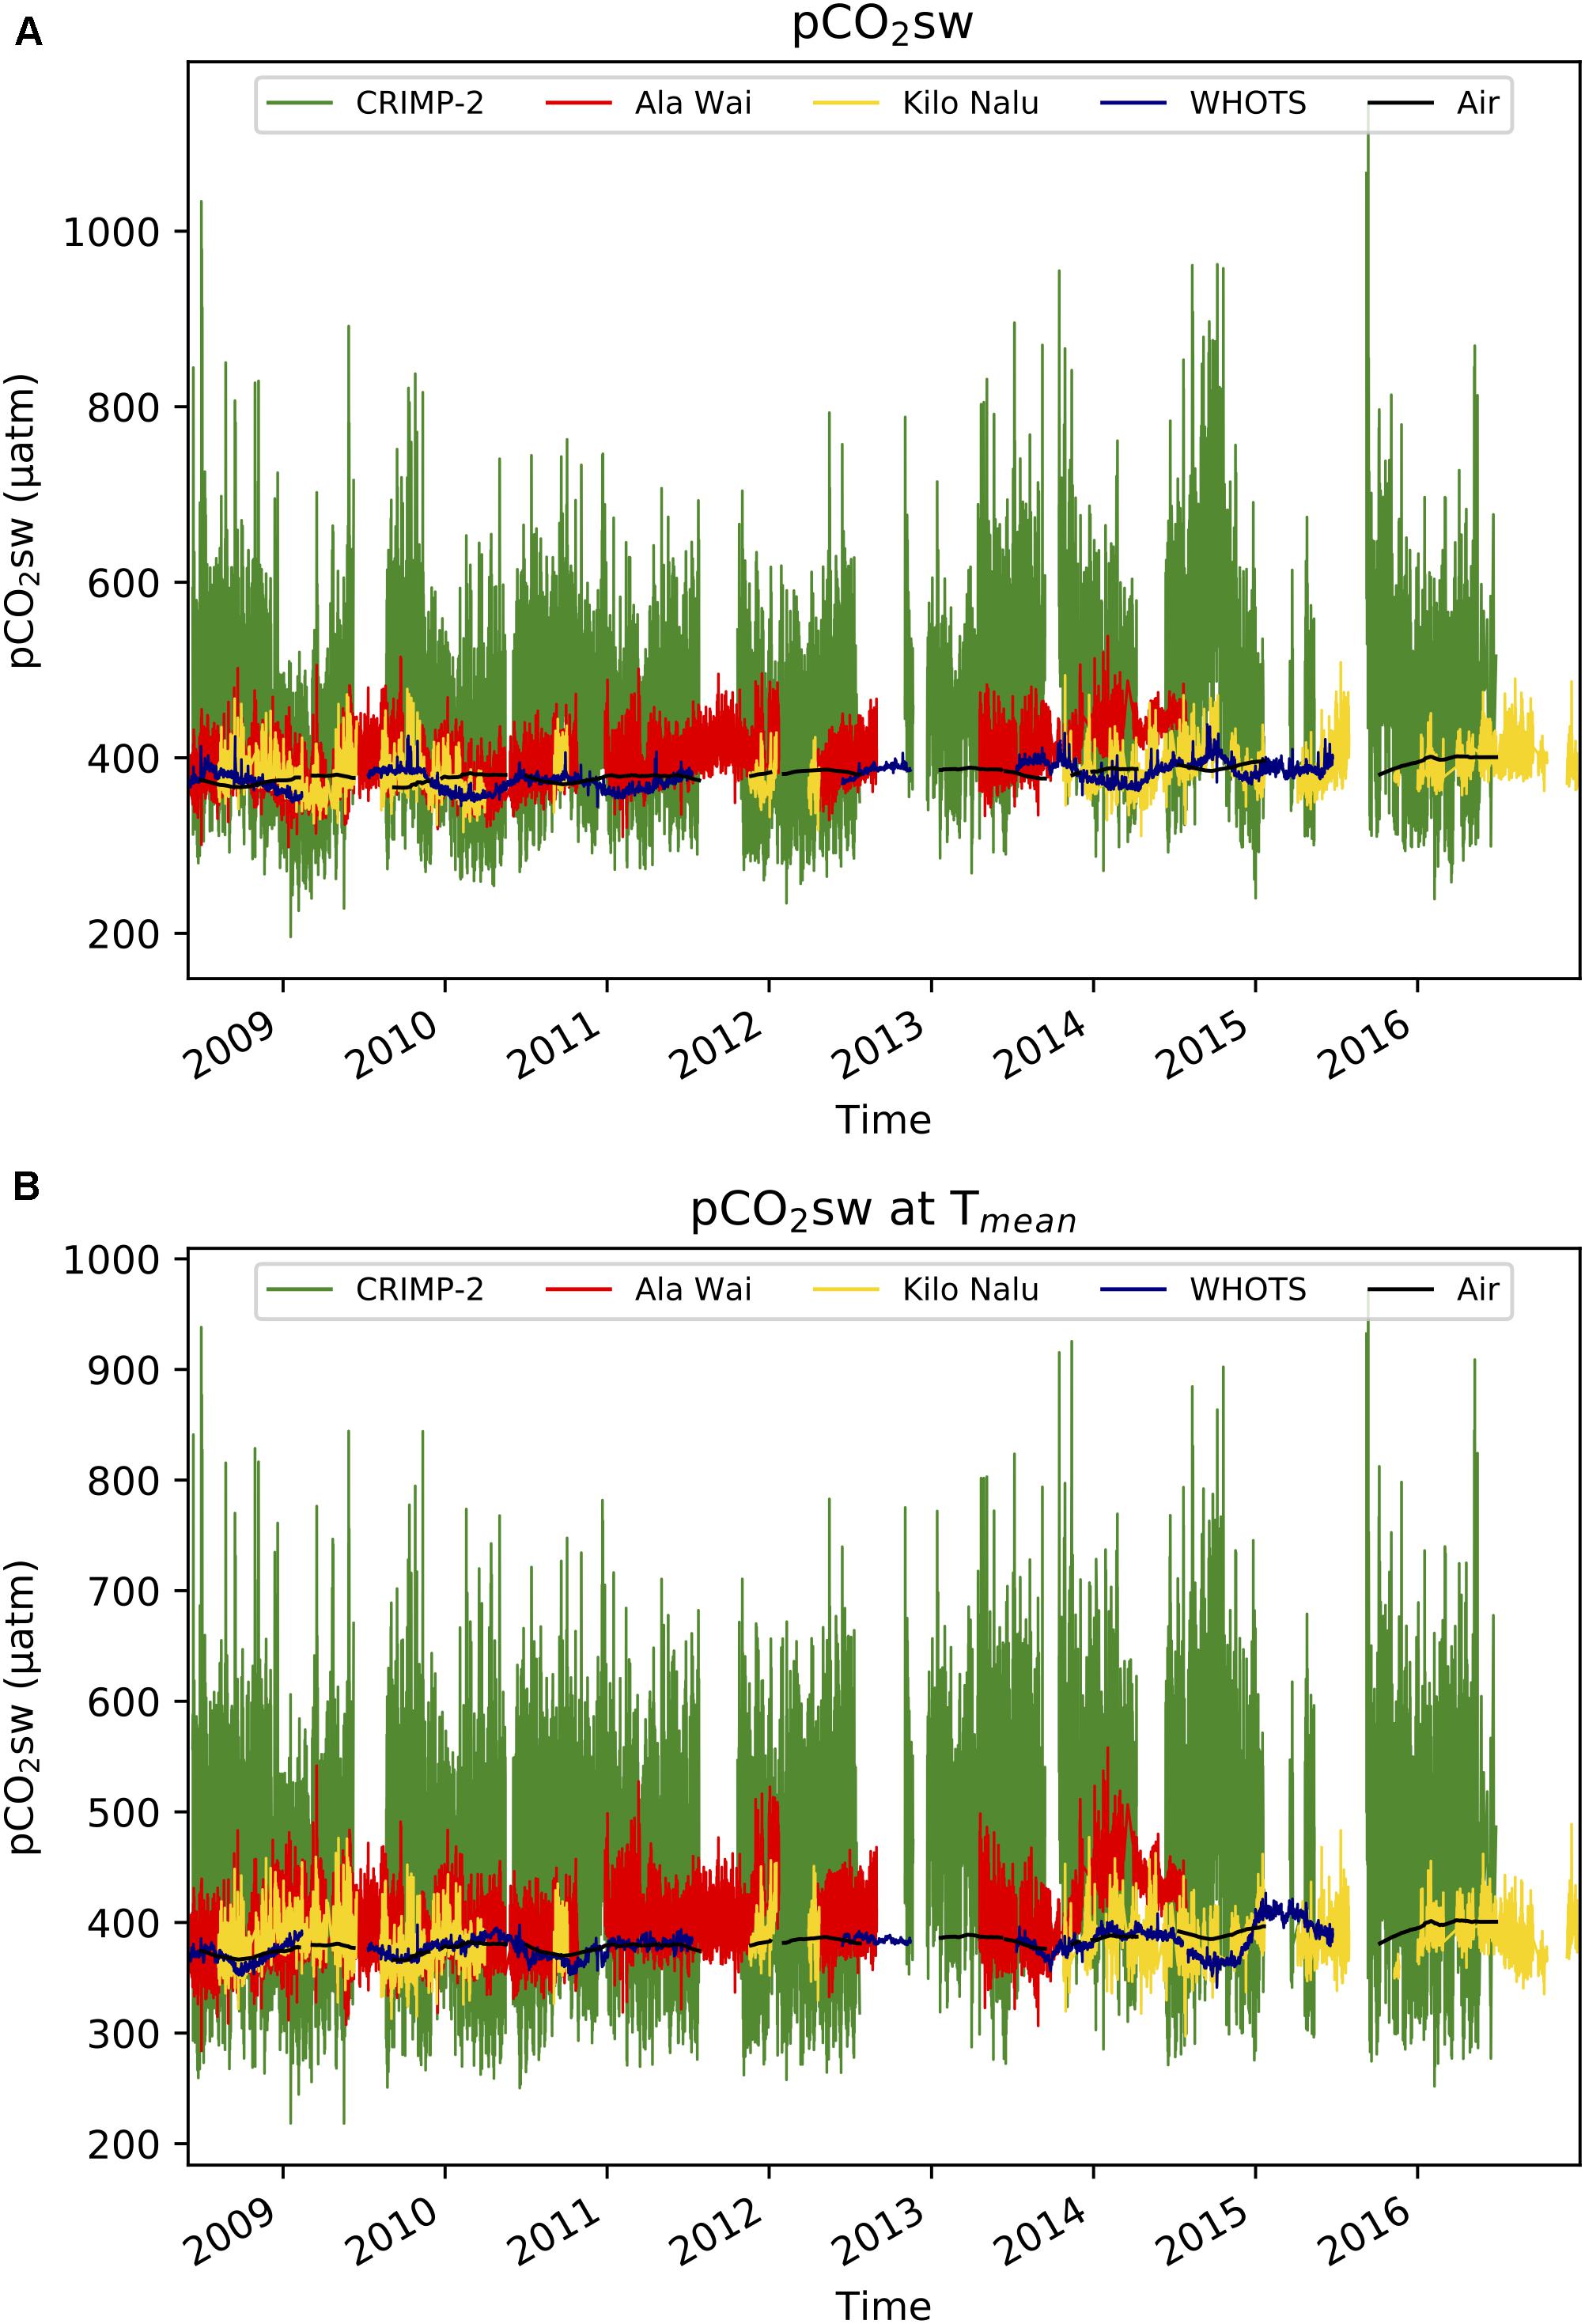
Figure 2. Time-series of in situ (3-hourly) pCO2sw in μatm at CRIMP2, Ala Wai, Kilo Nalu, and WHOTS from June 2008 to December 2016. Weekly mean air pCO2 at CRIMP2 is displayed in black. (A) pCO2sw at all sites. (B) pCO2sw normalized to the mean annual seawater temperature (pCO2 at Tmean).
The pCO2sw normalized to the overall mean seawater temperature at each buoy (pCO2 at Tmean, shown in Figure 2B) illustrates variations in pCO2sw presumably due primarily to biological processes (Takahashi et al., 2002). Although the sub-seasonal variations are similar to the in situ data, the seasonal cycle due to temperature variations is dampened, as previously described by Drupp et al. (2013).
Long term trends are more readily visualized by plotting weekly mean pCO2sw (Figure 3). pCO2sw was increasing at CRIMP-2 between 2012 and 2015, from a maximum weakly mean of 480 μatm in summer 2011, to a maximum of 660 μatm in summer 2014, and a slightly lower maximum of 638 μatm in September 2015. This steep increase in pCO2sw was not observed at the other buoys. Figure 3B also shows weekly mean pCO2 at Tmean, with steeply increasing pCO2 at Ala Wai during the winter of 2013/2014, in contrast to decreasing pCO2 at Tmean at the other buoys during that period.
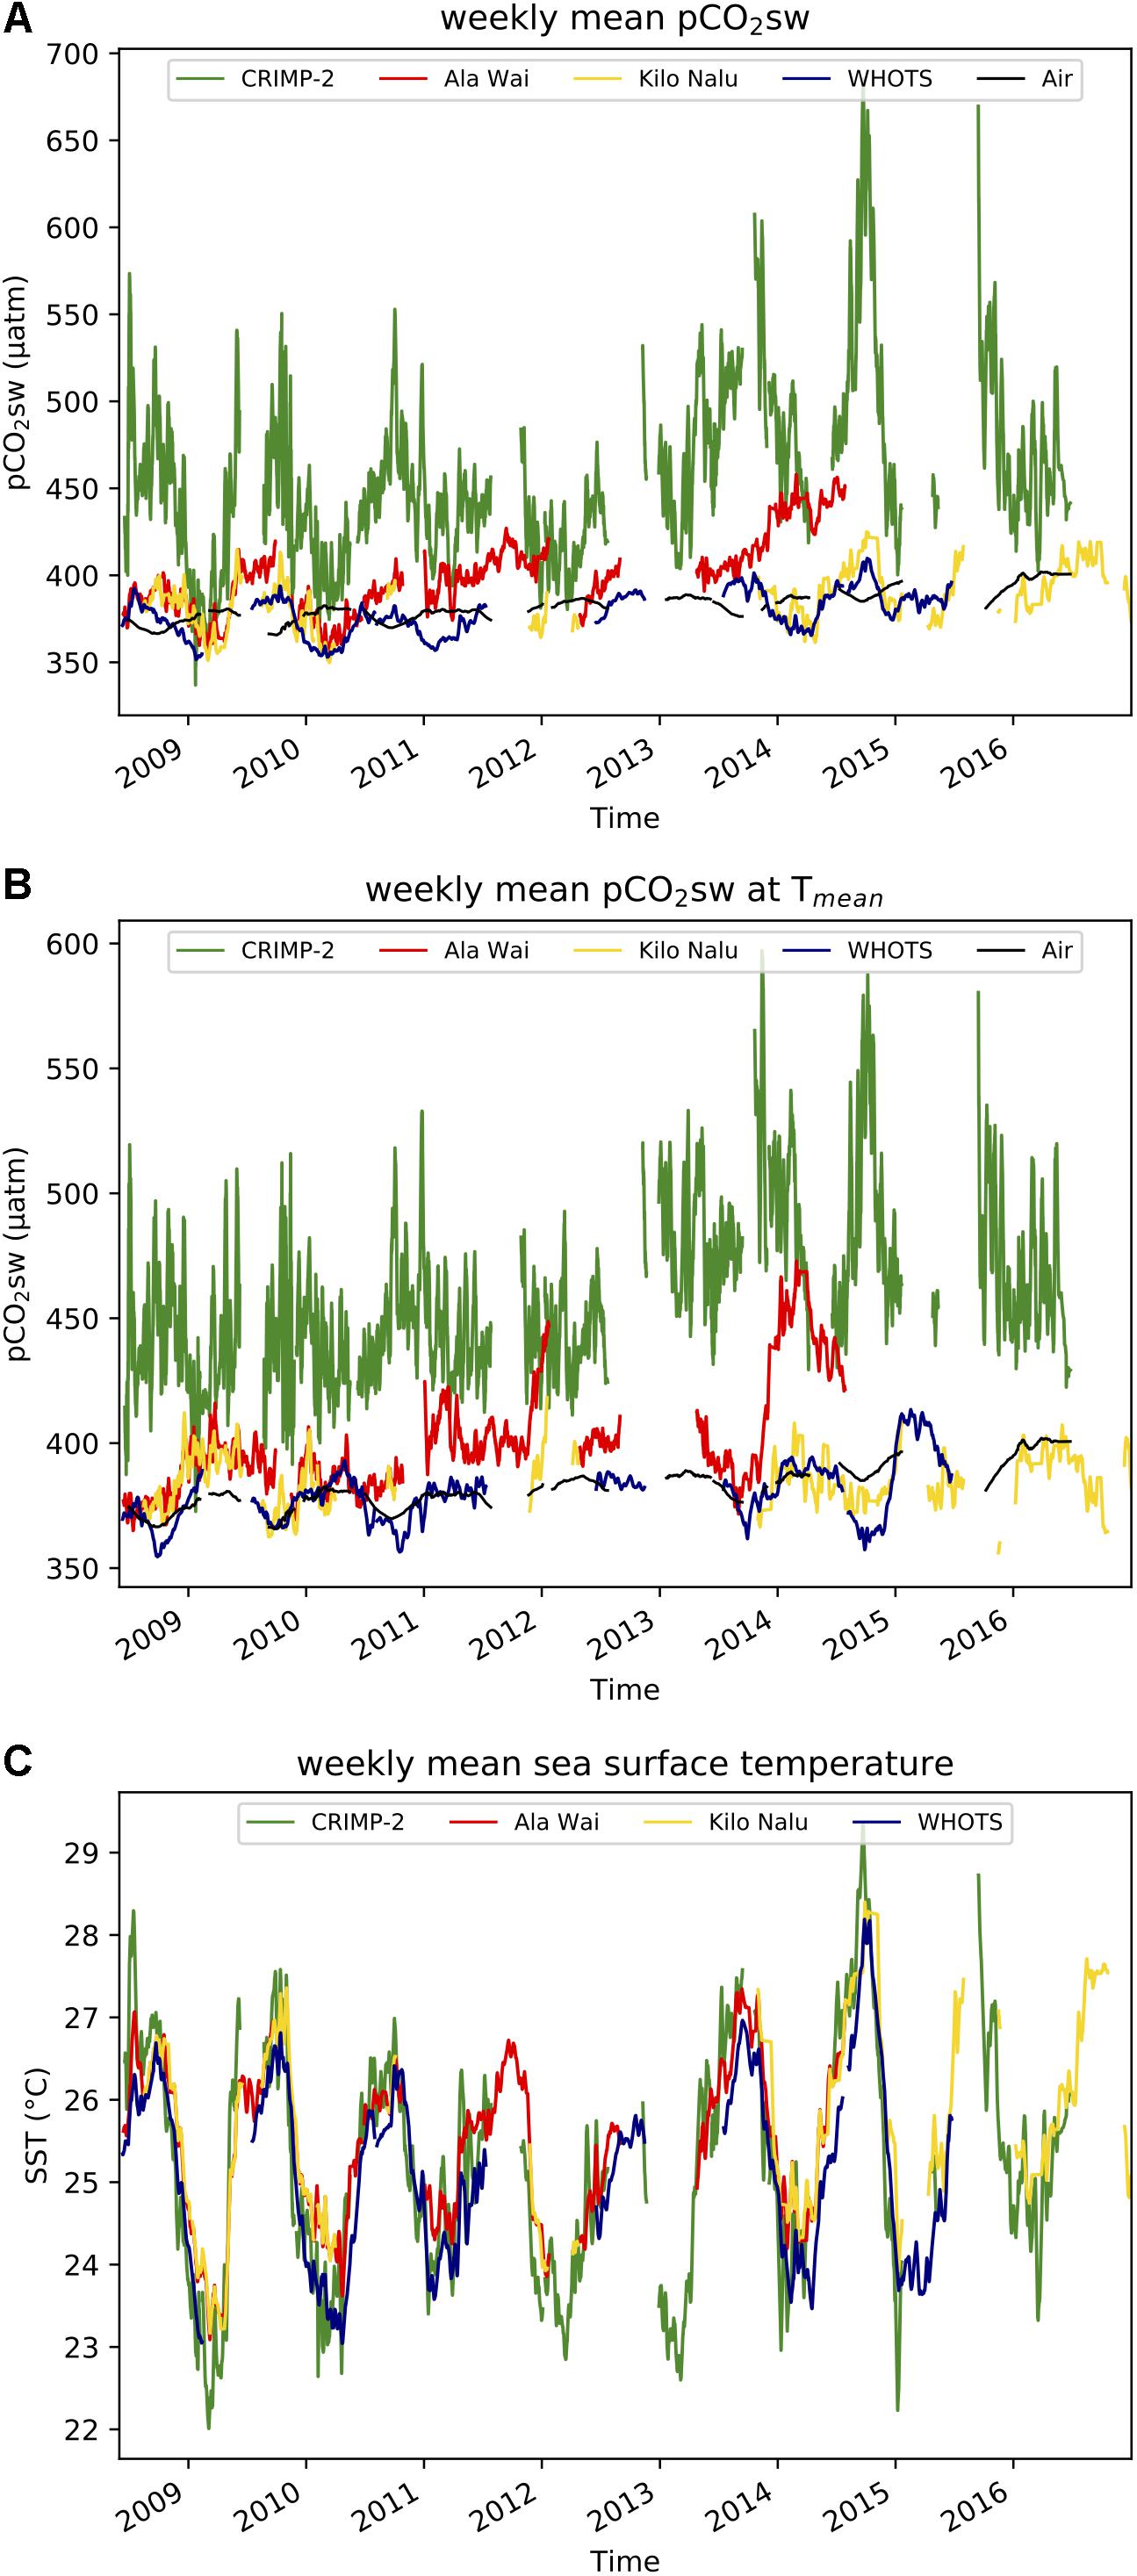
Figure 3. Time-series of weekly mean values at CRIMP2, Ala Wai, Kilo Nalu, and WHOTS from June 2008 through December 2016. Weekly mean air pCO2 is displayed in black. (A) pCO2sw. (B) pCO2sw normalized to the mean annual seawater temperature (pCO2 at Tmean). (C) Seawater temperature.
The coral reef MAPCO2 sites from our study all display increasing pCO2sw over time [7.5 ± 1.9 (1σ), 8.3 ± 1.0, and 2.6 ± 0.7 μatm yr−1 at CRIMP-2, Ala Wai, and Kilo Nalu, respectively, Figure 3A]. These trends are not statistically significant for p < 0.05 (n.s.).
Air-Sea Fluxes of CO2
The magnitude of instantaneous air-sea CO2 fluxes (Figure 4) is much greater at the CRIMP-2 buoy than at the South Shore buoys Ala Wai and Kilo Nalu. The larger (positive as well as negative) fluxes observed at the two South Shore sites in January and March 2009 coincided with storm events (see Tomlinson et al., 2011). The annual air-sea CO2 fluxes at each buoy from June of a given year to May of the next (Table 2), are typically an order of magnitude larger at CRIMP-2 than at either south shore buoy. The annual CO2 flux at Ala Wai is very small but positive, while at Kilo Nalu it is negative for three out of the 8 years. The CRIMP-2 location frequently switches between CO2 source and sink behavior, but the net annual flux over the entire study period (flux estimate ± 1 standard deviation propagated error) at CRIMP-2 is positive (1.24 ± 0.33 mol m−2 yr−1; Table 2) and much larger than the fluxes of 0.05 ± 0.02 and 0.00 ± 0.03 mol m−2 yr−1 at Ala Wai and Kilo Nalu, respectively.
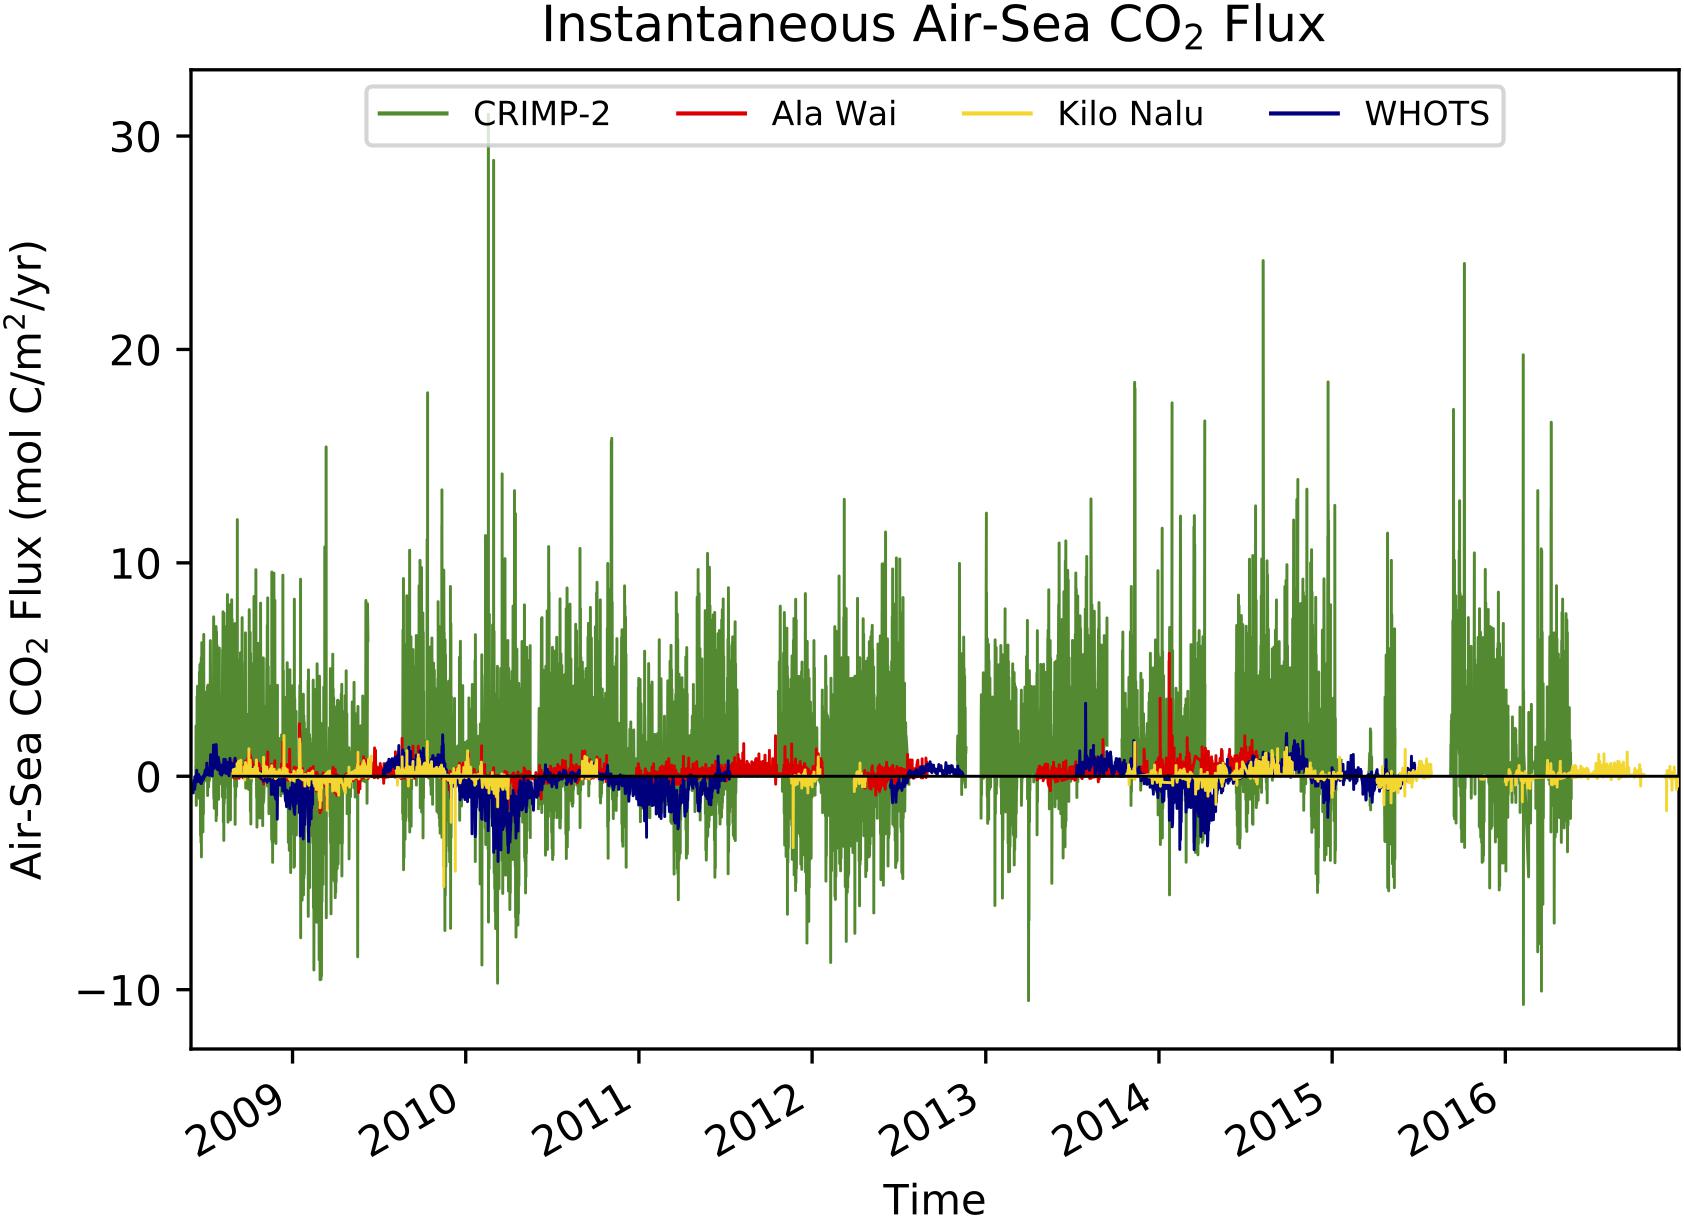
Figure 4. Time-series of in situ (3-hourly) air-sea CO2 fluxes at CRIMP-2, Ala Wai, Kilo Nalu, and WHOTS from June 2008 through December 2016 in units of mol C m−2 yr−1. Positive values indicate a source of CO2 to the atmosphere.
Climatology
Box plots of monthly climatological pCO2sw and air-sea CO2 fluxes are presented in Figures 5, 6, respectively. Although pCO2sw ranges from 196 to 1146 μatm at CRIMP-2 (Table 1), 99.3% of the observed values are between approximately 220 and 790 μatm. The monthly climatological mean pCO2sw at CRIMP-2 is higher and the range is slightly larger in the summer than in the winter. A much narrower range of pCO2sw is observed at the south shore buoys (298–539 μatm at Ala Wai, 311–509 μatm at Kilo Nalu, Table 1), and 99.3% of the pCO2sw values fall between 300 and 500 μatm at Ala Wai and between 320 and 450 μatm at Kilo Nalu.
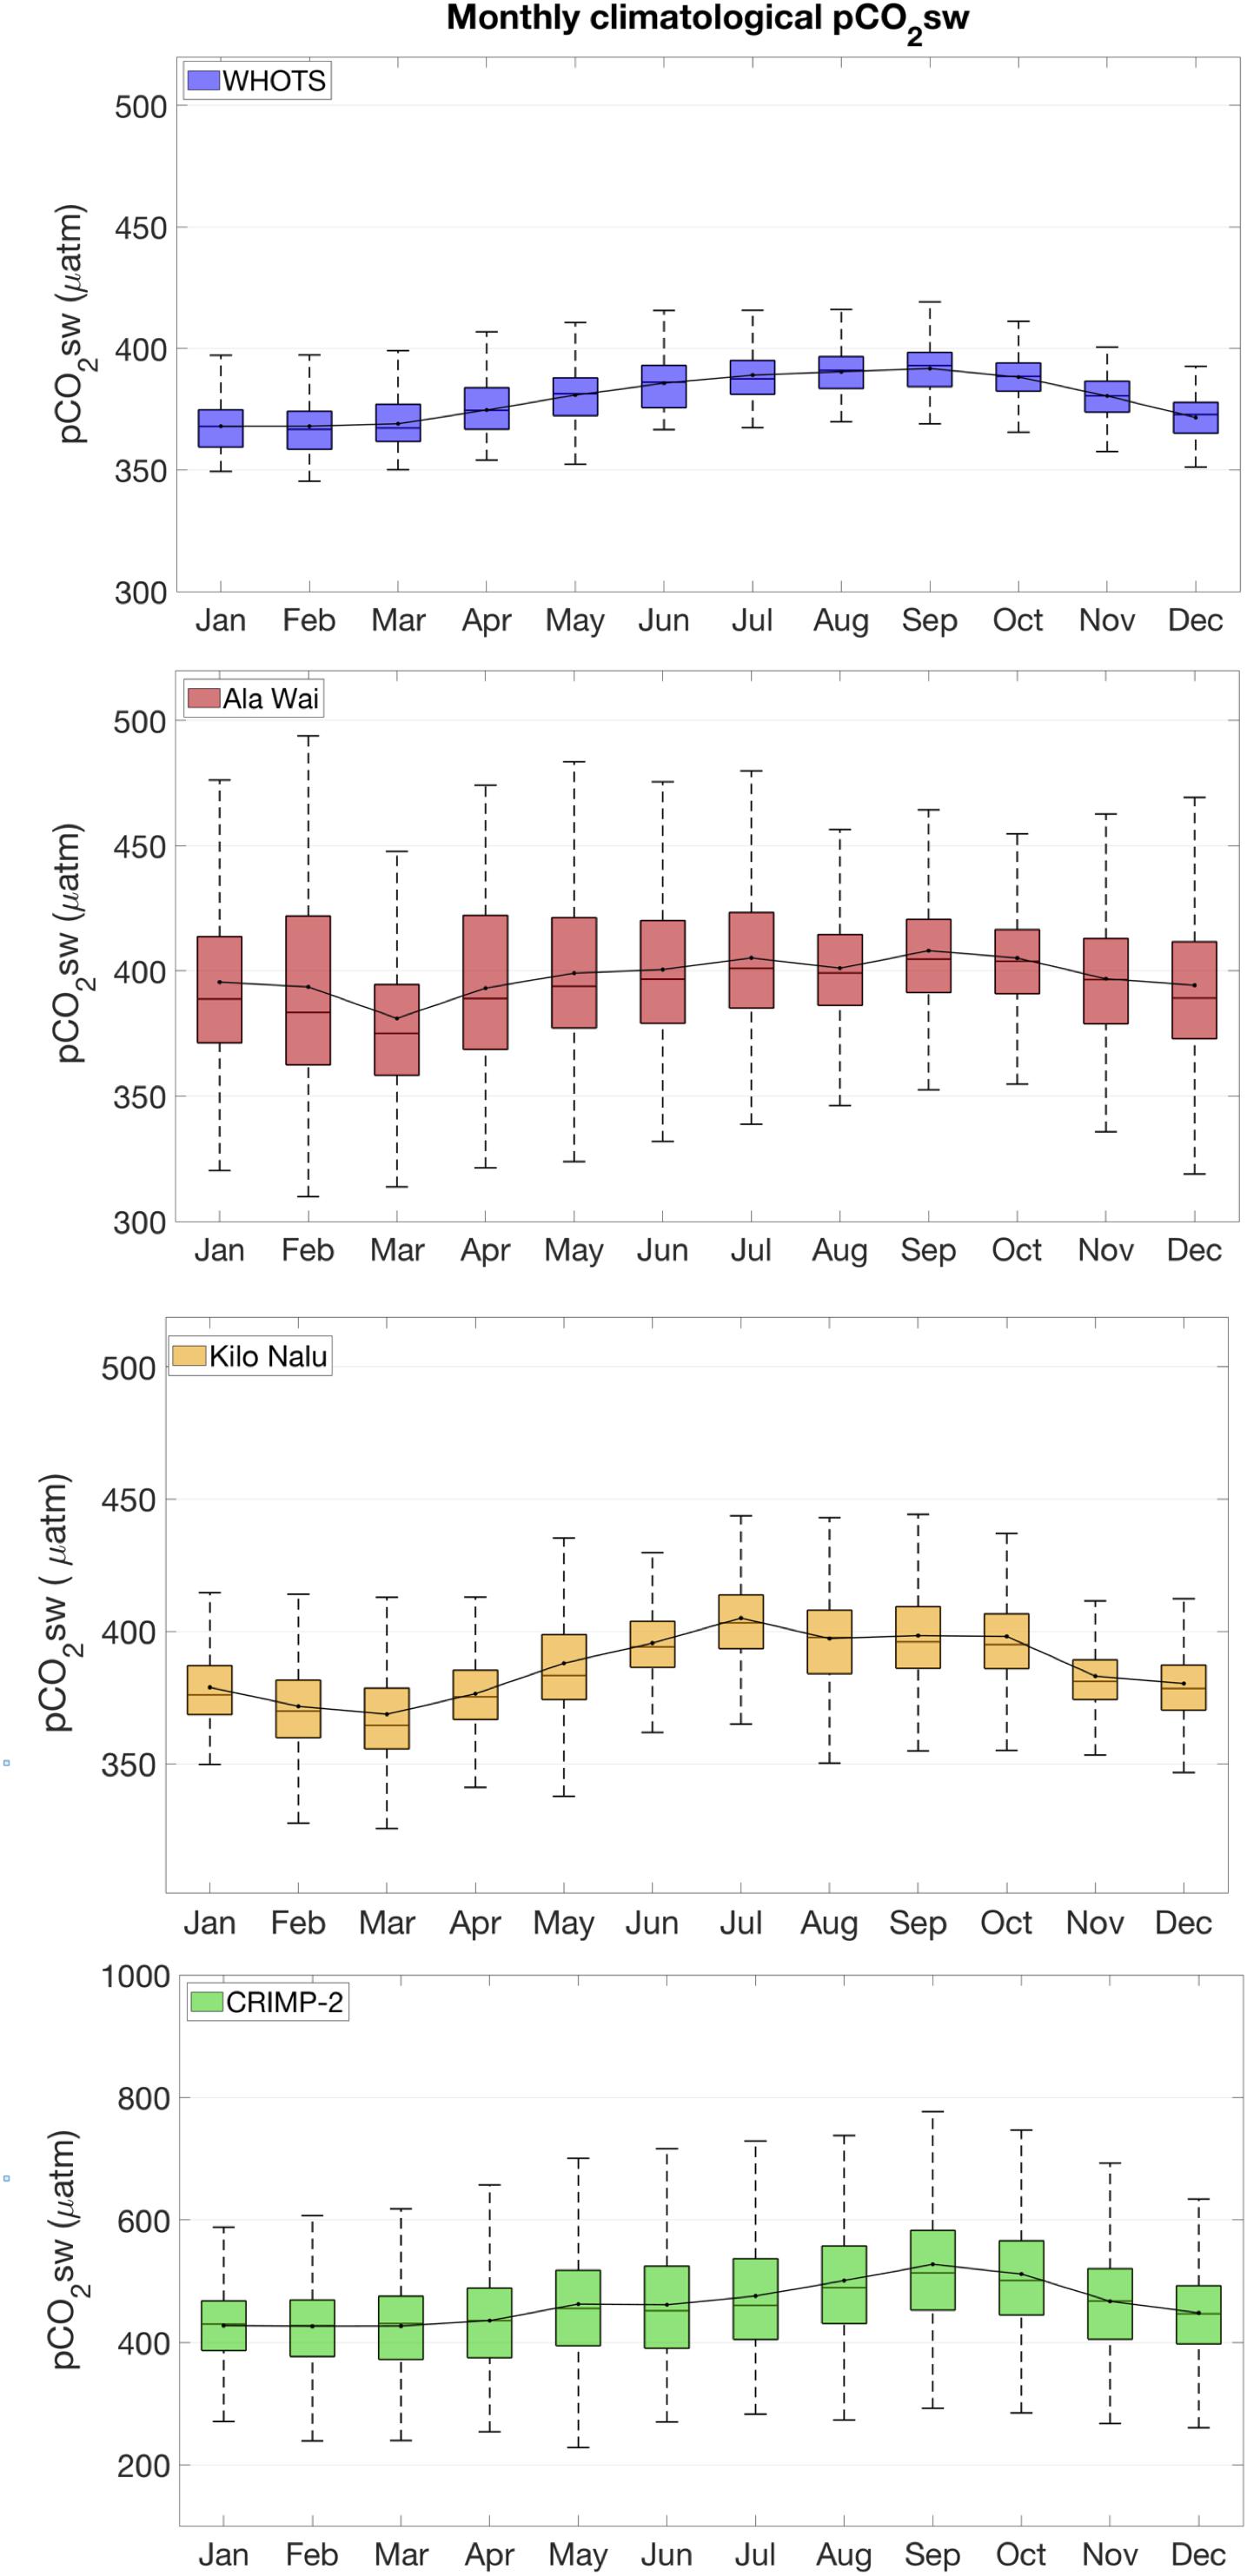
Figure 5. Monthly climatological box plots of pCO2sw, based on data from June 2008 through December 2016, at all sites. Box plots show median (line within the box), mean (dot, with a line drawn through the mean of each month), the bottoms and tops of the boxes are the 25th (q1) and 75th (q3) percentiles, respectively. The whiskers extend to 1.5 X interquartile range (q3-q1), corresponding to approximately ± 2.7 σ or 99.3% of the data (if normally distributed). Outliers are not included.
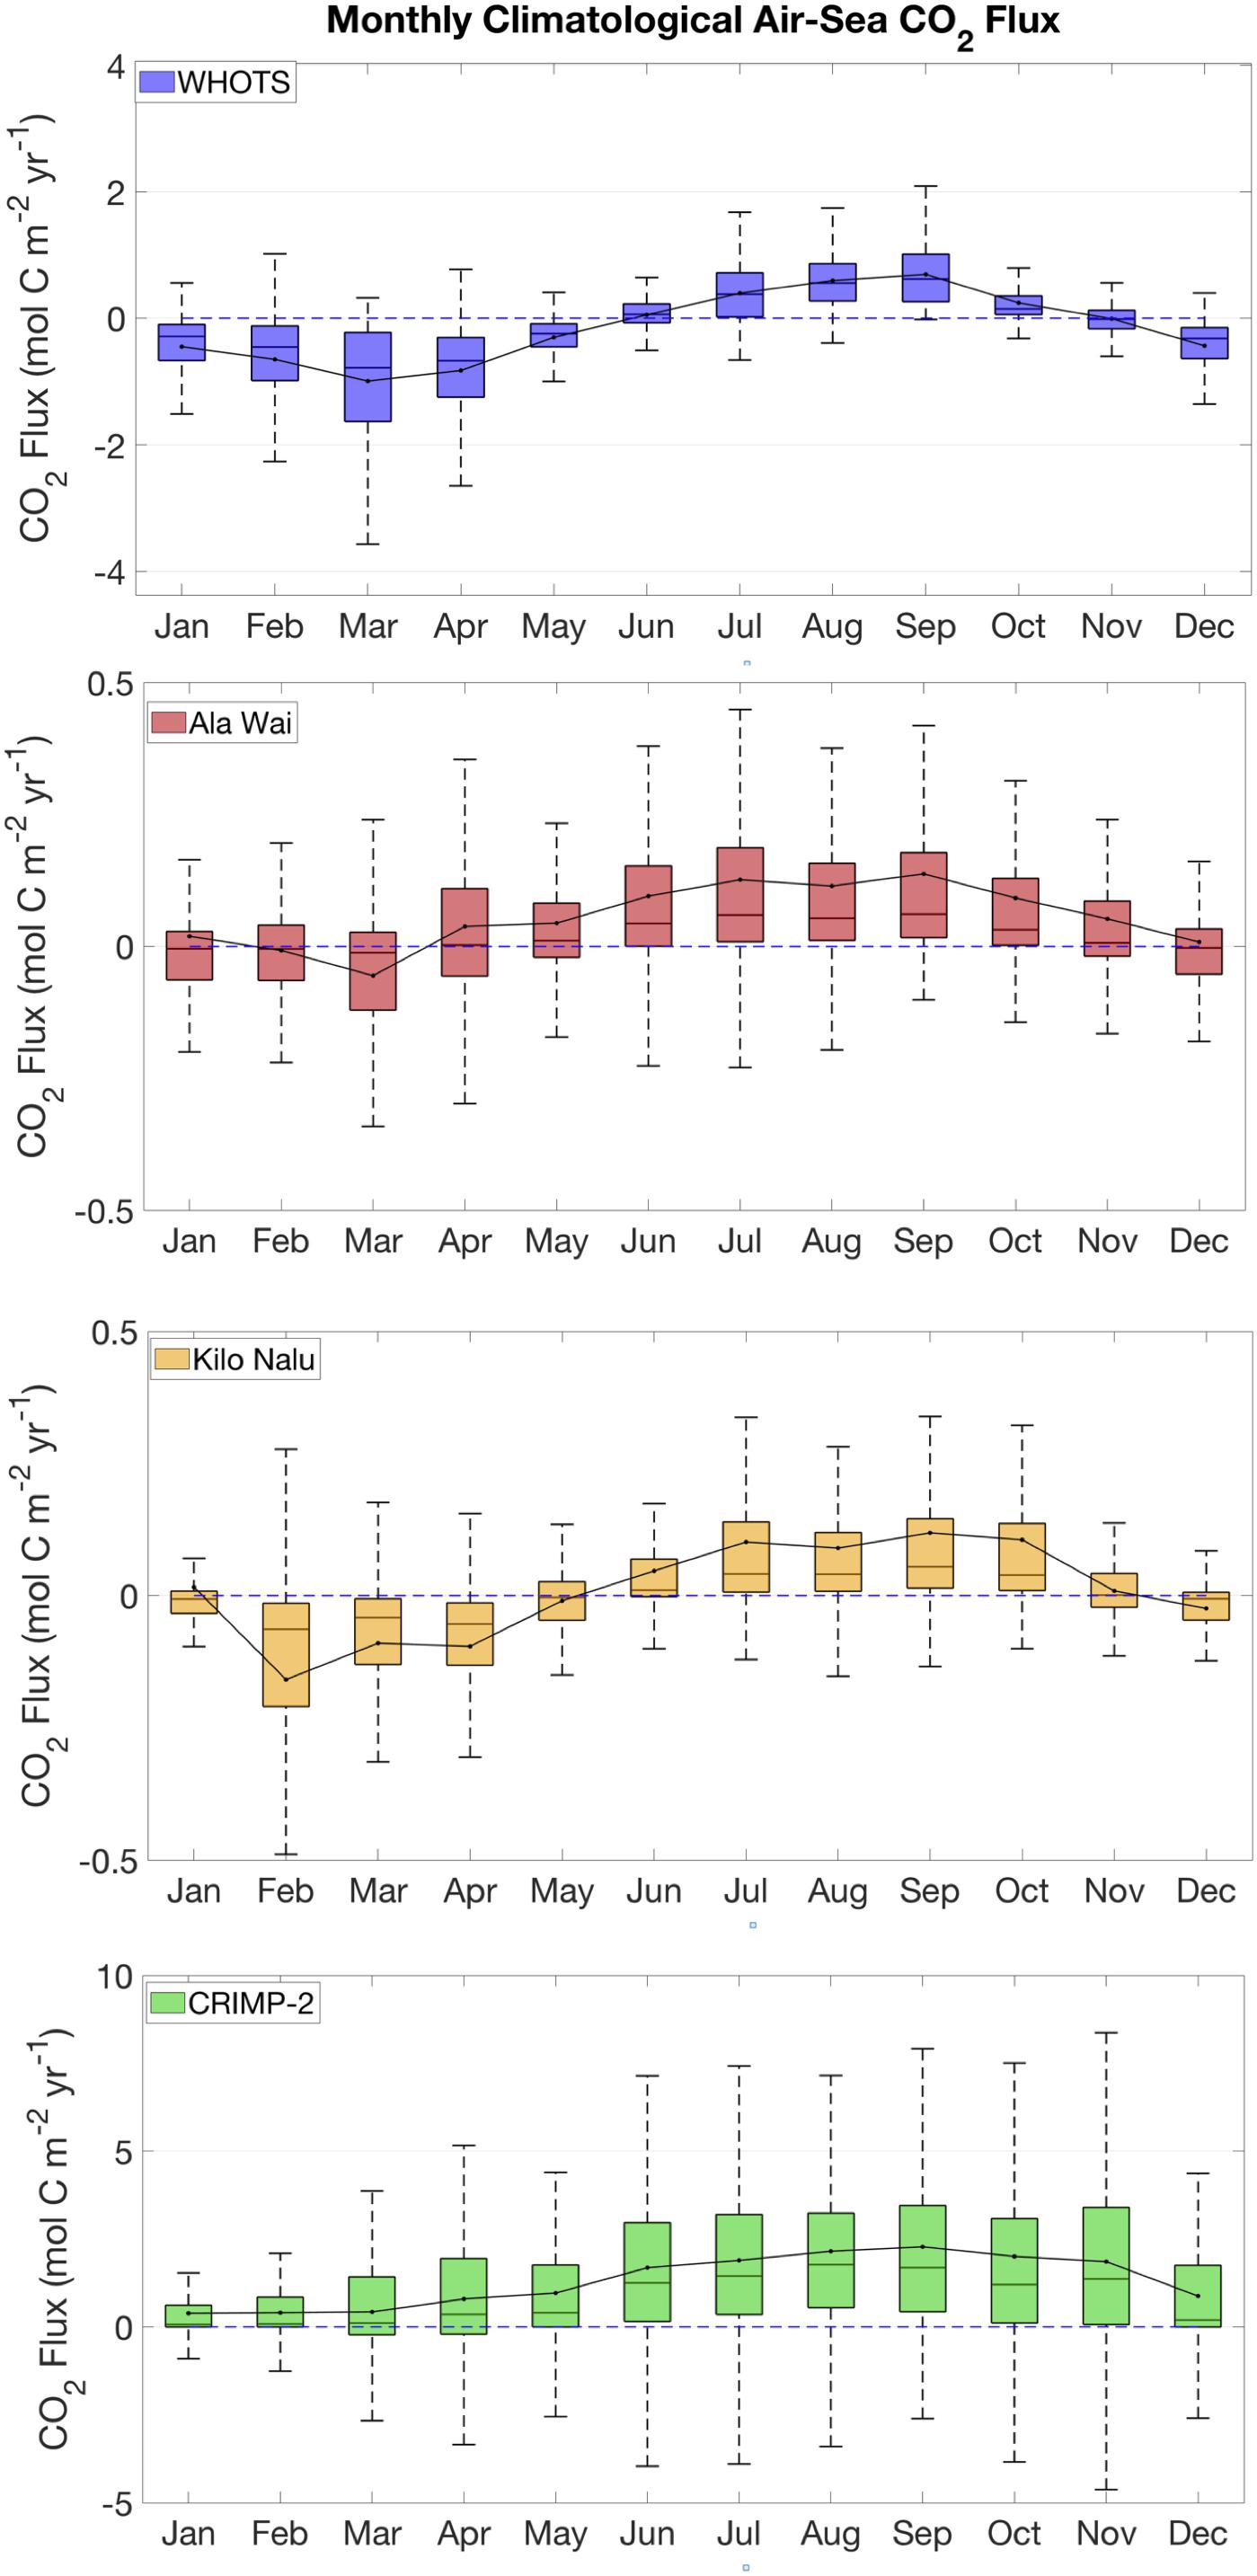
Figure 6. Monthly climatological box plots of air-sea CO2 fluxes, based on data from June 2008 through December 2016, at all sites. The blue dashed line illustrates a flux of zero, positive values indicates that the area is a source of CO2 to the atmosphere. See Figure 5 for plot description.
The coral reef sites described here display a different extent of variability in pCO2sw during different months. At CRIMP-2, the highest pCO2sw and greatest variability is observed during the summer (May through October). In contrast, the most variable periods at Ala Wai occur during winter, especially in December through January. The pCO2sw at Kilo Nalu exhibits consistently less variability than Ala Wai.
Instantaneous air-sea CO2 fluxes (Figure 6) also show a slight seasonal pattern similar to that of pCO2sw. At CRIMP-2, higher mean fluxes are observed during summer than winter, and the lowest variability in fluxes is observed during December.
Discussion
To assess various drivers of variability on selected Hawaiian reefs, we compare pCO2sw (see Variability in pCO2sw) and air-sea CO2 fluxes (see Variability in Air-Sea Fluxes) of our most open ocean-like coastal MAPCO2 buoy, Kilo Nalu, to the offshore reference WHOTS mooring, and subsequently examine local differences between all three coral reef locations, as well as monthly climatological values.
Variability in pCO2sw
Coastal vs. Open Ocean pCO2sw
Kilo Nalu was originally selected as a coastal reference point that should reflect near open ocean waters with well mixed conditions. There are indeed similar trends in seasonal variability in pCO2sw at Kilo Nalu and WHOTS (Figure 7A), which can largely be attributed to comparable seasonal SST changes at both sites. Daily pCO2sw fluctuations, however, are much greater at Kilo Nalu’s coastal reef ecosystem than in the open ocean. These diurnal variations in pCO2sw at Kilo Nalu are mainly driven by greater benthic and water column photosynthesis and respiration, which reflect both the presence of a coral reef at Kilo Nalu, and the effect of discharge of nutrients and suspended solids on biogeochemical processes in proximity to land, with additional effects of calcification and dissolution on the reef (Tomlinson et al., 2011; Drupp et al., 2013). Consequently, the seasonal cycles of pCO2sw in both a nearshore reef and the open North Pacific Ocean are similar in amplitude and driven by the temperature effect on CO2 solubility, while short-term variability is much larger in the coral reef environment largely due to biological processes.
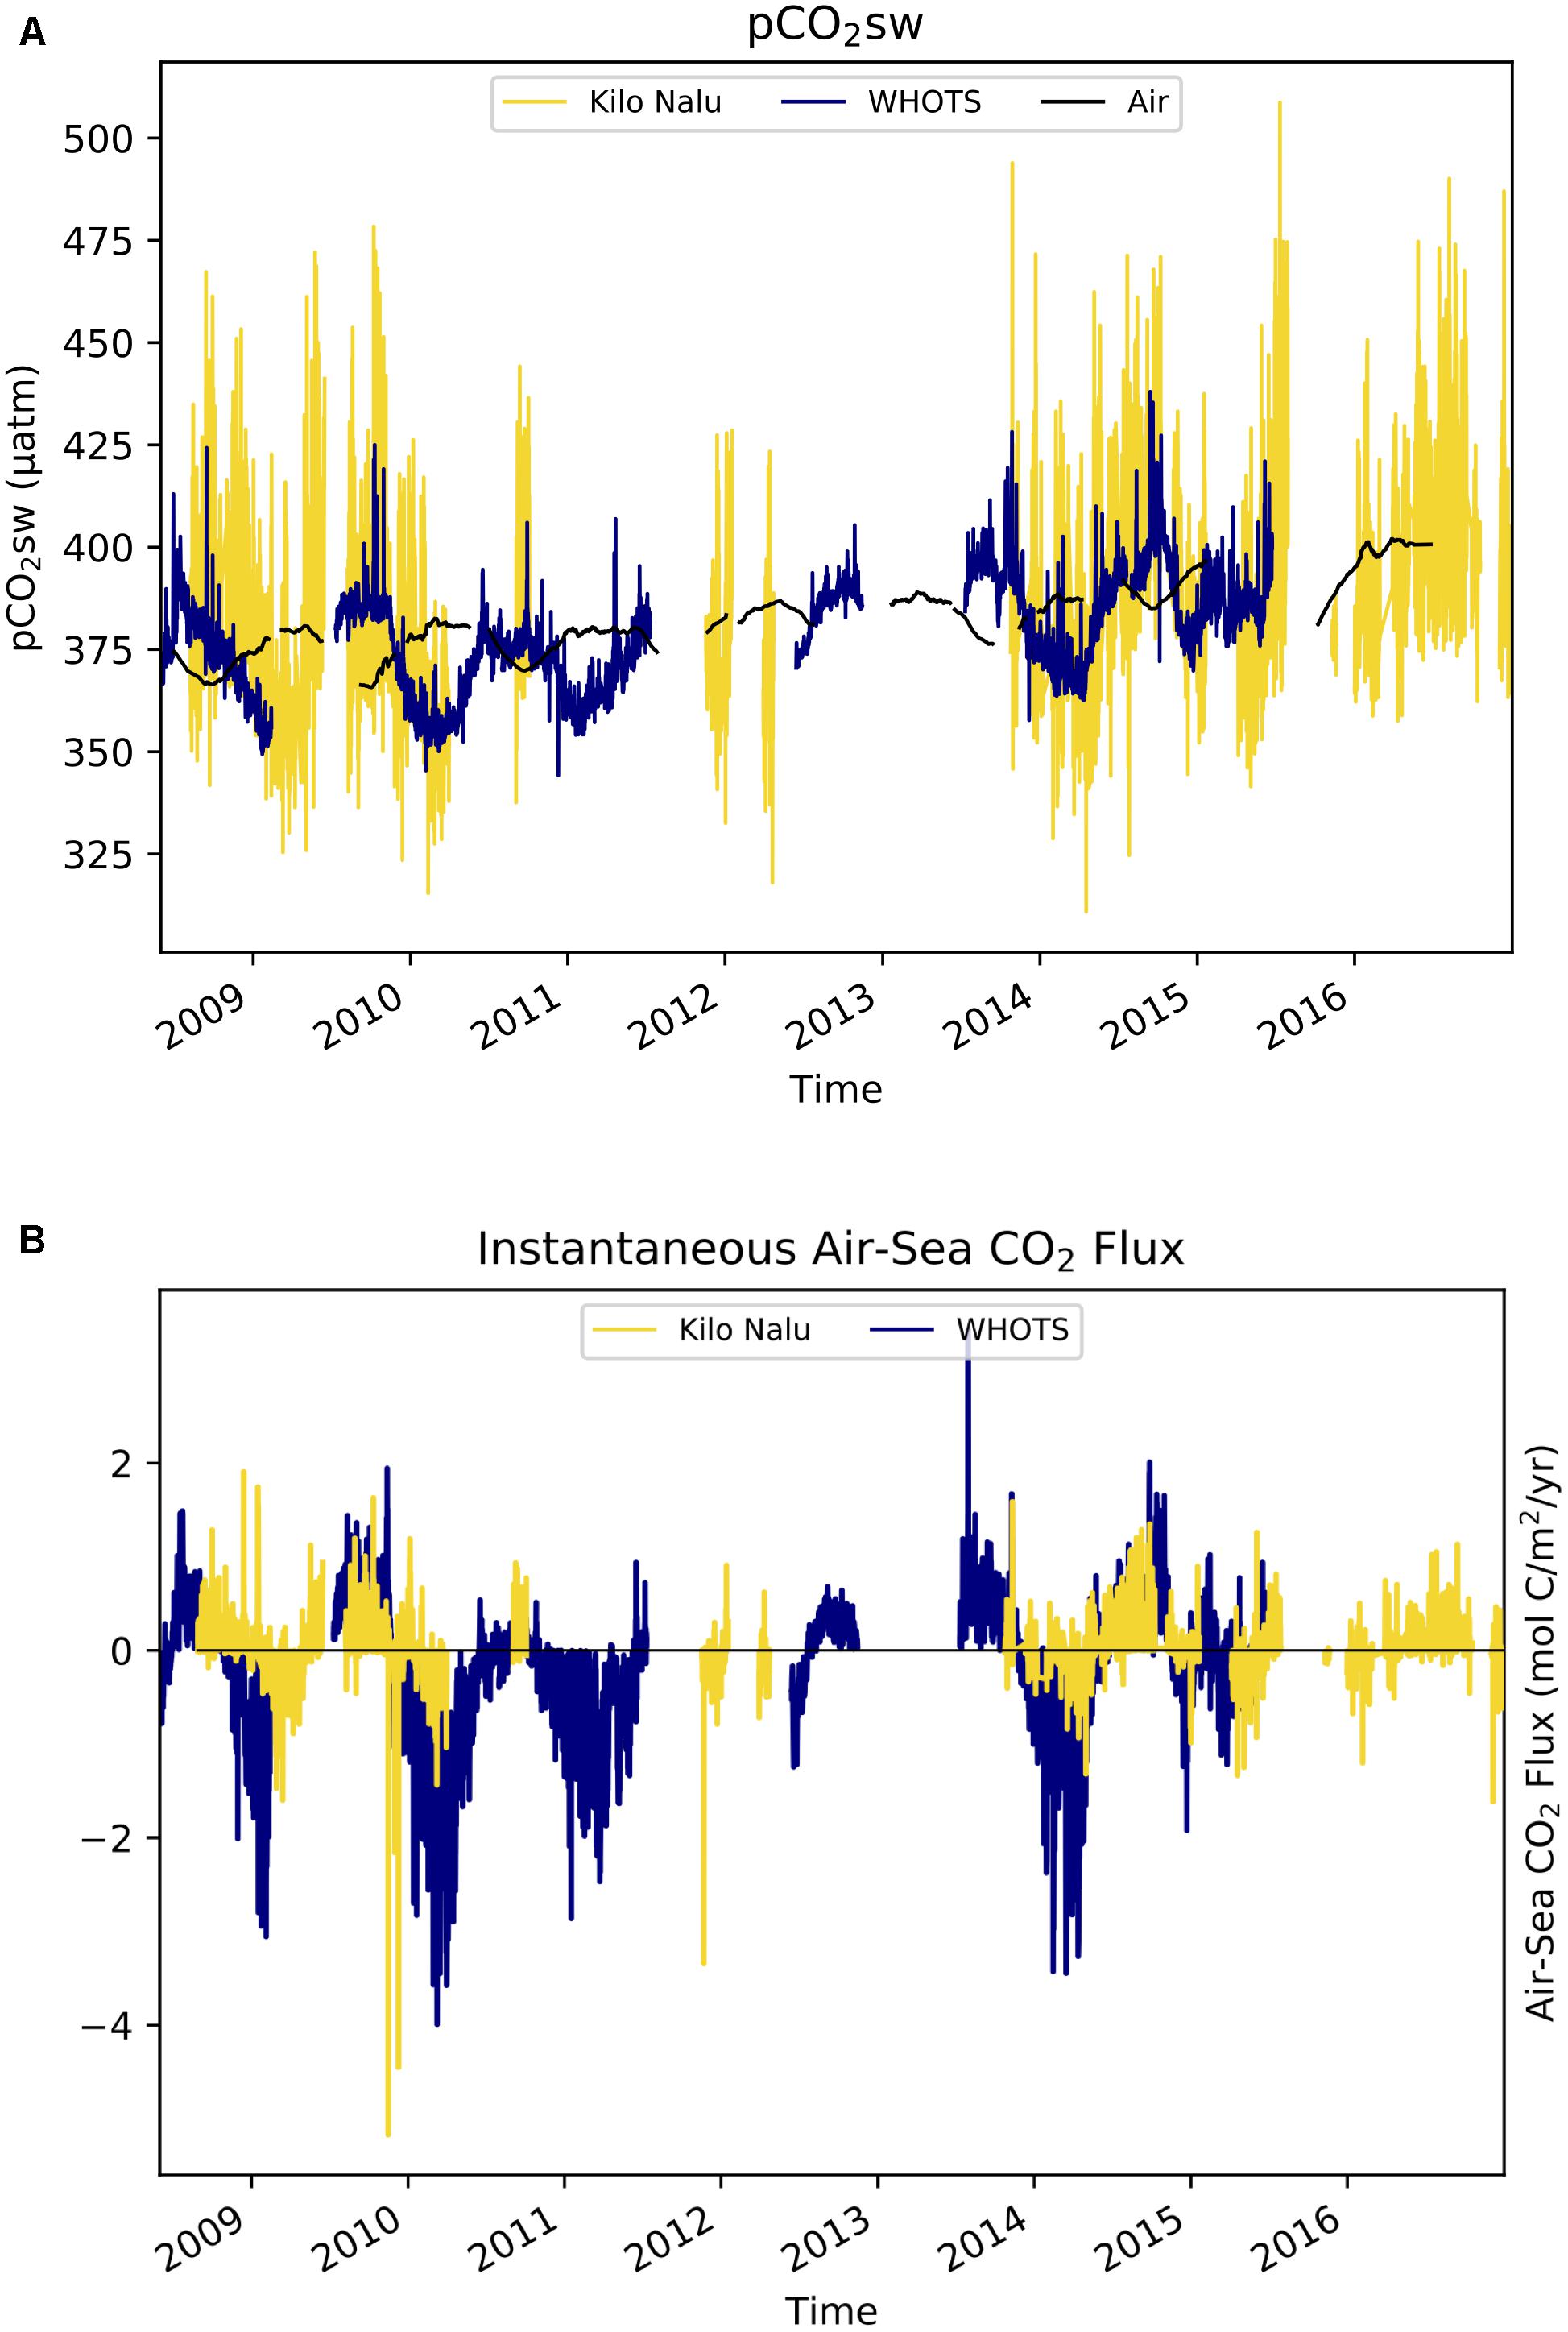
Figure 7. Time-series of pCO2sw and air-sea CO2 fluxes at Kilo Nalu and WHOTS from June 2008 through December 2016. This figure is similar to Figures 2A, 4, but plotted on a narrower y-axis range to highlight the differences in variability at Kilo Nalu and WHOTS. (A) In situ (3-hourly) pCO2sw in units of μatm. (B) Air-sea CO2 fluxes in units of mol C m−2 yr−1 where positive values indicate a source of CO2 to the atmosphere.
Local Drivers of pCO2sw
Local geography, weather, and proximity to land all affect pCO2sw at coastal coral reef sites. Ala Wai and Kilo Nalu buoys are both a few hundred meters from shore, moored in waters with the same depth. They differ, however, with respect to riverine input. The Ala Wai site receives direct runoff from the Ala Wai Canal, that usually does not strongly impact the Kilo Nalu buoy (Tomlinson et al., 2011). Consequently, the overall range of pCO2sw on diurnal to seasonal time scales (Table 1) is substantially greater at Ala Wai than those observed at Kilo Nalu (Figures 4, 6).
An unusual increase in pCO2sw at the Ala Wai buoy was observed during the winter of 2013–2014 (Figure 3A). A decrease in seawater temperature during the winter, however, is expected to cause a decrease in the pCO2sw (e.g., Takahashi et al., 1993; Massaro et al., 2012; Drupp et al., 2013). Despite the somewhat elevated seawater temperature at both south shore buoys during this period, higher pCO2sw values were not observed at Kilo Nalu. In the temperature-normalized pCO2sw record for this period (Figure 3B, e.g., Takahashi et al., 1993, 2002), the pCO2sw increase at the Ala Wai buoy is even more apparent. Consequently, it is likely that there was increased respiration and organic matter degradation at the mouth of the Ala Wai Canal during this period. This biological activity was potentially triggered by riverine runoff, as suggested by the Kilo Nalu buoy’s lack of a response to direct inputs from the Ala Wai Canal.
A distinguishing feature of the CRIMP-2 site is its extreme variability in pCO2sw compared to the South Shore buoys (Figures 2, 4–6). CRIMP-2 is located in shallow water (<3 m) on the inside edge of the highly productive barrier reef of Kaneohe Bay, and vigorous calcification/dissolution and primary production/respiration on the reef flat (e.g., Shamberger et al., 2011; Courtney et al., 2017) cause large and occasionally extreme daily swings in pCO2sw. Page et al. (2018) found that organic carbon cycling (P/R) was dominating Kaneohe Bay barrier reef metabolism compared to inorganic carbon cycling (calcification/dissolution), especially in the winter, with very low pCO2sw due to primary productivity during the day, and a strong respiration signal leading to high pCO2sw at night. In addition, two physical factors result in a very large amplitude of these daily swings at CRIMP-2 compared to other coral reef sites in this study, residence time and water depth. The longer residence time of seawater on the barrier reef of Kaneohe Bay (up to several days, Lowe et al., 2009) relative to the Honolulu sites allows for a more pronounced signature of changes in CO2 in the water column at CRIMP-2: the products of biological reactions have a longer time to accumulate in a given parcel of water. Additionally, the shallow depth (i.e., low volume of water) at CRIMP-2 may also enhance the effects of benthic productivity and carbonate mineral-seawater interactions (e.g., Drupp et al., 2016; Page et al., 2018) on the pCO2 of surface seawater at this location, by reducing the effective volume of water into which accumulate this and other chemical constituents associated with metabolism.
Monthly pCO2sw Climatology
The monthly pCO2sw climatology for the O’ahu coastal and WHOTS buoys (Figure 5) is characterized by a clear seasonal trend with lower mean pCO2sw during winter months and higher mean pCO2sw during summer months. The range of the variability (illustrated by the size of the boxes and length of the whiskers of the box plots) differs between sites, and over time at each site, reflecting how differences in physical and biogeochemical processes influence CO2 dynamics.
At CRIMP-2, higher SST and increased productivity/respiration cycles during the summer (May through October) result in higher pCO2sw and greater fluctuations of pCO2sw. Higher seawater temperature causes decreased CO2 solubility, which increases the pCO2sw. Productivity is enhanced by elevated seawater temperature during summer, and likely also by increased solar radiation, but this factor works in the opposite direction (CO2 drawdown). Lower and less variable pCO2sw during the winter months results from lower seawater temperature, lower insolation, and the concomitant effects on productivity/respiration and calcification/dissolution cycles. As mentioned earlier, the shallow depth and the relatively long residence time of water on the barrier reef of Kaneohe Bay allow for a pronounced accumulation (or depletion) of CO2 in a given parcel of water from vigorous reef metabolism. The changes in pCO2sw due to reef metabolism are most apparent during the summer, when wind speeds are often lower and gas exchange with the atmosphere is consequently diminished.
At the South Shore buoys, Ala Wai and Kilo Nalu, the pCO2sw variability is considerably smaller than that at CRIMP-2 year-round. This reflects the less productive environment as well as the shorter water residence time and deeper water at the two fringing reef sites. At Ala Wai, pCO2sw variability is somewhat greater during the winter months. This is likely due to increased rainfall leading to more runoff of nutrients and organic matter from the Ala Wai Canal, thereby enhancing productivity during the wet season. The monthly means and the seasonal cycles at Ala Wai and Kilo Nalu are similar, but the smaller variability during the rainy season at Kilo Nalu reflects the lack of direct riverine input at this site. The pCO2sw in the open ocean (WHOTS) shows little variability throughout the year.
Variability in Air-Sea Fluxes
Coastal vs. Open Ocean Air-Sea CO2 Fluxes
Although the air-sea CO2 fluxes at Kilo Nalu and WHOTS are more similar than their pCO2sw time series (Figure 7B), the dynamics driving these fluxes differ between locations. The magnitude and direction of the instantaneous air-sea flux of CO2 depend primarily on the sea-air pCO2 difference (ΔpCO2) and the wind speed. Larger pCO2sw fluctuations at Kilo Nalu due to the biogeochemical processes described above result in larger values of ΔpCO2 as well as greater variability of ΔpCO2 than observed at WHOTS. Annual median wind speeds at Kilo Nalu (2.2 ms−1) are typically lower than at WHOTS (7.5 ms−1), further increasing the relative importance of the ΔpCO2 term in the flux equation for the Kilo Nalu coastal site. Storm events can enhance the biogeochemical processes driving ΔpCO2 at Kilo Nalu, which often increases fluxes significantly. During and after storm events, Kilo Nalu is often exposed to diluted freshwater discharges of nutrients and suspended solids that are advected from the mouth of the Ala Wai canal (see Tomlinson et al., 2011, and Figure 1). For example, immediately after a storm that took place on March 13, 2009 (Tomlinson et al., 2011), instantaneous flux values reached a maximum of −5.43 mol C m−2 yr−1 at the Kilo Nalu buoy. This large ocean uptake can be attributed to a seawater CO2 drawdown associated with a phytoplankton bloom (Drupp et al., 2013). Despite these events, the net CO2 flux throughout the full study period at Kilo Nalu is near zero, because the daily positive and negative fluxes due to biogeochemical processes mostly cancel out.
Because wind speeds at WHOTS are approximately four-fold greater than at Kilo Nalu, even the very small ΔpCO2 driven by weaker daily photosynthesis/respiration and SST cycles causes an instantaneous flux that is, with an average of 0.49 mol C m−2 yr−1, considerably larger in magnitude (absolute value) at WHOTS than at Kilo Nalu. This is a result of the greater gas transfer velocity at higher wind speeds (Wanninkhof, 1992; Nightingale et al., 2000a,b; Ho et al., 2006). Nonetheless, the net annual area specific air-sea CO2 flux at WHOTS remains small, because summer and winter changes mostly cancel out.
Local Drivers of Air-Sea CO2 Fluxes
On the south shore, despite larger variability in pCO2sw at the Ala Wai site, the overall area specific air-sea CO2 flux was close to zero at both Ala Wai and Kilo Nalu locations (Tables 2, 3). The CRIMP-2 site in Kaneohe Bay, on the other hand, has been a persistent, albeit variable, annual source of CO2 to the atmosphere (Figure 6). The additional years of data since the compilation of Drupp et al. (2013) also show that the flux from the ocean to the atmosphere at CRIMP-2 has increased since 2012.
Air-sea CO2 fluxes in coastal waters of O’ahu are consistent with the range previously published for coral reef environments around the world (Table 3). The flux at CRIMP-2 is close to the flux of 1.30 mol C cm−2 yr−1, observed at Hog Reef, Bermuda (Bates et al., 2001), a relatively wide and open water reef. It should be kept in mind that fluxes at CRIMP-2 may be even greater than we calculate here, because the current gas transfer velocity parameterization (k) in the flux calculation (Equation 3) does not account for any enhanced gas exchange due to turbulence over the shallow reef (Ho et al., 2016).
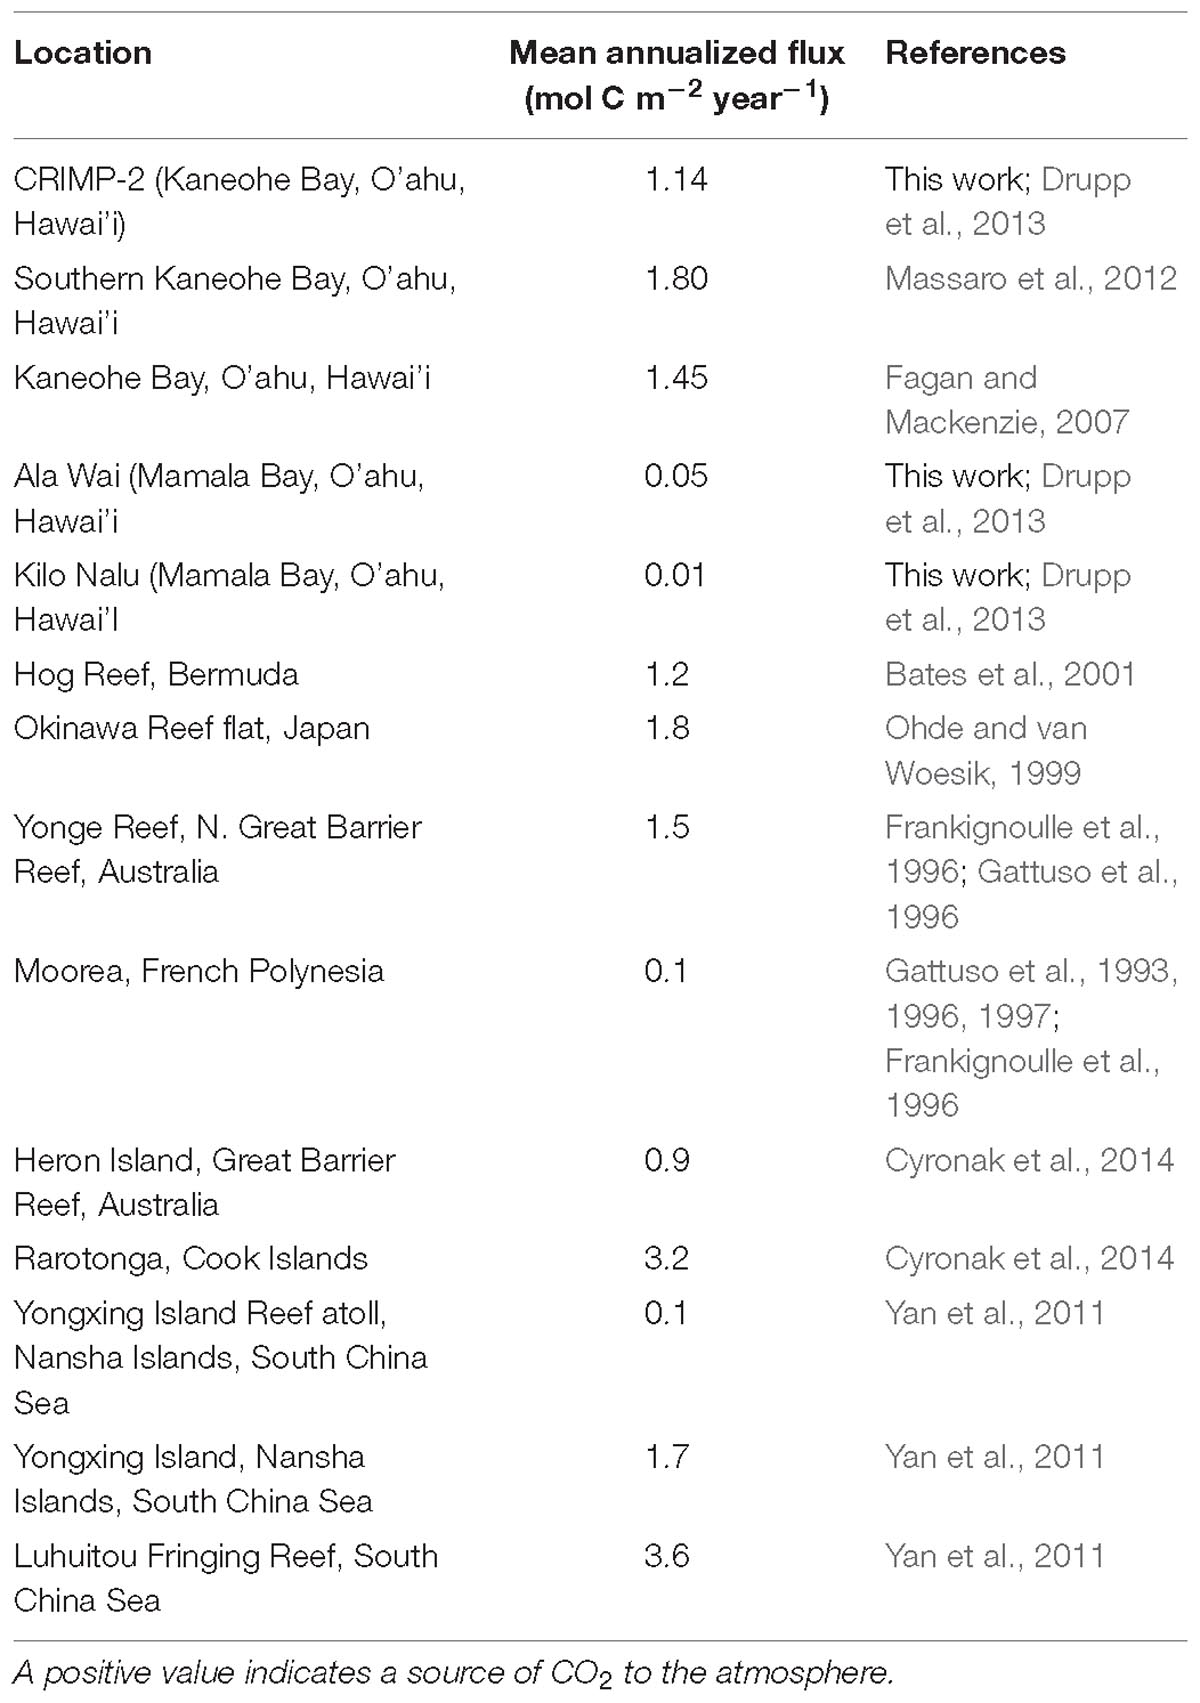
Table 3. Area specific air-sea CO2 fluxes in units of mol C m−2 yr−1 in tropical and subtropical coral reef environments.
Monthly Air-Sea CO2 Flux Climatology
The climatological differences in air-sea CO2 fluxes (Figure 6) are determined by both the variabilities in ΔpCO2 and in wind speed. A clear seasonal cycle is visible at all sites, with more positive fluxes during the summer (outgassing), and smaller or negative fluxes (ingassing) during the winter. This seasonal cycle in air-sea CO2 fluxes is largely driven by the seasonal pCO2sw cycle that determines the ΔpCO2 values. At CRIMP-2, the monthly mean CO2 flux is positive throughout the year and more than an order of magnitude greater than that at the South Shore buoys. There are also clear seasonal differences. The variability in fluxes is greatest in the summer, when the highest pCO2sw is observed and trade winds are strong and nearly consistent. During the winter, especially in December and January, wind speed is generally lower and less consistent, and these months are characterized by smaller and less variable fluxes. At Ala Wai and Kilo Nalu, the monthly mean CO2 fluxes are negative during the winter, and positive during the summer. The greatest variability also coincides with the months characterized by the largest fluxes. The largest positive fluxes are observed in the summer, between August and October, during periods of maximum SST and wind speed. The most negative fluxes, as well as the largest variability in winter months, are observed in February (Kilo Nalu) and March (Ala Wai). This is when strong rains and increased runoff, as well as occasional strong onshore winds, are the most frequent. The presence of riverine input from the Ala Wai Canal results in clear climatological differences in pCO2sw at the Ala Wai buoy relative to Kilo Nalu, but this difference is not as evident in the air-sea CO2 fluxes. The CO2 flux at WHOTS is negative in winter and positive in summer, and the greatest flux variability at this site is also observed when the flux is the strongest, around March, similar to what is observed at the South Shore sites (Ala Wai and Kilo Nalu).
Inter-annual Changes in pCO2sw
Although the multi-year record obtained at the O’ahu MAPCO2 buoy network is too short to identify reliably long-term global climate change signals such as OA (Sutton et al., 2019), especially considering the low signal-to-noise ratio in highly variable coastal environments such as the coral reefs around O’ahu, it does allow one to make year to year comparisons and begin to identify inter-annual changes. On an inter-annual timescale, pCO2sw could be affected by climate change, or by climate oscillations such as the El Niño-Southern Oscillation (ENSO). These oscillations drive changes in ocean-atmosphere circulation patterns, as well as SST. They can affect biological productivity and calcification, and therefore should also affect pCO2sw (e.g. Alexander et al., 2002).
Seawater at both our coastal buoys (Ala Wai, Kilo Nalu, and CRIMP-2), and the open ocean WHOTS site, experienced rising maxima in weekly mean seawater temperatures between 2013 and 2015 (Figure 3C). Additionally, all sites display increasing pCO2sw over our time series, which is, however, not statistically significant (7.5 ± 1.9, 8.3 ± 1.0, 2.5 ± 0.7, 2.9 ± 0.6 ppm yr−1 at CRIMP-2, Ala Wai, and Kilo Nalu, and WHOTS respectively; Figures 3A, 8). The increase at Ala Wai is greatest, but this is largely due to the limited dataset, with the anomalously high pCO2sw in the winter of 2013/2014, as discussed above, driving the (apparent) large annual increase. Raw data from more recent deployments at Ala Wai show that in situ and weekly mean pCO2sw have since decreased to approximately their previous magnitude (data not shown). This discussion will therefore focus on the CRIMP-2 site, which experienced a very large sustained increase in pCO2sw between 2013 and 2015, and a dramatic increase in the seasonal amplitude of pCO2sw in 2014/2015 to twice the amount observed in 2011 (Figure 3).
Due to the extreme variability in pCO2sw on all temporal scales, it is difficult to isolate possible effects of longer-term signals. To disentangle contributions of different timescales of pCO2sw variability at CRIMP-2, magnitudes of sub-monthly, sub-annual and sub-decadal variability were determined (Table 4). The amplitude of sub-monthly variations, which include diurnal changes from P/R and calcification/dissolution, and fluctuations associated with the effects of mixed tides on time scales of a few hours to 28 days, is the largest (78 μatm). Sub-annual and sub-decadal variability are 34 and 31 μatm, respectively. The main signal on the sub-annual time scale is the seasonal cycle. Consequently, the difference in pCO2sw between the first 4-year period and the second 4-year period of the CRIMP-2 time series has approximately the same magnitude as its average seasonal cycle.
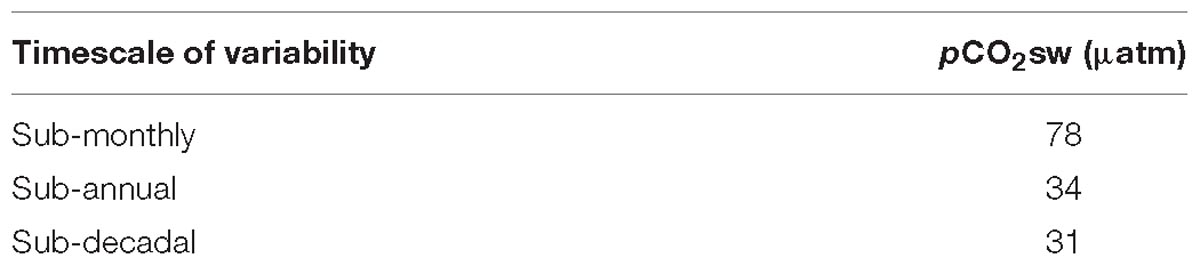
Table 4. Amplitude of pCO2sw variability at CRIMP-2 on different time scales, defined as the average standard deviation of monthly, annual and 4-year mean pCO2sw.
To investigate the potential contribution of climatic oscillations to these sub-decadal variations, annual mean pCO2sw was plotted (Figure 8) with annual mean values of three predominant climate oscillation indices in the North Pacific; the El Niño Southern Oscillation (Oceanic Niño Index, ONI), Pacific Decadal Oscillation (PDO index), and the North Pacific Gyre Oscillation (NPGO index). Correlations between annual mean pCO2sw and ENSO, PDO and NPGO were R = 0.40, R = 0.69, R = −0.81, respectively (p < 0.01), suggesting some control of pCO2sw from large-scale climate oscillations.
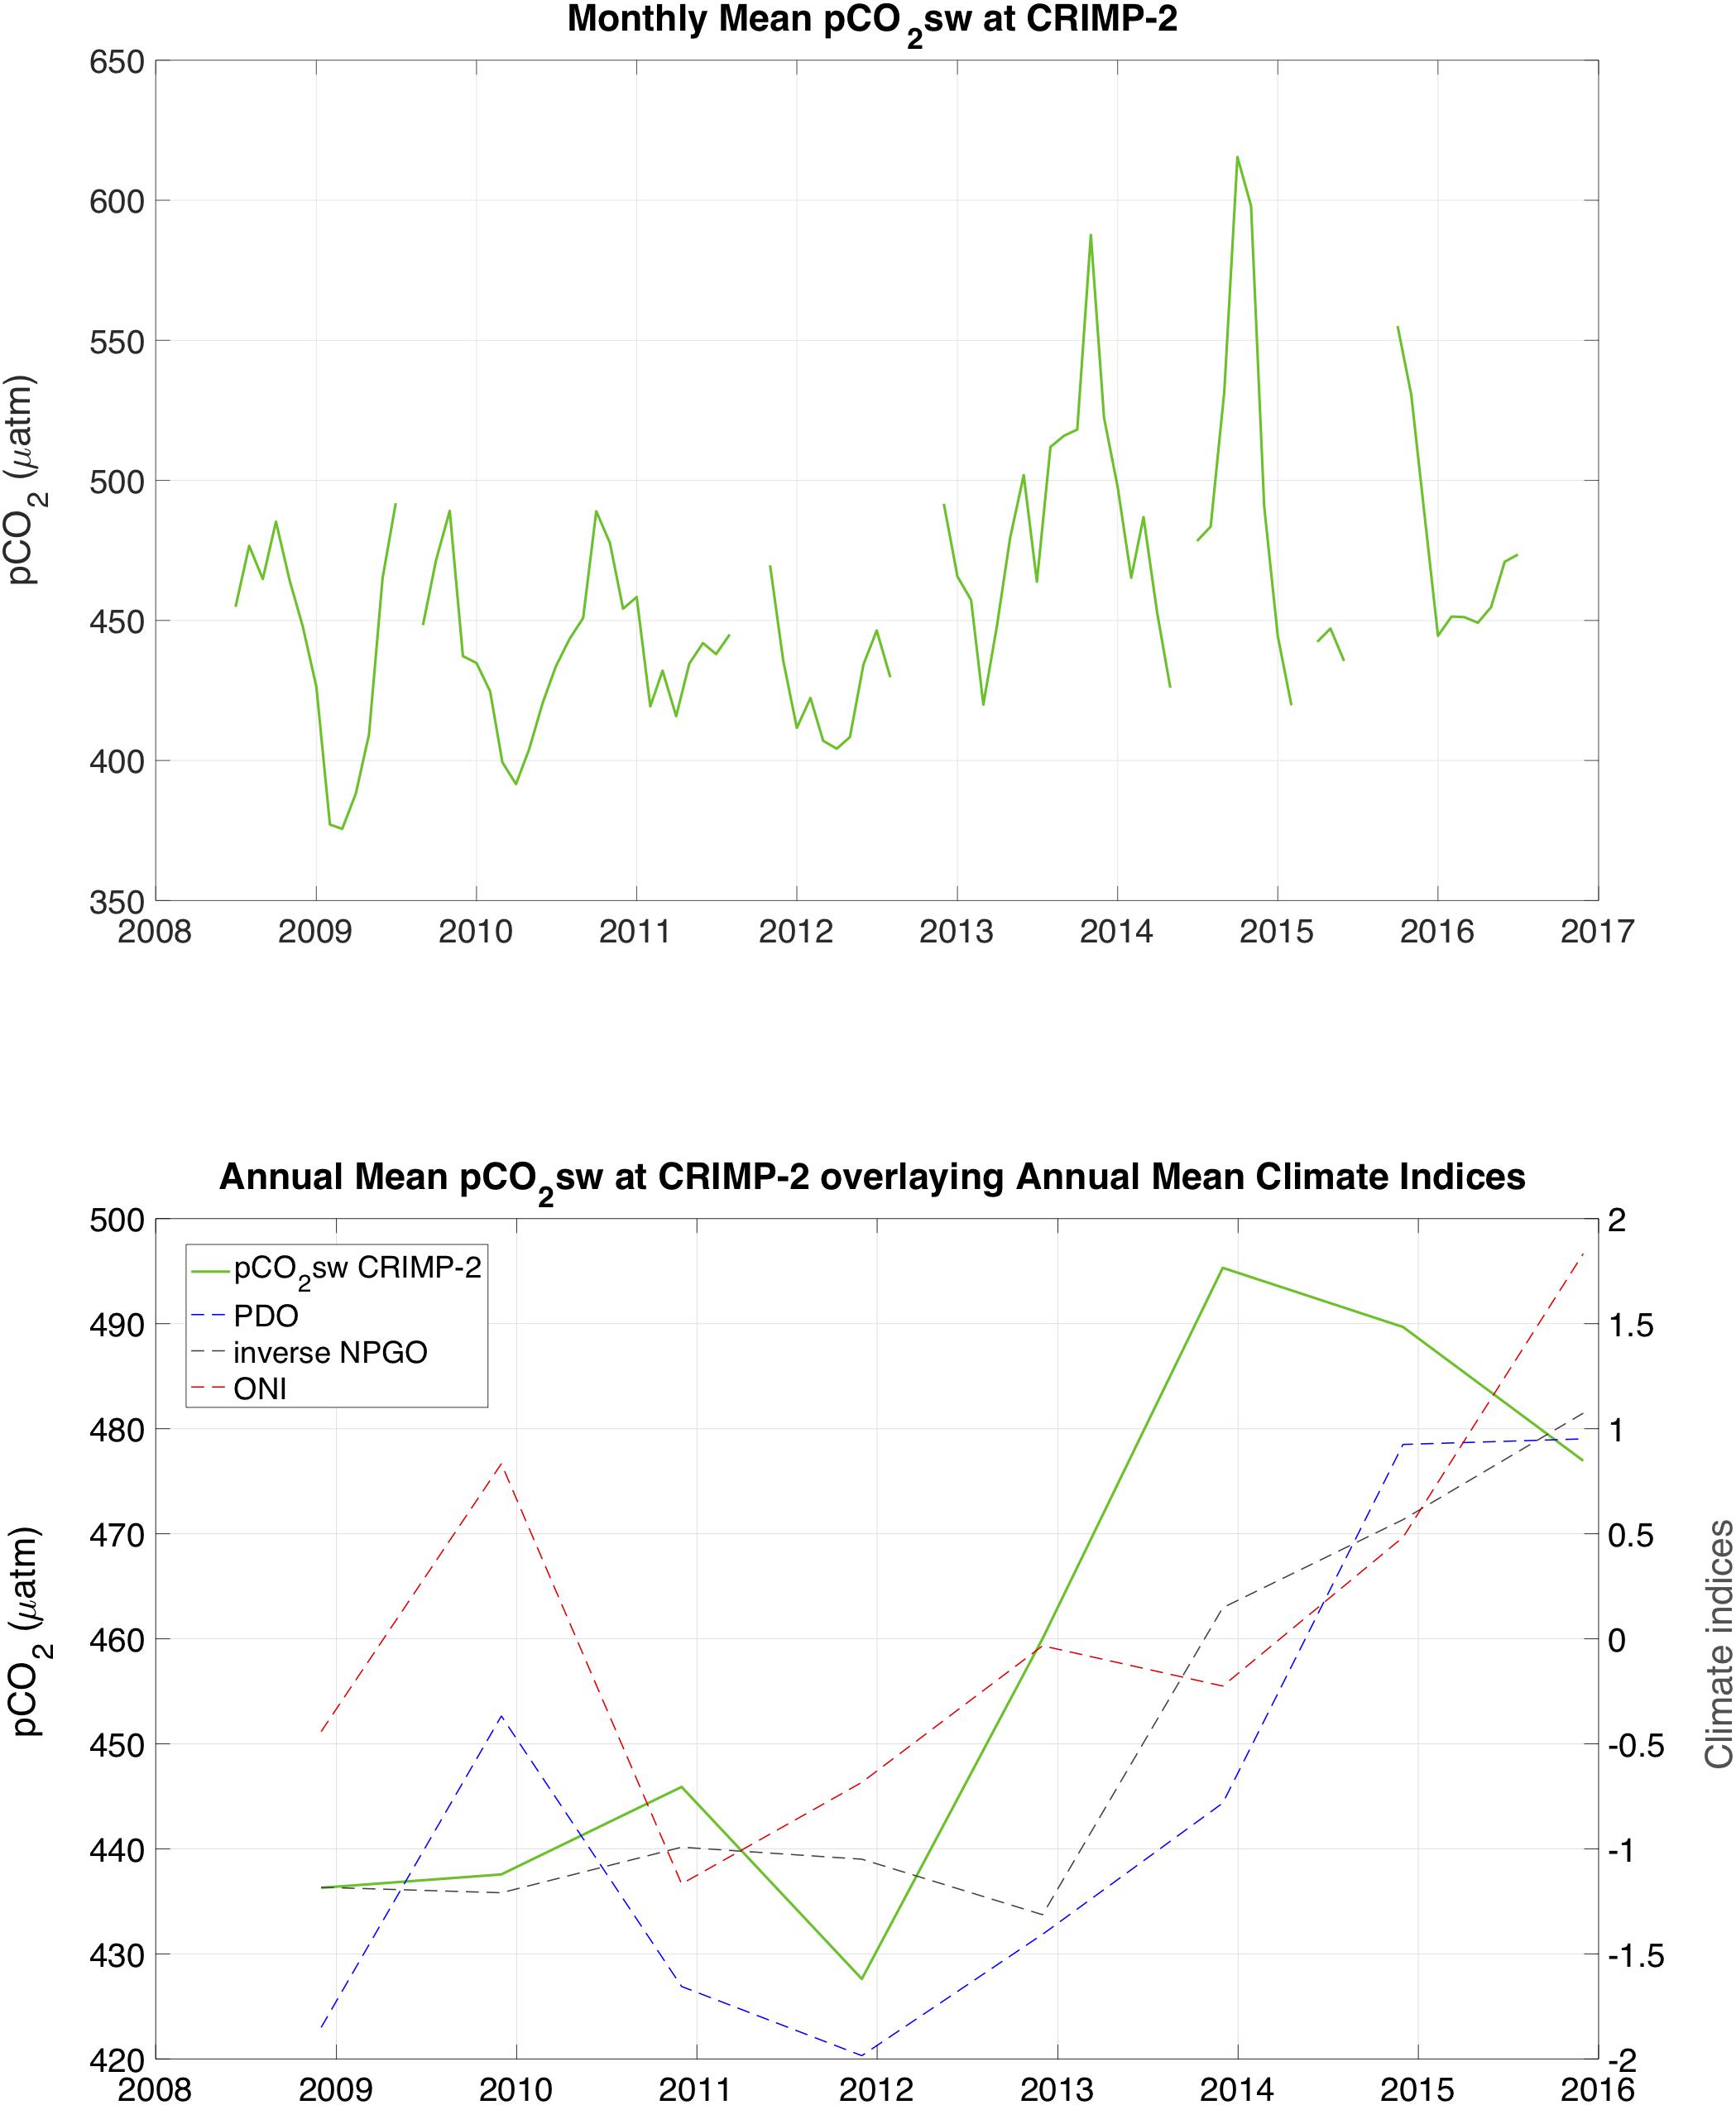
Figure 8. Time-series of Monthly Mean (top) and Annual mean (bottom) pCO2sw at CRIMP-2 from June 2008 through June 2016. Annual means of pCO2sw calculated from June of 1 year to May of the next. The dashed curves in the bottom panel show annual mean values of the Pacific Decadal Oscillation index (PDO, blue), Oceanic Nino Index (ONI, red), and the inverse of the North Pacific Gyre Oscillation index (NPGO, gray).
Changes in physical forcings such as climate oscillations can have an effect on the CO2 chemistry of seawater on reefs, as has been observed in the open ocean and on coral reefs of Bermuda (Yeakel et al., 2015). A portion of the increase in pCO2sw at CRIMP-2 is also likely due to rising atmospheric CO2 concentrations from anthropogenic carbon emissions, and penetration of this CO2 into the surface ocean via air-sea gas exchange, as well as reduced outgassing during natural outgassing periods due to a smaller air-sea gradient. An additional fraction of the sub-decadal pCO2sw variability can likely be explained by the direct temperature effect on CO2 solubility, which leads to higher (lower) pCO2sw at higher (lower) temperatures.
Temperature change and associated pCO2sw change may be driven partly by large scale inter-annual processes such as the ENSO. El Niño events are characterized by larger seasonal amplitudes in SST, while La Niña events have smaller amplitudes. The temperature effect on CO2 solubility translates this pattern from SST to pCO2sw. The period from 2009 to 2010 was classified as a moderate El Niño event8, and displays large SST swings, with a lower winter minimum and a higher summer maximum than subsequent years. The periods 2010–2011 and 2011–2012 were identified as moderate and weak La Niña events, respectively, and were characterized by relatively high winter and low summer SST, leading to smaller seasonal fluctuations in SST. The very strong El Niño in winter 2015 to 2016 shows the largest seasonal amplitude, as well as the highest SST of our dataset.
An additional factor in explaining rising SST between 2013 and 2016 is the North Pacific warm pool, a positive basin-wide SST anomaly beginning in the winter of 2013–2014 (Peterson et al., 2015). Sutton et al. (2017) also proposed that elevated seawater pCO2sw at the WHOTS buoy during the period 2013–2015 may have been driven by North Pacific warm anomalies, consistent with our observations at CRIMP-2 over a similar time period. Models and observations indicate that the amplitude of diurnal to seasonal pCO2sw variability in the oceans will likely increase with increasing anthropogenic CO2 uptake (McNeil and Sasse, 2016; Kwiatkowski and Orr, 2018; Landschützer et al., 2018). This factor could lead to increasing prevalence of conditions similar to the higher and more variable pCO2sw regime of 2013–2016 at CRIMP-2.
El Niño events are also associated with lower trade wind speeds (Collins et al., 2010, and references therein). Weakening of the trade winds increases the residence time of water on the Kaneohe Bay reef flat (e.g., Lowe et al., 2009b) and also reduces air-sea gas exchange rates (e.g., Wanninkhof, 1992;Ho et al., 2006, 2019). Thus, both increased residence time and decreased air-sea gas exchange lead to a stronger buildup of biogeochemical signatures of primary productivity and dissolution (drawdown of pCO2sw) and respiration and calcification (increase in pCO2sw), respectively. Weaker trade winds are therefore likely partially responsible for the greater amplitude of fluctuations in pCO2sw at CRIMP-2 during El Niño years.
Changes in biogeochemical processes on the reef that could cause an increase in pCO2sw at CRIMP-2 between 2013 and 2016 include: (1) an increase in net ecosystem calcification (NEC) (e.g., Drupp et al., 2013; Courtney et al., 2017) and (2) an increase in respiration of organic matter relative to primary production (e.g., Drupp et al., 2011, 2013). An increase in NEC seems unlikely. The high SST during the summers of 2014 and 2015 caused widespread coral bleaching throughout the Hawaiian Islands, and led to lower calcification rates on the barrier reef of Kaneohe Bay. The reefs largely recovered by Courtney et al. (2017). An increase of respiration on the reef flat, however, is more likely responsible for the observed higher pCO2sw between 2012 and 2016. Rates of biogeochemical processes typically increase with increasing (seawater) temperature, but respiration is more sensitive to temperature changes than primary production (“Q10 effect,” e.g., Woodwell and Mackenzie, 1995; Ver et al., 1999). Higher SST consequently causes enhanced respiration relative to photosynthesis, which increases pCO2sw. The barrier reef ecosystem is perhaps shifting toward longer periods of heterotrophy as a result of elevated SST between 2013 and 2016. Photosynthesis/respiration cycles appear to be a more important driver of pCO2sw at CRIMP-2 than calcification/dissolution (see Page et al., 2018). Therefore, the relative increase in the ratio of respiration to photosynthesis likely outweighs the decrease in pCO2sw due to lower calcification, resulting in higher pCO2sw values during periods of temperature-induced coral bleaching. Kayanne et al. (2005) also measured an increase in pCO2sw in coral reefs with extensive bleaching, but observed a concomitant 50% decrease in diurnal variability associated with reduced metabolic performance. This does not apply to the bleaching period in Kaneohe Bay, where CRIMP-2 diurnal variability did not decrease.
The pCO2sw increase observed at CRIMP-2 was greater than those observed at MAPCO2 sites at coral reefs in different parts of the world (Figure 9 and online9). The records from La Parguera site, on the southwestern coast of Puerto Rico, and CRIMP-2 nearly overlap early (2009) in the time series: The maxima in summer are roughly 50 ppm higher at CRIMP-2, but the means and amplitudes are comparable. The similarity in the CRIMP-2 and La Parguera pCO2sw records disappears after the winter of 2011–2012, when pCO2sw at CRIMP-2 begins to rise considerably. Neither the Chuuk K1 site, a low latitude (7.5°N) reef in Micronesia, or the Crescent reef site in Bermuda showed a significant trend in pCO2sw, or a baseline shift similar to the CRIMP-2 observations. Upon normalization to the overall mean temperature (Figure 8) at each site over the respective time periods, pCO2sw at both moorings in tropical waters of the Pacific (CRIMP-2 and Chuuk K1) appears to rise toward the end of the time series, while pCO2sw at Tmean at La Parguera and Crescent reef do not exhibit the same feature.
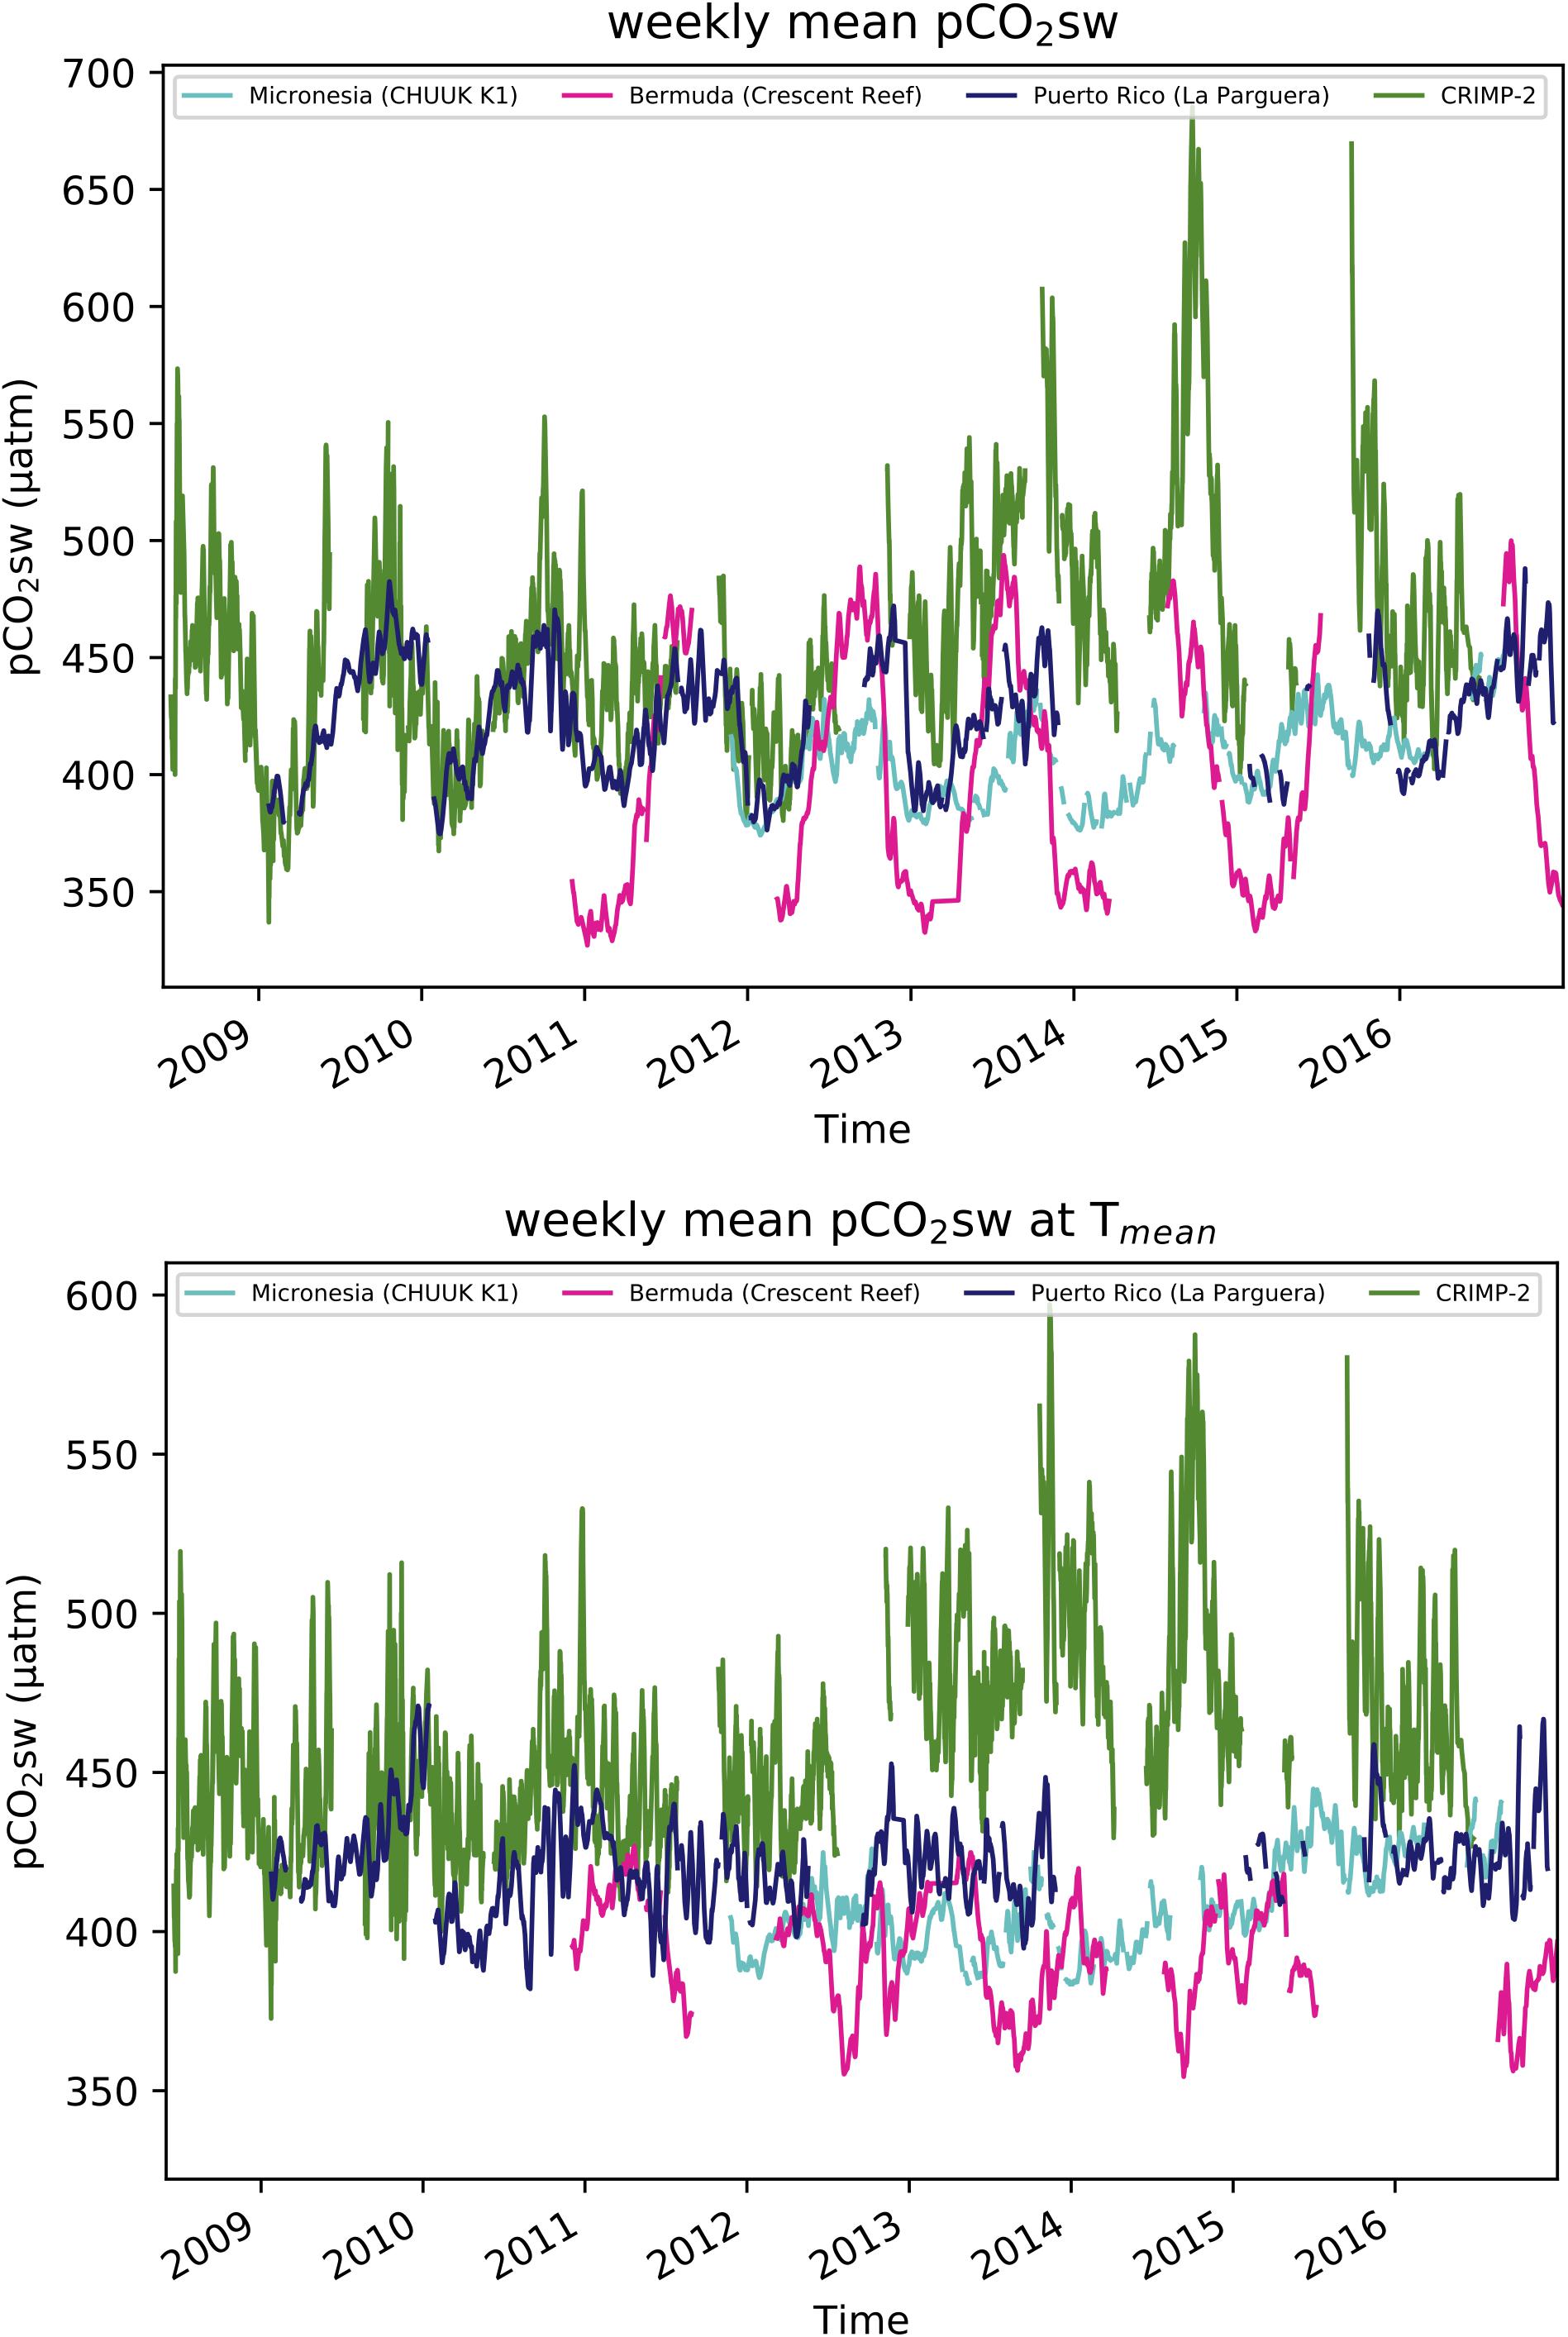
Figure 9. Time-series of weekly mean pCO2sw (Top) and temperature normalized pCO2sw (pCO2sw at Tmean, Bottom) at different reef sites for June 2008 through December 2016.
The observed similarity between both North Pacific reefs in temperature normalized pCO2sw may be attributed partially to the influence of basin wide changes in physical processes, such as SST and wind speed variations. The larger variability of pCO2sw at CRIMP-2 relative to other reefs around the world, however, is likely driven more by local changes in biogeochemistry on the Kaneohe Bay barrier reef, which are themselves influenced strongly by inter-annual changes in large scale ocean-atmosphere circulation patterns. The relative importance of these drivers can only be assessed with additional years of continuous monitoring that can resolve the time scales of inter-annual variability and long-term trends.
Conclusion
In this paper we presented a statistical evaluation and interpretation of nearly a decade of high-resolution CO2 time-series data collected between June 2008 and December 2016 at three different coral reef environments off the island of O’ahu, Hawai’i. Our major findings are:
• Land-ocean interactions, water column and benthic photosynthesis/respiration and calcification/dissolution, as well as physical forcing (wind, waves, and water residence time), all exert controls on pCO2sw and air-sea CO2 fluxes, which are therefore more variable on coral reefs than in the open ocean.
• Diurnal pCO2sw variability was, on average, 40 times greater on the Kaneohe Bay barrier reef than in waters of the North Pacific subtropical gyre, and comparatively less so (10 times) at the more exposed fringing reef sites of O’ahu, driven largely by daily cycles of photosynthesis and respiration. The temperature effect on CO2 solubility is the largest driver of seasonal pCO2sw variability, with additional impacts by biogeochemical processes that differ between reef locations.
• While seasonal variability determines the direction of air-sea CO2 fluxes in the open ocean, which are negative in winter (sink for atmospheric CO2) and positive in summer, large short-term changes occur in coastal coral reef systems. Instantaneous air-sea CO2 fluxes on O’ahu’s coral reefs are highly variable in magnitude and direction and, reflecting local dynamic conditions, often switch between being a source or a sink of CO2 on timescales of hours to days. Overall estimated area specific air-sea CO2 fluxes at CRIMP-2, Ala Wai and Kilo Nalu sites of 1.24, 0.05, 0.00 mol C m−2yr−1, respectively, are consistent with earlier work, indicating that the productive coral reefs of Hawai’i are generally a source of CO2 to the atmosphere.
• Instantaneous air-sea CO2 fluxes were most variable during the summer at CRIMP-2 due to higher SST enhancing biological productivity. At the south shore sites, on the other hand, the variability was greater in winter and spring, likely due to increased rainfall delivering nutrients to the coastal ocean.
• Relatively low peak pCO2sw at CRIMP-2 in the early parts of our time-series (2008 and 2010) coincided with La Niña periods, whereas higher peak pCO2sw later in our time series (2014–2016) coincided with El Niño.
• The observed inter-annual increase in pCO2sw at CRIMP-2 over the study period may reflect the influence of climate oscillations on local conditions: Firstly, increased seawater temperature both directly increases pCO2sw and may enhance rates of respiration, which also increase pCO2sw. Secondly, reduced trade wind speed increases the water residence time on the reef, allowing for more build-up of CO2 in seawater.
• Variability in pCO2sw at CRIMP-2 is greatest at timescales shorter than a month (78 μatm), while average seasonal and inter-annual variations are 34 and 31 μatm, respectively. Consequently, there is a large magnitude of short-term changes due to reef metabolism and physical drivers overlaying a smaller amplitude seasonal cycle, and comparable inter-annual changes on a time-scale of approximately 5 years. This shows that inter-annual changes in pCO2 are difficult to identify on a background of extremely large shorter-term variability at CRIMP-2.
Author Contributions
GT, PD, EDC, FM, and CS contributed to the conception and design of the study. GT and EDC wrote an earlier version of the manuscript. LK and GT re-wrote the manuscript, performed statistical analysis, and generated figures and tables. AS and AP contributed to datasets. YL provided valuable insights into interpretations of the data. All authors contributed to manuscript revisions, read and approved the submitted version.
Funding
We acknowledge with gratitude the financial support of our research provided in part by a grant/cooperative agreement from the National Oceanic and Atmospheric Administration, Project R/IR-27, which is sponsored by the University of Hawaii Sea Grant College Program, SOEST, under Institutional Grant No. NA14OAR4170071 from NOAA Office of Sea Grant, Department of Commerce. Additional support was granted by the NOAA/Ocean Acidification Program (to EDC and AS) and the NOAA/Climate Program Office (AP), and the NOAA Ocean Observing and Monitoring Division, Climate Program Office (FundRef number 100007298) through agreement NA14OAR4320158 of the NOAA Cooperative Institute for the North Atlantic Region (AP). The views expressed herein are those of the author(s) and do not necessarily reflect the views of NOAA or any of its subagencies. This is SOEST contribution number 10684, PMEL contribution number 4845, and Hawai’i Sea Grant contribution UNIHI-SEAGRANT-JC-15-30.
Conflict of Interest Statement
The authors declare that the research was conducted in the absence of any commercial or financial relationships that could be construed as a potential conflict of interest.
Acknowledgments
We are grateful to research groups working on NOAA MAPCO2 moorings globally who supplied data for comparison: the Korea Institute of Ocean Science and Technology (Chuuk K1), University of Puerto Rico (La Parguera), and the Bermuda Institute of Ocean Science (Crescent Reef). We would like to thank Ryan Tabata, Noah Howins, and Anthony Barro (at UH), as well as Sylvia Musielewicz, Stacy Maenner-Jones, and Randy Bott (at NOAA/PMEL) who provided technical support and their efforts are deeply appreciated as this research would not have been possible without their able assistance. This manuscript also benefited from reviews from several reviewers who helped improve the quality of this manuscript.
Footnotes
- ^ https://www.esrl.noaa.gov/gmd/ccgg/trends/
- ^ http://uop.whoi.edu/currentprojects/whots/whots.html
- ^ https://www.pmel.noaa.gov/co2/story/Coral+Reef+Moorings
- ^ https://www.nodc.noaa.gov/ocads/oceans/time_series_moorings.html
- ^ https://www.ncdc.noaa.gov/teleconnections/pdo/
- ^ http://origin.cpc.ncep.noaa.gov/products/analysis_monitoring/ensostuff/ONI_v5.php
- ^ http://www.o3d.org/npgo/npgo.php
- ^ http://ggweather.com/enso/oni.htm
- ^ http://www.pmel.noaa.gov/co2/story/Coral+Reef+Moorings
References
Alexander, M. A., Blade, I., Newman, M., Lanzante, J. R., Lau, N. C., and Scott, J. D. (2002). The atmospheric bridge: the influence of ENSO teleconnections on air–sea interaction over the global oceans. J. Clim. 15, 2205–2231. doi: 10.1175/1520-0442(2002)015\%3C2205\%3Atabtio\%3E2.0.co\%3B2
Andersson, A. J., and Gledhill, D. (2013). Ocean acidification and coral reefs: effects on breakdown, dissolution, and net ecosystem calcification. Annu. Rev. Mar. Sci. 5, 321–348. doi: 10.1146/annurev-marine-121211-172241
Bates, N. R., Astor, Y. M., Church, M. J., Currie, K., Dore, J. E., González-Dávila, M., et al. (2014). A time-series view of changing ocean chemistry due to ocean uptake of anthropogenic CO2 and ocean acidification. Oceanography 27, 126–141. doi: 10.5670/oceanog.2014.16
Bates, N. R., Samuels, L., and Merlivat, L. (2001). Biogeochemical and physical factors influencing seawater fCO2 and air-sea CO2 exchange on the Bermuda coral reef. Limnol. Oceanogr. 46, 833–846. doi: 10.4319/lo.2001.46.4.0833
Caldeira, K., and Wickett, M. E. (2003). Oceanography: anthropogenic carbon and ocean pH. Nature 425, 365–365. doi: 10.1038/425365a
Chamard, P., Thiery, F., Di Sarra, A., Ciattaglia, L., De Silverstri, L., Grigioni, P., et al. (2003). Interannual variability of atmospheric CO2 in the mediterranean: measurements at the island of lampedusa. Tellus 55, 83–93. doi: 10.1034/j.1600-0889.2003.00048.x
Chhak, K. C., and Di Lorenzo, E. (2009). Forcing of low-frequency ocean variability in the Northeast Pacific∗. J. Clim. 22, 1255–1276. doi: 10.1175/2008jcli2639.1
Collins, M., An, S. I., Cai, W., Ganachaud, A., Guilyardi, E., Jin, F. F., et al. (2010). The impact of global warming on the tropical Pacific Ocean and El Niño. Nat. Geosci. 3, 391–397.
Courtney, T., De Carlo, E. H., Page, H. N., Bahr, K. D., Barro, A., Howins, N., et al. (2017). Recovery of reef-scale calcification following a bleaching event in Kane‘ohe Bay, Hawai‘i. Limnol. Oceanogr. Lett. 3, 1–9. doi: 10.1002/lol2.10056
Cyronak, T., Santos, I. R., Erler, D. V., Maher, D. T., and Eyre, B. D. (2014). Drivers of pCO2 variability in two contrasting coral reef lagoons: the influence of submarine groundwater discharge. Global Biogeochem. Cycles 28, 398–414. doi: 10.1002/2013gb004598
De Carlo, E. H., Beltran, V. L., and Tomlinson, M. S. (2004). Composition of water and suspended sediment in streams of urbanized subtropical watersheds in Hawaii. Appl. Geochem. 19, 1011–1037. doi: 10.1016/j.apgeochem.2004.01.004
De Carlo, E. H., Hoover, D. J., Young, C. W., Hoover, R. S., and Mackenzie, F. T. (2007). Impact of storm runoff from tropical watersheds on coastal water quality and productivity. Appl. Geochem. 22, 1777–1797. doi: 10.1016/j.apgeochem.2007.03.034
Di Lorenzo, E., Schneider, N., Cobb, K. M., Franks, P. J. S., Chhak, K., Miller, A. J., et al. (2008). North pacific gyre oscillation links ocean climate and ecosystem change. Geophys. Res. Lett. 35:L08607. doi: 10.1111/gcb.13171
Dlugokencky, E., and Tans, P. (2018). Trends in Atmospheric Carbon Dioxide. NOAA/ESRL. Available at: http://www.esrl.noaa.gov/gmd/ccgg/trends/global.html (accessed April 17, 2019).
Dore, J. E., Lucas, R., Sadler, D. W., Church, M. J., and Karl, D. M. (2009). Physical and biogeochemical modulation of ocean acidification in the central North Pacific. PNAS 106, 12235–12240. doi: 10.1073/pnas.0906044106
Dore, J. E., Lukas, R., Sadler, D. W., and Karl, D. M. (2003). Climate-driven changes to theatmospheric CO2 sink in the subtropical North Pacific Ocean. Nature 424, 754–757. doi: 10.1038/nature01885
Drupp, P., De Carlo, E. H., Mackenzie, F. T., Bienfang, P., and Sabine, C. L. (2011). Nutrient inputs, phytoplanton response, and CO2 variations in a semi-enclosed subtropical embayment, Kaneohe Bay, Hawaii. Aquat. Geochem. 17, 473–498. doi: 10.1007/s10498-010-9115-y
Drupp, P. S., De Carlo, E. H., and Mackenzie, F. T. (2016). Porewater CO2-carbonic acid geochemistry in sandy sediments. Mar. Chem. 185, 48–64. doi: 10.1016/j.marchem.2016.04.004
Drupp, P. S., DeCarlo, E. H., Mackenzie, F. T., Sabine, C. L., Feely, R. A., and Shamberger, K. E. (2013). Comparison of CO2 dynamics and air-sea gas exchange in differing tropical reef environments. Aquat. Geochem. 19, 371–397. doi: 10.1007/s10498-013-9214-7
Eyre, B., Cyronak, T., Drupp, P., De Carlo, E. H., Sachs, J., and Andersson, A. J. (2018). Coral reefs will transition to net dissolving before end of century. Science 359, 908–911. doi: 10.1126/science.aao1118
Fagan, K. E., and Mackenzie, F. T. (2007). Air-sea CO2 exchange in a subtropical estuarine-coral reef system, Kaneohe Bay, Oahu, Hawaii. Mar. Chem. 106, 174–191. doi: 10.1016/j.marchem.2007.01.016
Feely, R. A., Sabine, C. L., Lee, K., Berelson, W., Kleypas, J., Fabry, V. J., et al. (2004). Impact of anthropogenic CO2 on the CaCO3 system in the oceans. Science 305, 362–366. doi: 10.1126/science.1097329
Frankignoulle, M., Gattuso, J. P., Biondo, R., Bourge, I., Copin-Montégut, G., and Pichon, M. (1996). Carbon fluxes in coral reefs. II. Eulerian study of inorganic carbon dynamics and measurement of air-sea CO2 exchanges. Mar. Ecol. Prog. Ser. 145, 123–132. doi: 10.3354/meps145123
Fogaren, K. E., Sansone, F. J., and De Carlo, E. H. (2013). Porewater temporal variability in a wave-impacted permeable nearshore sediment. Mar. Chem. 149, 74–84. doi: 10.1016/j.marchem.2012.12.005
Gagliano, M., McCormick, M. I., Moore, J. A., and Depczynski, M. (2010). The basics ofacidification: baseline variability of pH on Australian coral reefs. Mar. Biol. 157, 1849–1856. doi: 10.1007/s00227-010-1456-y
Gattuso, J.-P., Payri, C. E., Pichon, M., Delesalle, B., and Frankignoulle, M. (1997). Primary production, calcification, and air-sea CO2 fluxes of a macroalgal-dominated coral reef community in Moorea, French Polynesia. J. Phycol. 33, 729–738. doi: 10.1111/j.0022-3646.1997.00729.x
Gattuso, J. P., Pichon, M., Delesalle, B., Canon, C., and Frankignoulle, M. (1996). Carbon fluxes in coral reefs. I. Lagrangian measurement of community metabolism and resulting air-sea CO2 disequilibrium. Mar. Ecol. Prog. Ser. 145, 109–121. doi: 10.3354/meps145109
Gattuso, J.-P, Pichon, M., Delesalle, B., and Frankignoulle, M. (1993). Community metabolism and air-sea CO2 fluxes in a coral-reef ecosystem (Moorea, French-Polynesia). Mar. Ecol. Prog. Ser. 96, 259–267. doi: 10.3354/meps096259
Giambelluca, T. W., Chen, Q., Frazier, A. G., Price, J. P., Chen, Y.-L., Chu, P. S., et al. (2011). The Rainfall Atlas of Hawai’i.Available at: http://rainfall.geography.hawaii.edu (accessed April 17, 2019).
Giambelluca, T. W., Nullet, M. A., and Schroeder, T. A. (1986). Rainfall atlas of Hawaii. Hawaii, HI: Department of Land and Natural Resources.
Ho, D., De Carlo, E. H., and Schlosser, P. (2019). Air-sea gas exchange and CO2 fluxes in a tropical coral reef lagoon. J. Geophys. Res. Oceans 123, 8701–8713. doi: 10.1029/2018JC014423
Ho, D. T., Coffineau, N., Hickman, B., Chow, N., Koffman, T., and Schlosser, P. (2016). Influence of current velocity and wind speed on air-water gas exchange in a mangrove estuary. Geophys. Res. Lett. 43, 3813–3821. doi: 10.1002/2016gl068727
Ho, D. T., Law, C. S., Smith, M. J., Schlosser, P., Harvey, M., and Hill, P. (2006). Measurements of air-sea gas exchange at high wind speeds in the Southern Ocean: implications for global parameterization. Geophys. Res. Lett. 33:L16611 doi: 10.1029/2006GL026817
Hoegh-Guldberg, O., Mumby, P. J., Hooten, A. J., Steneck, R. S., Greenfield, P., Gomez, E., et al. (2007). Coral reefs under rapid climate change and ocean acidification. Science 318, 1737–1742.
Hofmann, G. E., Smith, J. E., Johnson, K. S., Send, U., Levin, L. A., Micheli, F., et al. (2011). High-frequency dynamics of ocean pH: a multi-ecosystem comparison. PLoS One 6:e28983. doi: 10.1371/journal.pone.0028983
Hoover, D. J., and Mackenzie, F. T. (2009). Fluvial fluxes of water, suspended particulate matter, and nutrients and potential impacts on tropical coastal water biogeochemistry: Oahu, Hawaii. Aquat. Geochem. 15, 547–570. doi: 10.1007/s10498-009-9067-2
Hoover, R. S., Hoover, D., Miller, M., Landry, M. R., DeCarlo, E. H., and Mackenzie, F. T. (2006). Zooplankton response to storm runoff in a tropical estuary: bottom-up and top-down controls. Mar. Ecol. Prog. Ser. 318, 187–201. doi: 10.3354/meps318187
Karl, D. M., and Church, M. J. (2018). Station ALOHA: a gathering place for discovery, education,and scientific collaboration. Limnol. Oceanogr. Bull. 28, 10–12. doi: 10.1002/lob.10285
Kayanne, H., Hata, H., Kudo, S., Yamano, H., Watanabe, A., Ikeda, Y., et al. (2005). Seasonal and bleaching-induced changes in coral reef metabolism and CO2 flux. Global Biogeochem. Cycles 19. doi: 10.1029/2004GB002400
Kayanne, H., Suzuki, A., and Saito, H. (1995). Diurnal changes in the partial pressure of carbon dioxide in coral reef water. Science 269, 214–216. doi: 10.1126/science.269.5221.214
Keeling, C. D., Bacastow, R. B., Bainbridge, A. E., Ekdahl, C. A., Guenther, P. R., and Waterman, L. S. (1976). Atmospheric carbon dioxide variations at Mauna Loa Observatory, Hawaii. Tellus 28, 538–551. doi: 10.3402/tellusa.v28i6.11322
Keeling, C. D., Piper, S. C., Bacastow, R. B., Wahlen, M., Whorf, T. P., Heimann, M., et al. (2001). Exchanges of Atmospheric CO2 and 13CO2 with the Terrestrial Biosphere and Oceans from 1978 to 2000. I. Global Aspects, SIO Reference Series, No. 01-06. San Diego, CA: Scripps Institution of Oceanography.
Kleypas, J. A., Buddemeier, R. W., Archer, D., Gattuso, J. P., Langdon, C., and Opdyke, B. N. (1999). Geochemical consequences of increased atmospheric carbon dioxide on coral reefs. Science 284, 118–120. doi: 10.1126/science.284.5411.118
Kleypas, J. A., and Langdon, C. (2006). “Coral Reefs and changing seawater carbonate chemistry,” in Coral Reefs and Climate Change: Science and Management, eds J. T. Phinney, O. Hoegh-Guldberg, J. Kleypas, W. Skirving, and A. Strong (Washington, DC: American Geophysical Union), doi: 10.1029/61CE06
Kwiatkowski, L., and Orr, J. C. (2018). Diverging seasonal extremes for ocean acidification during the twenty-first century. Nat. Clim. Change 8, 141–145. doi: 10.1038/s41558-017-0054-0
Landschützer, P., Gruber, N., Bakker, D. C. E., Stemmler, I., and Six, K. D. (2018). Strengthening seasonal marine CO2 variations due to increasing atmospheric CO2. Nat. Clim. Change 8, 146–150. doi: 10.1038/s41558-017-0057-x
Le Quéré, C. L., Andrew, R. M., Friedlingstein, P., Sitch, S., Pongratz, J., Manning, A. C., et al. (2018). Global Carbon Budget 2017. Earth Syst. Sci. Data 10, 405–448. doi: 10.5194/essd-10-405-2018
Liss, P. S. (1983). “Gas transfer: experiments and geochemical implications,” in Air–Sea Exchange of Gases and Particles, eds P. S. Liss and W. G. N. Slinn (Dordrecht: D. Reidel), 241–298. doi: 10.1007/978-94-009-7169-1_5
Lowe, R. J., Falter, J. L., Monismith, S. G., and Atkinson, M. J. (2009a). A numerical study of circulation in a coastal reef–lagoon system. J. Geophys. Res. Oceans 114:C06022.
Lowe, R. J., Falter, J. L., Monismith, S. G., and Atkinson, M. J. (2009b). Wave-driven circulation of a coastal reef–lagoon system. J. Phys. Oceanogr. 39, 873–889.
Mackenzie, F. T., and Andersson, A. J. (2013). The marine carbon system and ocean acidification during Phanerozoic time. Geochem. Perspect. 2, 1–3.
Massaro, R. F., De Carlo, E. H., Drupp, P. S., Mackenzie, F. T., Maenner Jones, S., Shamberger, K. E., et al. (2012). Multiple factors driving variability of CO2 exchange between the ocean and atmosphere in a tropical coral reef environment. Aquat. Geochem. 18, 357–386. doi: 10.1007/s10498-012-9170-7
McNeil, B. I., and Sasse, T. P. (2016). Future ocean hypercapnia driven by anthropogenic amplification of the natural CO2 cycle. Nature 529, 383–386. doi: 10.1038/nature16156
Nightingale, P. D., Liss, P. S., and Schlosser, P. (2000a). Measurements of air-sea gas transfer during an open ocean algal bloom. Geophys. Res. Lett. 27, 2117–2120. doi: 10.1029/2000gl011541
Nightingale, P. D., Malin, G., Law, C. S., Watson, A. J., Liss, P. S., Liddicoat, M. I., et al. (2000b). In situ evaluation of air-sea gas exchange parameterizations using novel conservative and volatile tracers. Glob. Biogeochem. Cycles 14, 373–387. doi: 10.1029/1999gb900091
Ohde, S., and van Woesik, R. (1999). Carbon dioxide flux and metabolic processes of a coral reef, Okinawa. Bull. Mar. Sci. 65, 559–576.
Page, H. N., Courtney, T. A., Collins, A., De Carlo, E. H., and Andersson, A. J. (2017). Net community metabolism and seawater carbonate chemistry scale non-intuitively with coral cover. Front. Mar. Sci. 4:161. doi: 10.3389/fmars.2017.00161
Page, H. N., Courtney, T. A., De Carlo, E. H., Howins, N., Koester, I., and Andersson, A. J. (2018). Spatio-temporal variability in seawater carbon chemistry for a coral reef flat in Kaneohe Bay, Hawaii. Limnol. Oceanogr. 9999, 1–22. doi: 10.1002/lno.11084
Peterson, E. W., and Hennessey, J. P. (1978). On the use of power laws for estimates of wind power potential. J. Appl. Meteorol. 17, 390–394. doi: 10.1175/1520-0450(1978)017\%3C0390\%3Aotuopl\%3E2.0.co\%3B2
Peterson, W., Robert, M., and Bond, N. (2015). The warm blob-conditions in the northeastern Pacific Ocean. North Pac. Mar. Sci. Organ. 23, 36–38.
Price, N. N., Martz, T. R., Brainard, R. E., and Smith, J. E. (2012). Diel variability in seawater pH relates to calcification and benthic community structure on coral reefs. PLoS One 7:e43843. doi: 10.1371/journal.pone.0043843
Ringuet, S., and Mackenzie, F. T. (2005). Controls on nutrient and phytoplankton dynamics during normal flow and storm runoff conditions, Southern Kaneohe Bay, Hawaii. Estuaries 28, 327–337. doi: 10.1007/bf02693916
Sabine, C. L., Feely, R. A., Gruber, N., Key, R. M., Lee, K., Bullister, J. L., et al. (2004). The oceanic sink for anthropogenic CO2. Science 305, 367–371. doi: 10.1126/science.1097403
Shamberger, K. E., Feely, R. A., Sabine, C. L., Atkinson, M. J., De Caro, E. H., Mackenzie, F. T., et al. (2011). Calcification and organic production on a Hawaiian coral reef. Mar. Chem. 127, 64–75. doi: 10.1016/j.marchem.2011.08.003
Shaw, E. C., and McNeill, B. I. (2014). Seasonal variability in carbonate chemistry and air–sea CO2 fluxes in the southern Great Barrier Reef. Mar. Chem. 158, 49–58. doi: 10.1016/j.marchem.2013.11.007
Shaw, E., Tilbrook, B., Steven, A., and Phinn, S. (2014). Carbonate Chemistry, Community Metabolism, PAR, Temperature and Salinity of One Tree Island Reef. Bremen: Pangaea.
Sutton, A. J., Feely, R. A., Maenner-Jones, S., Musielwicz, S., Osborne, J., Dietrich, C., et al. (2019). Autonomous seawater pCO2 and pH time series from 40 surface buoys and the emergence of anthropogenic trends. Earth Syst. Sci. Data 11, 421–439. doi: 10.5194/essd-11-421-2019
Sutton, A. J., Feely, R. A., Sabine, C. L., McPhadden, M. L., Takahashi, T., Chavez, F. P., et al. (2014a). Natural variability and anthropogenic change in equatorial Pacific surface ocean pCO2 and pH. Glob. Biogeochem. Cycles 28, 131–145. doi: 10.1002/2013GB004679
Sutton, A. J., Sabine, C. L., Feely, R. A., Cai, W. J., Cronin, M. F., McPhaden, M. J., et al. (2016). Using present-day observations to detect when anthropogenic change forces surface ocean carbonate chemistry outside preindustrial bounds. Biogeosciences 13, 5065–5083. doi: 10.5194/bg-13-5065-2016
Sutton, A. J., Sabine, C. L., Maenner-Jones, S., Lawrence-Slavas, N., Meinig, C., Feely, R. A., et al. (2014b). A high-frequency atmospheric and seawater pCO2 data set from 14 open-ocean sites using a moored autonomous system. Earth Syst. Sci. Data 6, 353–366. doi: 10.5194/essd-6-353-2014
Sutton, A. J., Wanninkhof, R., Sabine, C. L., Feely, R. A., Cronin, M. F., and Weller, R. A. (2017). Variability and trends in surface seawater pCO2 and CO2 flux in the Pacific Ocean. Geophys. Res. Lett. 44, 5627–5636. doi: 10.1002/2017GL073814
Takahashi, T., Olafsson, J., Goddard, J. G., Chipman, D. W., and Sutherland, S. C. (1993). Seasonal-variation of CO2 and nutrients in the high-latitude surface oceans—a comparative study. Glob. Biogeochem. Cycles 7, 843–878. doi: 10.1029/93gb02263
Takahashi, T., Sutherland, S. C., Sweeney, C., Poisson, A., Metzl, N., Tilbrook, B., et al. (2002). Global sea–air CO2 flux based on climatological surface ocean pCO2, and seasonal biological and temperature effects. Deep Sea Res. Part 2 Top. Stud. Oceanogr. 49, 1601–1622. doi: 10.1016/s0967-0645(02)00003-6
Tans, P. P., and Kieling, R. (2017). NOAA/ESRL. Available at: www.esrl.noaa.gov/gmd/ccgg/trends (accessed April 17, 2019).
Thoning, K. W., Tans, P. P., and Komhyr, W. D. (1989). Atmospheric carbon dioxide at mauna loa observatory 2. analysis of the NOAA GMCC data, 1974-1985. J. Geophys. Res. 94, 8549–8565. doi: 10.1029/jd094id06p08549
Tokoro, T., Hosokawa, S., Miyoshi, E., Tada, K., Watanabe, K., Montani, S., et al. (2014). Net uptake of atmospheric CO2 by coastal submerged aquatic vegetation. Glob. Change Biol. 20, 1873–1884. doi: 10.1111/gcb.12543
Tomlinson, M. S., De Carlo, E. H., McManus, M. A., Pawlak, G., and Steward, G. F. (2011). Characterizing the effects of two storms on the coastal waters of Oahu, Hawaii, using data from the Pacific Islands Ocean Observing System. Oceanography 24, 182–198.
Ver, L. M. B., Mackenzie, F. T., and Lerman, A. (1999). Biogeochemical responses of the carbon cycle to natural and human perturbation: past, present, and future. Am. J. Sci. 299, 762–801. doi: 10.2475/ajs.299.7-9.762
Wanninkhof, R. (1992). Relationship between wind speed and gas exchange over the ocean. J. Geophys. Res. 97, 7373–7382.
Weiss, R. F. (1974). Carbon dioxide in water and seawater: the solubility of a non-ideal gas. Mar. Chem. 2, 203–215. doi: 10.1016/0304-4203(74)90015-2
Weiss, R. F., and Price, B. A. (1980). Nitrous oxide solubility in water and seawater. Mar. Chem. 8, 347–359. doi: 10.1016/0304-4203(80)90024-9
Weller, R. A. (2018). “Observing Surface Meteorology and Air-Sea Fluxes,” in Observing the Oceans in Real Time, eds R. Venkatesan, A. Tandon, E. D’Asaro, and M. A. Atmanand (New York, NY: Springer Oceanography), 17–35. doi: 10.1007/978-3-319-66493-4_2
Woodwell, G. M., and Mackenzie, F. T. (1995). Biotic Feedbacks in the Global Climatic System: Will the Warming Feed the Warming? New York, NY: Oxford University Press.
Yan, H., Yu, K., Shi, Q., Tan, Y., Lui, G., Zhao, M., et al. (2016). Seasonal variations of seawater pCO2 and sea-air CO2 fluxes in a fringing coral reef, northern South China Sea. J. Geophys. Res. Oceans 121, 998–1008. doi: 10.1002/2015jc011484
Yan, H., Yu, K., Shi, Q., Tan, Y., Zhang, H., Zhao, M., et al. (2011). Coral reef ecosystems in the South China Sea as a source of atmospheric CO2 in summer. Chin. Sci. Bull. 56, 676–684. doi: 10.1007/s11434-011-4372-8
Keywords: time series, CO2, reef, coastal, ocean acidification, variability, fluxes
Citation: Terlouw GJ, Knor LACM, De Carlo EH, Drupp PS, Mackenzie FT, Li YH, Sutton AJ, Plueddemann AJ and Sabine CL (2019) Hawaii Coastal Seawater CO2 Network: A Statistical Evaluation of a Decade of Observations on Tropical Coral Reefs. Front. Mar. Sci. 6:226. doi: 10.3389/fmars.2019.00226
Received: 31 January 2019; Accepted: 11 April 2019;
Published: 07 May 2019.
Edited by:
Tyler Cyronak, University of California, San Diego, United StatesReviewed by:
Wiley Evans, Hakai Institute, CanadaLester Kwiatkowski, UMR8539 Laboratoire de Météorologie Dynamique (LMD), France
Copyright © 2019 Terlouw, Knor, De Carlo, Drupp, Mackenzie, Li, Sutton, Plueddemann and Sabine. This is an open-access article distributed under the terms of the Creative Commons Attribution License (CC BY). The use, distribution or reproduction in other forums is permitted, provided the original author(s) and the copyright owner(s) are credited and that the original publication in this journal is cited, in accordance with accepted academic practice. No use, distribution or reproduction is permitted which does not comply with these terms.
*Correspondence: Lucie A. C. M. Knor, luciek@hawaii.edu