Bioelectrochemical methanation by utilization of steel mill off-gas in a two-chamber microbial electrolysis cell
 Sabine Spiess1*
  Amaia Sasiain Conde1
  Jiri Kucera2 David Novak2 Sophie Thallner1 Nina Kieberger3
  Georg M. Guebitz4,5 Marianne Haberbauer1
- 1K1-MET GmbH, Linz, Austria
- 2Department of Biochemistry, Faculty of Science, Masaryk University, Brno, Czechia
- 3Voestalpine Stahl GmbH, Linz, Austria
- 4ACIB GmbH (Austrian Centre of Industrial Biotechnology), Graz, Austria
- 5Department of Agrobiotechnology, Institute of Environmental Biotechnology, University of Natural Resources and Life Sciences Vienna, Tulln an der Donau, Austria
Carbon capture and utilization has been proposed as one strategy to combat global warming. Microbial electrolysis cells (MECs) combine the biological conversion of carbon dioxide (CO2) with the formation of valuable products such as methane. This study was motivated by the surprising gap in current knowledge about the utilization of real exhaust gas as a CO2 source for methane production in a fully biocatalyzed MEC. Therefore, two steel mill off-gases differing in composition were tested in a two-chamber MEC, consisting of an organic substrate-oxidizing bioanode and a methane-producing biocathode, by applying a constant anode potential. The methane production rate in the MEC decreased immediately when steel mill off-gas was tested, which likely inhibited anaerobic methanogens in the presence of oxygen. However, methanogenesis was still ongoing even though at lower methane production rates than with pure CO2. Subsequently, pure CO2 was studied for methanation, and the cathodic biofilm successfully recovered from inhibition reaching a methane production rate of 10.8 L m−2d−1. Metagenomic analysis revealed Geobacter as the dominant genus forming the anodic organic substrate-oxidizing biofilms, whereas Methanobacterium was most abundant at the cathodic methane-producing biofilms.
Introduction
Global warming caused by anthropogenic greenhouse gas emissions is becoming a serious problem for the environment and all forms of life (Bajracharya et al., 2017). Carbon dioxide (CO2), as one of the main contributors of greenhouse gases, is mainly released by human activities such, as burning fossil fuels or deforestation (Pachauri and Meyer, 2014). These activities have increased the atmospheric CO2 concentrations annually since the industrial age, and half of the CO2 emissions between 1750 and 2011 have occurred in the last 40 years (Pachauri and Meyer, 2014). To combat global warming CO2 mitigation technologies, such as carbon capture and storage (CCS) and carbon capture and utilization (CCU), have been proposed as strategies (Bian et al., 2020). Therefore, biological CO2 conversion with microbial electrolysis cells (MECs) attracted great interest. Bioelectrochemical systems are based on the electroactivity of microorganisms attached to the electrode(s), which release electrons to the anode during substrate oxidation or receive electrons from the cathode during substrate reduction (Rabaey and Rozendal, 2010). MEC technology combines CO2 reduction with the production of versatile chemical compounds, such as methane (CH4), acetate, and ethanol, supported by a low energy input (Zhang and Angelidaki, 2014; Kadier et al., 2016). In particular, the production of CH4 attracts attention, because it is thermodynamically the most favorable product for CO2 reduction (Eq. 1) (Jiang et al., 2019).
Methanogenic archaea can use CO2, as a terminal electron acceptor, and hydrogen (H2), as an electron source, to produce CH4 as a metabolic product (Bajracharya et al., 2017). These microbes serve as biocatalysts for CO2 reduction in MECs, a process referred to as electromethanogenesis (Cheng et al., 2009). Electromethanogenesis can proceed via direct extracellular electron transfer or indirectly via (bio)electrochemically produced H2, formate or acetate (Van Eerten-Jansen et al., 2015). An oxidation reaction at the anode supplies electrons and protons for a reduction reaction. For instance, water oxidation can occur at the anode of a MEC. However, also an organic substrate-oxidizing bioanode can be coupled to a CH4-producing biocathode to reduce the external power supply (Villano et al., 2010) as shown in Figure 1. Recently, an increasing number of research groups have been focusing on this energy-efficient fully biocatalyzed MEC, investigating the effects of the anodic potential settings (Villano et al., 2016), testing the sequential polarization of the anodic and cathodic chambers (Zeppilli et al., 2019), as well as electrode modifications and their effect on performance parameters (Seelajaroen et al., 2020). Lately, microbial electrosynthesis from unpurified CO2 from brewery industry was tested for the first time within a bioelectrochemical reactor, consisting of a biotic cathode and an abiotic anode, producing acetate at a rate of 0.26 g L−1 d−1 (Roy et al., 2021). Also, real exhaust gas from a coal-fired power plant was used as a feedstock for lycopene production in a single bioelectrochemical reactor (Wu et al., 2022). On the other hand, to the best of our knowledge, exhaust gas has not been studied in a fully biocatalyzed CH4 producing MEC so far. Therefore, the present study aimed to explore the CH4 production by utilization of CO2 rich exhaust gas in a MEC, consisting of a bioanode and a biocathode, and to investigate how exhaust gas composition may influences the microbial activity. Two H-type MECs, referred to as MEC1 and MEC2, were setup. MEC1 was flushed with pure CO2, whereas in MEC2 the usage of exhaust gas was examined. Furthermore, prokaryotes on bioelectrodes of MEC2 were identified after exhaust gas flushing and were compared to MEC1, which was flushed with pure CO2, to discuss microbial community changes due to exhaust gas flushing. As steel production is one of the most energy-intensive processes, emitting 7% of the global CO2 emissions (Holappa, 2020), steel mill off-gas was selected as the exhaust gas. Two steel mill off-gases differing in composition were tested in MEC2 by applying a constant potential on the bioanode. Setting the anode potential at a fixed value offers some advantages as described recently (Villano et al., 2016). First, it leads to a faster start-up regarding organic substrate degradation as well as current generation. Second, fixing the anode potential regulates the biological activity and underlying electron transfer mechanisms of microorganisms (located on both electrodes). Furthermore, the cathode potential will get adjusted to sustain the current generating anode. Throughout all experiments process parameters, such as chemical oxygen demand (COD) removal and CH4 production, were monitored. Further, Coulombic efficiencies and energetic parameters were calculated. Also, the CH4 production rate was compared with other studies, which investigated two-chamber CH4 producing MECs.
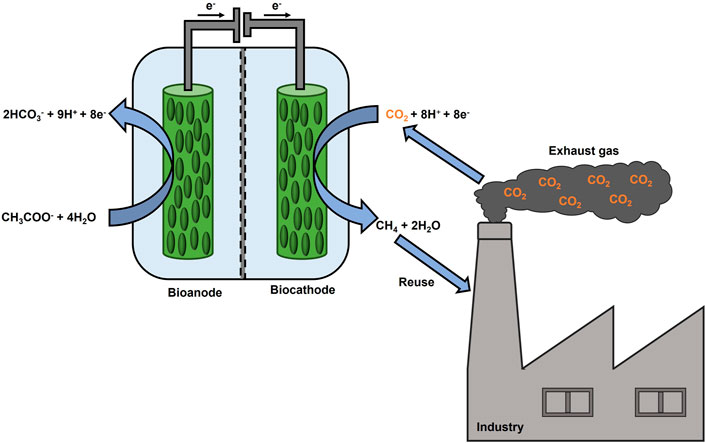
FIGURE 1. Scheme of a fully biocatalyzed electrochemical system to produce CH4 from CO2 rich exhaust gas.
Materials and methods
MEC setup
The experiments were performed in two-chamber H-cells with a working volume of 220 ml each, separated by a pretreated proton exchange membrane (Nafion 117, Chemours, Wilmington, DE, United States), as previously described (Spiess et al., 2021). Two MECs were set up and referred to as MEC1 and MEC2. Carbon felt (projected surface area 15 cm2, Alfa Aesar, Heysham, United Kingdom) was selected as an electrode material. Prior to use, the carbon felt electrodes were pretreated with isopropanol and hydrogen peroxide as described elsewhere (Spiess et al., 2021). Titanium wires (0.25 mm, Alfa Aesar, Heysham, United Kingdom) were used to enable the external electrical connection. Ag/AgCl reference electrodes were placed in both MEC chambers. All voltages reported in this study are with respect to Ag/AgCl reference electrode (3 M NaCl, +209 mV vs. standard hydrogen electrode). 200 ml phosphate buffer solution (PBS, pH 7.2) was used as an electrolyte for both chambers, consisting of the following components (per liter): 3 g KH2PO4, 2.5 g K2HPO4, 0.13 g NaCl, 0.31 g NH4Cl, 6 g NaHCO3, 0.04 g MgSO4.7H2O, 12.5 ml trace element solution SL 10 (DSMZ 320), and 5 ml vitamin solution (DSMZ 141). All MEC chambers were inoculated with 20 ml anaerobic digester sludge collected from a wastewater treatment plant. Prior to inoculation, solid contaminants were removed by centrifugation at 2,150 g for 10 min. All experiments were performed at room temperature, and the anolytes and catholytes were continuously mixed at 70 rpm using a magnetic stirrer IKA RCT basic (Staufen, Germany).
MEC operation
During the experiments, the anode chambers of MEC1 and MEC2 were supplied with acetate (1 g L−1) three times per week, whereas the cathode chambers were flushed with pure CO2 (99.995 vol%) or steel mill off gas (SMO). 100% of the anolyte and 90% of the catholyte were replaced with fresh PBS at each feeding. Before each feeding, liquid and gas samples were taken from anode and cathode chambers, respectively. MEC bioanodes were maintained under anaerobic conditions during all experiments by flushing with pure CO2 after each feeding. Experimental procedures are summarized in Table 1. During adaptation MECs were operated in duplicate by applying a constant potential of +400 mV vs. Ag/AgCl on the anode using a PM-100 potentiostat (Jaissle Elektronik GmbH, Münster, Germany), and the CH4 production using pure CO2 for flushing the biocathode was evaluated. In experiment 1 an exhaust gas was tested in MEC2 by purging the cathode at each feeding with SMO, whereas MEC1 was flushed with pure CO2 as a control. A total of six feeding cycles were repeated. The composition of the first steel mill off-gas (SMO-1) used was as follows: 73.4 vol% N2, 22 vol% CO2, and 4.6 vol% O2. Afterwards, the catholyte from MEC2 was flushed again with pure CO2 instead of exhaust gas for six feeding cycles. During adaptation and experiment 1 an anodic potential of +400 mV vs. Ag/AgCl was set, as a high potential probably leads to a faster start-up time and to a thicker biofilm formation as described elsewhere (Wagner et al., 2010). Finally, the biofilms were scraped from all MEC1 and MEC2 bioelectrodes, resuspended in Tris-EDTA buffer (pH 8.0), and frozen at −80°C. In experiment 2 the applied anode potential was reduced from +400 mV to +300 mV vs. Ag/AgCl in MEC1 and MEC2, and was tested for eight feeding cycles to investigate the effects of a reduced potential on CH4 production rates. The CH4 production by utilization of the second steel mill off-gas (SMO-2) was investigated in experiment 3 in MEC2 by applying a constant anode potential of +300 mV vs. Ag/AgCl for six feeding cycles. The composition of SMO-2 used was as follows: 74.2 vol% N2, 23.1 vol% CO2, and 2.7 vol% O2. MEC1 served as a control during this experiment and was purged with pure CO2. During the experiments the cathode potentials of MECs were monitored once per day with a Voltcraft VC880 multimeter (Hirschau, Germany).
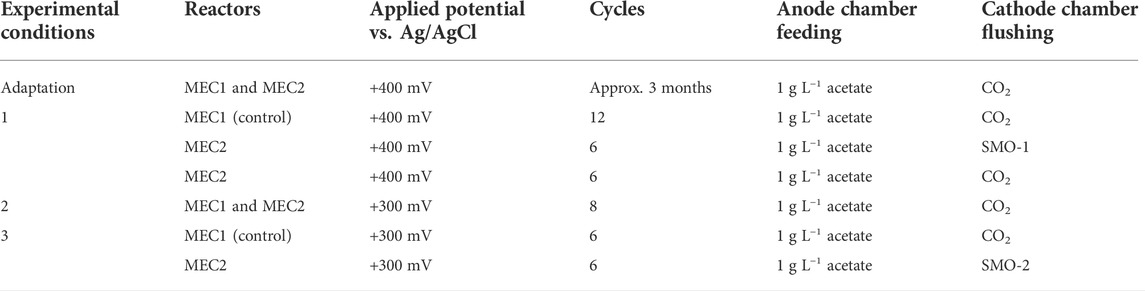
TABLE 1. Overview of the experimental conditions of MEC1 and MEC2.
Analytics and calculations
A COD test was used to estimate the content of organic compounds as previously described (Spiess et al., 2021). The COD removal efficiency was calculated according to Eq. 2 in which ∆COD represents the depleted COD, and CODIN is the COD of a provided substrate.
The CH4 production in MECs was analyzed by injecting a 2 ml sample from the cathode’s headspace into a 6890 GC system (Agilent Technologies, Santa Clara, CA, United States), equipped with a flame ionization detector and a series-connected helium ionization detector. The Coulombic efficiency (CE) was calculated according to Eq. 3, in which VCH4 represents the CH4 production in m³, eight electrons are required to reduce CO2 to CH4, F is the Faraday constant (96,485 C mol−1), Vm is the molar volume (0.0252 m³ mol−1), I represent the recorded current, and t means the time.
The energy consumptions for COD removal (kWh kg−1 COD) and CO2 removal (kWh Nm−³ CO2) were calculated for standard conditions as described elsewhere (Geppert et al., 2016; Zeppilli et al., 2019). The energy efficiency (ηE) was calculated according to Eq. 4, in which ΔGCH4 represents the Gibbs free energy of CH4 oxidation (890.4 kJ mol−1), while VCH4 is the CH4 production in m³, Vm (0.0252 m³ mol−1) is the molar volume, ECell is the cell voltage, I represent the recorded current, and t means the time.
Metagenomic analysis
Microbial DNA was isolated using the DNeasy UltraClean Microbial Kit (Qiagen, Germany), according to the manufacturer’s instructions. The hypervariable V4 region of 16S rRNA was selected to analyze prokaryotes, and the gene encoding the α-subunit of methyl coenzyme M reductase (mcrA) was used for the analysis of methanogenic archaea. The hypervariable region V4 was amplified with unique barcoded oligonucleotides 515F and 806R, as previously described (Spiess et al., 2021). The mcrA gene was amplified with gene-specific oligonucleotides qmcrA-F and mcrA-rev (Denman et al., 2007; Steinberg and Regan, 2008) containing Illumina adapter overhang nucleotide sequences (Supplementary Table S1). PCR amplification was performed using Platinum II Taq Hot-Start DNA polymerase (Thermo Fisher Scientific, United States), as follows: initial DNA denaturation step at 95°C for 3 min, 25 cycles of DNA denaturation at 94°C for 20 s, annealing at 60°C for 30 s with a 50% thermal ramp, extension at 72°C for 30 s, and a final extension step at 72°C for 5 min. The amplification products were purified using the UltraClean PCR Clean-Up Kit (Qiagen, Germany), according to the manufacturer’s instructions. Each purified PCR sample was tagged with sequencing adapters using the Nextera XT Indexes Kit (Illumina, United States) and KAPA HiFi HotStart Readymix PCR Kit (Kapa Biosystems, United States), according to the manufacturer’s specifications. The indexed products were purified by Agencourt® AMPure XP beads (Beckman Coulter, United States) according to Illumina recommendations with a final elution step of 25 μl to maintain a high concentration of amplicons. Samples were quantified using a Qubit 4.0 fluorometer (Thermo Fisher Scientific, United States), followed by manual normalization to the lowest observed concentration and pooling to create the final library. The Fragment Analyzer (Advanced Analytical Technologies, United States) was then used to determine the quality of the library. The library was sequenced using a MiniSeq System (Illumina, United States) with MiniSeq Mid Output Kit (300 cycles). Raw fastq reads were processed in R software (4.0.3) using the open-source package DADA2 (1.16.0), as previously described (Spiess et al., 2021). 16S rRNA gene sequences were analyzed using the Silva database (Quast et al., 2013), while a mcrA ARB database was used to analyze mcrA sequences (Angel et al., 2012). The summaries of all 16S and mcrA amplicon sequence variants (ASVs) are shown in Supplementary Tables S2, S3, respectively. Datasets generated and analyzed during this study are available in the NCBI Sequence Read Archive under project number BioProject ID: PRJNA782972.
Results and discussion
Methane production by utilization of SMO-1
First, the CH4 production using pure CO2 was investigated in MEC2, then the CH4 production with exhaust gas was evaluated. Thus, the cathode chamber of MEC2 was flushed with SMO-1 at each feeding, MEC1 served as a control during this experiment. Figure 2 illustrates the CH4 production per projected electrode surface area and day and the current density per projected electrode surface area of MEC2. Flushing MEC2 with pure CO2 resulted in a maximum CH4 production rate of 14.1 L m−2 d−1. However, after the first flushing of the MEC2 biocathode with SMO-1 the CH4 production dropped immediately to 3.6 L m−2 d−1. After the second flushing the CH4 production was further halved to 1.8 L m−2 d−1. The CH4 production significantly decreased after flushing with SMO-1 (p < 0.001; t-test) and subsequently stabilized at an average of 0.9 L m−2 d−1. The current density during this experiment was in a range of 6.7–8.0 A m−2. The cathode potential of MEC2 was on average -1,180 ± 54 mV during SMO-1 and -1,151 ± 66 mV during CO2 flushing. The significant reduction in CH4 production was most likely due to the elevated O2 concentration (4.6 vol%) in SMO-1, which most likely caused strong inhibition of anaerobic methanogens. In addition, GC analysis of the cathodic headspace samples revealed a threefold increase in the H2 concentration, but no further conversion to CH4. However, it is noticeable that methanogenesis was still ongoing in the presence of O2 from SMO-1 even though at lower CH4 production rates than before.
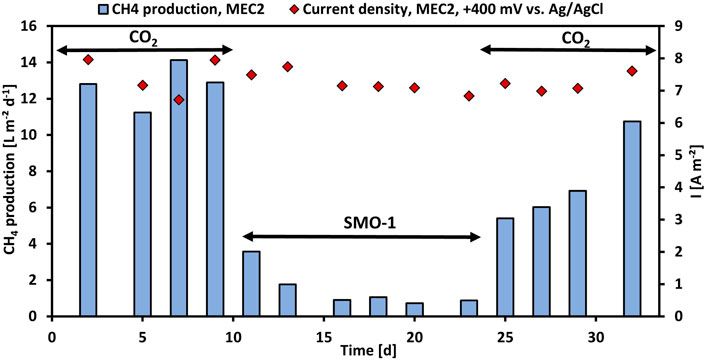
FIGURE 2. CH4 production per projected electrode surface area and day (blue bars) and current density per projected electrode surface area (red rhombuses) of MEC2 before and after flushing with SMO-1 vs. operation time.
After six cycles using SMO-1 the MEC2 biocathode was flushed again with pure CO2. A significant increase in CH4 production was observed again during CO2 re-flushing (p < 0.001; t-test). The CH4 production increased immediately to 5.4 L m−2 d−1 and continued to rise steadily up to 10.8 L m−2 d−1 at day 32 (Figure 2). In addition, CH4 production differed significantly during the first and second purging with pure CO2 (p < 0.01; t-test). However, the elevated recovery of CH4 production rate of the biocathode after the re-flushing with pure CO2 suggested a return to the initial values after day 32. Thus, the CH4-producing biofilm adhering to the MEC2 biocathode successfully recovered from O2 inhibition caused by flushing with SMO-1. Although methanogens are strict anaerobic, mixed methanogenic cultures may be able to tolerate a certain amount of O2 for a short time (Zitomer and Shrout, 2000). As MEC2 was inoculated with a mixed culture from sewage sludge and has been adapted for approximately 3 months before exhaust gas was flushed, a very robust biofilm may have developed on the cathode. Nevertheless, the biofilm got inhibited during SMO-1 flushing. However, probably due to the long adaptation and the mixed inoculum this concentration of O2 did not harm methanogens irreversible.
Table 2 compares the CH4 production of MEC2 from this study (when flushed with pure CO2 at +400 mV vs. Ag/AgCl) with other studies. The CH4 production rates were found to range widely from 0.017 to 0.678 mmoL L−1 h−1. On the other hand, the cathodic CE showed higher similarity among all studies, ranging from 55 to 74%. The MEC operating conditions differ in potentiostatic control of the anode or cathode. If the cathodic potential was controlled, the CH4 production rates ranged from 0.035 to 0.678 mmoL L−1 h−1, whereas controlling the anode showed lower production rates varying from 0.017 to 0.339 mmoL L−1 h−1. Thus, the result of this study (0.150 mmoL L−1 h−1) was within the range of other studies. If an organic substrate oxidizing-bioanode is coupled to a CH4-producing biocathode, electromethanogenesis seems to strongly depend on the amount of organic substrate provided, accompanied by COD removal efficiency and the produced current density. In our previous study, the COD of the supplied substrate was 600 mg L−1 (fed twice weekly), resulting in a CH4 production of 0.018 mmol L−1 h−1 (Spiess et al., 2021). Whereas, in this study, the bioanode was provided with 1,000 mg COD L−1 (three times weekly), resulting in an eightfold higher CH4 production rate (0.150 mmol L−1 h−1).
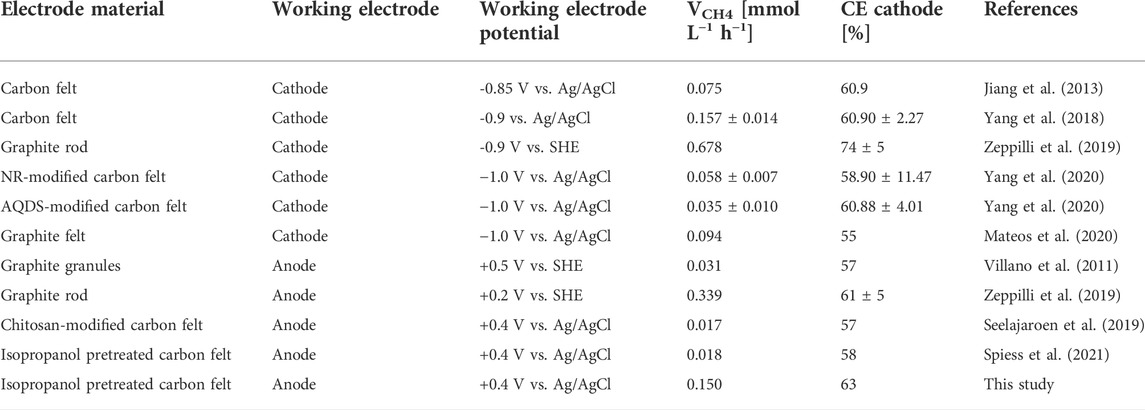
TABLE 2. Comparison of two-chamber CH4 producing MECs.
Effect of the applied anode potential
In experiment 2 the effect of the applied anode potential on the CH4 production when pure CO2 was flushed was investigated. Therefore, the anode potential of MEC1 was reduced from +400 mV to +300 mV vs. Ag/AgCl. Figure 3 illustrates the CH4 production and the cathode potential of MEC1 at +400 mV and +300 mV vs. Ag/AgCl, respectively. The CH4 production at +400 mV ranged between 7.5 L m−2 d−1 and 10.8 L m−2 d−1, and at +300 mV between 6.7 L m−2 d−1 and 9.9 L m−2 d−1, respectively. The difference in CH4 production by applying an anode potential of either +400 or +300 mV was insignificant (p > 0.05; t-test). The cathode potentials of MEC1 fluctuated at an applied potential of +400 mV from −883 mV to -1,198 mV, and at +300 mV from -1,066 mV to -1,192 mV vs. Ag/AgCl. The average cathodic potential was -1,101 ± 90 mV and -1,134 ± 45 mV at +400 mV and +300 mV vs. Ag/AgCl, respectively. Also, previous mentioned results from MEC2 (1,151 ± 66 mV during CO2 flushing) are in a similar range and suggest a stable cathode potential during the experiments.
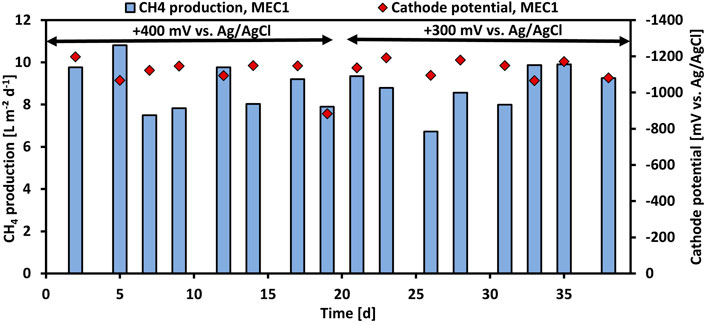
FIGURE 3. CH4 production per projected electrode surface area and day (blue bars) and monitored cathode potentials (red rhombuses) of MEC1 at an applied anode potential of +400 mV and +300 mV vs. Ag/AgCl during CO2 flushing vs. operation time.
The performance parameters of MEC1 at applied anode potentials of +400 and +300 mV vs. Ag/AgCl are summarized in Table 3. The average CH4 production remained nearly constant at 8.8 L m−2 d−1 despite the reduced potential. In contrast at an applied potential of +300 mV, a higher current density, and COD removal efficiency of 6.4 A m−2 and 53%, respectively, were observed. The cathodic CE dropped from 65% at +400 mV to 61% at +300 mV. As the CH4 production remained constant despite the reduced applied potential and the current density and COD removal efficiency increased, an applied anode potential of +300 mV vs. Ag/AgCl was used for all further experiments for both MECs. Furthermore, the CH4 production in the bioanode of MEC1 was nominal (<1% CH4 was detected in the anodic headspace). This may be related to the slightly acidic pH (approx. 6.2) of the anolyte, which was measured after each feeding cycle, because methanogens are known to be inhibited easily at pH values < 6.3 and >7.8 (Chae et al., 2010).
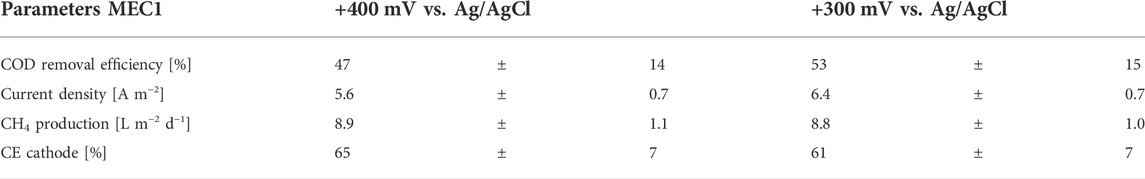
TABLE 3. Comparison of monitored parameters of MEC1—COD removal efficiency, current density, CH4 production and CE cathode.
Methane production by utilization of SMO-2
Furthermore, the methanation of SMO-2 was tested in MEC2 by applying an anode potential of +300 mV vs. Ag/AgCl. However, the O2 concentration in SMO-2 was only 2.7 vol% compared to 4.6 vol% in SMO-1. Figure 4 shows the cumulative CH4 production of the MEC2 biocathode when flushed with pure CO2, or SMO-1 and SMO-2 containing 4.6 vol% and 2.7 vol% O2, respectively. The cumulative CH4 production during pure CO2 flushing was significantly higher than during SMO-1 and SMO-2 flushing (p < 0.001; ANCOVA). In addition, a significant difference in CH4 production was observed between SMO-1 and SMO-2 (p < 0.001; ANCOVA). The highest cumulative CH4 production (843 ml L−1) was achieved when the biocathode was flushed with pure CO2 and the lowest (133 ml L−1) when purged with SMO-1 containing 4.6 vol% O2 (here an anode potential of +400 mV vs. Ag/AgCl was applied). During the experiment with SMO-2, containing 2.7 vol% O2, the cumulative CH4 production was nearly three times higher (382 ml L−1) than with SMO-1. The obtained results demonstrated that the O2 concentration in the exhaust gas strongly affected CH4 production in MEC2 due to the inhibition of anaerobic methanogens. As well-known methanogens are strictly anaerobic and very sensitive to even low levels of O2 (Garcia et al., 2000), hence higher CH4 production rates can be expected at lower O2 concentrations in exhaust gas streams. Moreover, it is also possible that during SMO flushing other products/intermediates such as acetate have been formed in the cathode chamber. There are several suggested pathways for bioelectrochemical CH4 production. Apart from CH4 production, via direct or indirect electron transfer, formation of other products could have occurred at the MEC cathode. For instance, H2 can be produced either electrochemically or bioelectrochemically and can be further used for the formation of CH4, acetate or formate. Moreover, CH4 can be also produced in a second step via bioelectrochemically produced acetate (Van Eerten-Jansen et al., 2015). However, during pure CO2 flushing no acetate formation was detected in the catholytes of MECs.
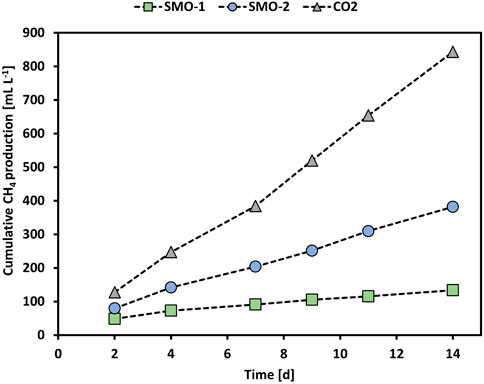
FIGURE 4. Cumulative CH4 production of MEC2 when flushed with pure CO2 (grey triangles), SMO-1 (green squares), and SMO-2 (blue circles).
Energetic evaluation
Table 4 summarizes the calculated energetic parameters for each experimental condition. The energy efficiency (ηE) was 48% and 49% for MEC1 at +400 mV and +300 mV vs. Ag/AgCl, respectively, and in both cases pure CO2 was used for methanation. These results are comparable with a previous study of a CH4 producing MEC for biogas upgrading at anodic potentiostatic control, where an energy efficiency of 52% was reported (Zeppilli et al., 2019). However, when exhaust gas was used for flushing MEC2 cathode, the energy efficiency dropped to 6% with SMO-1 and to 19% with SMO-2. This decrease may be related to the lower CH4 production rates of the biocathode due to the presence of inhibiting O2 concentrations in the exhaust gases. Furthermore, the energy consumptions for COD and CO2 removal were calculated. The energy consumptions for CO2 removal in MEC1 at +300 mV (20 kWh Nm−³) and +400 mV (20 kWh Nm−³) vs. Ag/AgCl were considerably higher compared to a previous reported one (4.27 kWh Nm−³) of a MEC for ammonium recovery and biogas upgrading at an applied anode potential of +200 mV vs. SHE (Zeppilli et al., 2021). If SMO-1 and SMO-2 were used for cathode flushing, the energy consumptions increased to 167 kWh Nm−³ and 52 kWh Nm−³, respectively, due to the inhibited transformation of CO2 into CH4. The energy input for CH4 formation with MEC1 (using pure CO2) was 20 kWh Nm−³, which is in line with a previous reported value of 19 kWh m−³ CH4 from Geppert et al. (Geppert et al., 2016). The higher energy consumption of the Sabatier process (26–35 kWh m−³ CH4), compared to the energy inputs obtained from the literature and confirmed by the performed experiments, profiles bioelectrochemical methanation as an attractive rival compared to Sabatier when pure CO2 is used (Geppert et al., 2016).
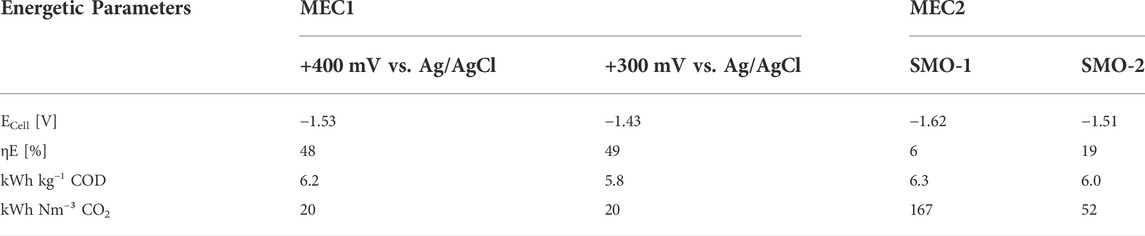
TABLE 4. Comparison of energetic parameters for all experimental conditions.
The results led to the conclusion that methanation of SMO is in principle feasible in a MEC. However, due to inhibition of methanogens, as a consequence of the high O2 concentrations, CH4 production as well as energy efficiency decreased significantly, whereas the energy consumption for CO2 removal increased considerably. Possibilities to separate CO2 or O2 from exhaust gases are e.g., adsorption or membrane separation (Dessì et al., 2021). In a next step the bioelectrochemically transformed CO2 from SMO could be used directly as a CH4 source in different industries, as for example the steel sector. For instance, this CH4 may be used as an alternative reducing agent in the blast furnace for the partial substitution of coke. This will cause a reduction of the CO2 emissions, due to the lower footprint of biological produced CH4 in comparison with coke (Remus et al., 2013). Furthermore, these observations may be interesting for other industry sectors, where exhaust gases with lower O2 concentrations are produced, which may allow its direct usage in the MEC without any previous separation step.
Analysis of microbial community on electrode biofilms
The 16S sequencing of the biofilms in MECs revealed a high proportion of bacteria adhering to anodes (95–100%) (Figure 5A), whereas archaea adhered predominantly to cathodes (89–91%) (Figure 6A). The distribution of bacteria was further divided into different taxonomic ranks based on the 16S sequencing (Figures 5B, 6C). Considering the significant proportion of archaea in CH4-producing cathodic biofilms, additional mcrA sequencing was performed to determine more accurately the distribution of methanogenic archaea into different taxonomic ranks (Figure 6B). For a comprehensive analysis, non-CH4-producing anodic biofilms were also analyzed using mcrA sequencing (Figure 5C).
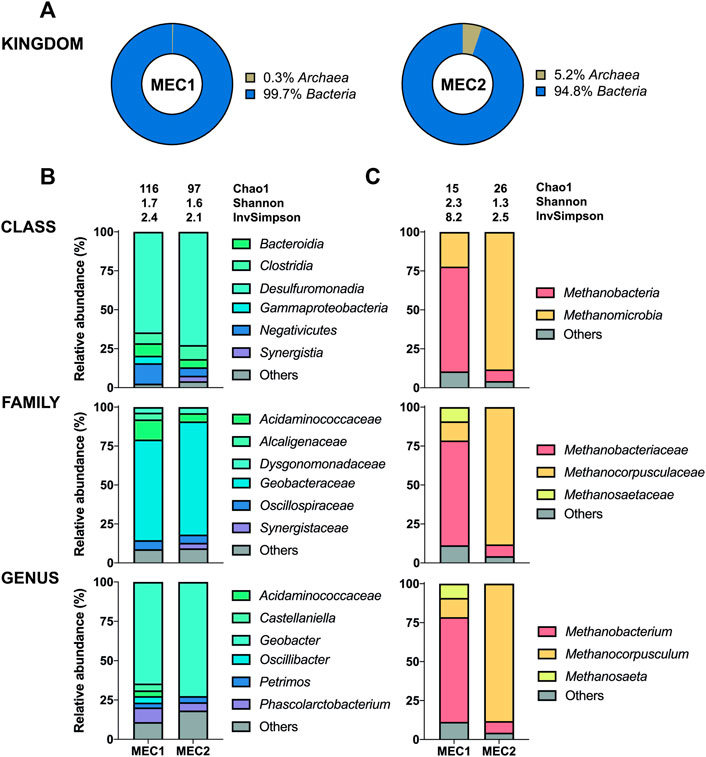
FIGURE 5. The enriched microbial communities of anodic biofilms in MECs. (A) Representation of prokaryotes determined by the 16S sequencing. Taxonomic profiles of bacteria (B) and methanogenic archaea (C) were set at the class, family, and genus ranks. Bacterial representation was determined by the 16S sequencing and methanogenic archaea by the mcrA sequencing. Only representatives with a relative abundance >3% in at least one condition are shown. Alpha diversity was estimated by the following indices: Chao1, Shannon, and Inverse Simpson. Detailed information is given in Supplementary Table S4.
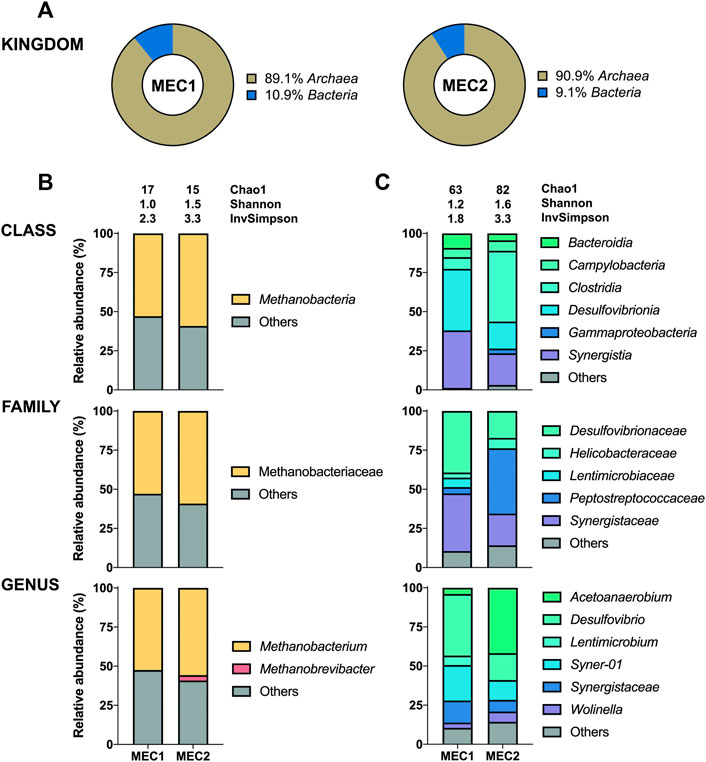
FIGURE 6. The enriched microbial communities of cathodic biofilm in MECs. (A) Representation of prokaryotes determined by the 16S sequencing. Taxonomic profiles of bacteria (C) and methanogenic archaea (B) were set at the class, family, and genus ranks. Bacterial representation was determined by the 16S sequencing and methanogenic archaea by the mcrA sequencing. Only representatives with a relative abundance >3% in at least one condition are shown. Alpha diversity was estimated by the following indices: Chao1, Shannon, and Inverse Simpson. Detailed information is given in Supplementary Table S4.
Geobacter was the predominant genus adhered to MEC1 (64.6%) and MEC2 (72.5%) bioanodes, one of the prominent representatives using electrodes as electron acceptors for anaerobic respiration (Bond and Lovley, 2003). This genus can produce electrons and transfer them through conductive pili to the anode, whereas many other exoelectrogens need direct contact with the electrode (Logan et al., 2019). In particular, Geobacter sulfurreducens is known to produce very high current densities (Yi et al., 2009). The second most abundant genus attached to both bioanodes was Phascolarctobacterium with 9.3% (MEC1) and 5.3% (MEC2). This genus has also been identified in microbial fuel cells of other studies (Borole et al., 2009; Liu et al., 2013). Interestingly, Oscillibacter (4.2%), Castellaniella (4.3%), and Acidaminococcaceae (3.6%) were only identified at MEC1 bioanode, resulting in a higher biodiversity compared to MEC2. Castellaniella has been previously detected in the anodic biofilm and may contribute to electricity generation (Sun et al., 2011). In addition, differences in archaea abundance were observed between MEC1 and MEC2 bioanodes with 0.3% (MEC1) and 5.2% (MEC2).
The anodic biofilm in MEC1 was predominated in terms of archaea by Methanobacterium (67.2%), whereas Methanocorpusculum (88.2%) was predominant in anodic MEC2 biofilm. Methanosaeta (9.2%), present only in MEC1, can convert acetate, the primary carbon source in the anodes of both MECs, to CH4 but cannot use H2 or formate as an electron source for methanation (Smith and Ingram-Smith, 2007). Moreover, Methanosaeta spp. and Geobacter spp. can synergize through electron exchange, referred to as direct interspecies electron transfer (Rotaru et al., 2014; Zhao et al., 2015; Lovley, 2017). Differences in the anodic archaea population of MEC1 and MEC2 may be attributed to O2 diffusion across the membrane, since the cathode of MEC2 was flushed with SMO-1 containing of 4.6 vol% O2. O2 diffusion mechanisms from the anode to the biocathode were previously mentioned as a causer for parasitic reactions such as direct O2 reduction, leading to an increased current production but lower Coulombic efficiencies (Van Eerten-Jansen et al., 2012; Batlle-Vilanova et al., 2017). Therefore, O2, introduced by flushing the cathode chamber of MEC2 with SMO-1, may have diffused the opposite direction from the cathode to the anode, and has probably caused a shift in the archaea population of MEC2 if compared to MEC1.
Methanobacterium was found to be the dominant archaeon in CH4-producing cathodic biofilms (52.5% in MEC1 and 55.8% in MEC2). Methanobacterium is a typical member of biofilms attached to cathodes which can perform methanogenesis by direct electron uptake (Siegert et al., 2015). One of the prominent species performing electromethanogenesis is Methanobacterium palustre (Cheng et al., 2009). Genus Methanobrevibacter (3.4%) was only identified in the MEC2 biofilm. In a previous study this obligate anaerobic archaea mainly dominated cathodes with catalysts, such as platinum, supporting abiotic H2 production (Siegert et al., 2015). Methanobrevibacter is a strictly hydrogenotrophic archaeon that uses only H2 and CO2 to produce CH4, whereas Methanobacterium can also ferment acetate, ethanol and methanol (Cai et al., 2022). The use of SMO-1, to flush the biocathode of MEC2, probably affected the biofilm composition leading to a higher archaea diversity in MEC2. Furthermore, a high proportion of other uncharacterized species (41–48%) was observed in both biocathodes. Also, the presence of Methanobrevibacter in MEC2 may have been influenced by flushing with SMO-1 as the H2 concentration in the cathodic headspace have increased by three times during this experiment, which may have enhanced the growth of hydrogenotrophic Methanobrevibacter.
The most abundant bacteria were Desulfovibrio (39.3%) at MEC1 and Acetoanaerobium (41.8%) at MEC2 biocathodes. The anaerobic genus Acetoanaerobium produces acetate by metabolizing H2 and CO2 (Sleat et al., 1985), whereas Desulfovibrio spp. are well known for producing H2 when attached to an electrode surface (Jafary et al., 2015). In a previous study (Zheng et al., 2021) interspecies electron transfer between Methanobacterium and Desulfovibrio was studied, suggesting that Methanobacterium spp. can actively accept electrons from electron donating Desulfovibrio spp. . If strictly anaerobic Methanobacterium got inhibited due to cathodic SMO-1 flushing of MEC2, this may have influenced the syntrophic co-culture of Methanobacterium and Desulfovibrio, and possibly led to a shift in the bacterial community composition and suppressed genus Desulfovibrio, as observed when bacterial communities of MEC1 and MEC2 cathodes are compared, in which Desulfovibrio and Acetoanaerobium have predominated, respectively. In addition, the genera Syner-01, Synergistaceae, and Wolinella were present in MEC1 and MEC2 biocathodes, whereas the genus Lentimicrobium (6.1%) was found only in MEC1.
Conclusion
This study investigated for the first time the CH4 production of a fully biocatalyzed MEC using SMO for flushing the biocathode. Two MECs, consisting of organic substrate-oxidizing bioanodes and CH4-producing biocathodes, were operated by applying a constant anode potential of +300 mV or +400 mV vs. Ag/AgCl. MEC1 served as a control during the experiments, whereas MEC2 was used for tests with SMO. Two exhaust gases with different compositions were examined. Higher O2 concentrations likely have reduced the rate of CH4 production during MEC2 operation due to the inhibition of anaerobic methanogens which have colonized the biocathode surface. However, it was noticeable that methanogenesis was still occurring in the presence of O2 from SMO-1 even though at lower CH4 production rates than before. Upon subsequent methanation by application of pure CO2, the biofilm successfully recovered from inhibition and achieved a CH4 production rate of 10.8 L m−2 d−1. Therefore, separating O2 from steel mill off-gas seems to be essential to increase CO2 recycling and CH4 production rates, as well as to decrease the energy consumption for CO2 removal in CH4 producing MECs. Furthermore, the effect on the CH4 production rate, by reducing the anode potential from +400 to +300 mV vs. Ag/AgCl, was investigated in MEC1. The CH4 production of MEC1 remained constant despite the reduced anode potential but COD removal efficiency and current density increased. The microbial diversity of bacteria and archaea, attached to both MEC bioelectrodes, was also investigated and compared with each other. The genus Geobacter predominated the anodic biofilms, whereas the genus Methanobacterium was the most abundant one in cathodic biofilms. Differences in microbial community compositions of MEC1 and MEC2 bioelectrodes, which may be related to SMO flushing, have been identified and discussed.
Data availability statement
The datasets presented in this study can be found in online repositories. The names of the repository/repositories and accession number(s) can be found in the article/Supplementary Material.
Author contributions
SS Conceptualization, Methodology, Investigation, Writing—Original Draft. ASC Investigation, Writing—Review and Editing. JK Data analysis and visualization, Writing—Original Draft. DN Data acquisition and analysis. ST Writing—Review and Editing. NK Provision of resources. MH Project administration, Conceptualization, Writing—Review and Editing. GG: Supervision, Writing—Review and Editing. All authors have read and agreed to the published version of the manuscript.
Funding
The project was supported by the European fund for regional development, the program Interreg V-A Austria—Czech Republic, project ATCZ183, IRAS (Innovative Recycling technology for Ashes and Slags). The financial support of the Austrian Research Promotion Agency (FFG) within the LOCON project (874152) and the project C-CED (887638) is gratefully acknowledged. Further, the authors acknowledge the funding support of K1-MET GmbH, metallurgical competence center. The research program of the K1-MET competence center is supported by COMET (Competence Center for Excellent Technologies), the Austrian program for competence centers. COMET is funded by the Federal Ministry for Transport, Innovation, and Technology; the Federal Ministry for Digital and Economic Affairs; the provinces of Upper Austria, Tyrol, and Styria; and the Styrian Business Promotion Agency (SFG).
Acknowledgments
The authors thank Prof. Dr. Bruce Logan and Dr. Gahyun Baek from the Penn State University for valuable comments and fruitful discussions within the Beyond Europe project LOCON (874152).
Conflict of interest
Authors SS, ASC, ST, and MH were employed by K1-MET GmbH. Author NK was employed by voestalpine Stahl GmbH.
The remaining authors declare that the research was conducted in the absence of any commercial or financial relationships that could be construed as a potential conflict of interest.
Publisher’s note
All claims expressed in this article are solely those of the authors and do not necessarily represent those of their affiliated organizations, or those of the publisher, the editors and the reviewers. Any product that may be evaluated in this article, or claim that may be made by its manufacturer, is not guaranteed or endorsed by the publisher.
Supplementary material
The Supplementary Material for this article can be found online at: https://www.frontiersin.org/articles/10.3389/fbioe.2022.972653/full#supplementary-material
References
Angel, R., Claus, P., and Conrad, R. (2012). Methanogenic archaea are globally ubiquitous in aerated soils and become active under wet anoxic conditions. ISME J. 6, 847–862. doi:10.1038/ismej.2011.141
Bajracharya, S., Srikanth, S., Mohanakrishna, G., Zacharia, R., Strik, D. P., and Pant, D. (2017). Biotransformation of carbon dioxide in bioelectrochemical systems: State of the art and future prospects. J. Power Sources 356, 256–273. doi:10.1016/j.jpowsour.2017.04.024
Batlle-Vilanova, P., Ganigué, R., Ramió-Pujol, S., Bañeras, L., Jiménez, G., Hidalgo, M., et al. (2017). Microbial electrosynthesis of butyrate from carbon dioxide: Production and extraction. Bioelectrochemistry 117, 57–64. doi:10.1016/j.bioelechem.2017.06.004
Bian, B., Bajracharya, S., Xu, J., Pant, D., and Saikaly, P. E. (2020). Microbial electrosynthesis from CO2: Challenges, opportunities and perspectives in the context of circular bioeconomy. Bioresour. Technol. 302, 122863. doi:10.1016/j.biortech.2020.122863
Bond, D. R., and Lovley, D. R. (2003). Electricity production by Geobacter sulfurreducens attached to electrodes. Appl. Environ. Microbiol. 69, 1548–1555. doi:10.1128/aem.69.3.1548-1555.2003
Borole, A. P., Hamilton, C. Y., Vishnivetskaya, T. A., Leak, D., Andras, C., Morrell-Falvey, J., et al. (2009). Integrating engineering design improvements with exoelectrogen enrichment process to increase power output from microbial fuel cells. J. Power Sources 191, 520–527. doi:10.1016/j.jpowsour.2009.02.006
Cai, W., Cui, K., Liu, Z., Jin, X., Chen, Q., Guo, K., et al. (2022). An electrolytic-hydrogen-fed moving bed biofilm reactor for efficient microbial electrosynthesis of methane from CO2. Chem. Eng. J. 428, 132093. doi:10.1016/j.cej.2021.132093
Chae, K. J., Choi, M. J., Kim, K. Y., Ajayi, F. F., Park, W., Kim, C. W., et al. (2010). Methanogenesis control by employing various environmental stress conditions in two-chambered microbial fuel cells. Bioresour. Technol. 101, 5350–5357. doi:10.1016/j.biortech.2010.02.035
Cheng, S., Xing, D., Call, D. F., and Logan, B. E. (2009). Direct biological conversion of electrical current into methane by electromethanogenesis. Environ. Sci. Technol. 43, 3953–3958. doi:10.1021/es803531g
Denman, S. E., Tomkins, N. W., and McSweeney, C. S. (2007). Quantitation and diversity analysis of ruminal methanogenic populations in response to the antimethanogenic compound bromochloromethane. FEMS Microbiol. Ecol. 62, 313–322. doi:10.1111/j.1574-6941.2007.00394.x
Dessì, P., Rovira-Alsina, L., Sánchez, C., Dinesh, G. K., Tong, W., Chatterjee, P., et al. (2021). Microbial electrosynthesis: Towards sustainable biorefineries for production of green chemicals from CO2 emissions. Biotechnol. Adv. 46, 107675. doi:10.1016/j.biotechadv.2020.107675
Garcia, J. L., Patel, B. K. C., and Ollivier, B. (2000). Taxonomic, phylogenetic, and ecological diversity of methanogenic Archaea. Anaerobe 6, 205–226. doi:10.1006/anae.2000.0345
Geppert, F., Liu, D., van Eerten-Jansen, M., Weidner, E., Buisman, C., and ter Heijne, A. (2016). Bioelectrochemical power-to-gas: State of the art and future perspectives. Trends Biotechnol. 34, 879–894. doi:10.1016/j.tibtech.2016.08.010
Holappa, L. (2020). A general vision for reduction of energy consumption and CO2 emissions from the steel industry. Met. (Basel) 10, 1117. doi:10.3390/met10091117
Jafary, T., Daud, W. R. W., Ghasemi, M., Kim, B. H., Md Jahim, J., Ismail, M., et al. (2015). Biocathode in microbial electrolysis cell; Present status and future prospects. Renew. Sustain. Energy Rev. 47, 23–33. doi:10.1016/j.rser.2015.03.003
Jiang, Y., May, H. D., Lu, L., Liang, P., Huang, X., and Ren, Z. J. (2019). Carbon dioxide and organic waste valorization by microbial electrosynthesis and electro-fermentation. Water Res. 149, 42–55. doi:10.1016/j.watres.2018.10.092
Jiang, Y., Su, M., Zhang, Y., Zhan, G., Tao, Y., and Li, D. (2013). Bioelectrochemical systems for simultaneously production of methane and acetate from carbon dioxide at relatively high rate. Int. J. Hydrogen Energy 38, 3497–3502. doi:10.1016/j.ijhydene.2012.12.107
Kadier, A., Kalil, M. S., Abdeshahian, P., Chandrasekhar, K., Mohamed, A., Azman, N. F., et al. (2016). Recent advances and emerging challenges in microbial electrolysis cells (MECs) for microbial production of hydrogen and value-added chemicals. Renew. Sustain. Energy Rev. 61, 501–525. doi:10.1016/j.rser.2016.04.017
Liu, L., Tsyganova, O., Lee, D. J., Chang, J. S., Wang, A., and Ren, N. (2013). Double-chamber microbial fuel cells started up under room and low temperatures. Int. J. Hydrogen Energy 38, 15574–15579. doi:10.1016/j.ijhydene.2013.02.090
Logan, B. E., Rossi, R., Ragab, A., and Saikaly, P. E. (2019). Electroactive microorganisms in bioelectrochemical systems. Nat. Rev. Microbiol. 17, 307–319. doi:10.1038/s41579-019-0173-x
Lovley, D. R. (2017). Happy together: Microbial communities that hook up to swap electrons. ISME J. 11, 327–336. doi:10.1038/ismej.2016.136
Mateos, R., Escapa, A., San-Martín, M. I., De Wever, H., Sotres, A., and Pant, D. (2020). Long-term open circuit microbial electrosynthesis system promotes methanogenesis. J. Energy Chem. 41, 3–6. doi:10.1016/j.jechem.2019.04.020
Pachauri, R. K., and Meyer, L. A. (2014). IPCC, 2014: Climate change 2014: Synthesis report. Contribution of working groups I, II and III to the fifth assessment report of the intergovernmental panel on climate change. Geneva, Switzerland: IPCC, 2014.
Quast, C., Pruesse, E., Yilmaz, P., Gerken, J., Schweer, T., Yarza, P., et al. (2013). The SILVA ribosomal RNA gene database project: Improved data processing and web-based tools. Nucleic Acids Res. 41, 590–596. doi:10.1093/nar/gks1219
Rabaey, K., and Rozendal, R. A. (2010). Microbial electrosynthesis - revisiting the electrical route for microbial production. Nat. Rev. Microbiol. 8, 706–716. doi:10.1038/nrmicro2422
Remus, R., Roudier, S., Aguado Monsonet, M. A., and Delgado Sancho, L. (2013). JRC Reference Report: Best available techniques (BAT) Reference Document for iron and steel production Luxembourg: European Union Luxembourg. doi:10.2791/97469
Rotaru, A. E., Shrestha, P. M., Liu, F., Shrestha, M., Shrestha, D., Embree, M., et al. (2014). A new model for electron flow during anaerobic digestion: Direct interspecies electron transfer to Methanosaeta for the reduction of carbon dioxide to methane. Energy Environ. Sci. 7, 408–415. doi:10.1039/c3ee42189a
Roy, M., Yadav, R., Chiranjeevi, P., and Patil, S. A. (2021). Direct utilization of industrial carbon dioxide with low impurities for acetate production via microbial electrosynthesis. Bioresour. Technol. 320, 124289. doi:10.1016/j.biortech.2020.124289
Seelajaroen, H., Haberbauer, M., Hemmelmair, C., Aljabour, A., Dumitru, L. M., Hassel, A. W., et al. (2019). Enhanced bio-electrochemical reduction of carbon dioxide by using neutral red as a redox mediator. ChemBioChem 20, 1196–1205. doi:10.1002/cbic.201800784
Seelajaroen, H., Spiess, S., Haberbauer, M., Hassel, M. M., Aljabour, A., Thallner, S., et al. (2020). Enhanced methane producing microbial electrolysis cells for wastewater treatment using poly(neutral red) and chitosan modified electrodes. Sustain. Energy Fuels 4, 4238–4248. doi:10.1039/d0se00770f
Siegert, M., Yates, M. D., Spormann, A. M., and Logan, B. E. (2015). Methanobacterium dominates biocathodic archaeal communities in methanogenic microbial electrolysis cells. ACS Sustain. Chem. Eng. 3, 1668–1676. doi:10.1021/acssuschemeng.5b00367
Sleat, R., Mah, R. A., and Robinson, R. (1985). Bacterium that forms acetate from H2 and CO2. Int. J. Syst. Bacteriol. 10, 15.
Smith, K. S., and Ingram-Smith, C. (2007). Methanosaeta, the forgotten methanogen? Trends Microbiol. 15, 150–155. doi:10.1016/j.tim.2007.02.002
Spiess, S., Kucera, J., Seelajaroen, H., Sasiain, A., Thallner, S., Kremser, K., et al. (2021). Impact of carbon felt electrode pretreatment on anodic biofilm composition in microbial electrolysis cells. Biosensors 11, 170. doi:10.3390/bios11060170
Steinberg, L. M., and Regan, J. M. (2008). Phylogenetic comparison of the methanogenic communities from an acidic, oligotrophic fen and an anaerobic digester treating municipal wastewater sludge. Appl. Environ. Microbiol. 74, 6663–6671. doi:10.1128/AEM.00553-08
Sun, Y., Wei, J., Liang, P., and Huang, X. (2011). Electricity generation and microbial community changes in microbial fuel cells packed with different anodic materials. Bioresour. Technol. 102, 10886–10891. doi:10.1016/j.biortech.2011.09.038
Van Eerten-Jansen, M. C. A. A., Jansen, N. C., Plugge, C. M., de Wilde, V., Buisman, C. J. N., and Ter Heijne, A. (2015). Analysis of the mechanisms of bioelectrochemical methane production by mixed cultures. J. Chem. Technol. Biotechnol. 90, 963–970. doi:10.1002/jctb.4413
Van Eerten-Jansen, M. C. A. A., Ter Heijne, A., Buisman, C. J. N., and Hamelers, H. V. M. (2012). Microbial electrolysis cells for production of methane from CO2: Long-term performance and perspectives. Int. J. energy Res. 36, 809–819. doi:10.1002/er.1954
Villano, M., Aulenta, F., Ciucci, C., Ferri, T., Giuliano, A., and Majone, M. (2010). Bioelectrochemical reduction of CO2 to CH4 via direct and indirect extracellular electron transfer by a hydrogenophilic methanogenic culture. Bioresour. Technol. 101, 3085–3090. doi:10.1016/j.biortech.2009.12.077
Villano, M., Monaco, G., Aulenta, F., and Majone, M. (2011). Electrochemically assisted methane production in a biofilm reactor. J. Power Sources 196, 9467–9472. doi:10.1016/j.jpowsour.2011.07.016
Villano, M., Ralo, C., Zeppilli, M., Aulenta, F., and Majone, M. (2016). Influence of the set anode potential on the performance and internal energy losses of a methane-producing microbial electrolysis cell. Bioelectrochemistry 107, 1–6. doi:10.1016/j.bioelechem.2015.07.008
Wagner, R. C., Call, D. F., and Logan, B. E. (2010). Optimal set anode potentials vary in bioelectrochemical systems. Environ. Sci. Technol. 44, 6036–6041. doi:10.1021/es101013e
Wu, H., Pan, H., Li, Z., Liu, T., Liu, F., Xiu, S., et al. (2022). Efficient production of lycopene from CO2 via microbial electrosynthesis. Chem. Eng. J. 430, 132943. doi:10.1016/j.cej.2021.132943
Yang, H. Y., Bao, B. L., Liu, J., Qin, Y., Wang, Y. R., Su, K. Z., et al. (2018). Temperature dependence of bioelectrochemical CO2 conversion and methane production with a mixed-culture biocathode. Bioelectrochemistry 119, 180–188. doi:10.1016/j.bioelechem.2017.10.002
Yang, H. Y., Wang, Y. X., He, C. S., Qin, Y., Li, W. Q., Li, W. H., et al. (2020). Redox mediator-modified biocathode enables highly efficient microbial electro-synthesis of methane from carbon dioxide. Appl. Energy 274, 115292. doi:10.1016/j.apenergy.2020.115292
Yi, H., Nevin, K. P., Kim, B. C., Franks, A. E., Klimes, A., Tender, L. M., et al. (2009). Selection of a variant of Geobacter sulfurreducens with enhanced capacity for current production in microbial fuel cells. Biosens. Bioelectron. X. 24, 3498–3503. doi:10.1016/j.bios.2009.05.004
Zeppilli, M., Cristiani, L., Dell’Armi, E., and Villano, M. (2021). Potentiostatic vs galvanostatic operation of a Microbial Electrolysis Cell for ammonium recovery and biogas upgrading. Biochem. Eng. J. 167, 107886. doi:10.1016/j.bej.2020.107886
Zeppilli, M., Paiano, P., Villano, M., and Majone, M. (2019). Anodic vs cathodic potentiostatic control of a methane producing microbial electrolysis cell aimed at biogas upgrading. Biochem. Eng. J. 152, 107393. doi:10.1016/j.bej.2019.107393
Zhang, Y., and Angelidaki, I. (2014). Microbial electrolysis cells turning to be versatile technology: Recent advances and future challenges. Water Res. 56, 11–25. doi:10.1016/j.watres.2014.02.031
Zhao, Z., Zhang, Y., Wang, L., and Quan, X. (2015). Potential for direct interspecies electron transfer in an electric-anaerobic system to increase methane production from sludge digestion. Sci. Rep. 5, 11094. doi:10.1038/srep11094
Zheng, S., Li, M., Liu, Y., and Liu, F. (2021). Desulfovibrio feeding Methanobacterium with electrons in conductive methanogenic aggregates from coastal zones. Water Res. 202, 117490. doi:10.1016/j.watres.2021.117490
Keywords: bioelectrodes, metagenomic analysis, electromethanogenesis, microbial electrolysis cell, exhaust gas
Citation: Spiess S, Sasiain Conde A, Kucera J, Novak D, Thallner S, Kieberger N, Guebitz GM and Haberbauer M (2022) Bioelectrochemical methanation by utilization of steel mill off-gas in a two-chamber microbial electrolysis cell. Front. Bioeng. Biotechnol. 10:972653. doi: 10.3389/fbioe.2022.972653
Received: 18 June 2022; Accepted: 11 August 2022;
Published: 09 September 2022.
Edited by:
Ka Yu Cheng, CSIRO Land and Water, AustraliaReviewed by:
Veera Gnaneswar Gude, Mississippi State University, United StatesSuman Bajracharya, Luleå University of Technology, Sweden
Copyright © 2022 Spiess, Sasiain Conde, Kucera, Novak, Thallner, Kieberger, Guebitz and Haberbauer. This is an open-access article distributed under the terms of the Creative Commons Attribution License (CC BY). The use, distribution or reproduction in other forums is permitted, provided the original author(s) and the copyright owner(s) are credited and that the original publication in this journal is cited, in accordance with accepted academic practice. No use, distribution or reproduction is permitted which does not comply with these terms.
*Correspondence: Sabine Spiess, sabine.spiess@k1-met.com