Abstract
To study the nature of the state Y (2175), a dedicated data set of e+e− collision data was collected at the center-of-mass energy of 2.125 GeV with the BESIII detector at the BEPCII collider. By analyzing large-angle Bhabha scattering events, the integrated luminosity of this data set is determined to be 108.49±0.02±0.85 pb−1, where the first uncertainty is statistical and the second one is systematic. In addition, the center-of-mass energy of the data set is determined with radiative dimuon events to be 2126.55±0.03±0.85 MeV, where the first uncertainty is statistical and the second one is systematic.
Export citation and abstract BibTeX RIS

Content from this work may be used under the terms of the Creative Commons Attribution 3.0 licence. Any further distribution of this work must maintain attribution to the author(s) and the title of the work, journal citation and DOI.
1. Introduction
The state Y (2175), denoted as ϕ(2170) in Ref. [1], was first observed by the BaBar experiment [2, 3] in the initial-state-radiation (ISR) process e+e−→γISRϕ(1020)f0(980), and was subsequently confirmed by BESII [4], Belle [5] and BESIII [6]. The observation of the Y (2175) stimulated many theoretical explanations of its nature, including a s -gluon hybrid [7], an excited ϕ state [8], a tetraquark state [9] and a
  bound state [10]. To study the Y (2175), a dedicated data set was collected with the BESIII detector [11] at the BEPCII collider in 2015 at the center-of-mass energy
  of 2.125 GeV, which is in the vicinity of the peaking cross sections for e+e−→ϕππ and e+e−→ϕf0(980) decays reported by BaBar [2, 3] and Belle [5].
In this paper, we present a determination of the integrated luminosity of this data set using large-angle Bhabha scattering events e+e−→ (γ)e+e−. A cross check is performed by analyzing di-photon events e+e−→γγ. In addition, using the approach described in Ref. [12], we determine the center-of-mass energy using radiative dimuon events e+e−→(γ)μ+μ−, where γ represents possible ISR or FSR (final state radiation) photons.
2. The BESIII detector
BESIII [11] is a general purpose detector, which is located at the BEPCII facility, a double-ring e+e− collider with a peak luminosity of 1033 cm−2s−1 at a center-of-mass energy of 3.773 GeV. The BESIII detector covers 93% of the solid angle around the collision point and consists of four main components: 1) A small-cell, helium-based main drift chamber (MDC) with 43 layers providing an average single-hit resolution of 135 μm, and charged-particle momentum resolution in a 1 T magnetic field of 0.5% at 1 GeV/c; 2) A Time-Of-Flight system (TOF) for particle identification composed of a barrel and two end-caps. The barrel has two layers, each consisting of 88 pieces of 5 cm thick, 2.4 m long plastic scintillator. Each end-cap consists of 96 fan-shaped, 5 cm thick, plastic scintillators. The barrel (end-cap) time resolution of 80 ps (110 ps) provides a 2σ K/π separation for momenta up to about 1.0 GeV/c; 3) An electromagnetic calorimeter (EMC) consisting of 6240 CsI(Tl) crystals in a cylindrical structure, arranged in one barrel and two end-caps. The energy resolution for 1.0 GeV photons is 2.5% (5%) in the barrel (end-caps), while the position resolution is 6 mm (9 mm) in the barrel (end-caps); 4) A muon counter (MUC) made of nine layers of resistive plate chambers in the barrel and eight layers in each end-cap, which are incorporated in the iron return yoke of the superconducting magnet. The position resolution is about 2 cm. A GEANT4 [13, 14]-based detector simulation package has been developed to model the detector response.
3. Monte Carlo simulation
In order to determine the detection efficiency and estimate background contributions, one million Monte Carlo (MC) events were simulated at  for each of the four processes: e+e−→(γ)e+e−, e+e−→γγ, e+e−→(γ)μ+μ− and e+e−→q
 . The first three processes were generated with the Babayaga 3.5 [15] generator, while e+e−→q→hadrons was generated with EvtGen [16, 17] according to the 'LundAreaLaw' [18, 19].
4. Measurement of the luminosity
4.1. Event selection
To select e+e−→(γ)e+e− events, exactly two good tracks with opposite charge were required. Each good charged track was required to pass the interaction point within ±10 cm in the beam direction (|Vz| < 10.0 cm) and within 1.0 cm in the plane perpendicular to the beam (Vr < 1.0 cm). Their polar angles θ were required to satisfy |cosθ| < 0.8 to ensure the tracks were in the barrel part of the detector. The energy deposited in the EMC of each track was required to be greater than 0.65×Ebeam, where Ebeam = 2.125/2 GeV is the beam energy. To select tracks that were back-to-back in the MDC, |Δθ| ≡ |θ1+θ2−180°| < 10° and |Δϕ|≡||ϕ1−ϕ2|−180°|<5.0° were required, where θ1/2 and ϕ1/2 are the polar and azimuthal angles of the two tracks, respectively. Comparisons between data and MC simulation are shown in Fig. 1.

Fig. 1. Distributions of cosθ of (a) e+ and (b) e−, deposited energy in the EMC of (c) e+ and (d) e−, (e) |Δθ| and (f) Δϕ (measured in the laboratory frame of reference). The dots with error bars are for data, while the solid line indicates signal MC simulation.
Download figure:
Standard image High-resolution imageAfter applying the above requirements, 33,228,098 events were selected as Bhabha scattering candidates. The background contribution is estimated to be at the level of 10−5 using MC samples of e+e−→γγ, e+e−→(γ)μ+μ− and e+e−→q processes, and is ignored in the calculation of the integrated luminosity. The backgrounds from beam-gas interactions are also ignored due to the powerful rejection rate of the trigger system and the distinguishable features of Bhabha events.
4.2. Integrated luminosity
The integrated luminosity is calculated with

where Nobs is the number of observed signal events, σ is the cross section of the specified process, ε is the detection efficiency and εtrig is the trigger efficiency.
For the Bhabha scattering process, the cross section at is calculated with the Babayaga generator to be 1621.43±3.47 nb. Using the large sample of MC simulated events, the detection efficiency is determined to be (18.89±0.04)%. The trigger efficiency εtrig is 100% with an accuracy of better than 0.1% [20]. The integrated luminosity is determined to be 108.49±0.02±0.75 pb−1, where the first uncertainty is statistical and the second one is systematic, which will be discussed in Section 4.3.
4.3. Systematic uncertainty
Sources of systematic uncertainty include the requirements on track angles (θ, Δθ, Δϕ) and the deposited energy in the EMC, the tracking efficiency, beam energy, MC statistics, trigger efficiency, and the MC generator.
To estimate the systematic uncertainties associated with the related angular requirements, the same selection criteria with alternative quantities were performed, individually, and the resultant (largest) difference with respect to the nominal result taken as the systematic uncertainty: |cosθ| < 0.8 was changed to |cosθ| < 0.75, resulting in a relative difference to the nominal result of 0.06%; |Δθ|<10.0° was changed to 8.0° or 15.0°, and the systematic uncertainty estimated to be 0.02%; |Δϕ|<5.0° was changed to 4.0° or 10.0°, and the associated systematic uncertainty is 0.04%.
The uncertainty associated with the requirement on the deposited energy in the EMC is determined by comparing the detection efficiency between data and MC simulation. The data and MC samples were selected using the selection criteria listed in Section 4.1 except for the deposited energy requirement on the electron/positron. The efficiency is determined by the ratio between the numbers of events with and without the deposited energy requirement. The difference in the detection efficiency between data and signal MC simulation is 0.19% and 0.13% for electrons and positrons, respectively. The sum, 0.32%, is taken as the systematic uncertainty.
For the uncertainty associated with the tracking efficiency, it has been well studied in Ref. [21] by selecting a control sample of Bhabha events with the EMC information only. It was found that the difference between data and MC simulation is 0.41%, which is taken as the systematic uncertainty.
To estimate the systematic uncertainty associated with the beam energy, the luminosity is recalculated with the updated cross section and detection efficiency at the alternative center-of-mass energy of the measured value in Section 5. The difference from the nominal luminosity, 0.18%, is taken as the systematic uncertainty.
The uncertainty from MC statistics is 0.21% and from trigger efficiency is 0.1% [20]. The uncertainty due to the Babayaga generator is given as 0.5% [15].
All individual systematic uncertainties are summarized in Table 1. Assuming the individual uncertainties to be independent, the total systematic uncertainty is calculated by adding them quadratically and found to be 0.78%.
Table 1. Summary of the systematic uncertainties.
| source | relative uncertainty(%) |
|---|---|
| |cosθ| < 0.8 | 0.06 |
| |Δθ| < 10.0° | 0.02 |
| |Δϕ| < 5.0° | 0.04 |
| deposited energy requirement | 0.32 |
| tracking efficiency | 0.41 |
| beam energy | 0.18 |
| MC statistics | 0.21 |
| trigger efficiency | 0.10 |
| generator | 0.50 |
| total | 0.78 |
4.4. Cross check
As a cross check, an alternative luminosity measurement using e+e−→γγ events was performed. To select e+e−→γγ events, candidate events must have two energetic clusters in the EMC. For each cluster, the polar angle was required to satisfy |cosθ|<0.8 and the deposited energy E must be in region 0.7×Ebeam<E<1.15×Ebeam. To select clusters that are back-to-back, |Δϕ|<2.5° (defined in Section 4.1) was required. In addition, there should be no good charged tracks satisfying |Vz| < 10.0 cm and Vr < 1.0 cm. With the selected e+e−→γγ events, the integrated luminosity is determined to be 107.91±0.05 pb−1 (statistical only), which is in good agreement with the result obtained using large-angle Bhabha scattering events.
5. Measurement of the center-of-mass energy
5.1. Event selection
To select e+e−→(γ)μ+μ− candidates, we require exactly two good tracks with opposite charge satisfying |Vz|<10.0 cm, Vr<1.0 cm and |cosθ|<0.8. To remove Bhabha events, the ratio of the deposited energy in the EMC and the momentum of a charged track, E/pc, was required to be less than 0.4. The two tracks should be back-to-back, with the Δθ and Δϕ (defined in Section 4.1) satisfying |Δθ|<10.0° and |Δϕ|<5.0°. To further suppress background from cosmic rays, |ΔT|=|t1−t2|<1.5 ns was required, where t1/2 is the time of flight of the two charged tracks recorded by the TOF. Figure 2 shows the comparisons between data and MC simulation, where the solid line is signal MC and the shaded histogram represents the simulation of background e+e−→q.
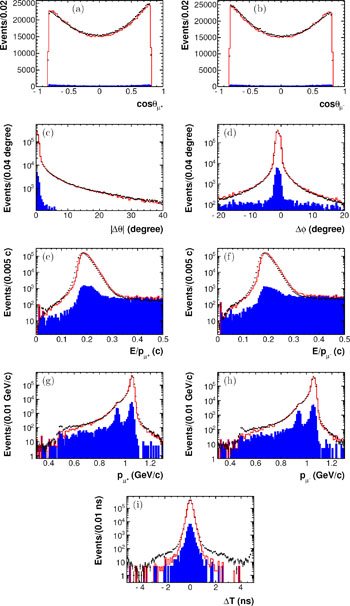
Fig. 2. Distributions of cosθ of (a) μ+ and (b) μ−, (c) |Δθ|, and (d) Δϕ (measured in the laboratory frame of reference), E/p distributions of (e) μ+ and (f) μ−, momentum distributions of (g) μ+ and (h) μ−, and (i) ΔT distribution. The dots with error bars represent the data, the solid line indicates signal MC simulation, and the shaded histogram represents the MC simulation of e+e−→q.
Download figure:
Standard image High-resolution imageWith the above requirements, 1,472,195 events were selected in data with an estimated background level of about 1.8%. The small bumps visible in Figs. 2 (g) and (h) at about 0.93 GeV/c mainly come from the e+e−→K+K− process. The peak at about 1.07 GeV/c mainly consists of events from the processes e+e−→π+π− and e+e−→π+π−γ.
5.2. Center-of-mass energy
Using the e+e−→(γ)μ+μ− events, the center-of-mass energy of the data set is determined with the method described in Ref. [12].
The center-of-mass energy can be determined with

where Mdata(μ+μ−) is the reconstructed μ+μ− invariant mass of the selected e+e−→(γ)μ+μ− events, and ΔM is the correction for effects of ISR and FSR, which can be estimated using the μ+μ− invariant mass of MC samples with ISR/FSR turned on (MMC, on(μ+μ−)) and off (MMC, off(μ+μ−)):

By fitting the MMC, on(μ+μ−) and MMC, off(μ+μ−) distributions of MC samples, the average of ΔM is determined to be −1.13 MeV/c2, where MMC, on=2124.60±0.04 MeV/c2, MMC, off=2125.73±0.01 MeV/c2, and the errors are statistical only. The function fitted to MMC, on is a Gaussian plus a Crystal Ball function [22] with a common mean, and the function fitted to MMC, off is a double Gaussian function with a common mean. The fit results are shown in Fig. 3. To calculate ΔM (and MCM) as a function of run number, MMC, off and MMC, on for each run are fitted with the above same functions.

Fig. 3. Fit to M(μ+μ−) of MC sample (a) with and (b) without ISR/FSR.
Download figure:
Standard image High-resolution imageFor each run, Mdata(μ+μ−) was fitted in the range [2.0, 2.2] GeV/c2. The signal is described by a Gaussian plus a Crystal Ball function with a common mean, while the background is ignored (about 1.1% in the fit range). As an example, the fit result for run 42030 is shown in Fig. 4.

Fig. 4. Fit to M(μ+μ−) for run 42030. Dots with error bars are data, while the solid line is the fit result.
Download figure:
Standard image High-resolution imageMCM was calculated with Eq. (2) and Eq. (3) for each run. The average of MCM for the full data set is determined to be 2126.55±0.03 MeV/c2 by fitting the MCM of different runs with a constant. The MCM distribution as a function of run number and the overall fit result are shown in Fig. 5, where 21 runs are excluded in the fit due to large statistical errors (less than 100 entries in the fit range). The MCM values for individual runs are shown in Fig. 6 as a histogram, which can be fitted very well with a Gaussian function with the parameters μ=2126.55±0.03 MeV/c2 and σ=0.98±0.03 MeV/c2.
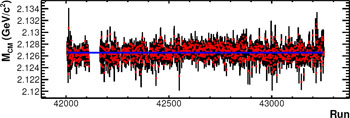
Fig. 5. Distribution of MCM for individual runs. The solid line is the average fit.
Download figure:
Standard image High-resolution image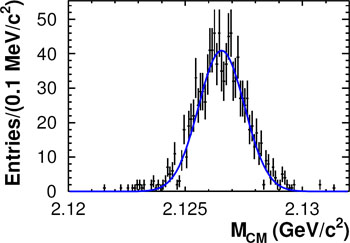
Fig. 6. Histogram of MCM for individual runs. The solid line is a Gaussian function.
Download figure:
Standard image High-resolution image
5.3. Systematic uncertainty
As shown in Section 5.2, MMC, off=2125.73±0.01 MeV/c2 is 0.73 MeV/c2 higher than the input value (2125 MeV/c2). This difference is taken as the systematic uncertainty.
The uncertainty of the momentum measurement of two muon tracks has been studied using e+e−→γISRJ/ψ, J/ψ→μ+μ− in Ref. [12], and is estimated to be 0.011%.
To estimate the uncertainty from the fit to the invariant mass of μ+μ−, the signal shape and fit range were varied and MCM re-calculated. The difference to the nominal result is taken as the systematic uncertainty. The systematic uncertainty from signal shape is estimated to be 0.08 MeV/c2 by replacing the Crystal Ball function in the signal shape with the GaussExp function [23]. The systematic uncertainty from fit range is estimated to be 0.13 MeV/c2 by varying the fit range to [2.00, 2.14] GeV/c2 and [2.10, 2.20] GeV/c2, respectively.
To estimate the uncertainty from the fit to the MCM distribution, fits in different ranges of the run number were carried out. The resultant maximum difference with respect to the nominal value, 0.34 MeV/c2, is taken as the uncertainty.
Assuming all of the above uncertainties are independent, the total systematic uncertainty is calculated to be 0.85 MeV/c2 by adding the individual items in quadrature.
6. Summary
The integrated luminosity of the data taken at 2.125 GeV in 2015 with the BESIII detector is measured to be 108.49,±,0.02,±,0.85 pb−1 using large-angle Bhabha events. A cross check with e+e−→γγ events was performed and the result is 107.91±0.05 pb−1 (statistical only), which is in good agreement with the nominal result within the uncertainties. With e+e−→(γ)μ+μ− events, the center-of-mass energy of the data set is measured to be 2126.55,±,0.03,±,0.85 MeV. The results in this measurement are important input for physics studies, e.g., studies of decays of the Y (2175).
The BESIII collaboration would like to thank the staff of BEPCII and the IHEP computing center for their dedicated support.
Footnotes
- *
Supported in part by National Key Basic Research Program of China (2015CB856700), National Natural Science Foundation of China (NSFC) (11235011, 11322544, 11335008, 11425524, 11635010, 11675184, 11735014), the Chinese Academy of Sciences (CAS) Large-Scale Scientific Facility Program; the CAS Center for Excellence in Particle Physics (CCEPP); the Collaborative Innovation Center for Particles and Interactions (CICPI); Joint Large-Scale Scientific Facility Funds of the NSFC and CAS (U1232201, U1332201, U1532257, U1532258), CAS (KJCX2-YW-N29, KJCX2-YW-N45), 100 Talents Program of CAS; National 1000 Talents Program of China; INPAC and Shanghai Key Laboratory for Particle Physics and Cosmology; German Research Foundation DFG (Collaborative Research Center CRC 1044, FOR 2359), Istituto Nazionale di Fisica Nucleare, Italy; Koninklijke Nederlandse Akademie van Wetenschappen (KNAW) (530-4CDP03), Ministry of Development of Turkey (DPT2006K-120470), National Natural Science Foundation of China (NSFC) (11505010), The Swedish Resarch Council; U. S. Department of Energy (DE-FG02-05ER41374, DE-SC-0010118, DE-SC-0010504, DE-SC-0012069), U.S. National Science Foundation; University of Groningen (RuG) and the Helmholtzzentrum fuer Schwerionenforschung GmbH (GSI), Darmstadt; WCU Program of National Research Foundation of Korea (R32-2008-000-10155-0)