


Abstract
To evaluate the real reductions in sulfur dioxide (SO2) emissions from coal-fired power plants in China, Ozone Monitoring Instrument (OMI) remote sensing SO2 columns were used to inversely model the SO2 emission burdens surrounding 26 isolated power plants before and after the effective operation of their flue gas desulfurization (FGD) facilities. An improved two-dimensional Gaussian fitting method was developed to estimate SO2 burdens under complex background conditions, by using the accurate local background columns and the customized fitting domains for each target source. The OMI-derived SO2 burdens before effective FGD operation were correlated well with the bottom-up emission estimates (R = 0.92), showing the reliability of the OMI-derived SO2 burdens as a linear indicator of the associated source strength. OMI observations indicated that the average lag time period between installation and effective operation of FGD facilities at these 26 power plants was around 2 years, and no FGD facilities have actually operated before the year 2008. The OMI estimated average SO2 removal equivalence (56.0%) was substantially lower than the official report (74.6%) for these 26 power plants. Therefore, it has been concluded that the real reductions of SO2 emissions in China associated with the FGD facilities at coal-fired power plants were considerably diminished in the context of the current weak supervision measures.
Export citation and abstract BibTeX RIS

Content from this work may be used under the terms of the Creative Commons Attribution 3.0 licence. Any further distribution of this work must maintain attribution to the author(s) and the title of the work, journal citation and DOI.
1. Introduction
An immense amount of coal is used in China to maintain its rapid economic growth, industrialization, and urbanization, taking 50.8% of the total global coal consumption in 2014 [1]. Consequently, sulfur dioxide (SO2) pollution has undermined the public's expectations for clean air quality in China for many years [2–4], and endangered the human health and ecosystem [5–8]. Looking back over the past decade, the Chinese government has made great efforts to reduce SO2 emissions by legislatively mandating the installation of flue gas desulfurization (FGD) facilities at coal-fired power plants [9]. However, given the fact of the weakness in the traditional supervision measures, the full load operation of these FGD facilities is currently too idealized and the artificial interference on the reported monitoring data at some power plants is inevitable. In the context of this situation, the real world SO2 removal efficiencies of these facilities can be significantly diminished, which introduces an overlooked uncertainty to the SO2 emission estimates in China. Remote sensing measurements originating from satellite platforms have been proved as a powerful tool in monitoring emissions from large point sources over the world [10, 11], and hence provide possibly reliable ways to evaluate the real operation status and SO2 removal efficiencies of the FGD facilities at coal-fired power plants in China.
The Gaussian dispersion model has been demonstrated to well represent the spatial distribution of short-lived tracer gases (e.g., SO2 and nitrogen dioxide, NO2) around a stable emission source in ideal conditions [12]. Measurements probed from satellite instruments could provide continuous column concentrations for these species with considerable horizontal resolution, and inversely estimate the source strength. Their capabilities in characterizing the emissions from large point sources such as power plants have been proved in various studies [13–17]. Beirle et al [18] presented a promising method based on an exponentially modified one-dimensional Gaussian function to estimate nitrogen oxides (NOx) emissions from several megacities around the world. Their model elaborately considered effects of local dispersion directions, yet the critical thresholds on performances of the target sources limited its application for weaker point sources. Fioletov et al [19] used a two-dimensional (2D) Gaussian function to estimate SO2 burdens in the vicinity of large emission sources in the United States. This elegant method was further applied by McLinden et al [20] and Lu et al [21] to the studies of increasing NO2 levels over Canadian oil sands and SO2 emissions from Indian coal-fired power plants, respectively, and recently on various large point sources [22]. These numerically modeled emissions were further compared with the box model estimates to examine their accuracy and constrains [23, 24]. All of the aforementioned studies used Ozone Monitoring Instrument (OMI) measurements to take advantage of its high horizontal resolution (13 × 24 km2 at nadir). In this paper, we used high resolution OMI measurements to estimate the SO2 emission burdens over 26 coal-fired power plants in China before and after their OMI-identified FGD operation time by an improved 2D Gaussian fitting method that determines the local background columns and uses customized fitting domains. This improvement extends the feasibility and flexibility of the method on analyzing large point sources that have complex interference from numerous nearby emitters, which is very common in China. We then evaluated the real desulfurization efficiencies at these coal-fired power plants during the period 2005–2012 using the improved approach.
2. Data and methods
2.1. Power plant emissions
The bottom-up SO2 emissions from coal-fired power plants for the period 2005–2012 were used for comparison with the OMI-derived SO2 emission burdens. These emissions data are available from a unit-based power plant emission inventory for Mainland China that updated the dataset in Wang et al [25] We calculated the monthly emissions for each unit based on its technology and operation information, including boiler size, coal consumption per unit electricity supply, emission control technology, and the exact month in which the unit formally came into operation and closed. In the bottom-up emission inventory, all FGD facilities were considered as full load operations beginning from their formal installation date. The SO2 removal efficiencies of FGD facilities were taken from official unpublished data offered by the Ministry of Environmental Protection (MEP) of China.
2.2. OMI retrievals
OMI onboard NASA's EOS-Aura satellite is a nadir viewing, UV/VIS solar backscattering spectrometer, which provides simultaneous retrievals of atmospheric tracer gas and aerosol concentrations, including SO2, with nearly daily global coverage and a local afternoon equator crossing time at 13:45 since October 2004 [26]. In this study we began with the operational OMI Level-2 planetary boundary layer (PBL) SO2 product publicly released by NASA [27].
In the work presented here, a number of efforts toward improving the original SO2 columns have been initiated following the method of Lee et al [28]. Two noteworthy aspects are as follows: (1) daily removal of systematic offsets and substantial latitude dependent biases using the 'reference sector method' and (2) recalculation of the coincident local air mass factors (AMFs) using a radiative transfer model (LIDORT) [29] with a priori SO2 profiles at a resolution of 2° × 2.5° from a global chemical transport model (GEOS-Chem) [30] for all observations. The retrieved vertical SO2 columns have been validated against airborne in situ measurements, showing significant improvement in accuracy compared to the original operational data product [28]. Only OMI pixels with solar zenith angle ≤70°, surface albedo ≤0.3 and cloud radiance fraction ≤0.3 were used in the final gridded columns. The outermost one-third of the pixels was excluded to limit the original pixel sizes from 13 × 24 km2 at nadir to approximately 16 × 40 km2 at the edges. Pixels specified as 'row anomalies' since June 2007 were also dynamically removed, according to the recommendations of NASA. Finally, all pixels were allocated by area weighted mean approach into 0.01° × 0.01° grids with corner coordinate information, in which each pixel over the target grid was weighted by its overlapping area to generate the average SO2 columns at high-resolution [31].
2.3. Improved inverse modeling of SO2 burdens
We first selected isolated power plants by the proportion of the power plant SO2 emissions in the total anthropogenic emissions (>80%) in the corresponding 0.1° × 0.1° grid and total population (<0.5 million). We then used the high-resolution OMI measurements to estimate the SO2 emission burdens around 26 isolated coal-fired power plants which passed the 2D Gaussian fitting. Detailed information of these power plants is presented in table S1 and their locations are denoted in figure 1(a). Fioletov et al [19] reported that the elliptically distributed SO2 columns observed by OMI over a long time period nearby the 40 largest US emission sources could be well fitted by a 2D Gaussian function and the total number of SO2 molecules, namely the SO2 burden, associated with the target source could be inferred from the fitted parameters. Results in their study suggested that the OMI-derived SO2 burdens were correlated well with the emissions directly measured by the continuous emissions monitoring systems, indicating this inferred quantity as a reliable linear indicator of the associated source strength. de Foy et al [23] further pointed out that the fitted emissions (derived with an assumed lifetime) with this method were sensitive to the domain choice. The three-year averaged OMI SO2 columns (figure 1(a)) at a resolution of 0.01° × 0.01° based on area-weighted method also suggest clearly enhanced emission signals near many coal-fired power plants selected in this study. However, more challenging in China than in US are the various interacting emission sources. In China, coal-fired power plants are typically collocated with populous clusters, which include numerous industrial and residential emission sources and release even more SO2 than a single power plant. Although we limited our targets only to those far away from megacities and densely polluted regions, perfectly isolated coal-fired power plants are scarce and only account for 6 of the 26 samples herein (see table S1 in supporting information (SI) for details). We classified these 6 power plants as Grade A (a typical plant is shown in figure 1(b)). Many other power plants are affected by nearby emitters, but leaving clear concentration gradients to perform a 2D Gaussian fitting analysis in sufficient unaffected directions (see figure 1(c)). We classified these 20 relatively isolated power plants as Grade B. We found that Fioletov et al's method [19] would lead to large uncertainties or even fail to converge when applied to Grade B power plants. Besides the nearby emitters, interference to a valid performance of the original 2D Gaussian fitting method also possibly arises from the complex topography around many target sources [32]. To estimate SO2 burdens from these affected power plants under various complex background conditions, additional improvements must be made.

Figure 1. The averaged OMI SO2 columns over eastern China during the period 2006–2008 (a) and typical examples for Grade A (b) and Grade B (c) power plants. The hollow circles denote the 26 coal-fired power plants in (a) with three sizes from small to large: <40 Gg yr−1, 40–100 Gg yr−1, >100 Gg yr−1; the customized asymmetric fitting domains in this study and the circular fitting domains (60 km radius) in Fioletov et al [19] are marked with red and black dashed lines in (b) and (c), respectively; SO2 column data are at 0.01° × 0.01° horizontal resolution.
Download figure:
Standard image High-resolution imageWe developed the SO2 burden inversion method of Fioletov et al [19] in two aspects. First, benefiting from the removal of systematic offsets and latitude-dependent SO2 column biases mentioned in section 2.2, a constant term, OMIbackground, was added to the original 2D Gaussian function as a fitting parameter:
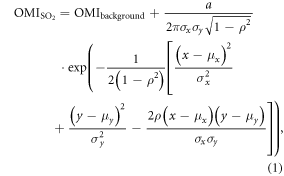
where x and y indicate the coordinates of the OMI pixel center; the parameters μx and μy denote the position of the fitting maximum; the parameters σx, σy, and ρ determine the shape and rotation of the ellipse; and the parameter a represents the total number of SO2 molecules (or SO2 burden) observed by OMI associated with the target source. The local bias correction used in the original method, which subtracted the average SO2 columns within a 300 km radius around the source, caused substantial signal degradation in the target domain (typically within 80 km) in this study, in view of the intensive emission hotspots in China. A similar constant background column term was also considered in McLinden et al [20]. By contract, the fitted OMIbackground from the improved method in this study can better represent the background SO2 columns compliant with the fitting domain surrounding each target source.
Second, a unique asymmetric fitting domain was customized for each selected coal-fired power plant according to the distribution of nearby sources of interfering emissions and of topography. Figure 1(c) shows a typical case for one Grade B power plant (#2 power plant). In this case, the northwest side of the target plant is less affected by other emission sources in contrast to the other directions, and a clear descent gradient of the SO2 columns can be identified from the central source to the outmost grids in figure 1(c). Because the asymmetric fitting domains were used, instead of the uniform circular fitting domains (40 or 60 km radius depending on the source strength) in the original method, only OMI columns in directions that were less affected by surrounding interference were quantified in the following fitting; consequently, interference from nearby sources was minimized. A systematic bias may be introduced in the 2D Gaussian fitting for Grade B power plants due to the heterogeneous interference from the nearby emission sources at different parts of the fitting domain, which is difficult to quantify but can be partially canceled when analyzing the ratio of the fitted SO2 burdens in two periods as conducted later in this study. Numerous OMI samples are required for the 2D Gaussian fitting so that sufficient fitting domain is needed for stable fitting results. Specially, we found that the reliability of the fitting was sensitively dependent on whether the background concentration areas were sufficiently covered by the asymmetric fitting domain. When this requirement was met, the biases in the 2D Gaussian fitting related to the domain choice, as mentioned by de Foy et al [23] can be greatly reduced and a stable solution can be thereby generated. Furthermore the biases in the 2D Gaussian fitting related to the dispersion directions, as mentioned by de Foy et al [23] have less effect on the analysis in this study, because no emissions were directly estimated herein and the systematic biases in the parameter a can be partially canceled in the assessment of trends. Typically, a domain with a width in excess of 60 km (from the central source to the farthest edge) was necessary in this study.
3. Results
3.1. SO2 burden estimates
The SO2 burdens over the selected 26 coal-fired power plants were estimated by applying the improved 2D Gaussian fitting method to the averaged OMI columns for the period 2006–2008, representing the strength of emissions before the effective operation of the FGD facilities as discussed in later section. The fitting parameter a for each target plant was then compared with the bottom-up SO2 emissions, as shown in figure 2. These two sets of independent estimates are well correlated: R = 0.92 for all 26 samples, and R = 0.96 for the 6 Grade A samples, thereby indicating that the SO2 emissions from isolated coal-fired power plants or similar large point sources can be linearly inferred using OMI measurements in China. Although the source strength of a single coal-fired power plant is not as large as that in the US and India, we found no statistically significant threshold on this factor in this study when using our improved fitting method and also the improved OMI SO2 columns, in contrast with the findings of Fioletov et al [19] (>70 Gg yr−1) and Lu et al [21] (>50 Gg yr−1). The uncertainties of the inversed OMI SO2 burdens were contributed by the biases in the OMI SO2 slant and vertical column retrievals [27, 28, 33], the residual interference from other sources in the 2D Gaussian fitting method, and the relatively coarse resolution of the a priori SO2 profiles used in the calculation of AMFs [25].
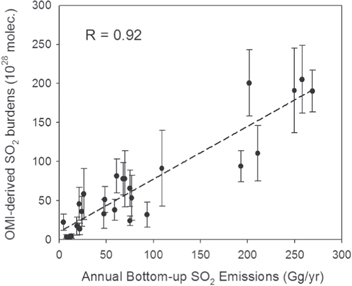
Figure 2. Scatter plots of the OMI-derived SO2 burdens against the annual bottom-up SO2 emissions for the 26 coal-fired power plants during the period 2006–2008. The linear fit regression is showed as black dashed line. Error bars express the 95% confidence intervals.
Download figure:
Standard image High-resolution image3.2. Identification of the effective FGD operation dates
The improved 2D Gaussian fitting method was further used to estimate the SO2 burdens over these 26 coal-fired power plants before and after the effective operation of their FGD facilities. The results were then used to evaluate the real emission reductions during the period 2005–2012. It is widely believed that there is a long operation-vacuum period between the installation and effective operation dates for FGD facilities at coal-fired power plants in China due to the trade-off between the pressure of SO2 emission reductions and the economic cost of desulfurization. The break points possibly began in 2008 to meet the nation's mandatory target of 10% SO2 emission reductions in the '11th five-year plan' period (2006–2010), and they were partially due to the promotion of the Beijing 2008 Olympic Games. This circumstance has been portrayed by Li et al [16] for several coal-fired power plants in Inner Mongolia, China.
To identify the time of the FGD facilities begun operation for each of the 26 coal-fired power plants, we compared the temporal variations in the tropospheric SO2 and NO2 columns observed simultaneously by OMI. The NASA's Level-2 standard tropospheric NO2 columns were used herein and processed following the same method as described in section 2.2 for SO2 columns. The 0.01° × 0.01° SO2 and NO2 column data were then monthly averaged over a 0.1° × 0.1° region surrounding each power plant and 12-month moving smoothed to eliminate seasonal variations. Inter-annual variations in OMI NO2 columns over isolated power plants can be used as an indicator for changes in activity rates of the sources. When FGD facilities came into effective operation, the emission factor of SO2 largely decreased, so that the trend of OMI SO2 columns can be significantly against that of the OMI NO2 columns. This fact was examined in this work and used to determine the effective operation date (hereinafter referred to as the 'EOD') of the FGD facilities for each power plant herein. Similarly, we defined the scheduled operation date (usually at the time of installation) of the 'first FGD facility' at each power plant as the 'SOD'.
The 'SOD' was determined according to the scheduled operation date of the first FGD facility at the target power plant, which is provided by the bottom-up emission database. We then used the OMI NO2 columns to constrain the trend of OMI SO2 columns over these isolated power plants and identified when the OMI SO2 columns varied significantly against the OMI NO2 columns. The 'EOD' was determined by the ratio of the synchronous OMI SO2 and NO2 columns (12-month moving smoothed) over the target power plant. Figure 3(a) illustrates an example (for #3 power plant) for the determination of the EODs and SODs in this study. There were 4 generating units in this power plant, with the first FGD facility installed in November 2007. Therefore, the year 2007 was determined as the SOD for this power plant. The moving-averaged OMI SO2/NO2 has stably decreased significantly since the end of 2008 (figure 3(b)), reflecting the effective operation of the FGD facilities after that time. We defined the EOD point as the 12th month after the moving-average SO2/NO2 began to continuously decrease. We then identified the year of EOD point as the EOD year for this power plant (2009 for this case). For all 26 power plants in this study, the OMI-identified EODs and their SODs were listed in table S1. We found no EODs for these power plants are earlier than 2008 (see figure 4), and 20 power plants' EODs lagged behind their SODs. The average FGD lag period was determined to be 2.1 yr based on the average discrepancy between the EODs and SODs over the 26 power plants, which suggested that the real operating status of the FGD facilities was poor at the beginning of the '11th five-year plan' period (2006–2010).
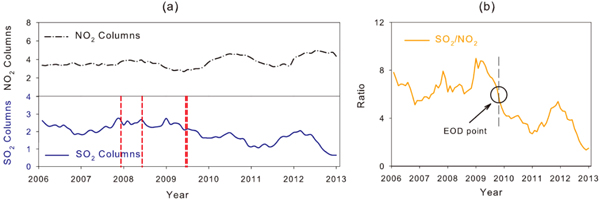
Figure 3. (a) Temporal variations of monthly OMI tropospheric SO2 and NO2 columns over a 0.1° × 0.1° area surrounding a coal-fired power plant (#3; 26.22°N, 105.75°E) during the period 2005–2012. Data are 12-month moving averages; the four dashed red lines indicate the exact dates on which the FGD facilities came into operation. Unit for SO2 columns is 1016 molec. cm−2 and for NO2 columns is 1015 molec. cm−2. (b) Ratio of OMI SO2 columns and OMI NO2 columns during the period 2005–2012.
Download figure:
Standard image High-resolution image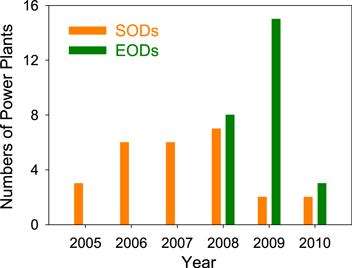
Figure 4. Distributions of the scheduled operation dates of the 'first FGD facility' (SODs) and the effective operation dates (EODs) for the 26 coal-fired power plants.
Download figure:
Standard image High-resolution image3.3. Evaluation of SO2 emission reductions
We calculated the SO2 burdens over these 26 coal-fired power plants for two time periods, before and after their EODs in 2005–2012 (the EOD year was included in the later period). The fitting parameters a for these two periods were compared with the corresponding bottom-up SO2 emissions in figure 5, respectively. As shown in figure 5(a), the average SO2 burdens for the 26 power plants were reduced by 38% after EODs, which is significantly less than 65% reduction estimated from the bottom-up inventory, indicating that the actual removal efficiencies of FGD facilities in these power plants may be lower than reported. We also found large difference in the correlations for these two periods, R = 0.91 before the EODs and R = 0.39 after the EODs (figure 5(b)). As stated in section 3.1, the good correlation before the EODs confirmed the accuracy of the OMI-derived SO2 burden estimates, while the relatively poor correlation after the EODs further confirmed that power plants may have emitted more SO2 than the expected levels estimated using the reported FGD removal efficiencies from the MEP.

Figure 5. Comparison of OMI-derived SO2 burdens and bottom-up SO2 emissions for periods before and after the EODs over the 26 coal-fired power plants during the period 2005–2012. The red and blue horizon lines in figure 5(a) denote the mean and median respectively. The linear fit regressions in figure 5(b) are showed as black and orange dashed lines for samples before and after the EODs, respectively. Error bars in figure 5(b) express the 95% confidence intervals.
Download figure:
Standard image High-resolution image
Since the construction of new units or the retirement of old units may also perturb the SO2 emissions, the reduction rate of SO2 burdens doesn't well represent the SO2 removal efficiency of the FGD facilities. We then calculated the OMI-estimated SO2 removal equivalence fOMI for each power plant using the fitting parameters a for the periods before and after the individual EOD (abefore and aafter):
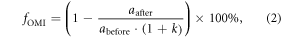
where  presents the increased ratio of activity level equivalence during the two periods, which is calculated as the increase of coal consumption rates. A negative value in k usually indicates the closedown of some generator units after the EOD at the corresponding power plant. By comparison, we calculated the estimated SO2 removal equivalence using bottom-up SO2 emission inventories with and without FGD operation at the target plants after the EODs. For all 26 power plants in this study, the SO2 removal equivalences estimated from two approaches are listed in table S1. In weighted average, the SO2 removal equivalence estimated from OMI was calculated to be 56.0 ± 21.3%, substantially lower than that from inventories (74.6 ± 9.1%) for the same period. To summarize all the findings we listed above, the real desulfurization efficiencies of FGD facilities at these 26 coal-fired power plants were considerably discounted because of the weak supervision measures in China.
It should be noted that other factors might also contribute to the differences between reported SO2 emissions and SO2 burdens. Uncertainties in SO2 retrievals and fitting model could contribute to the errors. For example, the AMFs used in the satellite retrieving algorithm were impacted by the complex effects of aerosols [28], which depended on the relative vertical distribution of the aerosol layer and the tracer gas layer, the composition of the aerosols, and the wavelength used. The severe haze pollution in China may have complicated this issue. The systematic biases in the fitting model can be partially canceled when the ratio of the parameter a was used and would not lead to substantial uncertainties. Reduced SO2 signals after EODs will increase the uncertainties in SO2 retrieval and contribute to additional errors when comparing with emissions. The non-linear changes between changes in emissions and in SO2 columns can also lead to uncertainties to our inverse model, although they were difficult to quantify.
4. Discussion
Although based on limited samples, we have provided a quantitative evaluation of the real operation status and SO2 removal efficiencies of FGD facilities in China's coal-fired power plants in this work. We concluded that the FGD facilities installed before the year 2008 were failed in effective operation. An average two-year lag time period was determined between their installation and effective operation dates. This finding possibly explains the discrepancy between the year of the highest SO2 columns observed by satellites (generally to be 2007) and the year of the most anthropogenic SO2 emissions estimated from inventory side (generally to be 2006) for China [34–37]. We also found that a large proportion of these FGD facilities has not desulfurized on their best, possibly reflecting the signs of artificial interference on the desulfurization process. These kinds of information would be practically needed by the supervision sectors in China as a precheck measure to the suspected large point sources, and consequently promote the real reductions of the SO2 emissions (possible also benefit to other pollutant species). The bias related to the desulfurization efficiency of the FGD facilities in China also introduced a significant uncertainty in the SO2 emission budget in all existing inventories, although difficult to quantify at the present stage. By applying the OMI-derived correction factors of FGD removal efficiencies to the MEIC emission inventory (www.meicmodel.org), the revised estimates for China's power plant SO2 emissions in 2012 might be increased from 6.7 Tg to 10.0 Tg, implying that the total anthropogenic SO2 emissions in 2012 might be underestimated by 11% due to overestimation of actual desulfurization efficiencies. Hence, the results presented herein provide valuable implications not only to the oversight of major emitters in China, but also to the broader community to review their perceptions of China's SO2 emissions [34, 35, 38–40] and the effects on the local air pollution and global climate change.
It is worthy noted that the improvements in the satellite SO2 retrieval algorithms [41] and emission inversion algorithms could help to extract more accurate emission signals of large point sources in a broader range of conditions. The new-generation low earth orbit satellite instruments and the future geostationary missions with improved spatial and temporal resolution will further enhance satellite's capabilities in quantifying emissions from individual sources [42]. China's government has mandated coal-fired power plants to install Selective Catalytic Reduction facilities to reduce NOx emissions since the year 2010. The methodologies developed in this study could also be used to monitor the real world reductions in NOx emissions from power plants. Application of this method to NOx could be even more promising as satellite-based NO2 columns are more accurate. We are convinced that the satellite measurements will continue to play a positive major role in overseeing the air quality management being under construction in China.
Acknowledgments
This work was funded by the National Natural Science Foundation of China (41222036 and 41275026) and the China's National Basic Research Program (2014CB441301). The work at Tsinghua University is a contribution to the EU FP-7 program MarcoPolo and PANDA. We acknowledge the free use of the PBL OMI SO2 Level 2 products and Tropospheric OMI NO2 Level 2 products from NASA GES Data and Information Service Center (http://disc.sci.gsfc.nasa.gov/Aura/).