
Microscale Processes and Dynamics during CH4–CO2 Guest-Molecule Exchange in Gas Hydrates


GEOMAR Helmholtz Centre for Ocean Research Kiel, Wischhofstr. 1-3, 24148 Kiel, Germany
*
Author to whom correspondence should be addressed.
†
Current affiliation: Geotek Ltd., 4 Sopwith Way, Daventry, Northamptonshire NN11 8PB, UK.
Energies 2021, 14(6), 1763; https://doi.org/10.3390/en14061763
Submission received: 25 February 2021
/
Revised: 16 March 2021
/
Accepted: 17 March 2021
/
Published: 22 March 2021
(This article belongs to the Special Issue Carbon Dioxide Storage in Hydrate Reservoirs)
Abstract
:The exchange of CH4 by CO2 in gas hydrates is of interest for the production of natural gas from methane hydrate with net zero climate gas balance, and for managing risks that are related to sediment destabilization and mobilization after gas-hydrate dissociation. Several experimental studies on the dynamics and efficiency of the process exist, but the results seem to be partly inconsistent. We used confocal Raman spectroscopy to map an area of several tens to hundreds µm of a CH4 hydrate sample during its exposure to liquid and gaseous CO2. On this scale, we could identify and follow different processes in the sample that occur in parallel. Next to guest-molecule exchange, gas-hydrate dissociation also contributes to the release of CH4. During our examination period, about 50% of the CO2 was bound by exchange for CH4 molecules, while the other half was bound by new formation of CO2 hydrates. We evaluated single gas-hydrate grains with confirmed gas exchange and applied a diffusion equation to quantify the process. Obtained diffusion coefficients are in the range of 10−13–10−18 m2/s. We propose to use this analytical diffusion equation for a simple and robust modeling of CH4 production by guest-molecule exchange and to combine it with an additional term for gas-hydrate dissociation.
1. Introduction
Gas hydrates are crystalline compounds in which a basic structure composed of water molecules forms different types of cages that contain small gas molecules. Those enclathrated molecules are termed guest molecules. Natural gas-hydrates host predominantly biogenic methane as a guest molecule and occur at high pressures as well as low to moderate temperatures either in continental margin sediments overlain by at least several hundred meters of water or in permafrost soil [1]. During the past three decades, marine natural gas hydrates have increasingly gained attention. Depending on the focus of consideration, they are either regarded as a potential unconventional resource of natural gas [2,3,4], a potential hazard due to their global warming-induced dissociation whereby the potent greenhouse gas CH4 is released and the geomechanical stability of the seafloor is weakened [5], or as a means to store CO2 as an immobile mineral [6] A much-discussed strategy for tackling the aforementioned three aspects of natural-gas production, carbon-dioxide sequestration, and geohazard mitigation, is the in situ exchange of the guest molecule CH4 with the guest molecule CO2 [7], hereafter termed gas exchange. The swapping of the two molecules is thermodynamically favored [8,9], takes place spontaneously, and has several benefits:
- The use of fossil natural gas as an energy resource produces CO2. Hence, it is not the ideal choice for a society that is under pressure to mitigate global warming. By sequestering CO2 in gas hydrates during the methane-production process, the carbon footprint of the natural gas can be significantly decreased or even become negative (i.e., more CO2 is stored than is being produced from burning the methane).
- Pressure reduction in the hydrate reservoir is presently considered to be the most economically feasible and least technologically complex strategy for gas production from gas hydrates [10]. When the pressure falls below the stability pressure, the gas hydrates dissociate and the released gas can be produced. A drawback of this production strategy is the endothermic nature of gas-hydrate dissociation [11]. The reservoir cools down and the effect of the pressure decrease is counteracted by a temperature reduction that drives the system back into the thermodynamic gas-hydrate stability field. CH4–CO2 exchange, on the other hand, is a slightly exothermic process [8] and therefore avoids the problem of reservoir cooling. Therefore, combining pressure reduction with gas exchange is considered to be a promising production strategy: while gas hydrate dissociation ensures a rapid mobilization of the CH4 as a gas phase, guest-molecule exchange or rapid reformation of CO2-rich gas hydrates can balance the energy consumption of the dissociation process. This approach has already been tested on a larger scale during the 2012 Ignik Sikumi field test [12,13] by injecting a mixture of N2 and CO2 gas into the reservoir.
- Gas hydrates increase the geomechanical stability of their host sediment [14,15]. When load-bearing gas hydrate is removed during gas production, the sediment can be mobilized and an uncontrollable sand production can occur, as observed in 2013 during a field test in the Nankai Trough, Japan [16]. In the worst case, collapsing or slumping of the continental margin sediments can result in a general geomechanical hazard. Gas exchange, on the other hand, preserves the crystal structure of gas hydrate, thereby preventing the loss of sediment stability.
- Gas-hydrate dissociation occurs when the thermodynamic parameters of the environment change to values outside of the gas-hydrate stability region. This could be triggered during gas production from gas hydrates, but also by warming bottom water temperatures [5]; by pressure reduction due to, for example, isostatic rebound after postglacial melting of ice sheets [17]; or rapid sedimentation events, such as those encountered in active channel–levee systems [18]. Since CO2 hydrates are thermodynamically more stable than CH4 hydrates at a range of relevant temperature and pressure conditions [1], it has been discussed whether a proactive change of the gas hydrate composition by gas production in combination with hydrate conversion could mitigate potential risks from dissociation of gas hydrates occurring near equilibrium conditions.
Despite the apparent benefits of CH4–CO2 hydrate conversion, laboratory-scale experiments revealed several problems: While some hydrate-conversion experiments seemed to confirm the feasibility of the concept [19,20], other researchers observed an unfeasibly slow exchange process (e.g., [21,22]). Moreover, the published results for exchange efficiencies and exchange kinetics vary widely (e.g., see listed comparisons in [21,23]). This is partly due to the fact that most experiments were not conducted at comparable conditions, which highlights a strong effect of initial conditions (e.g., gas-hydrate grain sizes) and process parameters. It is obvious that the interpretation of the experiments and understanding of the overall process is less straight forward than initially thought. For example, the existing state of knowledge at the time of the Ignik Sikumi gas-hydrate production test, in which depressurization of the reservoir was combined with hydrate conversion, was not sufficient to model the production results [13].
The molecular mechanism of the guest-molecule exchange is subject to discussions. The driving force for the exchange is the difference in the chemical potential of molecules in the gas hydrate and in the surrounding fluid phase [24]. This chemical potential difference initiates a fast exchange of molecules at the gas-hydrate surface, which is in direct contact with the fluid. Results from molecular dynamics simulations indicate that the direct contact layer could be exchanged within 20 nanoseconds [25]. Following the fast exchange converting the surface of the hydrate grain, the CO2 molecules need to migrate into the cages of the solid crystalline structure inside of the gas-hydrate grain, and an outbound migration through the crystal lattice is required for the CH4 molecules. This solid-state diffusion (also termed “solid-state percolation” because of the relatively high mobility of the enclathrated molecules compared to conventional solid materials) depends mainly on the deviation of the system from the thermodynamic equilibrium, the thermal energy of the molecules, and the activation energies of the respective steps of the migration process. These steps can include, for example, lattice reorientations, lattice destruction, and reformation or defect hopping. Proposed mechanisms include a complete dissociation and reformation of the crystal lattice [26], the formation of a secondary CO2 hydrate layer on top of the primary CH4 hydrate grain with subsequent breaking and reformation of the underlying lattice structure [27], the dissolution and replacement of the outermost gas-hydrate shell of the primary grain with subsequent diffusion into a mostly intact crystal lattice [28], or the migration of guest molecules through holes in the cage walls after the outermost shell of the gas-hydrate grain had been dissolved and replaced by an amorphous CO2 hydrate [29]. These mechanisms have mostly been derived from computer simulations. Although they are partly consistent with experimental observations, there is no direct experimental proof for any of the proposed concepts.
A full quantitative evaluation of laboratory experiments, which would facilitate a detailed understanding of the dynamic conversion process, is difficult due to the high complexity of the ongoing processes. The sample itself contains a multiple and sometimes even a changing number of phases. Besides the solid gas-hydrate phase, there needs to be a fluid CO2-rich phase that can be either gaseous or, at high pressures, liquid. Depending on the experimental concept, an initial aqueous phase with or without additives like salt ions, and a solid matrix, e.g., sediment, could also be present. The CO2 and the released CH4 mix with a gas phase and can be dissolved in liquid phases. When solubilities are exceeded, additional gaseous or liquid phases occur. An initially pure CO2 phase would not only trigger a gas-exchange process, but would dissolve a fraction of the other molecular components of the sample, namely CH4 and water, in order to reach its equilibrium composition. H2O can dissolve to a few mol ‰ in CO2 liq [30], and gas-hydrate decomposition is highly likely to occur until the solubility equilibrium is reached. The situation at the gas-hydrate grain surface can be even more complex. Released CH4 from dissolving or exchanging gas hydrates is postulated to form microbubbles [31] at the gas-hydrate surface, which would further complicate the description of concentration gradients, component availabilities, and phase distributions. If sufficient amounts of all necessary gas-hydrate-forming molecules are present, either from primary phases or from gas-hydrate dissolution, secondary gas hydrates can form. All of these processes may occur locally and can, therefore, cause significant heterogeneities inside of the sample volume. Dissociation and formation of gas hydrates may result in a local depletion or oversaturation of the involved molecular components. The exothermic (formation and gas exchange) or endothermic (dissociation) nature of the processes changes the local temperature while gas released from gas-hydrate dissociation or gas consumption from gas-hydrate formation influences the pore pressure. In summary, the processes that take place following CO2 injection into CH4 hydrates are highly complex, coupled and depend on a multitude of parameters that might vary on the micro or even the submicro scale. A thorough description of the sample evolution would require the knowledge of at least the following properties and parameters: the shape and radius of the gas-hydrate grains; the distribution of all phases and their constituents in space and time; the solubilities of minor constituents in the fluid phases; the thermal properties and diffusive, convective, and advective transport properties for all components; porosities; surface potentials; gas-hydrate phase boundaries; occupancies of the gas-hydrate cages; local (partial) pressure and temperature; and the energy budget of the involved processes. Obviously, not all of the above-listed parameters are accessible during laboratory experiments. Basic thermodynamic and kinetic parameters are compiled in books as well as review articles and can, for example, be found in [1,14,23,32].
Although there has been a substantial effort by some researchers to precisely control and standardize as many sample properties as possible (e.g., [33]), there is still no experimental setup that allows for a complete characterization of the sample on all relevant scales before, during, and after the exchange. Depending on the experimental setup and the chosen observation techniques, different aspects of the sample and the exchange kinetics can be measured. Phase distributions in gas-hydrate-bearing samples have been measured with magnetic resonance imaging (MRI) (e.g., [34,35,36]), X-ray computed tomography (X-ray CT) (e.g., [37,38]), and electrical resistivity tomography (ERT) [39], in which MRI images molecules in mobile phases, CT discriminates between sample components with sufficiently different atomic numbers, and ERT allows differentiation between more or less conductive materials. None of these techniques can determine the relative amount of CO2 or CH4 in a phase. These properties can only be indirectly deduced from phase transitions that can be attributed to specific component compositions. For the measurement of phase compositions, gas chromatography (GC) (e.g., [21,40,41,42]), solid-state nuclear magnetic resonance (NMR) spectroscopy (e.g., [43,44,45]), neutron diffraction (e.g., [33,46]), and Raman spectroscopy (e.g., [20,22,26,45,47]) have been employed. GC measures the abundance of the different molecules in a produced gas phase, while NMR spectroscopy and neutron scattering aim to assess the solid gas-hydrate phase. Raman spectroscopy, on the other hand, is able to obtain spectra from all of the involved phases. With the exception of confocal Raman spectroscopy, all of these techniques measure bulk properties of the sample. But from the above discussion it is likely that the conversion process is heterogeneous and might involve several simultaneously occurring processes like gas-hydrate dissociation and reformation [26], and the existence of different types of gas hydrate in parallel [48,49]. In this case, the measurement of bulk parameters would average over these processes and the results cannot be attributed exclusively to gas exchange. Pointwise measurements can be obtained with focal-point spectroscopy techniques like confocal Raman spectroscopy [50]. Their results are more meaningful for a singled-out process, but they might not be representative for the overall sample behavior. With bulk measurements, general CO2 retention and CH4 production rates, as well as the overall efficiency of the hydrate conversion, can be measured, while the kinetics and efficiency of a specific process could only be achieved from a local measurement.
Our goal was to investigate which processes take place and to what extent during CH4–CO2 exchange in gas hydrates, and to single out the direct gas exchange for a quantification of the guest-molecule replacement dynamics. To achieve this goal, spectral mapping was performed on grids that extended several 100 µm in the x and y directions. This way, we could follow changes in gas-hydrate composition on a sample region that exceeded several grain sizes. We performed four hydrate-conversion experiments: one with and three without constant flow of the liquid phase. Raman spectroscopic mapping revealed a highly heterogeneous sample evolution, including gas-hydrate dissolution, formation of different types of secondary gas hydrates, and gas exchange. This result could explain some of the disputed findings from other published experiments. Gas exchange on single gas-hydrate grains could be fitted with a regular diffusion equation, and trends in the diffusion coefficients could be restrained.
2. Materials and Methods
The methodologies of the four hydrate-conversion experiments cover different experimental protocols and procedures. During one of the experiments, hereafter termed “Flow”, a steady flow of liquid CO2 was pumped through a sediment/CH4 hydrate matrix. The initial CH4 hydrate was formed from gas-saturated water inside of the sample cell. Three other experiments were conducted with a static gaseous CO2 phase. In one of the experiments, hereafter termed “NoFlow”, the initial CH4 hydrates were also formed from CH4-saturated water. Pressure and temperature conditions were close to the gas/liquid phase boundary, but no condensation was observed, and Raman spectroscopy confirmed the presence of a gaseous CO2 phase. In the other two experiments, CH4 hydrates were formed from exposure of ice grains to a CH4 gas atmosphere. These experiments were termed “NoFlowI1” and “NoFlowI2”. The necessity to perform the experiments within the stability range of all involved gas hydrates demands that the samples are cooled and pressurized. Figure 1 shows a phase diagram for CH4 hydrate, CO2 hydrate, and CO2 [32,51,52]. Phase boundaries for CH4-CO2 mixed-gas hydrates are located between the respective phase boundaries for the pure gas hydrates [7,53,54]. The experimental conditions of the four experiments are marked inside the phase diagram. Experiment NoFlow was performed at 271.85 K and 3.47 MPa. The NoFlowI experiments were measured at 272.05 K and 2.94 MPa (NoFlowI1) and 272.15 K and 2.96 MPa (NoFlowI2), respectively. The realization of experiment Flow required different parameters: a complete freezing of the sample or fast formation of secondary gas hydrates needed to be prevented in order to avoid a blockage of the flow-through cell. Hence, this experiment was performed at a higher temperature and consequently required a higher sample pressure for gas-hydrate stabilization. Temperature and pressure of this experiment were 281.15 K and 13 MPa, respectively.
2.1. Pressure Cells
Two different pressure cells were used in the experiments (Figure 2). Both cells were specifically designed for Raman spectroscopy experiments at pressure and temperature conditions that correspond to conditions in natural gas-hydrate reservoirs. The more basic cell, termed the “standard cell”, was used for the experiments without flow and is a stainless-steel cell with a sample chamber volume of 1 mL. It is fitted with ports for gas inlet, gas outlet, and a temperature sensor. A 6 mm-thick quartz glass window is inserted in the cell cap to allow visual inspection of the sample and nondestructive analysis by Raman spectroscopy. The cell incorporates a heat exchanger circulating cooling liquid and can be operated at temperatures between 273 and 293 K and pressures up to 10 MPa.
The second cell, termed the “flow-through cell”, was designed for flow-through experiments. It consists of a PEEK pressure housing with a long tubular cell of 6 mL volume, hosting 5 sapphire windows arranged along the cell. It is fitted with ports for fluid inlet and fluid outlet. This cell can sustain pressures of up to 15 MPa and temperatures can be controlled in the range from 273 to 303 K. It is thermally coupled to a copper heat exchanger circulating a cooling liquid.
When cooled, a jet of N2 gas is blown over the pressure cell window in order to avoid condensation of moisture from the ambient air.
2.2. CH4 Hydrate Formation
For the experiments NoFlowI1 and NoFlowI2, CH4 hydrate was derived from ice grains that were exposed to a CH4 gas atmosphere (CH4 4.5, Air Liquide Deutschland GmbH, Düsseldorf, Germany). Deionized water was filled in a spray bottle and sprayed into liquid nitrogen. The derived ice grains were sieved to obtain different size fractions. Ice grains with diameters ranging from 100 to 200 µm were filled directly into the standard pressure cell (experiment NoFlowI1) or into a capillary that was placed in upright position in the cooled standard pressure cell (experiment NoFlowI2). Some quartz grains were added to the surface of the sample. The Raman spectra of quartz were used for calibration of the spectrometer and for monitoring and correction of spectral shifts during the measurement period. The pressure cell was flushed four times with CH4 and then pressurized to 10 MPa at 255 K in a freezer. After two days, the cell was transferred to the Raman spectrometer and connected to a Julabo F30C chiller (Julabo, Seelbach, Germany) for temperature control and to a CH4 gas supply for pressure control. The sample was repeatedly cycled through the freezing point of water at temperatures between 274 K and 275 K for an additional 1–2 days. Then, pressure and temperature were lowered to the experiment settings and the sample was allowed to equilibrate for one day. The distribution of CH4 hydrate at the sample surface was mapped with Raman spectroscopy in selected field of views (FOVs) and one or two FOVs were chosen for repeated measurements during the exchange experiment.
In the experiment NoFlow, CH4 hydrate was formed from CH4-saturated water. First, 500 mL deionized water was filled into a stirred reactor (Parr Instrument Company, Moline, IL, USA) and pressurized with CH4 to 9.5 MPa at room temperature (297 K). The standard pressure cell was connected to the reactor and filled with gas-saturated water. Over a period of 5 days, the sample temperature was cycled twice between 275 K and 270 K. Subsequently, the sample was left at 270 K for an additional 22 days. Gas-hydrate formation was confirmed by mapping of selected sample areas with Raman spectroscopy. From these maps, suitable FOVs for hydrate conversion monitoring were chosen.
CH4 hydrates in the experiment Flow were also derived from CH4-saturated deionized water. The flow-through pressure cell was packed with quartz sand with a mean grain size of 0.29 mm and a modal grain size distribution (G20TEAS, Schlingmeier, Schwülper, Germany) and cooled to 268 K. Then, 500 mL of deionized water was pressurized in the stirred reactor with CH4 gas at room temperature (291 K) to 15 MPa and the gas-saturated water was circulated through the cell with a flow rate of 1 mL/min. After three days, gas-hydrate formation caused the sample to clog, stopping the flow. The temperature was raised stepwise to 274 K over three days to resume the flow. CH4 hydrate formation was confirmed by Raman spectroscopy mapping at cell windows 2, 3, and 4. Suitable FOVs for monitoring of the exchange experiment were identified in window 4, downstream of the cell center. The circulation of CH4-saturated fluid was stopped after an additional 60 days.
2.3. CH4-CO2 Exchange Experiments
We used a LabRAM HR 800 confocal Raman microscope (Horiba Jobin Yvon, Bensheim, Germany) to map the gas-hydrate conversion. Exchange experiments with the standard cell were started by reducing the CH4 gas pressure to the specified experiment pressure and by adjusting the temperature to about 272 K. CO2 gas (CO2 4.5, Air Liquide Deutschland GmbH, Düsseldorf, Germany) was then pumped through the sample with a Teledyne ISCO syringe pump (Teledyne ISCO, Lincoln, NE, USA) for a few minutes and the exchange of the gas phase was monitored with Raman spectroscopy. When the signal of the gaseous CH4 had disappeared, all valves were closed. Before the inflow of CO2, a Raman map of the initial CH4 hydrate distribution was taken. After the gas phase exchange finished, Raman spectral maps were measured either continuously or during selected time periods. The spectral range of the maps was alternated among 139 cm−1 to 2270 cm−1 for the CH4 signal and 2211 cm−1 to 3953 cm−1 for the CO2 and OH bands. The Raman parameters for the experiments are listed in Table S1. The NoFlowI experiments were measured with a fast imaging mode (DuoScan and SWIFT mode of the spectrometer) in which the size of the Raman laser beam was expanded by a vibrating mirror to several tens of µm in the x and y planes (DuoScan), and measurements were taken not pointwise, but during constant movement of the sample through the laser beam (SWIFT). In contrast to the strictly confocal pointwise measurements, in which a pixel of the spectral map represents only a few µm of the sample and there is no information from areas in-between two grid points, the pixel in spectral maps from those fast imaging techniques include signal from the full area between grid points.
The flow-through experiment was performed at a higher sample temperature of 281.15 K to avoid a clogging of the cell by the potential formation of ice or a fast secondary gas-hydrate formation near the fluid inlet of the cell. CO2 was injected by a Teledyne ISCO syringe pump with an inlet pressure of 13 MPa and a flow rate of 0.02 mL/min. After 7 h of injection, the sample clogged due to CO2 hydrate formation and the pump switched off. The flow could be resumed after a holding period of 13 h, but the cell clogged again after 2 h of operation and the flow could not be reinstalled during a second holding period of 3 h. Then, 25 h after the start of CO2 injection, the temperature was increased to 283 K and the operation could be continued.
2.4. Evaluation of Raman Data
The peaks of the measured Raman spectra were fitted with linearly weighted Gaussian–Lorentzian line shapes (pseudo-Voigt) using the spectrometer software (Labspec 6, Horiba Jobin Yvon, Bensheim Germany). Peaks of CH4 and CO2 in the gas, liquid, and gas-hydrate phases differ in position and in peak width and can therefore be distinguished [56,57]. The peak areas were exported from the Labspec software, and data from different time points were merged with a Matlab script (The Mathworks, Nattick, MA, USA). Gas-filled areas of the sample were identified, and from these areas, a noise threshold for the gas-hydrate signals was generated. Signal values smaller than the threshold were set to zero. Obvious outliers of the data were removed after visual inspection. All maps were inspected for potential shifts in x or y due to inaccuracies of the xy-table movement, and recognized shifts were corrected. Afterward, the maps were cut to the area that was covered in all shifted maps of the series. Then, the final maps for CH4 and CO2 hydrates were subtracted from the first maps. All pixels with gas hydrates in the first and/or the final map were attributed a process according to the following criteria:
- CH4 hydrate dissociation: no CO2 hydrate signal and decreasing CH4 hydrate signal
- Secondary (sec.) CH4 hydrate formation: no CO2 hydrate signal and increasing CH4 hydrate signal
- Secondary (sec.) CO2 hydrate formation: no CH4 hydrate signal and increasing CO2 hydrate signal
- Secondary (sec.) mixed-hydrate formation: increasing CH4 hydrate signal and increasing CO2 hydrate signal
- Gas exchange Type 1 (CH4 exchanged with CO2): decreasing CH4 hydrate signal and increasing CO2 hydrate signal
For the evaluation of the second period of the Flow experiment (CO2 flow halted after clogging of the pressure cell), additional processes had to be defined. The initial signals of this time series correspond to the signals at the beginning of the hold period and include CO2 hydrates and mixed hydrates that formed during the first flow period. Hence, the transformation of these additional phases needs to be considered:
- CO2 hydrate dissociation: no CH4 hydrate signal and decreasing CO2 hydrate signal
- Mixed-hydrate dissociation: both gas hydrate signals initially present; decreasing CH4 hydrate signal and decreasing CO2 hydrate signal
- Gas exchange Type 2 (CO2 exchanged with CH4): CO2 hydrate signal initially present; increasing CH4 hydrate signal and decreasing CO2 hydrate signal
The signal of all pixels of a map with the same attribute was summed up in order to follow the time evolution of the respective processes. In the case of CH4 hydrate, the signal was normalized to the total initial CH4 gas-hydrate signal. For the CO2 hydrate signal, the normalization was not that straightforward: The experiment was not run long enough to reach the equilibrium concentration of CO2. Hence, the signal could not be normalized to the signal of the final steady state, but was normalized to the total signal of the last map of the experiment. Unfortunately, this did not allow us to relate the inventory changes to the initial gas-hydrate content, but the observed trends were clear and continuous, and we expect that the derived conclusions are still relevant.
Cage occupancy ratios of CH4 molecules in large cages and small cages in the CH4 hydrate lattice were calculated from the equation:
where AL and AS are the fitted peak areas for large cage signals and small cage signals, respectively; θ are cage occupancies for large (L) and small (S) cages; and the F factors are the quantification factors FML = 1.01 and FMS = 1.12 [58]. The cage occupancies are related to the overall numbers of large cages and small cages, respectively. Both CH4 and CO2 gas hydrates, as well as mixed hydrates of these gases, are structure 1 (S1) gas hydrates. Hence, there is no structural change and only a minor change in the lattice constant from 11.83 to 11.82 during the transition [46]. The factor 1/3 in the equation accounts for the fact that the number of large cages in the SI structure is three times the number of small cages [1].
cr = θL/θS = (AL × FMS)/(3AS × FML),
For the evaluation of the gas-exchange process, single gas-hydrate grains with confirmed gas exchange were selected, and the signal evolution on these grains was evaluated separately.
2.5. Evaluation of Gas-Exchange Dynamics
Confocal Raman measurements collect the signal from restricted volumes within the gas-hydrate grain. Since the movement of the guest molecules through the gas hydrate grain is considered to be a solid-state diffusion process, we used the analytical solution of the diffusion equation [59] in spherical coordinates to derive the concentration of the compound C(r,t) as function of time t and radius r [60,61]. For the outward-migrating CH4, we get:
and for the inward-migrating CO2, we derive:
where j is an index, C0 is the initial concentration, D is the diffusion coefficient, R0 is the grain radius, and r is the radial position of the focus point in the grain. Regression parameters for this equation are C0, r/R0, and D/R02. The measured signal was normalized to the initial signal and C0 was allowed to vary between 0.9 and 1.1 to account for noise.
The CO2 signal turned out to be too noisy for a reliable regression of the data and the final concentration of C0 was unknown since the experiments were aborted before the equilibrated CO2 concentration was reached. Errors of the regression parameters tended to be larger than the parameters itself. Therefore, a proper quantification of the CO2 diffusion into the gas-hydrate grains was difficult. Data regression was feasible when the parameter r/R0 was adapted from the regression results of the CH4 data, but the resulting diffusion coefficients are less certain than the CH4 diffusion coefficients.
3. Results
In the following subsections, we describe the results from the four different experiments.
3.1. Experiment NoFlow
Twenty-four sets of spectral maps (CH4 and CO2 maps) were measured during the experiment NoFlow. The first map was started directly after the pressurization with CO2. Eight more map sets were measured during the time period of 22.7 to 28.9 h after the start of the CO2 exchange, and a set of two spectral maps was derived every 54.5 min. Fifteen maps were measured during the time period of 34–95.2 h after the start of the CO2 exchange. Here, a set of maps was derived every 74 min due to an additional waiting time between map acquisitions. The map size was 130 µm × 130 µm and Δx and Δy between two points of the map were both 4.06 µm. The number of grid points was 32 in each direction, resulting in a total of 1024 spectra per map. After correction for spatial shifts, the map size had to be reduced to 23 × 29 pixels and a FOV of 93.4 µm × 117.7 µm.
Figure 3 shows the initial CH4 hydrate map and CH4 and CO2 hydrate maps after 29, 60, and 91 h. A number of CH4 hydrate grains, which, due to the restricted resolution, are not clearly outlined, can be seen in the upper 2/3 of the map. The increase in CO2 hydrate signal in this region did not affect all grains, but occurred mainly between 20 and 50 µm in x and 0 and 40 µm in y. Other areas show different processes. An increase of CH4 hydrate can be observed in the upper-left corner, and an increase in both CH4 hydrate and CO2 hydrate took place in the lower-right corner, indicating the formation of secondary mixed-gas hydrate. Dissociation of CH4 hydrate was, for example, taking place in a region close to the coordinate x = 70 µm and y = 30 µm. Secondary CO2 hydrate formation can be observed rapidly after CO2 injection in the lower third of the map, but did not increase much over time.
Figure 4 shows the time development of the ongoing processes in the FOV. At t = 0, only CH4 hydrate signal was present. The total CH4 hydrate signal decreased to 79% of its initial strength in 95 h. As outlined in Section 2.4, all pixels of the gas-hydrate maps were evaluated with respect to signal changes and attributed to a matching formation, dissociation, or exchange process. The time evolution of signals from sample areas with the same specific process is also shown in Figure 4. The first values of these curves represent the fraction of the initial CH4 hydrate signal that will be changed by the specific process in the course of the experiment. Consequently, the starting values of all CH4 hydrate processes add up to 1 (or 100%, with rounding errors only 99% in this specific case). In theory, the starting values for the secondary gas-hydrate-formation processes should be zero. In reality, they can be nonzero due to noise or because the secondary gas hydrates overgrow existing CH4 hydrate structures, which still contribute to the signal as long as the covering layer is thin enough for the laser beam to pass through. In this case, the first value of the curve represents the signal from CH4 hydrates, which will be overgrown by secondary gas hydrates. The difference between the first and the last value of the curves for the different processes depicts the fraction of the overall signal change that is caused by the respective process.
It can be observed that only 41% of the initial signal belonged to pixels that would undergo gas exchange in gas-hydrate grains during the observed experimental period, and 35% of the initial signal originated from areas where CH4 hydrate dissociated during the experiment. Secondary gas-hydrate formation affected 23% of the initial signal: 13% was subject to mixed-hydrate formation, and 10% was subject to CH4 hydrate formation. The total signal change of −21% to 79% was caused by −14% signal change due to gas exchange, –14% signal change due to gas-hydrate dissociation, +4% signal change due to secondary mixed-hydrate formation, and +3% signal change due to secondary CH4 hydrate formation. Results are also listed in Table 1. The dominant processes were gas exchange and gas-hydrate dissociation, which contributed equally to the decrease in the CH4 hydrate signal. A total of 25% of the released CH4 was bound again in secondary gas hydrates within this FOV.
The CO2 content in gas hydrates was assumed to be zero at the start of the experiment and indeed, no signal above the noise threshold could be derived from the first map (t = 0). As for the CH4 hydrate signal, curves for attributed processes are included in the graph. The results are listed in Table 2: Of the 100% signal increase during the experiment, 49% was caused by gas exchange, 38% by secondary mixed-hydrate formation, and 13% by secondary CO2 hydrate formation. The noise in the spectral CO2 hydrate maps 2–9 was significantly higher than in the last 15 maps. As a consequence, the signals from the first 9 maps were omitted for all data fits.
Two gas-hydrate grain regions with confirmed gas exchange were chosen for evaluation of the diffusion constant (marked in Figure 3). The signal of all pixels of the selected grain areas was summed up and fitted with Equation (2). Results are summarized in Table 3. The parameter DCH4/R02 was (0.69 ± 0.25) × 10−7 1/s for grain 1 and (0.55 ± 0.11) × 10−7 1/s for grain 2. It was not possible to precisely determine the grain radius R0 for an accurate calculation of the diffusion coefficient D, since the resolution of the maps was not fine enough. The radius of the evaluated areas, as derived from the maps, was 15 µm for grain 1 and 10 µm for grain 2, but out-of-focus contributions might be missing here. From the maps, the maximum grain diameter could be estimated to be 30 µm, but the resolution was not good enough to ensure that the structure belonged to a single grain and not multiple grains that touched each other. Taking the grain area radius as the lowest possible radius and the map-derived radius as highest possible radius, the corresponding diffusion coefficients for CH4 ranged from 15.6 × 10⁻¹⁸ to 62.2 × 10⁻¹⁸ m2/s for grain 1 and from 5.5 × 10⁻¹⁸ to 49.8 × 10⁻¹⁸ m2/s for grain 2. The integrated CO2 signal of the grain areas was fitted with Equation (3) and the parameter r/R0 was set to the value that was obtained from the CH4 hydrate regression. Again, D/R02 was in the order of 10−7: (2.4 ± 0.58) × 10−7 1/s for grain 1 and (0.33 ± 0.11) × 10−7 1/s for grain 2. Considering the possible range for R0, the diffusion constant DCO2 was 54.7 × 10⁻¹⁸ to 218.7 × 10⁻¹⁸ m2/s for grain 1 and 3.4 × 10⁻¹⁸ to 30.2 × 10⁻¹⁸ m2/s for grain 2. The signal curves of the grains and the regressed curves are shown in Figure 5.
3.2. Experiment NoFlowI1
A total of 46 spectral maps for CH4 and the same number of maps for CO2 were measured during this experiment. The first map was started directly after the pressurization with CO2. The first five maps for each component were measured with an acquisition time of 0.5 s per data point, and a pixel corresponds to the integral signal of an area of 20 µm × 20 µm. The field of view was 500 µm × 360 µm and the total acquisition time was 12 min per set of maps with fast imaging techniques. The subsequent 15 pairs of spectral maps were measured with an acquisition time of 0.5 s, a total acquisition time of 40 min per set of maps, and a pixel size of 10 µm × 10 µm. Then, 26 more pairs of spectral maps were collected with an acquisition time of 1 s, a total acquisition time of 77 min per set of maps, and a pixel size of 10 µm × 10 µm. The field of view remained constant among all maps, and the last data set corresponds to the time 46.7 h after the start of the hydrate conversion. The first five maps were regridded to match the resolution of the other maps, but the CH4 data did not match the signal evolution of the subsequent data. Hence, the first five data points were omitted in all fits of CH4 hydrate data.
Figure 6 shows the initial CH4 hydrate map and CH4 and CO2 hydrate maps after 15, 30, and 45 h. Two larger gas hydrate grains can be seen in the upper-left quadrant, and a number of smaller grains are located in the lower-right quadrant of the field of view. CH4 hydrate dissociation clearly took place in the upper-right quadrant. A simultaneous increase in CH4 hydrate signal and CO2 hydrate signal occurred at the right side around y = 250 µm, indicating the formation of secondary mixed gas-hydrates. Secondary CO2 hydrates were formed rapidly in the pore space between the original grains at x ~ 50 µm and x ~ 250 µm. The two larger gas-hydrate grains could not be used for an evaluation of the exchange kinetics since the left grain was partly overgrown by secondary CO2 hydrate and the right grain exhibited, in parts, an increase in CH4 signal, indicating a growth of secondary mixed or CH4 hydrate. Therefore, three areas in the lower-left quadrant of the FOV were chosen for evaluation. These areas are indicated as grains 3, 4, and 5 in Figure 6. Again, the resolution of the image was not good enough to reliably determine the outlines and sizes of present gas-hydrate grains.
Figure 7 shows the time development of the ongoing processes. Signals were normalized to the CH4 hydrate signal of the 6th map (first map with 10 µm resolution) and to the final CO2 hydrate signal. Table 1 lists the changes in inventory for CH4, and Table 2 for CO2. The total CH4 hydrate signal decreased to 71% during 44 h. This total signal was again divided into fractions that were exposed to the same type of process during the course of the experiment. The dominant fraction, with a contribution of 59% to the total signal, was affected by gas exchange. This signal fraction was responsible for a signal loss of 23% of the total signal. A fraction of 20% of the initial signal was affected by CH4 hydrate dissociation, which was responsible for 10% of the total signal loss; 18% of the signal belonged to pixels with formation of secondary mixed hydrates; and 3% belonged to pixels with formation of secondary CH4 hydrates. The signal increase caused by these processes was 3% and 1%, respectively. Unlike experiment NoFlow, only 4% of the released CH4 was bound again in gas hydrates in the observed area. The CO2 content in gas hydrates started at zero, and the experiment was not run long enough to reach the equilibrium concentration of CO2. Hence, the signal could not be normalized to the final equilibrium signal, but needed to again be normalized to the final total signal in the experiment. Similar to the CH4 hydrate, the dominant process was the gas exchange in existing CH4 hydrate. This process contributed 49% to the rise in CO2 hydrate signal, while the formation of secondary mixed hydrates contributed 28%, and the formation of secondary CO2 hydrates contributed 23%. In conclusion, ~50% of the CO2 bound in gas hydrates was involved in gas exchange, and ~50% was bound in newly formed secondary gas hydrates.
Three gas-hydrate grain regions with assigned gas exchange were chosen for evaluation of the diffusion constant. The positions of the grain areas are marked in Figure 6. The signal of all pixels of the selected grain areas was summed up and fitted with the diffusion equation. Results are visualized in Figure 8 and summarized in Table 3. The parameter DCH4/R02 was (0.09 ± 0.18) × 10−7 1/s for grain 3, (2.08 ± 0.55) × 10−7 1/s for grain 4, and (2.52 ± 0.47) × 10−7 1/s for grain 5. From the evaluation of the CO2 hydrate signal, we derived DCO2/R02 = (1.19 ± 0.17) × 10−7 1/s for grain 3 and DCO2/R02 = (17.2 ± 2.44) × 10−7 1/s for grain 4. The signal from grain 5 was too noisy for a regression. The higher variability of the results originated from the higher noise in the CO2 maps, which was a consequence of the generally lower signal in the maps. Again, the grain radii could not be reliably determined. The ice grains were sieved to a fraction of 100 µm to 200 µm diameter, but the grains in the maps appeared to be more around 100 µm diameter or a bit smaller. Grain diameters as derived from the maps were 70, 50, and 40 µm, respectively, for grains 3, 4, and 5. With these size estimates, the range for the diffusion constant DCH4 resulted in 11.0 × 10⁻¹⁸–22.4 × 10⁻¹⁸ m2/s for grain 3, 130.0 × 10⁻¹⁸–520.0 × 10⁻¹⁸ m2/s for grain 4, and 100.8 × 10⁻¹⁸–630.0 × 10⁻¹⁸ m2/s for grain 5; and the value for the diffusion constant DCO2 ranged from 145.8 × 10⁻¹⁸–297.5 × 10⁻¹⁸ m2/s for grain 3 and 1075 × 10−18–4300 × 10−18 m2/s for grain 4.
3.3. Experiment NoFlowI2
Spectral mapping during experiment NoFlowI2 started only 20 min after pressurizing the sample cell with CO2. Maps with three different accumulation times were measured: The first eight map sets, which were measured in the first 4 h after the start of the hydrate conversion, had an accumulation time of 0.5 s, followed by eight map sets with a 1 s accumulation time during the next 6 h. One 0.5 s map set was measured at 18 h, and eight more 1 s map sets were measured between 18.5 h and 24 h. The final 10 maps had an acquisition time of 2 s and were measured between 26 and 40.5 h after the start of the hydrate conversion. The resolution of the maps was 10 µm in both the x and y directions for all maps, and the total acquisition time for one set of maps was 26 min for 0.5 s acquisition time per pixel, 49 min for 1 s acquisition time per pixel, and 95 min for 2 s acquisition time per pixel. Fast imaging techniques were used for all measurements. Each map set included two spectral maps in the range of the CH4 signal that covered two different FOVs, and the corresponding two spectral maps in the range of the CO2 signal. Both FOVs included a part of a quartz grain, and the quartz signal was used for spectral calibration. Unfortunately, the quartz grains moved significantly during the experiment, while the gas-hydrate grains remained fixed. As a consequence, one FOV needed to be excluded from data evaluation because the quartz grain occasionally covered too large a fraction of the gas-hydrate grains. The second FOV was reduced from 210 µm × 270 µm to 210 µm × 210 µm in order to cut out the region where the moving quartz grain was located.
Figure 9 shows the first CH4 hydrate map and CH4 and CO2 hydrate maps after 10, 26, and 40 h. It is striking that the CO2 hydrate signal appeared very locally, while almost all CH4 hydrates were affected by dissociation. At first sight, secondary CO2 hydrate formation seemed to take place at the lower edge of the FOV. However, the CH4 signal in this region also rose, although to a much lesser extent. Hence, there was an ongoing formation of secondary CO2-rich mixed hydrates, probably with local formation of pure CO2 hydrate. Only two CH4 hydrate grains seemed to be subject to gas exchange. Both were located between x = 100 µm–150 µm, with y ~ 50 µm for the first grain and y ~ 125 µm for the second grain. On a closer look, the grains showed patches with increasing, as well as patches with decreasing CH4 concentrations, indicating that several processes seemed to take place on the same grains in parallel. Consequently, it was not possible to evaluate guest-molecule diffusion on single grains.
The time development and the impact of the ongoing processes is shown in Figure 10. Signals were normalized to the CH4 hydrate signal of the first map and to the final CO2 hydrate signal. Table 1 and Table 2 list the changes in inventory. The total CH4 hydrate signal decreased to 76% of the initial signal during 40 h. The dominant process was gas-hydrate dissociation, as expected from the trend in the maps in Figure 9. CH4 hydrate dissociation accounted for 18% signal loss. A fraction of 62% of the initial signal was affected by this kind of process. The signal loss due to gas exchange was 9%, and contributed, to a much lesser extent than dissociation, to the changes of the CH4 hydrate signal. 22% of the total signal experienced signal reduction from gas exchange by the end of the experiment. The overall signal loss was partly counteracted by the formation of mixed secondary gas hydrate (+2%, affecting 5% of the initial signal) and the formation of secondary pure CH4 hydrates (+2%, affecting 10% of the initial signal). The deviation of the sum of the contributions from the 100% total signal loss was a rounding error. The contributions to the rise of the CO2 hydrate signal were quite similar for all three processes: a 26% rise from secondary CO2 hydrate formation, a 33% rise from secondary mixed-hydrate formation, and a 41% rise from gas exchange were observed. After a relatively slow start, gas exchange and secondary CO2 hydrate formation showed an above-average growth rate during the final hours of the experiment. Upon a closer look, it was noticeable that, for extended periods, the three process signals did not sum up to the total CO2 hydrate signal. The reason for this behavior was a feature of the evaluation procedure: Only pixels with a CO2 hydrate signal in the final map were assigned one of the three processes. The temporary surplus in the total signal stems from pixels that had a CO2 hydrate signal during intermediate times, but not in the final map. This especially occurred between 4 h and 28 h. The additional CO2 hydrate signal was discontinuous, similar to the signal in the 10 h map in Figure 9. Either the data contained enhanced noise signals during this time, or some of the CO2 hydrate dissociated again during the course of the experiment.
This experiment was the most difficult to interpret among the presented experiments. The ongoing processes were not well separated, and the assignment of processes to pixels was uncertain. No CH4 hydrate grains with pure or at least highly dominant gas exchange could be identified, and no diffusion coefficients were obtained.
3.4. Experiment Flow
The experiment Flow was the most complex among the presented experiments: It was operated in flow-through mode in a pressure cell filled with quartz sand. During the experiment, secondary gas hydrate formation changed the permeability of the sample and caused a change of the sample pressure. The pressure log close to the entrance of the sample cell is presented in Figure S5. The pressure was relatively constant around 13 MPa during the first 2 h, then it rose to 15 MPa over the next 4 h. When the pressure peaked above this value, the pump was automatically shut off to protect the pressure cell. This shut-off happened at late evening and was not noticed by an operator until 13 h later. During this period, the pressure dropped again to 14 MPa and the sample was at no-flow conditions. By coincidence, the FOV and the map resolution were changed shortly before the pump went idle, and the data set divided into two subsets: 6 sets of maps were taken at flow conditions and had a pixel distance of 100 µm in the x and y directions, a FOV size of 4200 µm × 2900 µm, and a total acquisition time of 60 min per set of maps. This series was succeeded by 10 sets of maps that were measured without flow, with a pixel distance of 20 µm in the x and y directions, a FOV size of 1200 µm × 1200 µm, and an acquisition time of 80 min per set of maps. It was possible to restart the flow again, and two more maps with 100 µm × 100 µm resolution could be sampled, but 2 h later, a more severe blockage occurred. This time, the flow could only be resumed after raising the sample temperature to 10 °C. At this temperature, the pressure remained relatively stable for the next 15 h. However, since temperature changes have a strong effect on dynamics, we refrained from including data from this period into our evaluation.
Figure 11 shows the CO2 hydrate maps from times 0, 3, and 17 h. The first three maps cover the flow period before the first blockage, and the 17 h map was taken following the restart of the flow. A white rectangle marks the position of the smaller FOV from the high-resolution measurements during the no-flow period. The 0 h CO2 hydrate map illustrates the slow progression of the liquid CO2 into the sample: at this time, the CO2 front had reached the FOV, but had not proceeded into the upper 600 µm. Actually, the map was taken 2 h after start of the CO2 flow, but there was no CO2 present in two earlier measurements, and the time scale was shifted by 2 h in order to assign the time zero to the first contact with CO2. Unfortunately, the earlier CH4 gas-hydrate maps could not be used as initial gas-hydrate-concentration maps, because the exchange of the pore fluid changed the refractive index, which resulted in a changed focus depth. It is noticeable that rapid secondary gas hydrate formation took place in the pore space in-between the CH4 hydrate grains. This secondary gas hydrate was partly a pure CO2 hydrate and partly a mixed-gas hydrate with a high fraction of CO2. As shown in the following maps, the CO2 hydrate signal also expanded into the region of the CH4 hydrate grains, indicating gas exchange. The CH4 hydrate maps revealed several clusters of CH4 hydrate grains. Due to the low resolution of the maps, the outline of the grains was badly resolved. But from high-resolution maps, it can be seen that the grain diameters could be up to several 100 µm, which was much larger than the grains in the other experiments. The time evolution of the gas-hydrate maps revealed a quite uniform behavior: After rapid formation of CO2 or CO2-rich secondary gas hydrates, mainly gas exchange took place.
A closer look into the different possible processes and their time evolution confirmed that the dominant contribution to the CH4 hydrate signal change came from gas exchange. Figure 12 shows the time development of the ongoing processes. As for the other experiments, total signals were normalized to the initial CH4 hydrate signal and to the final CO2 hydrate signal. The total CH4 hydrate signal decreased to 43% of its initial strength in 5 h, which was much more rapid than in the experiments without flow. Of this signal, 93% belonged to pixels that would undergo gas exchange in gas-hydrate grains during the observed experimental period, and 56% of the total signal was lost due to this process. An additional 3% of the total signal was lost because of CH4 hydrate dissociation, which was almost balanced by a 2% signal increase due to the formation of secondary mixed hydrates. The affected fraction of the total signal was 5% for secondary gas-hydrate formation and 2% for gas-hydrate dissociation. There was no significant indication for secondary CH4 hydrate formation. The mixing of released CH4 with the flowing liquid CO2 seemed to be sufficiently effective in avoiding high local CH4 concentrations that could reprecipitate as secondary CH4 hydrate.
The increase in CO2 content in the gas-hydrate phase was also highly affected by gas exchange (+56%), but also to a large extent by the formation of secondary mixed hydrates (+38%). Pure CO2 hydrates accounted for only 6% of the signal increase. This apparent contradiction to the CH4 hydrate evolution, in which almost all of the signal change was attributed to gas exchange, originated in the fact that the secondary mixed hydrates were CO2-rich and contributed more to CO2 signal rise than to CH4 signal rise. The observed rapid formation of secondary gas hydrates required free water, but almost no gas-hydrate dissociation could be observed. This means that either the water from the gas-hydrate-formation step was not removed efficiently before the exchange experiment was started, or gas-hydrate dissociation did occur in sample volumes that were not included in the FOV and were therefore not monitored.
Solid-state diffusion coefficients for CH4 and CO2 were evaluated at 12 different grain positions. Grain locations are marked in Figure 11. The evolution on the single-grain signals are presented in Figure 13 and the results of the regressions are listed in Table 3. Values for DCH4/R02 ranged from 33 × 10−7 to 79 × 10−7 1/s, and values for DCO2/R02 ranged from 31 × 10−7 to 236 × 10−7 1/s. The average values were 60 × 10−7 1/s for CH4 and 109 × 10−7 1/s for CO2. As in the other experiments, the evaluation of the CO2 hydrate data was more prone to noise, which was reflected in the broader range of diffusion constants and the relatively high errors of the regression parameters. Due to the coarse resolution, it was more difficult to estimate the gas-hydrate grain radii. The more finely resolved maps in Figure 13 contain gas-hydrate grains with radii of about 100 to 250 µm. With this range of R0, we calculated solid-state diffusion coefficients in the range of 10−13 to 10−14 m2/s for both CH4 and CO2, with DCO2 being roughly twice as large as DCH4.
The evolution of the gas-hydrate phase during no-flow conditions was monitored on a smaller FOV with higher resolution. This provided a better insight into the ongoing processes, but did not enable us to directly link signal amplitudes from the flow period to signal amplitudes from the no-flow period. Figure 14 shows CH4 hydrate and CO2 hydrate maps that were taken 5, 10, and 15 h after the first contact with the liquid CO2 phase, with the 5 h maps being taken around the time when the flow stopped. A striking feature of the CO2 hydrate map is a patch of pure CO2 hydrate in the lower half of the FOV. This patch did expand over time, and it also showed increasing CH4 hydrate signal in the CH4 hydrate maps. The patch grew toward the initial CH4 hydrate grains and began to cover them. A map of the relative CH4 hydrate cage-occupancy ratio change during this time period is also included in Figure 14. The color scale of the map was cut at −1 and 1 to ensure a sufficient contrast of the image. While the cage-occupancy ratio of the initial gas-hydrate grains decreased over time due to further exchange of CH4 with CO2 or a resettling of CH4 molecules to small cages, the cage-occupancy ratio increased on the secondary CO2 hydrate patch. This means that we need to consider an additional process: gas exchange of CO2 with CH4 in CO2 hydrate grains or mixed-hydrate grains with high CO2 content. An increase of the cage-occupancy ratio can also be observed at the edge of the initial CH4 hydrate grains, where the CO2-rich secondary gas hydrate patch touched the CH4-rich primary gas hydrates. What we observed here was an overgrowth of the initial grains with CO2-rich mixed-gas hydrate. The integral evolution of the mean cage-occupancy ratio is presented in Figure S4. A fast decay from 1 to 0.65 caused by rapid gas exchange during the flow period was followed by a slower exchange from 0.65 to 0.6 during the no-flow period. Here, a slowed-down exchange during no-flow conditions was additionally counteracted by an increase of the cage-occupancy ratio in regions that were subject to the reverse exchange process.
Three additional possible processes were added to the process attribution for the no-flow period: the exchange of CO2 with CH4 in gas hydrates, the dissociation of mixed-gas hydrate, and the dissociation of pure CO2 hydrate. In order to distinguish the two types of gas exchange, we used the term “exchange 1” for exchange of CH4 with CO2 and the term “exchange 2” for the exchange of CO2 with CH4. Actually, it was not clear if a rise of CH4 concentration in CO2-rich gas hydrates was an exchange process or an overgrowth of existing gas hydrate with a secondary mixed hydrate that was more enriched in CH4, but we considered the definition of the process as gas exchange as a valid and likely choice as long as no further information was available. Figure 15 shows the time evolution of the different processes. This is the only case in which CO2 was already present in gas hydrates at the beginning of the evaluation period. Deviating from the quantification of the other experiments, CO2 data were normalized to the first total signal value and not to the last. It was noticeable that the overall signals for both guest molecules increased. The total CH4 hydrate signal increased by 17% during the 13 h time period. The total rise of the CH4 hydrate signal required a source of methane, which was most likely gas-hydrate dissociation outside of the measured sample area, but also could have been a reabsorption of freed CH4 from gas exchange that could not be transported away when the flow stopped. Only a small amount of gas-hydrate dissociation was observed. The signal from the fraction of pixels that underwent mixed-gas-hydrate dissociation (8% of the total signal) contributed with −2% to the overall signal change during the experimental period, and the signal from pixels with detected CH4 hydrate dissociation (16% of the total signal) contributes to a −4% signal change. The pure CH4 hydrate contributed 18% to the signal, and its growth increased the total signal by 7%. Most of the signal (59%) was associated with mixed-gas hydrates: the growth of secondary mixed hydrates (CO2 and CH4 hydrate signal increased simultaneously) was attributed to pixels that contributed 32% of the initial total signal and caused 18% of the total increase. A further 3% signal increase originated from the exchange of CO2 with CH4 (4% of the initial total signal affected), while 6% of the signal was lost due to exchange of CH4 with CO2 (23% of the initial total signal affected).
The total CO2 hydrate signal growth was 46% over the time span of 13 h. With 47% of the initial signal and a rise of 33%, the formation of new secondary mixed hydrates was the major process for binding of CO2 in gas hydrates. Gas exchange of CH4 with CO2 (+11%) and the formation of secondary CO2 hydrate (+10%) also contributed substantially to the signal change. These two processes affected pixels with 9% and 6% of the initial signal, respectively. Loss of CO2 from gas hydrates was relatively small and was caused by three different processes: CO2 hydrate dissociation (−2%, 4% of the initial signal), mixed-hydrate dissociation (−3%, 7% of the initial signal), and exchange of CO2 with CH4 (−3%, 25% of the initial signal).
4. Discussion
4.1. Comparability of the Experiments and Limitations of This Study
In this study, we present and evaluate data from four experiments with different experimental conditions. Three experiments (NoFlow, NoFlowI1, and NoFlowI2) were performed at similar pressure and temperature conditions, while experiment Flow was performed at higher pressures and temperatures. Kinetic processes depend considerably on the temperature. Therefore, obtained kinetic parameters like diffusion coefficients were expected to differ among the NoFlow and Flow experiments. The larger diffusion coefficients, which were derived from experiment Flow, reflect the higher mobility of molecules at higher temperatures and support the plausibility of our results. However, they cannot be used to prove the repeatability of the results. The same is true for the presence of the liquid CO2 phase in experiment Flow. The higher concentration of CO2 molecules in the fluid phase was expected to enhance the exchange process.
Another difference among the experiments was the presence of a porous matrix. In experiment Flow, the gas hydrate was formed in a sand matrix, while experiment NoFlow was set up completely without sand, and only a few sand grains were put loosely on top of the gas-hydrate grains in the NoFlowI experiments. The sand matrix affected the experiment in two ways: transport of the constituents was hindered by the tortuous pathways in the sample and the chemical potential of the gas-hydrates changes in the vicinity of the quartz surface [36]: Chaouachi et al. [37] observed that gas-hydrate grains do not grow directly in contact with quartz-grain surfaces. We postulate that the presence of sand was not relevant to the results of our study, since we could only observe gas-hydrate grains that were located directly at the surface of the sample and were not covered by quartz grains.
The difference among the diffusive transport in the gas phase of the NoFlow experiments and the advective transport in the liquid phase of the Flow experiment did not seem to have much influence on the results either. Both set-ups allowed for a sufficiently fast transport of the molecules in the fluid phase.
A larger concern was the different gas-hydrate-formation protocols. For two experiments, gas hydrates were formed from ice grains, and for another two experiments, gas hydrates were formed from a gas-saturated aqueous solution. Since the temperature was cycled several times above the freezing point of water during the ice/gas hydrate conversion, we expected that only gas-hydrate structures were left, and that the crystal lattice did not differ among grains from different formation protocols. But the ripening time of the crystals was drastically different and varied from 1–2 days in experiments NoFlowI to 60 days in experiment Flow. During the ripening period, empty cages, which are expected to occur, especially in ice-derived gas hydrates, are filled by diffusion of guest molecules from the surrounding liquid into the crystal lattice, and the average grain size increases due to Ostwald ripening [62]. The cage-occupancy ratios of the initial CH4 hydrates (Figures S1–S4) indicated that only experiment Flow was performed with fully evolved gas-hydrate crystals. CH4 hydrates from the other experiments incorporated a significantly higher number of empty cages, which might have facilitated the diffusion of molecules through the lattice.
The analysis of the microscale processes was not affected much by the listed experimental differences. Here, the main source of error was the noise in the spectral maps. We observed the same processes during all of the experiments, but with a rather large spatial inhomogeneity. Hence, intersample differences were comparable with intrasample differences. As long as we cannot map areas with hundreds of gas-hydrate grains with a spatial resolution of less than 100 µm, we can measure only trends and general characteristics, and these were consistent for all of the experiments.
The quantification of diffusion coefficients requires the precise control and the exact knowledge of all relevant parameters. This type of experiment is especially prone to errors and uncertainties. As discussed above, some of the experimental parameters affected the diffusion coefficients, but were not exactly known or not exactly reproduced among experiments. In addition, the rather high noise in the comparably low CO2 hydrate signals caused uncertainties in the regression of the data. Also, the deviation of the size of the Raman laser focus from the ideal point source and the deviation of the grain shape from an ideal sphere contributed unknown errors to the results. All these errors can be considered small compared to the error that originated from the uncertainty in grain radius. Hence, we only quantified and listed this major error, and neglected all other errors. Consequently, we could only provide a rather large range for the diffusion coefficients and were not able to derive exact values. However, there are only few reported results for diffusion coefficients of guest molecules in gas-hydrate grains, and we believe that a constraint of the order of magnitude is indeed valuable information.
4.2. Microscale Processes
The gas-hydrate maps presented in this manuscript are unique with respect to the possibility of following the response of CH4 hydrate to exposure with CO2 on a scale of several tens to several hundred µm, which covers the size of several gas-hydrate grains. On this scale, neither the molecular-scale mechanisms of the CO2 invasion into the gas-hydrate crystal structure can be resolved, nor is it certain that the processes in the chosen FOV are representative of the whole sample. However, the size range is ideal to identify, separate, and follow different parallel processes in the sample, and to facilitate bridging microscale and multiscale modeling approaches.
The identification of processes occurring in response to CO2 injection is mandatory in order to fully understand hydrate conversion. We could confirm that, besides gas exchange, gas-hydrate dissociation and the formation of secondary gas hydrates also took place. Initial dissolution of part of the gas hydrate was expected to occur due to the nonequilibrium of the gas-hydrate components (water and guest molecules) in the gas-hydrate phase and in the liquid phase. While the gas distribution could be equilibrated by gas exchange, water was released only by dissociation.
It is noticeable that a process, once it had begun, did not change as long as there was no change in experimental conditions (e.g., a change from flow conditions to no-flow conditions in experiment Flow). A gas-hydrate grain that started to dissolve seemed to dissolve completely, and if the solubilities or the equilibrium concentrations in the fluid phase were exceeded, secondary gas hydrates were formed from the freed molecules. This secondary gas-hydrate formation can be rather fast: in the presented CO2 hydrate maps, secondary CO2 hydrates started to occur already in early maps. They precipitated very locally in the pore space and usually kept growing from these early nucleations. If there was abundant CH4 in the fluid phase, it could exchange with or enter into CO2 hydrates, and a reverse exchange occurs. A recent publication by Pan et al. [63], in which the fate of gas-hydrate grains during gas-hydrate conversion was observed with confocal Raman spectroscopy in combination with optical microscopy, also reported the existence of different microscale processes during gas-hydrate conversion. They could also show that the surface morphology of gas-hydrate grains that were subject to gas-exchange changed, and that a rearrangement of the crystal structure at the grain surface seemed to occur. However, our experimental setup did not allow for the identification of this surface process.
The dominant processes for the redistribution of CH4 in the system were gas exchange and gas-hydrate dissociation. Their relative contributions appeared to differ among experiments, but most likely, relative contributions were not homogeneous across the sample. During experiment Flow, for example, very little dissociation was observed, but the precipitation of secondary gas hydrates hinted at the presence of dissociation outside of the FOV. Our results indicated that, at least at the beginning of the exchange, gas-hydrate dissociation and gas exchange contributed approximately the same amount to CH4 release. This was likely to change at later times, when released molecules approached equilibrium concentrations in the fluid phase and the driving force for dissolution became smaller. However, due to the restricted experimental time, this behavior could not be observed in our experiments.
Our experiments confirmed that guest molecules can be exchanged in intact gas hydrate grains and do not require a complete dissolution and reformation of gas hydrates, as postulated in [26], although this process was present in the sample as well, and occurred in parallel. A partial dissolution of the lattice structure at the outer surface of the grains cannot be excluded, but would concern only small volumes of the grains, and the occurrence of free water or ice in the sample was mainly related to gas-hydrate dissolution. The observed existence of different types of gas hydrate in parallel [48,49] also was confirmed by our observations. Gas exchange and secondary gas-hydrate formation occurred in parallel, and could also differ locally due to a variable local availability of the compounds.
The observations for CO2, which is absent from the initial samples, indicated consistently that about 50% of the reacting CO2 was involved in gas exchange, and the other ~50% was bound in secondary pure or CO2-rich gas hydrates. If a local enrichment of CH4 in the fluid phase was prevented by advective flow or fast diffusion in a gas phase, the secondary gas hydrates were CO2-rich, while the enhanced and nonuniform local availability of CH4 in samples with insufficient transport of the released components led to more inhomogeneous secondary gas hydrates.
A very obvious change in sample behavior was observed after the transition from flow conditions to no-flow conditions in experiment Flow. An initially quite effective gas exchange came almost to a halt when the flow stopped, and the CH4 hydrate signal increased even during the no-flow period. This was probably caused by the accumulation of released CH4 close to the gas-hydrate grains: Diffusive transport is very ineffective in a liquid phase, and when the local CH4 solubility in CO2 liq is exceeded, microbubbles could form that are at a higher concentration and are a better-accessible reservoir for CH4-consuming processes than the dissolved gas in the liquid phase.
4.3. Exchange Dynamics
The quantification of exchange dynamics from the presented gas-hydrate maps has to be carefully considered. Most published hydrate-conversion experiments have been interpreted from the evaluation of bulk sample parameters. One model that describes the bulk evolution of a sample during progression of a reaction front into a solid spherical specimen is the shrinking core model [64]. This model has, with individual modifications, repeatedly been used for the description of the gas-exchange process in solid gas-hydrate grains (e.g., [33,65]). The overall shrinking core conversion ratio α is given by:
where R0 is the sphere radius, t is the time, and Dsc is the shrinking core diffusion constant. While this model seems to be a good approach for an integrated bulk signal, the Raman laser focus was a few µm inside of the grains for most parts of the grain areas in the maps. The expected fast gas exchange at the grain surface was not captured, and the dynamics were dominated by the much slower dynamics inside of the grains. Therefore, it is important to evaluate these kind of point measurements with a position-dependent equation and not with an equation that has been derived for bulk processes. On the other hand, the laser focus is not really a point probe. The focus of the Raman laser nominally collects a signal from a volume with a cross section of only a few µm, which is small compared to the size of the gas-hydrate grains [50,66]. In practice, the sampling volume is further enlarged by scattering and optical effects at transitions between materials with different refractive indices, and there are estimates that only ~50% of a typical confocal Raman signal originates from the focal volume [66]. Nevertheless, the sampled volume is still restricted to less than the volume of one gas-hydrate grain, and can represent a local instead of a global evolution. The unknown focus depth and focus size might be considered to be a relevant source of errors for the evaluation of the data in this manuscript. It is certain that the signals from single pixels in the selected areas did not originate from the same depth, and that the focus itself did collect signal from a finite but diffuse volume, and not from a point as required by the used form of the diffusion equation [50,66]. It turned out that the main uncertainty for the quantification of our data was the radius of the gas-hydrate grain, which cannot be determined with sufficient accuracy. Therefore, we can neglect the smaller errors arising from the inability to precisely focus the excitation point. One other concern is the lack of knowledge of the exact fluid composition at the gas-hydrate grain boundaries. The exchange depends on the concentration gradient, but the resolution of the maps was not fine enough to resolve this property, and a map from a constant depth could not provide the concentration gradient at the position above the inner grain volume. However, an accumulation of CH4 in the integral gas phase could not be observed from Raman data. The diffusive and possibly convective transport into the relatively large gas space above the sample seemed to be fast enough to prevent an accumulation at these early stages of the experiment. During flow conditions in experiment Flow, the fluid exchange was definitively very effective, as can be seen from the change in process behavior after the stop of the flow. Hence, the assumption of a CH4-depleted fluid phase and a constant concentration gradient as driving force seems to be a valid assumption for this setup.
α = 1 − (2t × DSC/R02)1.5,
The obtained solid-state diffusion coefficients represent an important outcome of the experiments: they were derived from a fraction of the data that could be attributed directly to the gas-exchange process. Unfortunately, because of the discussed uncertainties, we could only determine a range for the diffusion coefficient instead of a reliable number. At ~272 K and 3–3.5 MPa, the derived values for DCH4 were in the order of magnitude 10−16–10−18 m2/s, and the values for DCO2 were in the order of magnitude 10−15–10−17 m2/s. The CO2 diffusion coefficients tended to be higher than the CH4 diffusion coefficients. The slower CH4 diffusion might be intrinsic, but it is also possible that a part of the CH4 relocated to empty small cages and did not leave the gas-hydrate grain. The initial cage-occupancy ratio of >1 in the experiments NoFlow, NoFlowI1, and NoFlowI2 revealed the presence of empty cages, and shows that the CH4 hydrates had not reached their steady-state composition (see Figures S1–S4). For the flow-through experiment with liquid CO2, the derived values for DCH4 and DCO2 were more similar, although the CO2 diffusion still tended to be about twice as fast. Here, the initial cage occupancy ratio was 1, therefore a high cage occupancy with fewer empty cages was likely. Diffusion coefficients were in the order of magnitude 10−13–10−14 m2/s for both molecules at 281 K and 13–15 MPa. This was several orders of magnitude faster than for the experiments without flow, but the temperature of this experiment was significantly higher and above the freezing point of water. Therefore, it can be excluded that an ice layer formed at the grain surface that hindered guest-molecule migration in and out of the grain. Generally, the exchange kinetics are known to increase with higher temperature [21,65,67,68], and the process is more effective with liquid CO2 [67], while a pressure dependence has only been observed for gaseous CO2 and not for liquid CO2 [21,67]. Published diffusion coefficients for guest molecules in gas hydrates vary by several orders of magnitude. Results from molecular dynamics simulations indicate a higher mobility of the guest molecules. Geng et al. [68] reported diffusion coefficients in the range of 10−10 to 10−13 m2/s at 270 K and 10−9 m2/s at 280 K, and Kondori et al. [69] derived diffusion coefficients in the range of 10−10 to 10−12 m2/s at temperatures from 270 to 280 K. Graue et al. [36] fitted isothermal phase-field simulations to guest-exchange data from magnetic resonance imaging experiments, and reported a diffusivity coefficient of 1.7 × 10⁻⁹ m2/s The most sophisticated experimental data so far has been published by Salamantin et al. [29]. The authors extrapolated guest-molecule diffusion coefficients from ice/gas-hydrate conversion experiments to their experimental conditions of T = 277 K and p = 3.8 MPa, and derived at DCH4 = 2.8 × 10⁻¹⁴ m2/s and DCO2 = 8.1 × 10⁻¹⁴ m2/s. These values compare well with the ranges that we obtained from our data, but were derived from a more complex model. It can be concluded that the rather simplistic approach of applying a Fickian diffusion equation to the solid-state exchange process did provide diffusion constants in the expected orders of magnitude. The advantage of the model is that a fully analytical solution is available for a constant concentration gradient, i.e., at least for the initial phase of the exchange experiment or for an experiment with an effective fluid exchange. For a bulk phase evaluation of the exchange process, the diffusion equation needs to be rewritten in a form that calculates the amount of CH4 molecules nCH4(t) in a gas-hydrate grain of radius r as a function of time by integrating the radius-dependent Equation (2) over the grain volume:
One other important observation from our data was that, at least at early stages, CH4 hydrate dissolution and secondary CO2 hydrate formation occurred in parallel to gas exchange, and those contributions cannot be neglected. Therefore, any type of equation for the modeling of bulk CH4 release through gas exchange should be supplemented with an equation for the release of CH4 from gas-hydrate dissociation:
nCH4(t) = n_exchange(t) + n_dissociation(t)
A formalism for the description of the dissociation of gas hydrate can, for example be found in the works of Kim et al. and Clarke and Bishnoi [70,71], and further dissociation kinetic models are listed in the review article by Kondori et al. [25]. It is possible that the dissociation process comes to a stop when the initially dissociating grains are completely decomposed and a transition to pure gas exchange might need to be implemented in a thorough modeling approach.
The gas-exchange process with diffusion coefficients D < 10−13 m2/s is too slow for an economically feasible gas-hydrate exploitation, and it is commonly agreed that a commercial approach that includes gas exchange needs to be combined with a second production method like pressure reduction. The resulting dynamic gas-hydrate system can be even more complex than the ones described here [72], and the development of a relatively simple and robust mathematical formalism for modeling of the system evolution is mandatory. The shrinking core equation is such a simplistic approach, but it is not suitable for a description of the initial fast exchange at the surface of the gas-hydrate grains. One possibility to tackle this shortcoming is the combination of the shrinking core model with a faster decaying equation like the Avrami equation [63,65]. With the use of the common diffusion equation plus a dissociation term, we propose an alternate robust tool for the evaluation of bulk data from gas-exchange experiments.
Supplementary Materials
The following are available online at https://www.mdpi.com/1996-1073/14/6/1763/s1, Table S1: Raman measurement parameters, Figures S1–S4: CH4 cage-occupancy ratios, Figure S5: Pressure curve of experiment Flow.
Author Contributions
Conceptualization, N.K.B., C.D., and M.H.; methodology, E.K., N.K.B., C.D., and M.H.; software, E.K. and N.K.B.; formal analysis, E.K.; investigation, N.K.B. and E.K.; writing—original draft preparation, E.K.; writing—review and editing, E.K., N.K.B., C.D., and M.H.; visualization, E.K. and C.D.; supervision, M.H.; project administration, M.H.; funding acquisition, M.H. All authors have read and agreed to the published version of the manuscript.
Funding
This research was funded by the German Federal Ministry of Economy and Technology (BMWi) and the German Federal Ministry of Education and Research (BMBF) through the SUGAR project (grant nos. 03SX320A and 03G0856A).
Data Availability Statement
Data will be made available in the Pangaea data base (www.pangaea.de) and linked to this publication. While the data is not published, please contact the corresponding author for questions and requests.
Acknowledgments
The authors would like to thank Meike Dibbern for experimental support.
Conflicts of Interest
The authors declare no conflict of interest.
References
- Sloan, E.D.; Koh, C.A. Clathrate Hydrates of Natural Gases, 3rd ed.; CRC Press: New York, NY, USA, 2008. [Google Scholar]
- Birchwood, R.; Dai, J.; Shelander, D.; Boswell, R.; Collett, T.; Cook, A.; Dallimore, S.; Fujii, K.; Imasato, Y.; Fukuhara, M. Developments in gas hydrates. Oilfield Rev. 2010, 22, 18–33. [Google Scholar]
- Chong, Z.R.; Yang, S.H.B.; Babu, P.; Linga, P.; Li, X.-S. Review of natural gas hydrates as an energy resource: Prospects and challenges. Appl. Energy 2016, 162, 1633–1652. [Google Scholar] [CrossRef]
- Oyama, A.; Masutani, S.M. A Review of the Methane Hydrate Program in Japan. Energies 2017, 10, 1447. [Google Scholar] [CrossRef] [Green Version]
- Maslin, M.; Owen, M.; Betts, R.; Day, S.; Jones, T.D.; Ridgwell, A. Gas hydrates: Past and future geohazard? Philos. Trans. R. Soc. A Math. Phys. Eng. Sci. 2010, 368, 2369–2393. [Google Scholar] [CrossRef] [PubMed]
- House, K.Z.; Schrag, D.P.; Harvey, C.F.; Lackner, K.S. Permanent carbon dioxide storage in deep-sea sediments. Proc. Natl. Acad. Sci. USA 2006, 103, 12291–12295. [Google Scholar] [CrossRef] [PubMed] [Green Version]
- Ohgaki, K.; Takano, K.; Sangawa, H.; Matsubara, T.; Nakano, S. Methane exploitation by carbon dioxide from gas hydrates. Phase equilibria for CO2-CH4 mixed hydrate system. J. Chem. Eng. Jpn. 1996, 29, 478–483. [Google Scholar] [CrossRef] [Green Version]
- Dornan, P.; Alavi, S.; Woo, T.K. Free energies of carbon dioxide sequestration and methane recovery in clathrate hydrates. J. Chem. Phys. 2007, 127, 124510. [Google Scholar] [CrossRef] [PubMed]
- Yezdimer, E.M.; Cummings, P.T.; Chialvo, A.A. Determination of the Gibbs Free Energy of Gas Replacement in SI Clathrate Hydrates by Molecular Simulation. J. Phys. Chem. A 2002, 106, 7982–7987. [Google Scholar] [CrossRef]
- Moridis, G.J.; Collett, T.S.; Boswell, R.; Kurihara, M.; Reagan, M.T. In Toward Production From Gas Hydrates: Assessment of Resources, Technology and Potential. In Proceedings of the SPE Unconventional Reservoirs Conference, Keystone, CO, USA, 10–12 February 2008. [Google Scholar]
- Kwon, T.-H.; Kneafsey, T.J.; Rees, E.V.L. Thermal Dissociation Behavior and Dissociation Enthalpies of Methane–Carbon Dioxide Mixed Hydrates. J. Phys. Chem. B 2011, 115, 8169–8175. [Google Scholar] [CrossRef] [Green Version]
- Boswell, R.; Schoderbek, D.; Collett, T.S.; Ohtsuki, S.; White, M.; Anderson, B.J. The Ignik Sikumi Field Experiment, Alaska North Slope: Design, Operations, and Implications for CO2–CH4 Exchange in Gas Hydrate Reservoirs. Energy Fuels 2017, 31, 140–153. [Google Scholar] [CrossRef]
- Schoderbek, D.; Farrell, H.; Hester, K.; Howard, J.; Raterman, K.; Silpngarmlert, S.; Martin, K.L.; Smith, B.; Klein, P. ConocoPhillips Gas Hydrate Production Test Final Technical Report. 20 July 2013. Available online: https://netl.doe.gov/sites/default/files/netl-file/nt0006553-final-report-hydrates.pdf (accessed on 25 February 2021).
- Waite, W.F.; Santamarina, J.C.; Cortes, D.D.; Dugan, B.; Espinoza, D.N.; Germaine, J.; Jang, J.; Jung, J.W.; Kneafsey, T.J.; Shin, H.; et al. Physical properties of hydrate-bearing sediments. Rev. Geophys. 2009, 47, 47. [Google Scholar] [CrossRef]
- Yun, T.S.; Santamarina, J.C.; Ruppel, C. Mechanical properties of sand, silt, and clay containing tetrahydrofuran hydrate. J. Geophys. Res. Space Phys. 2007, 112, 4. [Google Scholar] [CrossRef]
- Konno, Y.; Fujii, T.; Sato, A.; Akamine, K.; Naiki, M.; Masuda, Y.; Yamamoto, K.; Nagao, J. Key Findings of the World’s First Offshore Methane Hydrate Production Test off the Coast of Japan: Toward Future Commercial Production. Energy Fuels 2017, 31, 2607–2616. [Google Scholar] [CrossRef]
- Wallmann, K.; Riedel, M.; Hong, W.L.; Patton, H.; Hubbard, A.; Pape, T.; Hsu, C.W.; Schmidt, C.; Johnson, J.E.; Torres, M.E.; et al. Gas hydrate dissociation off Svalbard induced by isostatic rebound rather than global warming. Nat. Commun. 2018, 9, 1–9. [Google Scholar] [CrossRef] [PubMed]
- Zander, T.; Haeckel, M.; Berndt, C.; Chi, W.-C.; Klaucke, I.; Bialas, J.; Klaeschen, D.; Koch, S.; Atgın, O. On the origin of multiple BSRs in the Danube deep-sea fan, Black Sea. Earth Planet. Sci. Lett. 2017, 462, 15–25. [Google Scholar] [CrossRef] [Green Version]
- Park, Y.; Kim, D.-Y.; Lee, J.-W.; Huh, D.-G.; Park, K.-P.; Lee, H. Sequestering carbon dioxide into complex structures of naturally occurring gas hydrates. Proc. Natl. Acad. Sci. USA 2006, 103, 12690–12694. [Google Scholar] [CrossRef] [PubMed] [Green Version]
- Yoon, J.-H.; Kawamura, T.; Yamamoto, Y.; Komai, T. Transformation of Methane Hydrate to Carbon Dioxide Hydrate: In Situ Raman Spectroscopic Observations. J. Phys. Chem. A 2004, 108, 5057–5059. [Google Scholar] [CrossRef]
- Fan, S.; Wang, X.; Wang, Y.; Lang, X. Recovering methane from quartz sand-bearing hydrate with gaseous CO 2. J. Energy Chem. 2017, 26, 655–659. [Google Scholar] [CrossRef] [Green Version]
- Ota, M.; Abe, Y.; Watanabe, M.; Smith, R.L., Jr.; Inomata, H. Methane recovery from methane hydrate using pressurized CO2. Fluid Phase Equilibria 2005, 228, 553–559. [Google Scholar] [CrossRef]
- Jung, J.W.; Espinoza, D.N.; Santamarina, J.C. Properties and phenomena relevant to CH4-CO2replacement in hydrate-bearing sediments. J. Geophys. Res. Space Phys. 2010, 115, 10. [Google Scholar] [CrossRef]
- Van Der Waals, J.H.; Platteeuw, J.C. Clathrate Solutions. Adv. Chem. Phys. 2007, 2, 1–57. [Google Scholar] [CrossRef]
- Kondori, J.; Zendehboudi, S.; Hossain, M.E. A review on simulation of methane production from gas hydrate reservoirs: Molecular dynamics prospective. J. Pet. Sci. Eng. 2017, 159, 754–772. [Google Scholar] [CrossRef]
- Schicks, J.M.; Luzi, M.; Beeskow-Strauch, B. The Conversion Process of Hydrocarbon Hydrates into CO2Hydrates and Vice Versa: Thermodynamic Considerations. J. Phys. Chem. A 2011, 115, 13324–13331. [Google Scholar] [CrossRef] [PubMed]
- Bai, Y.; Li, Q.; Li, X.; Du, Y. The simulation of nature gas production from ocean gas hydrate reservoir by depressurization. Sci. China Ser. E Technol. Sci. 2008, 51, 1272–1282. [Google Scholar] [CrossRef]
- Tung, Y.-T.; Chen, L.-J.; Chen, Y.-P.; Lin, S.-T. In Situ Methane Recovery and Carbon Dioxide Sequestration in Methane Hydrates: A Molecular Dynamics Simulation Study. J. Phys. Chem. B 2011, 115, 15295–15302. [Google Scholar] [CrossRef]
- Salamatin, A.N.; Falenty, A.; Kuhs, W.F. Diffusion Model for Gas Replacement in an Isostructural CH4–CO2 Hydrate System. J. Phys. Chem. C 2017, 121, 17603–17616. [Google Scholar] [CrossRef]
- Spycher, N.; Pruess, K.; Ennis-King, J. CO2-H2O mixtures in the geological sequestration of CO2. I. Assessment and calculation of mutual solubilities from 12 to 100 °C and up to 600 bar. Geochim. Cosmochim. Acta 2003, 67, 3015–3031. [Google Scholar] [CrossRef]
- Sujith, K.S.; Ramachandran, C.N. Carbon dioxide induced bubble formation in a CH4–CO2–H2O ternary system: A molecular dynamics simulation study. Phys. Chem. Chem. Phys. 2016, 18, 3746–3754. [Google Scholar] [CrossRef] [PubMed]
- Kossel, E.; Bigalke, N.; Pinero, E.; Haeckel, M. The SUGAR Toolbox: A Library of Numerical Algorithms and Data for Modelling of Gas Hydrate Systems and Marine Environments; GEOMAR Helmholtz-Zentrum für Ozeanforschung Kiel: Kiel, Germany, 2013. [Google Scholar]
- Falenty, A.; Qin, J.; Salamatin, A.N.; Yang, L.; Kuhs, W.F. Fluid Composition and Kinetics of the in Situ Replacement in CH4–CO2Hydrate System. J. Phys. Chem. C 2016, 120, 27159–27172. [Google Scholar] [CrossRef]
- Ersland, G.; Husebø, J.; Graue, A.; Baldwin, B.; Howard, J.; Stevens, J. Measuring gas hydrate formation and exchange with CO2 in Bentheim sandstone using MRI tomography. Chem. Eng. J. 2010, 158, 25–31. [Google Scholar] [CrossRef]
- Kossel, E.; Deusner, C.; Bigalke, N.; Haeckel, M. Magnetic Resonance Imaging of Gas Hydrate Formation and Conversion at Sub-Seafloor Conditions. Diffusion Fundam. 2013, 18, 1–4. [Google Scholar]
- Graue, A.; Kvamme, B.; Baldwin, B.; Stevens, J.; Howard, J.J.; Aspenes, E.; Ersland, G.; Husebo, J.; Zornes, D. MRI Visualization of Spontaneous Methane Production From Hydrates in Sandstone Core Plugs When Exposed to CO2. SPE J. 2008, 13, 146–152. [Google Scholar] [CrossRef]
- Chaouachi, M.; Falenty, A.; Sell, K.; Enzmann, F.; Kersten, M.; Haberthür, D.; Kuhs, W.F. Microstructural evolution of gas hydrates in sedimentary matrices observed with synchrotron X-ray computed tomographic microscopy. Geochem. Geophys. Geosyst. 2015, 16, 1711–1722. [Google Scholar] [CrossRef] [Green Version]
- Kneafsey, T.J.; Tomutsa, L.; Moridis, G.J.; Seol, Y.; Freifeld, B.M.; Taylor, C.E.; Gupta, A. Methane hydrate formation and dissociation in a partially saturated core-scale sand sample. J. Pet. Sci. Eng. 2007, 56, 108–126. [Google Scholar] [CrossRef] [Green Version]
- Priegnitz, M.; Thaler, J.; Spangenberg, E.; Rücker, C.; Schicks, J.M. A cylindrical electrical resistivity tomography array for three-dimensional monitoring of hydrate formation and dissociation. Rev. Sci. Instrum. 2013, 84, 104502. [Google Scholar] [CrossRef]
- Hirohama, S.; Shimoyama, Y.; Wakabayashi, A.; Tatsuta, S.; Nishida, N. Conversion of CH4-Hydrate to CO2-Hydrate in Liquid CO2. J. Chem. Eng. Jpn. 1996, 29, 1014–1020. [Google Scholar] [CrossRef] [Green Version]
- Yuan, Q.; Sun, C.-Y.; Yang, X.; Ma, P.-C.; Ma, Z.-W.; Liu, B.; Ma, Q.-L.; Yang, L.-Y.; Chen, G.-J. Recovery of methane from hydrate reservoir with gaseous carbon dioxide using a three-dimensional middle-size reactor. Energy 2012, 40, 47–58. [Google Scholar] [CrossRef]
- Yuan, Q.; Sun, C.-Y.; Liu, B.; Wang, X.; Ma, Z.-W.; Ma, Q.-L.; Yang, L.-Y.; Chen, G.-J.; Li, Q.-P.; Li, S.; et al. Methane recovery from natural gas hydrate in porous sediment using pressurized liquid CO2. Energy Convers. Manag. 2013, 67, 257–264. [Google Scholar] [CrossRef]
- Cha, M.; Shin, K.; Lee, H.; Moudrakovski, I.L.; Ripmeester, J.A.; Seo, Y. Kinetics of Methane Hydrate Replacement with Carbon Dioxide and Nitrogen Gas Mixture Using in Situ NMR Spectroscopy. Environ. Sci. Technol. 2015, 49, 1964–1971. [Google Scholar] [CrossRef] [Green Version]
- Lee, H.; Seo, Y.; Seo, Y.T.; Moudrakovski, I.L.; Ripmeester, J.A. Recovering methane from solid methane hydrate with carbon dioxide. Angew. Chem. 2003, 115, 5202–5205. [Google Scholar] [CrossRef]
- Park, Y.; Cha, M.; Cha, J.-H.; Shin, K.; Lee, H.; Park, K.-P.; Huh, D.-G.; Lee, H.-Y.; Kim, S.-J.; Lee, J. In Swapping carbon dioxide for complex gas hydrate structures. In Proceedings of the ICGH 6th International Conference on Gas Hydrates, Vancouver, BC, Canada, 6–10 July 2008. [Google Scholar]
- Everett, S.M.; Rawn, C.J.; Chakoumakos, B.C.; Keffer, D.J.; Huq, A.; Phelps, T.J. Insights into the structure of mixed CO2/CH4 in gas hydrates. Am. Miner. 2015, 100, 1203–1208. [Google Scholar] [CrossRef]
- Beeskow-Strauch, B.; Schicks, J.M. The Driving Forces of Guest Substitution in Gas Hydrates—A Laser Raman Study on CH4-CO2 Exchange in the Presence of Impurities. Energies 2012, 5, 420–437. [Google Scholar] [CrossRef] [Green Version]
- Komai, T.; Yamamoto, Y.; Ohga, K. Dynamics of Reformation and Replacement of CO2 and CH4 Gas Hydrates. Ann. N. Y. Acad. Sci. 2006, 912, 272–280. [Google Scholar] [CrossRef]
- Xu, C.-G.; Yan, R.; Fu, J.; Zhang, S.-H.; Yan, K.-F.; Chen, Z.-Y.; Xia, Z.-M.; Li, X.-S. Insight into micro-mechanism of hydrate-based methane recovery and carbon dioxide capture from methane-carbon dioxide gas mixtures with thermal characterization. Appl. Energy 2019, 239, 57–69. [Google Scholar] [CrossRef]
- Everall, N.J. Confocal Raman Microscopy: Performance, Pitfalls, and Best Practice. Appl. Spectrosc. 2009, 63, 245A–262A. [Google Scholar] [CrossRef]
- Tishchenko, P.; Hensen, C.; Wallmann, K.; Wong, C.S. Calculation of the stability and solubility of methane hydrate in seawater. Chem. Geol. 2005, 219, 37–52. [Google Scholar] [CrossRef]
- Tishchenko, P.; Wong, C.; Johnson, W.; Haeckel, M.; Wallmann, K.; Aloisi, G. Stability and solubility of CO2 hydrate in seawater. In Proceedings of the 8th International Carbon Dioxide Conference, Jena, Germany, 13–19 September 2009. [Google Scholar]
- Legoix, L.N.; Ruffine, L.; Donval, J.-P.; Haeckel, M. Phase Equilibria of the CH4-CO2 Binary and the CH4-CO2-H2O Ternary Mixtures in the Presence of a CO2-Rich Liquid Phase. Energies 2017, 10, 2034. [Google Scholar] [CrossRef] [Green Version]
- Seo, Y.-T.; Lee, H. Multiple-Phase Hydrate Equilibria of the Ternary Carbon Dioxide, Methane, and Water Mixtures. J. Phys. Chem. B 2001, 105, 10084–10090. [Google Scholar] [CrossRef]
- Wagner, W.; Riethmann, T.; Feistel, R.; Harvey, A.H. New Equations for the Sublimation Pressure and Melting Pressure of H2O Ice Ih. J. Phys. Chem. Ref. Data 2011, 40, 043103. [Google Scholar] [CrossRef] [Green Version]
- Sum, A.K.; Burruss, R.C.; Sloan, E.D. Measurement of Clathrate Hydrates via Raman Spectroscopy. J. Phys. Chem. B 1997, 101, 7371–7377. [Google Scholar] [CrossRef]
- Tulk, C.A.; Ripmeester, J.A.; Klug, D.D. The Application of Raman Spectroscopy to the Study of Gas Hydrates. Ann. N. Y. Acad. Sci. 2006, 912, 859–872. [Google Scholar] [CrossRef]
- Qin, J.; Kuhs, W.F. Calibration of Raman Quantification Factors of Guest Molecules in Gas Hydrates and Their Application to Gas Exchange Processes Involving N2. J. Chem. Eng. Data 2014, 60, 369–375. [Google Scholar] [CrossRef]
- Fick, A. Über diffusion. Poggendorff’s Annalen 1855, 94, 59–86. [Google Scholar]
- Bridges, T.E.; Houlne, M.P.; Harris, J.M. Spatially Resolved Analysis of Small Particles by Confocal Raman Microscopy: Depth Profiling and Optical Trapping. Anal. Chem. 2004, 76, 576–584. [Google Scholar] [CrossRef] [PubMed]
- Häfner, F.; Sames, D.; Voigt, H.-D. Wärme-und Stofftransport: Mathematische Methoden; Springer: Berlin/Heidelberg, Germany, 1992. [Google Scholar]
- Chaouachi, M.; Neher, S.H.; Falenty, A.; Kuhs, W.F. Time Resolved Coarsening of Clathrate Crystals: The Case of Gas Hydrates. Cryst. Growth Des. 2017, 17, 2458–2472. [Google Scholar] [CrossRef]
- Pan, M.; Ismail, N.A.; Luzi-Helbing, M.; Koh, C.A.; Schicks, J.M. New Insights on a µm-Scale into the Transformation Process of CH4 Hydrates to CO2-Rich Mixed Hydrates. Energies 2020, 13, 5908. [Google Scholar] [CrossRef]
- Fujii, K.; Kondo, W. Kinetics of the hydration of tricalcium silicate. J. Am. Ceram. Soc. 1974, 57, 492–497. [Google Scholar] [CrossRef]
- Lee, B.R.; Koh, C.A.; Sum, A.K. Quantitative measurement and mechanisms for CH4 production from hydrates with the injection of liquid CO2. Phys. Chem. Chem. Phys. 2014, 16, 14922–14927. [Google Scholar] [CrossRef]
- Tabaksblat, R.; Meier, R.J.; Kip, B.J. Confocal Raman Microspectroscopy: Theory and Application to Thin Polymer Samples. Appl. Spectrosc. 1992, 46, 60–68. [Google Scholar] [CrossRef]
- Ota, M.; Saito, T.; Aida, T.; Watanabe, M.; Sato, Y.; Smith, R.L., Jr.; Inomata, H. Macro and microscopic CH4–CO2 replacement in CH4 hydrate under pressurized CO2. AIChE J. 2007, 53, 2715–2721. [Google Scholar] [CrossRef]
- Geng, C.-Y.; Wen, H.; Zhou, H. Molecular simulation of the potential of methane reoccupation during the replacement of methane hydrate by CO2. J. Phys. Chem. A 2009, 113, 5463–5469. [Google Scholar] [CrossRef] [PubMed]
- Kondori, J.; James, L.; Zendehboudi, S. Molecular scale modeling approach to evaluate stability and dissociation of methane and carbon dioxide hydrates. J. Mol. Liq. 2020, 297, 111503. [Google Scholar] [CrossRef]
- Clarke, M.; Bishnoi, P.R. Determination of the activation energy and intrinsic rate constant of methane gas hydrate decomposition. Can. J. Chem. Eng. 2001, 79, 143–147. [Google Scholar] [CrossRef]
- Kim, H.; Bishnoi, P.; Heidemann, R.; Rizvi, S. Kinetics of methane hydrate decomposition. Chem. Eng. Sci. 1987, 42, 1645–1653. [Google Scholar] [CrossRef]
- Deusner, C.; Bigalke, N.; Kossel, E.; Haeckel, M. Methane Production from Gas Hydrate Deposits through Injection of Supercritical CO2. Energies 2012, 5, 2112–2140. [Google Scholar] [CrossRef] [Green Version]
Figure 1.
The CO2 gas/liquid phase boundary, the water/ice Ih phase boundary [55], and phase boundaries for CH4 hydrate and CO2 hydrate in the pressure and temperature range relevant to the presented experiments. The liquid CO2 phase and gas hydrates exist below the respective curves at higher pressures. Experimental conditions are marked with symbols.

Figure 2.
Cross sections of pressure cells for gas-hydrate-exchange experiments. (a) Standard cell for static operation. Fluid inlet and outlet are located in the left half of the cell (not shown). (b) Flow-through cell.
Figure 2.
Cross sections of pressure cells for gas-hydrate-exchange experiments. (a) Standard cell for static operation. Fluid inlet and outlet are located in the left half of the cell (not shown). (b) Flow-through cell.

Figure 3.
CH4 and CO2 hydrate maps of experiment NoFlow at times 0 h (only CH4 hydrate), 29 h, 60 h, and 91 h. Signal intensities are shown in arbitrary units. The location of the two selected gas-hydrate grain areas for gas-exchange evaluation are marked as blue areas in the upper-right map.
Figure 3.
CH4 and CO2 hydrate maps of experiment NoFlow at times 0 h (only CH4 hydrate), 29 h, 60 h, and 91 h. Signal intensities are shown in arbitrary units. The location of the two selected gas-hydrate grain areas for gas-exchange evaluation are marked as blue areas in the upper-right map.

Figure 4.
Evolution of the total gas-hydrate signal of experiment NoFlow and evolution of the specific processes (see text for explanation). Left: CH4 hydrate; right: CO2 hydrate.
Figure 4.
Evolution of the total gas-hydrate signal of experiment NoFlow and evolution of the specific processes (see text for explanation). Left: CH4 hydrate; right: CO2 hydrate.

Figure 5.
Time evolution of the CH4 hydrate signal (left) and CO2 hydrate signal (right) on grains 1 and 2 with regressed curves from the diffusion equation.
Figure 5.
Time evolution of the CH4 hydrate signal (left) and CO2 hydrate signal (right) on grains 1 and 2 with regressed curves from the diffusion equation.

Figure 6.
CH4 and CO2 hydrate maps of experiment NoFlowI1 at times 0 h (only CH4 hydrate), 15 h, 30 h, and 45 h. The location of the three selected gas-hydrate grain areas for gas-exchange evaluation are marked as blue areas in the upper-right map.
Figure 6.
CH4 and CO2 hydrate maps of experiment NoFlowI1 at times 0 h (only CH4 hydrate), 15 h, 30 h, and 45 h. The location of the three selected gas-hydrate grain areas for gas-exchange evaluation are marked as blue areas in the upper-right map.

Figure 7.
Evolution of the total gas-hydrate signal of experiment NoFlowI1 and evolution of the specific processes. Left: CH4 hydrate; right: CO2 hydrate.
Figure 7.
Evolution of the total gas-hydrate signal of experiment NoFlowI1 and evolution of the specific processes. Left: CH4 hydrate; right: CO2 hydrate.

Figure 8.
Time evolution of the CH4 hydrate signal (left) and CO2 hydrate signal (right) on grains 3, 4, and 5 with regressed curves.
Figure 8.
Time evolution of the CH4 hydrate signal (left) and CO2 hydrate signal (right) on grains 3, 4, and 5 with regressed curves.

Figure 9.
CH4 and CO2 hydrate maps of experiment NoFlowI2 at times 0.5 h (only CH4 hydrate), 10 h, 26 h, and 40 h.
Figure 9.
CH4 and CO2 hydrate maps of experiment NoFlowI2 at times 0.5 h (only CH4 hydrate), 10 h, 26 h, and 40 h.

Figure 10.
Evolution of the total gas-hydrate signal of experiment NoFlowI2 and evolution of the specific processes. Left: CH4 hydrate; right: CO2 hydrate.
Figure 10.
Evolution of the total gas-hydrate signal of experiment NoFlowI2 and evolution of the specific processes. Left: CH4 hydrate; right: CO2 hydrate.

Figure 11.
CH4 and CO2 hydrate maps of experiment Flow during the flow period at 0 h, 3 h (before stop of flow), and 17 h (after reinstallation of flow conditions). The white rectangle marks the location of the smaller FOV, and the positions of the evaluated gas-hydrate grains are marked as dark blue areas.

Figure 12.
Evolution of the total gas hydrate signal during the flow period of experiment Flow and evolution of the specific processes. Left: CH4 hydrate; right: CO2 hydrate.
Figure 12.
Evolution of the total gas hydrate signal during the flow period of experiment Flow and evolution of the specific processes. Left: CH4 hydrate; right: CO2 hydrate.

Figure 13.
Time evolution of the CH4 hydrate signal (left) and the CO2 hydrate signal (right) on grains 6–17 with regressed curves. Different symbols denote different grains.
Figure 13.
Time evolution of the CH4 hydrate signal (left) and the CO2 hydrate signal (right) on grains 6–17 with regressed curves. Different symbols denote different grains.

Figure 14.
CH4 and CO2 hydrate maps of experiment Flow during the no-flow period at 5 h, 10 h, and 15 h, and the relative change in the cage-occupancy ratio during the period 5 h to 15 h.
Figure 14.
CH4 and CO2 hydrate maps of experiment Flow during the no-flow period at 5 h, 10 h, and 15 h, and the relative change in the cage-occupancy ratio during the period 5 h to 15 h.

Figure 15.
Evolution of the total gas hydrate signal during the flow period of experiment Flow and evolution of the specific processes. Left: CH4 hydrate, right: CO2 hydrate.
Figure 15.
Evolution of the total gas hydrate signal during the flow period of experiment Flow and evolution of the specific processes. Left: CH4 hydrate, right: CO2 hydrate.


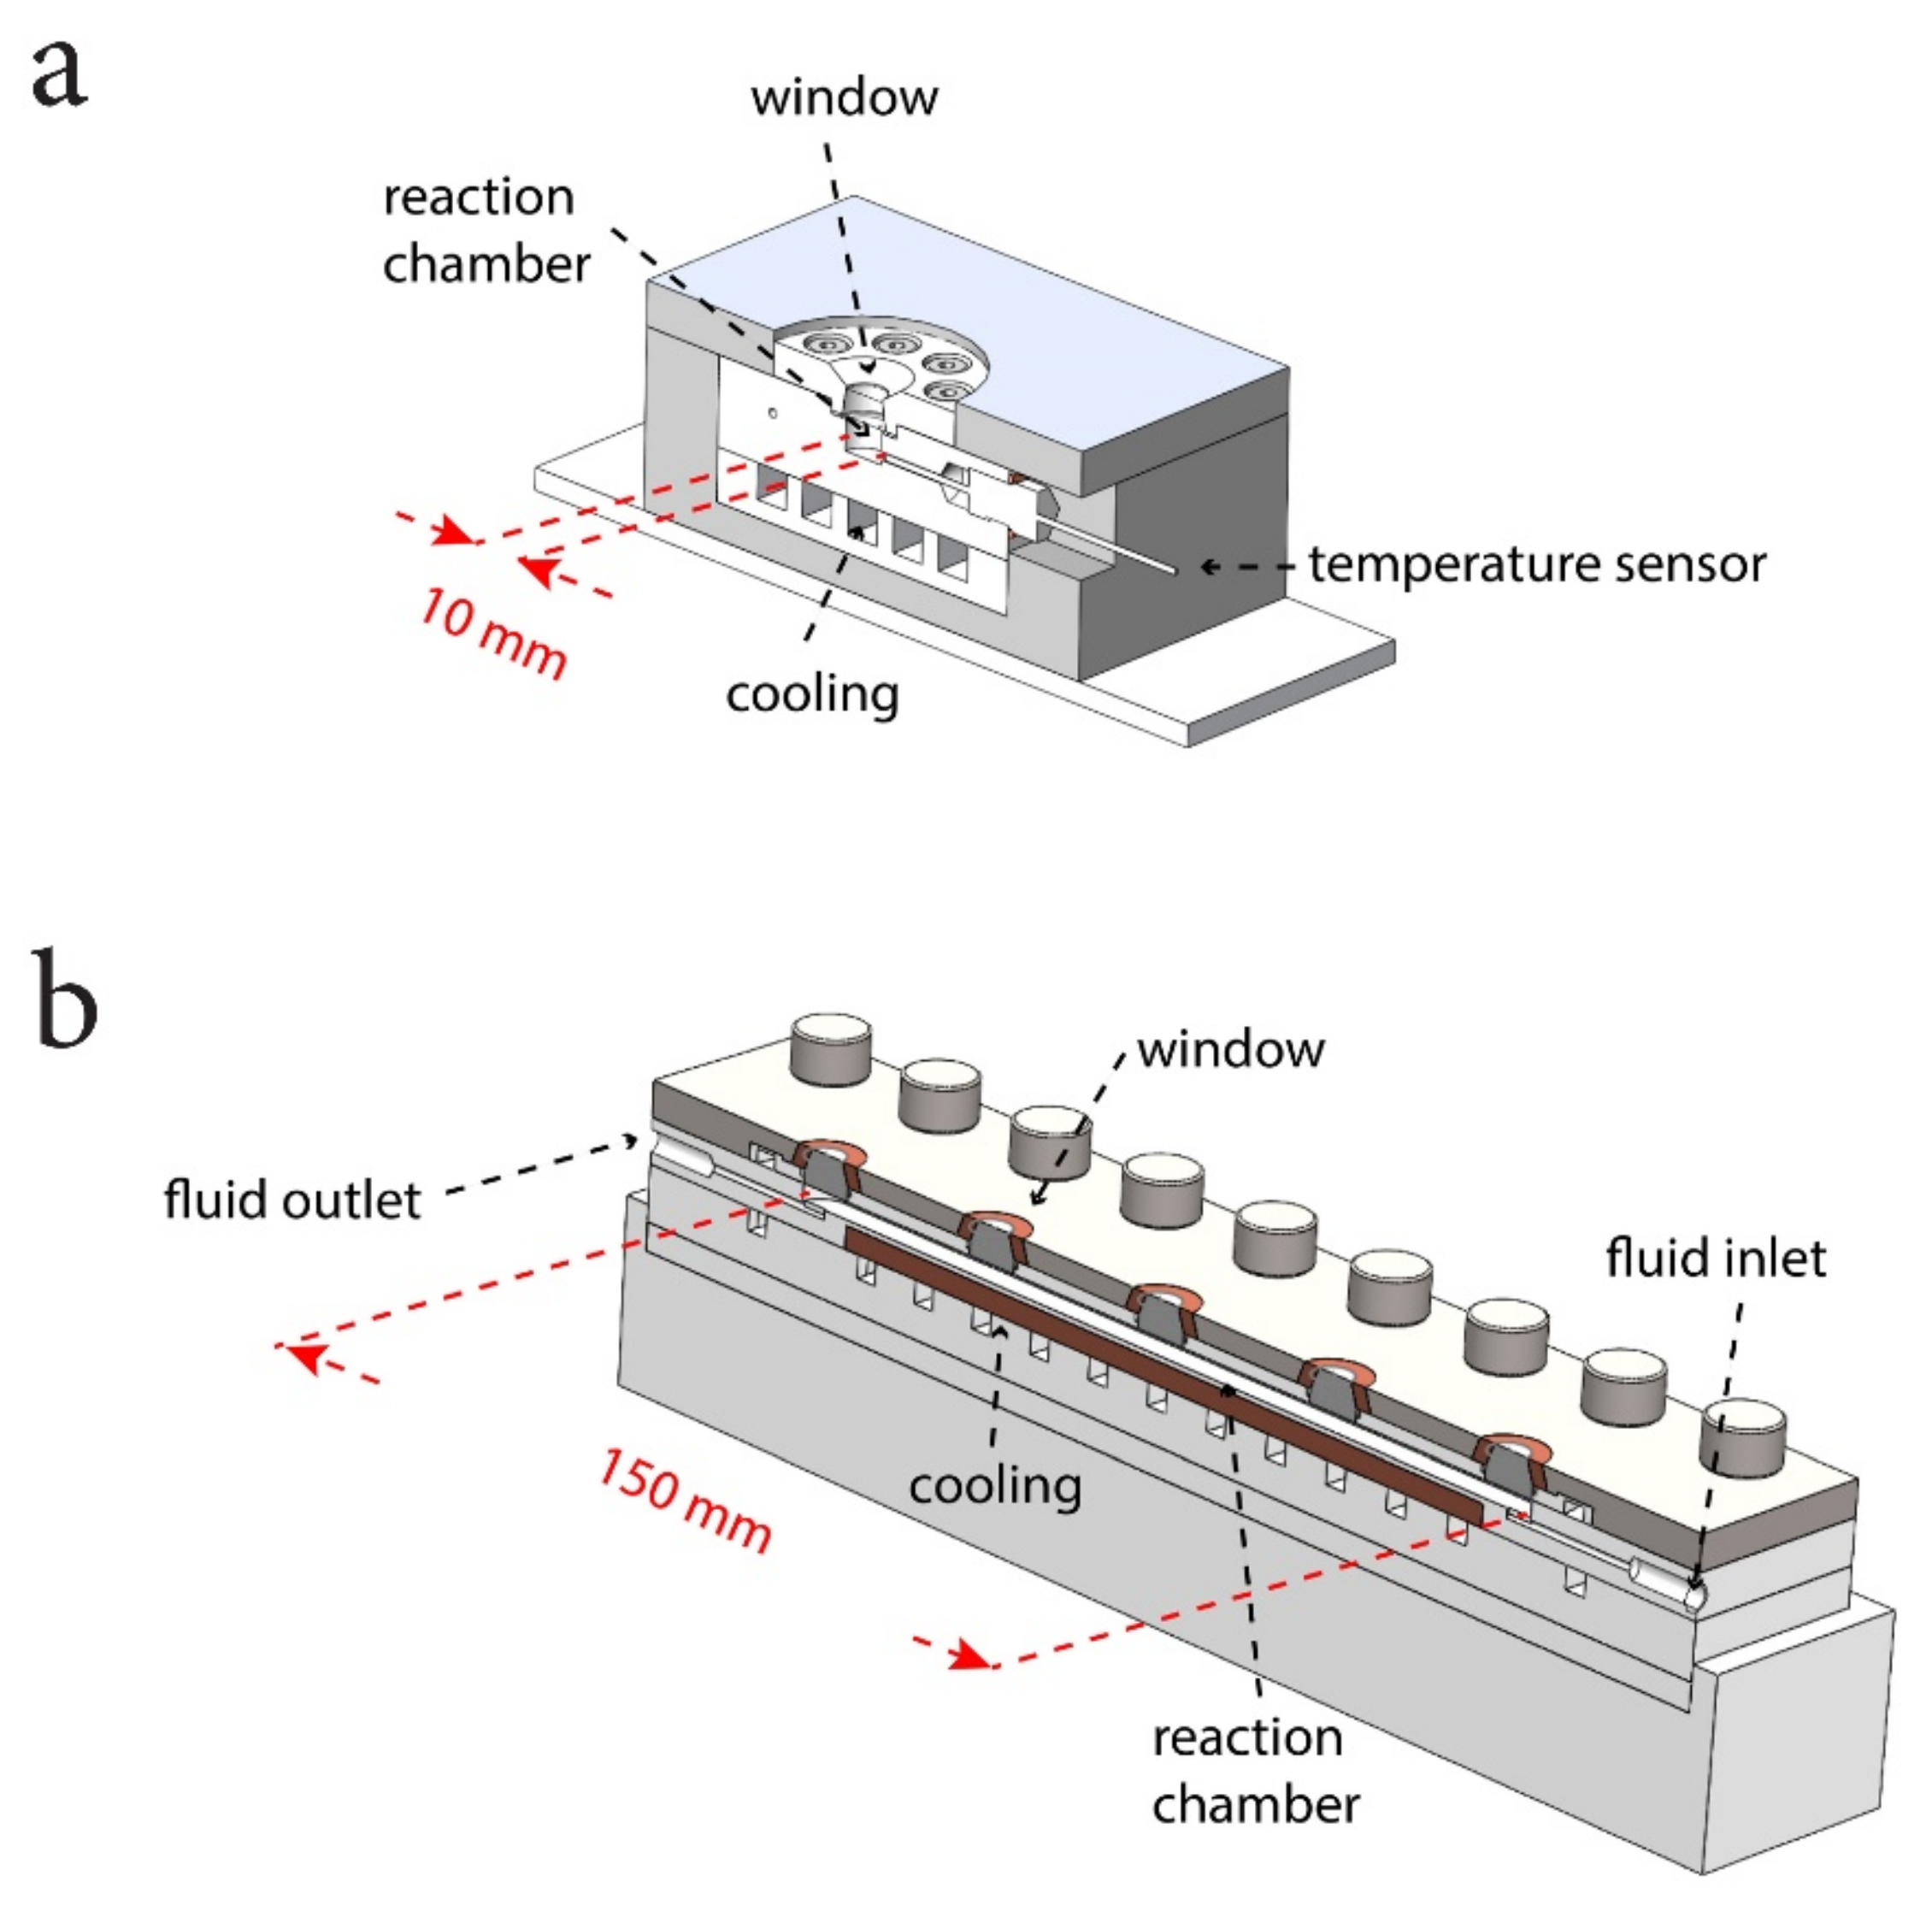
Table 1.
The percentage of the initial CH4 hydrate signal (%S) that was attributed to the respective individual processes and the contribution of these processes to the change of the total CH4 hydrate signal (ΔS). %S and ΔS for total CH4 hydrate are consequently (within the range of rounding errors) the sum of the values for all subprocesses. See text for further explanations. Flow 1 is the flow period of experiment Flow and Flow 2 is the no-flow period of experiment Flow. The duration of the experimental period is given in the last row.
| No Flow | NoFlowI1 | NoFlowI2 | Flow 1 | Flow 2 | ||||||
|---|---|---|---|---|---|---|---|---|---|---|
| %S | ΔS | %S | ΔS | %S | ΔS | %S | ΔS | %S | ΔS | |
| sec. CH4 hydrate | 10% | +3% | 3% | +1% | 10% | +2% | 18% | +7% | ||
| sec. mix hydrate | 13% | +4% | 18% | +3% | 5% | +2% | 2% | +2% | 32% | +18% |
| CH4-CO2 exchange | 41% | −14% | 53% | −23% | 22% | −9% | 93% | −56% | 23% | −6% |
| CO2-CH4 exchange | 4% | +3% | ||||||||
| CH4 hydrate diss. | 35% | −14% | 20% | −10% | 62% | −18% | 5% | −3% | 16% | −4% |
| mix hydrate diss. | 8% | −2% | ||||||||
| total CH4 hyd | 100% | −21% | 100% | −29% | 100% | −24% | 100% | −57% | 100% | +17% |
| experimental period/h | 95 | 47 | 41 | 5.5 | 10.5 | |||||
Table 2.
The percentage of the CO2 hydrate signal (%S) that was attributed to the respective individual processes and the contribution of these processes to the change of the total CO2 hydrate signal (ΔS). Flow 1 is the flow period of experiment Flow and Flow 2 is the no-flow period of experiment Flow. For both flow periods, 100% depicts the CO2 signal at the end of the Flow 1 period: In the first case, it is the final signal, and in the second case, it is the initial signal. Hence, %S and ΔS for the Flow 2 period refers to the initial signal and not to the final signal. The duration of the experimental period is given in the last row.
| NoFlow | NoFlowI1 | NoFlowI2 | Flow 1 | Flow 2 | ||
|---|---|---|---|---|---|---|
| %S | %S | %S | %S | %S | ΔS | |
| sec. CO2 hydrate | 13% | 23% | 26% | 6% | 6% | +10% |
| sec. mix hydrate | 38% | 28% | 33% | 38% | 47% | + 33% |
| CH4-CO2 exchange | 49% | 49% | 44% | 56% | 9% | +11% |
| CO2-CH4 exchange | 25% | −3% | ||||
| CO2 hydrate diss. | 4% | −2% | ||||
| mix hydrate diss. | 7% | −3% | ||||
| total CO2 hyd | 100% | 100% | 100% | 100% | 100% | +46% |
| time period/h | 95 | 47 | 41 | 5.5 | 10.5 | |
Table 3.
Regression parameters D/R02 for diffusion on single gas-hydrate grains. For NoFlowI2, no gas hydrate grains with gas exchange could be identified. Estimates for grain size ranges are listed with corresponding ranges for diffusion coefficients.
Table 3.
Regression parameters D/R02 for diffusion on single gas-hydrate grains. For NoFlowI2, no gas hydrate grains with gas exchange could be identified. Estimates for grain size ranges are listed with corresponding ranges for diffusion coefficients.
| DCH4/R02/10−7 s | DCO2/R02/10−7 s | R0/µm | DCH4/(10−18 m2/s) | DCO2/(10−18 m2/s) | |
|---|---|---|---|---|---|
| grain 1 (NoFlow) | 0.69 ± 0.25 | 2.4 ± 0.58 | 15–30 | 15.5–62.2 | 54.7–218.7 |
| grain 2 (NoFlow) | 0.55 ± 0.11 | 0.33 ± 0.11 | 10–30 | 5.5–49.8 | 3.4–30.2 |
| grain 3 (NoFlowI1) | 0.09 ± 0.18 | 1.19 ± 0.172 | 35–50 | 11.0–22.4 | 145.8–297.5 |
| grain 4 (NoFlowI1) | 2.08 ± 0.55 | 17.2 ± 2.44 | 25–50 | 130.0–520.0 | 1075.0–4300.0 |
| grain 5 (NoFlowI1) | 2.52 ± 0.47 | too noisy | 20–50 | 100.8–630.0 | |
| DCH4/(10−14 m2/s) | DCO2/(10−14 m2/s) | ||||
| grain 6 (Flow) | 70.5 ± 10.7 | 91 ± 61.8 | 100–250 | 7.1–44.1 | 9.1–56.9 |
| grain 7 (Flow) | 39.5 ± 18.6 | 108 ± 34.9 | 100–250 | 2.9–17.9 | 4.6–28.9 |
| grain 8 (Flow) | 73.6 ± 5.9 | 236 ± 88.2 | 100–250 | 6.7–42.4 | 21.1–131.9 |
| grain 9 (Flow) | 48.8 ± 18.9 | 88.7 ± 34.8 | 100–250 | 4.0–24.7 | 10.8–67.5 |
| grain 10 (Flow) | 55.3 ± 15 | 132 ± 43.5 | 100–250 | 7.4–46.0 | 23.6–147.5 |
| grain 11 (Flow) | 74.1 ± 10.4 | 156 ± 19.9 | 100–250 | 4.9–30.5 | 8.9–55.4 |
| grain 12 (Flow) | 74.1 ± 11.1 | 116 ± 60.6 | 100–250 | 5.5–34.6 | 13.2–82.5 |
| grain 13 (Flow) | 60.5 ± 24.2 | 63.6 ± 48 | 100–250 | 7.4–46.3 | 15.6–97.5 |
| grain 14 (Flow) | 32.7 ± 13.6 | 30.8 ± 21.9 | 100–250 | 3.8–23.6 | 4.3–26.9 |
| grain 15 (Flow) | 44.8 ± 14.5 | 50.3 ± 30 | 100–250 | 9.7–60.5 | 14.7–91.9 |
| grain 16 (Flow) | 79.2 ± 21.3 | 91.5 ± 41.1 | 100–250 | 7.4–46.3 | 11.6–72.5 |
| grain 17 (Flow) | 68.1 ± 6.6 | 96.5 ± 54.7 | 100–250 | 6.1–37.8 | 6.4–39.8 |
Publisher’s Note: MDPI stays neutral with regard to jurisdictional claims in published maps and institutional affiliations. |
© 2021 by the authors. Licensee MDPI, Basel, Switzerland. This article is an open access article distributed under the terms and conditions of the Creative Commons Attribution (CC BY) license (http://creativecommons.org/licenses/by/4.0/).
Share and Cite
MDPI and ACS Style
Kossel, E.; Bigalke, N.K.; Deusner, C.; Haeckel, M. Microscale Processes and Dynamics during CH4–CO2 Guest-Molecule Exchange in Gas Hydrates. Energies 2021, 14, 1763. https://doi.org/10.3390/en14061763
AMA Style
Kossel E, Bigalke NK, Deusner C, Haeckel M. Microscale Processes and Dynamics during CH4–CO2 Guest-Molecule Exchange in Gas Hydrates. Energies. 2021; 14(6):1763. https://doi.org/10.3390/en14061763
Chicago/Turabian StyleKossel, Elke, Nikolaus K. Bigalke, Christian Deusner, and Matthias Haeckel. 2021. "Microscale Processes and Dynamics during CH4–CO2 Guest-Molecule Exchange in Gas Hydrates" Energies 14, no. 6: 1763. https://doi.org/10.3390/en14061763
Note that from the first issue of 2016, this journal uses article numbers instead of page numbers. See further details here.