 Arlindo A. Moura1,2,3*
 Maria Julia B. Bezerra1,2
 Aline M. A. Martins4
 Daniela P. Borges2,5Roberta T. G. Oliveira2,5
 Raphaela M. Oliveira4
 Kaio M. Farias2,3Arabela G. Viana1Guilherme G. C. Carvalho2,6
 Carlos R. K. Paier2,7
 Marcelo V. Sousa4
 Wagner Fontes4
 Carlos A. O. Ricart4Maria Elisabete A. Moraes2,7Silvia M. M. Magalhães2,5
 Cristiana L. M. Furtado2,7,8Manoel O. Moraes-Filho2,7
 Claudia Pessoa2,3,6*
 Ronald F. Pinheiro2,5*
- 1Graduate Program in Animal Science, Federal University of Ceará, Fortaleza, Brazil
- 2Drug Research and Development Center (NPDM), The School of Medicine, Federal University of Ceará, Fortaleza, Brazil
- 3Graduate Program in Biotechnology (Renorbio), Federal University of Ceará, Fortaleza, Brazil
- 4Laboratory of Protein Chemistry and Biochemistry, The University of Brasília, Brasília, Brazil
- 5Graduate Program in Medical Sciences, The School of Medicine, Federal University of Ceará, Fortaleza, Brazil
- 6Graduate Program in Pharmacology, Federal University of Ceará, Fortaleza, Brazil
- 7Graduate Program in Translational Medicine, The School of Medicine, Federal University of Ceará, Fortaleza, Brazil
- 8Experimental Biology Center, NUBEX, The University of Fortaleza (Unifor), Fortaleza, Brazil
Myelodysplastic syndrome (MDS) is a hematological disorder characterized by abnormal stem cell differentiation and a high risk of acute myeloid leukemia transformation. Treatment options for MDS are still limited, making the identification of molecular signatures for MDS progression a vital task. Thus, we evaluated the proteome of bone marrow plasma from patients (n = 28) diagnosed with MDS with ring sideroblasts (MDS-RS) and MDS with blasts in the bone marrow (MDS-EB) using label-free mass spectrometry. This strategy allowed the identification of 1,194 proteins in the bone marrow plasma samples. Polyubiquitin-C (UBC), moesin (MSN), and Talin-1 (TLN1) showed the highest abundances in MDS-EB, and centrosomal protein of 55 kDa (CEP55) showed the highest relative abundance in the bone marrow plasma of MDS-RS patients. In a follow-up, in the second phase of the study, expressions of UBC, MSN, TLN1, and CEP55 genes were evaluated in bone marrow mononuclear cells from 45 patients by using qPCR. This second cohort included only seven patients from the first study. CEP55, MSN, and UBC expressions were similar in mononuclear cells from MDS-RS and MDS-EB individuals. However, TLN1 gene expression was greater in mononuclear cells from MDS-RS (p = 0.049) as compared to MDS-EB patients. Irrespective of the MDS subtype, CEP55 expression was higher (p = 0.045) in MDS patients with abnormal karyotypes, while MSN, UBC, and TALIN1 transcripts were similar in MDS with normal vs. abnormal karyotypes. In conclusion, proteomic and gene expression approaches brought evidence of altered TLN1 and CEP55 expressions in cellular and non-cellular bone marrow compartments of patients with low-risk (MDS-RS) and high-risk (MDS-EB) MDSs and with normal vs. abnormal karyotypes. As MDS is characterized by disrupted apoptosis and chromosomal alterations, leading to mitotic slippage, TLN1 and CEP55 represent potential markers for MDS prognosis and/or targeted therapy.
1 Introduction
Myelodysplastic syndromes (MDSs) are hematologic stem cell malignancies associated with cytopenias, bone marrow insufficiency, and anemia (1). The pathogenesis of MDS relates to disruption of stem cell development, increased apoptosis, mutations in splicing factors and DNA repair system, altered DNA methylation of tumor suppressor genes or proto-oncogenes, and immune derangement (2–4). According to the Revised International Prognostic Scoring System (IPSS-R), MDS is grouped into very low-, low-, intermediate-, very high-, and high-risk disorders, depending on the pathogenesis and risk of acute myeloid leukemia (AML) transformation (5).
MDS with ring sideroblasts (MDS-RS) is characterized by bone marrow dysplasia, cytopenia, low risk of AML transformation, ring sideroblasts ≥15% of bone marrow precursors, and presence of SF3B1 mutation (6, 7). Ring sideroblasts are erythroid precursors with abnormal accumulation of iron inside mitochondria, and MDS-RS cases have stem cells with abnormal erythroid colony formation with failure of terminal erythroid differentiation (TED) (8). TED was also reported in high-risk MDS (8), characterized by excess blasts (MDS-EB) and 5%–19% myeloblasts in the bone marrow and accounts for up to 40% of all MDS cases, with a high risk of AML transformation (6, 9, 10). Low-risk MDS, such as MDS-RS, commonly presents symptoms of anemia and proper response to erythropoietin treatment (8). MDS-EB is linked to high-risk karyotypes such as monosomy seven, complex karyotype and mutations of genes that control disturbance of apoptosis (TP53) and DNA repair, stem cell maturation (RUNX1), and histone modifications (ASXL1) (11).
The bone marrow microenvironment contains cellular and non-cellular compartments that modulate the functional status of hematopoietic stem cells (12), and soluble factors present in the bone marrow modulate cell–cell and cell–extracellular matrix interactions and intracellular signaling (13). Alterations in their biochemistry and synthesis of bone marrow factors interfere with hematopoiesis and potentially trigger aberrant mechanisms that define the pathobiology of MDS. In fact, a recent study reports that pronounced differences exist in the proteomes of bone marrow plasma of patients with AML and healthy ones (14), with upregulated and downregulated proteins associated with chemokine and cytokine signaling pathways. Protein profiles are also altered in the blood and bone marrow plasma of patients with low- and high-risk lymphocytic leukemia (Braoudaki et al. (15)). The proteome of bone marrow cellular compartments and blood plasma are also altered in patients with AML (16), and plasma from patients diagnosed with MDS has decreased levels of CXC chemokine ligands 4 and 7 (17). Analyses of plasma samples using 2-D sodium dodecyl sulfate–polyacrylamide gel electrophoresis (SDS-PAGE) and nano-liquid chromatography–tandem mass spectrometry (nano-LC-MS/MS) identified 39 proteins with different abundances in MDS patients with refractory anemia and refractory anemia with ringed sideroblasts (18). The same research team reported 27 different proteins in the plasma of MDS patients with refractory anemia with excess blasts-2 in comparison to healthy individuals (19). Other studies used gel-based proteomics to describe protein profiles of platelets (20) and peripheral mononuclear cells (21) of patients with MDS. These results clearly indicate that hematological stem cell malignancies are preceded by and/or cause dramatic alterations in the proteome of diverse biological entities, from blood to components of the bone marrow.
Researchers have made remarkable contributions to the understanding of the pathophysiology of MDSs (4, 22–24). Despite this unprecedented effort, the current therapy with hypomethylating agents is not effective for all cases of the disease, especially for high-risk MDS (22, 25), and the identification of molecular markers of MDS progression and response to treatment may be crucial for effective therapeutic strategies in precision medicine. Thus, a series of studies were designed to decipher potential molecular signatures of MDS subtypes. The first study evaluated the proteome of bone marrow plasma from patients diagnosed with low-risk (MDS-RS) and high-risk MDS (MDS-EB). As centrosomal protein of 55 kDa (CEP55), moesin (MSN), talin-1 (TLN1), and ubiquitin C (UBC) showed the highest differential abundances in MDS-RS vs. MDS-EB cases, a second phase of the research was carried out to analyze the expression of those respective genes in mononuclear cells of a distinct cohort of MDS patients.
2 Materials and Methods
2.1 Research Design and Ethical Statement
The present research consisted of two independent studies (Figure 1). In Study 1, label-free data-dependent acquisition (DDA) mass spectrometry was used to decipher the proteome of bone marrow plasma from patients with MDS-RS and MDS-EB (n = 28). Tools of bioinformatics and statistical methods were employed for in silico analysis of protein functional attributes and protein differential quantities in the samples. Based on such analyses, CEP55, MSN, TLN1, and UBC were proteins with the highest differential abundances in the bone marrow plasma of MDS-RS and MDS-EB patients. Thus, Study 2 was further carried out to examine the expression of those genes in bone marrow mononuclear cells from an additional cohort of MDS patients (n = 45).
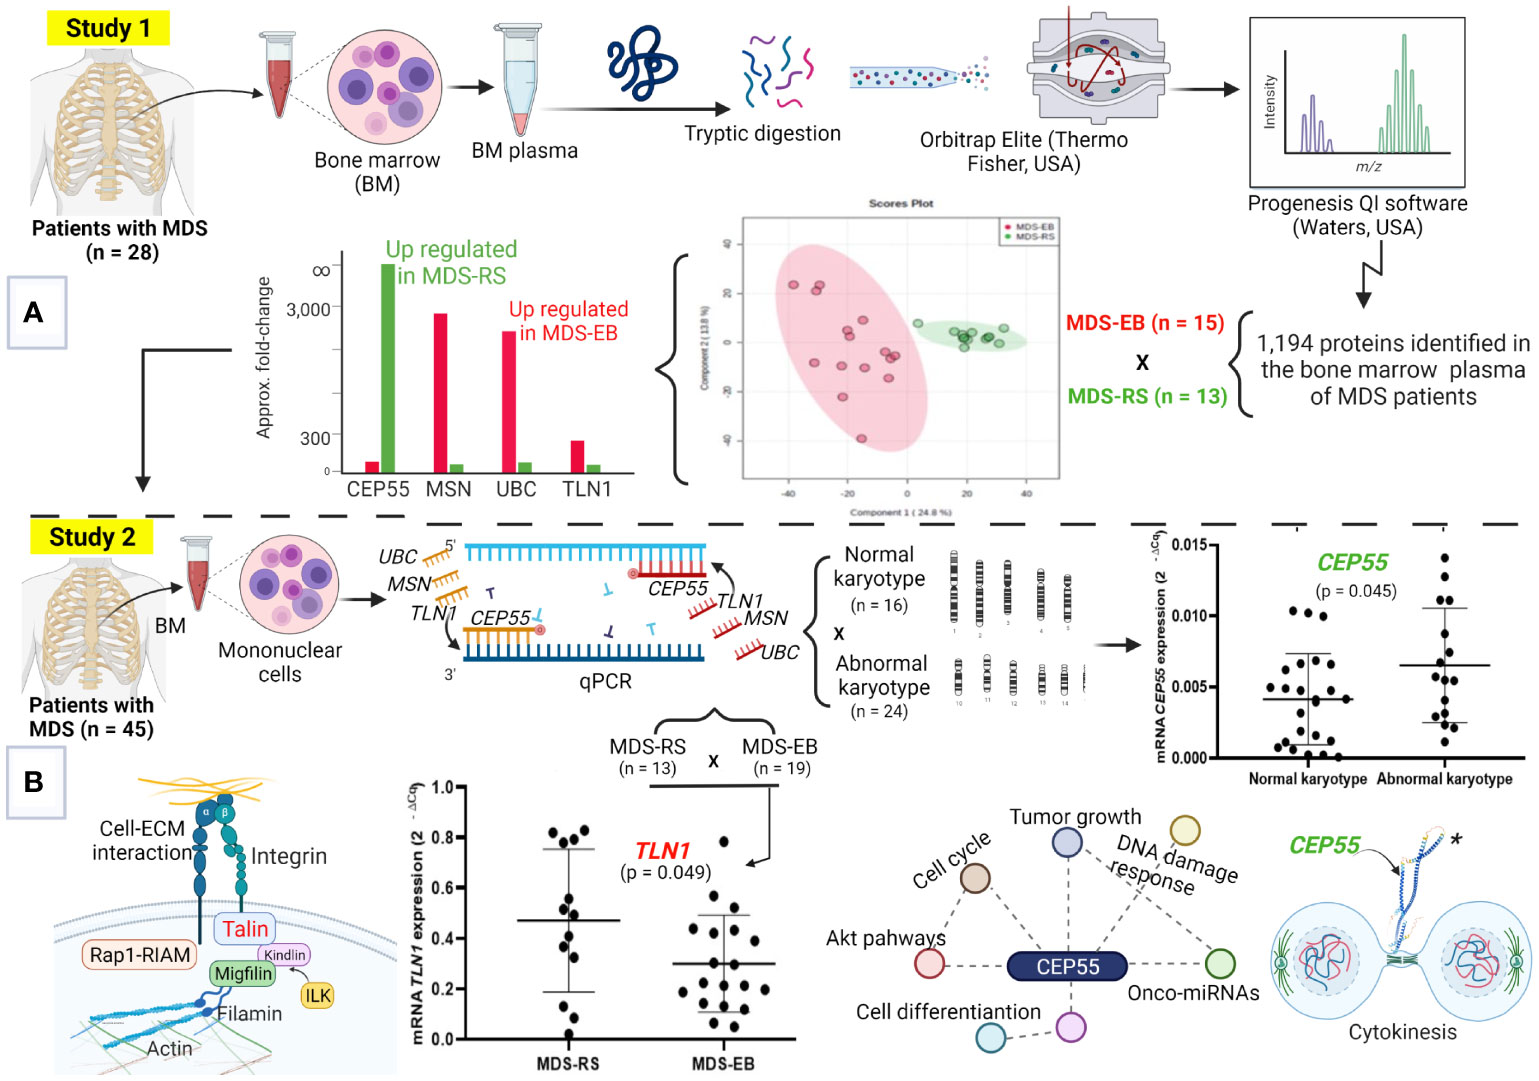
Figure 1 Molecular signatures of myelodysplastic syndromes (MDS). (A) Study 1, focused on the proteome of bone marrow (BM) plasma from patients with MDS-RS and MDS-EB. This strategy defined the highest abundances of UBC, MSN, and TLN1 in MDS-EB and CEP55, in the BM plasma of MDS-RS patients. (B) The steps of Study 2, where UBC, MSN, TLN1, and CEP55 genes were evaluated in MDS patients. Analyses by qPCR show greater TLN1 expression in mononuclear cells of MDS-RS vs. MDS-EB patients, and CEP55 is associated with abnormal karyotypes. MDS-RS, MDS with ring sideroblasts; MDS-EB, MDS with excess blasts. Figure generated using BioRender (https://biorender.com), and CEP55 structure* was downloaded from “AlphaFold Protein Structure Database” (https://alphafold.ebi.ac.uk/entry/Q53EZ4).
This study was approved by the Ethics Committee of the Federal University of Ceará, UFC (#69320817.7.0000.5054), with written consent from each participant. Patients were diagnosed with MDS at the Drug Research and Development Center, School of Medicine, UFC, and corresponded to treatment-naive patients.
2.2 Cytogenetics
G-banding karyotype of patients from Study 1 and Study 2 (see below) was performed as previously reported (26). Briefly, cultures were established in Roswell Park Memorial Institute (RPMI) 1640 medium (Gibco, Grand Island, NY, USA) containing 30% fetal calf serum. For the 24-h culture, colcemid was added at a 0.05 μg/ml concentration for the final 30 min of culture. After being harvested, cells were exposed to a hypotonic KCl solution (0.068 mol/L) and fixed with Carnoy’s buffer (1:3 acetic acid/methanol). Slides were stained with Giemsa solution, and 20 metaphases were analyzed whenever possible. The karyotype was prepared using CytoVision Automated Karyotyping System (Applied Imaging, Grand Rapids, MI, USA) and described according to the International System for Human Cytogenomic Nomenclature 2016 (27).
2.2.1 Study 1: Quantitative Proteomic Analysis of Bone Marrow Plasma
The proteome of bone marrow plasma was evaluated in samples from 13 patients with MDS-RS and 15 patients diagnosed with MDS-EB, which included subcategories MDS-EB-1 (5%–9% blasts in the bone marrow) and MDS-EB-2 (10%–19% blasts in the bone marrow) (Table 1). Diagnosis of the disease followed the WHO 2016 guidelines (1), and the risk stratification was based on the IPSS-R (5).
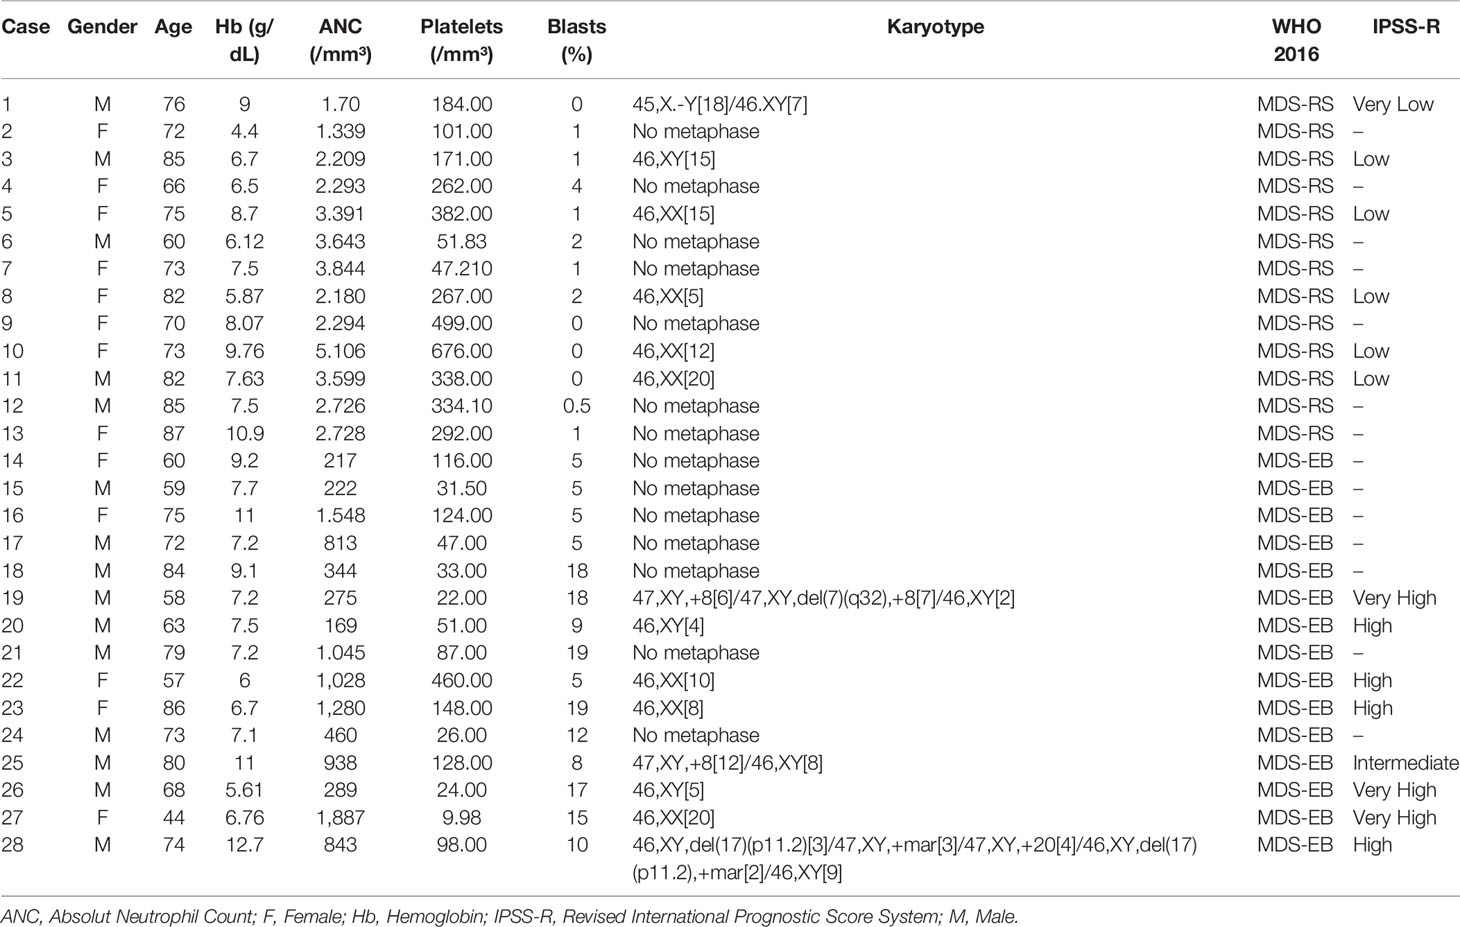
Table 1 Summary of clinical and prognostic characteristics of patients with myelodysplastic syndrome (MDS) with ring sideroblasts (MDS-RS) and MDS with excess blasts (MDS-EB).
2.2.1.1 Sample Collection and Preparation, Trypsinization, and Desalting
Samples were obtained by sternal aspiration of bone marrow by a clinical hematologist at the same time as trephine biopsy at diagnosis. The bone marrow was collected in 4-ml Vacutainer™ tubes with spray-coated K2EDTA (Thermo Fisher, Waltham, MA, USA). Immediately after collection, tubes were inverted several times and centrifuged at 700 ×g (15 min, 4°C). Then, the supernatant (plasma) was transferred to another tube, treated with a protease inhibitor mix (Sigma-Aldrich, St. Louis, MO, USA), and centrifuged at 10,000 ×g (30 min, 4°C). Afterward, the plasma was pipetted into a clean tube and stored at −80°C. An aliquot of this plasma was used for soluble protein quantification (28). Based on this quantification, both 1-D and 2-D gels (SDS-PAGE) were run for assessment of general protein patterns (Supplementary Figure 1). Gels were prepared and run as reported before (29), with modifications.
Bone marrow plasma proteins (25 µg) were dissolved in a solubilization buffer (8 M of urea, 0.02 M of TEAB, and 0.5 M of dithiothreitol), followed by incubation at 55°C (400 rpm agitation, 25 min). Then, iodoacetamide was added (0.014 M), and the mixture was maintained at 21°C in the dark (400 rpm, 40 min). Next, buffer (0.005 M of dithiothreitol, 0.001 M of CaCl2, and 0.02 M of TEAB) was added to reach 75-μl volume. Samples were incubated with trypsin (Promega, Madison, WI, USA) at 37°C for 18 h, and trifluoroacetic acid (1%) was added to stop the tryptic activity. Then, stage tip C18 columns were made using Empore™ SPE disks for peptide desalting (Sigma-Aldrich, Darmstadt, Germany), as reported before (29, 30). Trypsin-digested samples were added to the columns, washed, and eluted with acetonitrile (0.5%; 25% to 80%) and 0.5% acetic acid. Peptides were quantified prior to mass spectrometry analysis (Qubit™; Thermo Fisher, USA).
2.2.1.2 Label-Free Mass Spectrometry
Three micrograms of tryptic peptides from each sample was individually applied to a Dionex Ultimate 3000 liquid chromatographer (Thermo Scientific, USA) for reversed-phase nano-chromatography, as previously described (31). The peptides were injected into a 2 cm × 100 μm trap column containing C18, 5-μm particles (Dr. Maisch GmbH, Ammerbuch, Germany). Then, peptides were eluted from this column to another analytical one (32 cm × 75 μm) containing C18, 3-μm particles (Dr. Maisch GmbH, Germany), and finally eluted to the spectrometer’s ionization source. The elution gradient was composed of 0.1% formic acid in water (solvent A) and 0.1% formic acid in acetonitrile (solvent B), in a gradient of 2% to 35% solvent B for 170 min.
Samples were analyzed in positive DDA mode in a label-free mass spectrometric approach using an Orbitrap Elite instrument (Thermo Fisher, USA) (31, 32). The eluted fractions generated MS1 spectra between 300 and 1,650 m/z with a resolution of 120,000 FWHM at 400 m/z. The 20 most abundant ions from MS1 with at least two charges were automatically selected to fragmentation (MS2) by higher-energy collisional dissociation (HCD) with automatic gain control (AGC) of 1 × 10 (6) and dynamic exclusion of 10 ppm for 90 s. HCD isolation window was set for 2.0 m/z, with 5 × 10 (4) AGC, normalized collision energy of 35%, and threshold for fragmentation of 3,000. The datasets for this study can be found in the Repository MassIVE https://massive.ucsd.edu/ProteoSAFe/static/massive.jsp MassIVE ID=MSV000088457.
2.2.1.3 Data Analyses
MS1 spectra found in the chromatograms were aligned and quantified according to integrated intensity area from the extracted-ion chromatogram (XIC) peaks generated by the respective ion and quantified using Progenesis QI software Nonlinear Dynamics (Waters, Milford, MA, USA). Protein identification was performed using Peaks software, which deduces sequences from the fragmentation information and searches in the UniProt database. Protein identification information was inserted again in the Progenesis QI program and combined with quantitative data generated previously (31).
Statistical analysis was performed using Progenesis QI software to evaluate differences in protein abundance between MDS-RS and MDS-EB samples. A first statistical analysis was performed before protein identification to filter the MS1 features presenting ANOVA p-values <0.05. Peaks 7.0 software was used with the fragmentation spectra, and the Homo sapiens UniProt database was searched. Search parameters were set as follows: precursor ion mass error tolerance of 10 ppm, MS/MS mass tolerance of 0.05 Da, carbamidomethylation of cysteine residues (fixed modification), deamidation, and methionine oxidation (variable modifications). A maximum of two missed cleavage sites per peptide was allowed. The identified proteins were filtered at a rate of 1% for false discovery rate (FDR), and a minimum of 1 unique peptide per protein was required for identification. Proteins with different abundances (p < 0.05) between MDS-RS and MDS-EB samples were subjected to multivariate analysis using MetaboAnalyst 4.0 (http://www.metaboanalyst.ca) (31, 33, 34). For this type of analysis, protein data were log transformed, normalized based on sample median, and mean centered. Principal component analysis and partial-least squares discriminant analysis (PLS-DA) with variable importance in projection (VIP) approaches were applied to verify data trends and outliers, protein discrimination, and importance in the MDS-RS vs. MDS-EB scenario, respectively.
2.2.1.4 Analysis of Functional Clusters
Functional clusters associated with bone marrow plasma proteins of patients diagnosed with MDS-RS and MDS-EB were analyzed through the DAVID platform (DAVID—Functional Annotation Bioinformatics Analysis—https://david.ncifcrf.gov) (35–37). For this analysis, UniProt accession numbers were uploaded to the DAVID platform, and clusters were defined according to enrichment scores and p-values [−log (p-value)].
2.2.2 Study 2: Analysis of Gene Expressions in Bone Marrow Mononuclear Cells
Based on the results of Study 1, UBC, MSN, and TLN1 proteins showed the highest abundances in MDS-EB, and CEP55 was identified with the highest comparative abundance in the bone marrow plasma of MDS-RS patients. As the next phase of the research, gene expression validation of CEP55, MSN, TLN1, and UBC was carried out by qPCR in bone marrow mononuclear cells from 45 MDS patients, including 15 MDS-RS and 23 MDS-EB patients, five with multilineage dysplasia, one with single lineage dysplasia, and one with MDS secondary to therapy (Table 2). MDS patients were evaluated according to the IPSS-R (5). Four MDS-RS and three MDS-EB patients listed in Study 1 were included in Study 2.
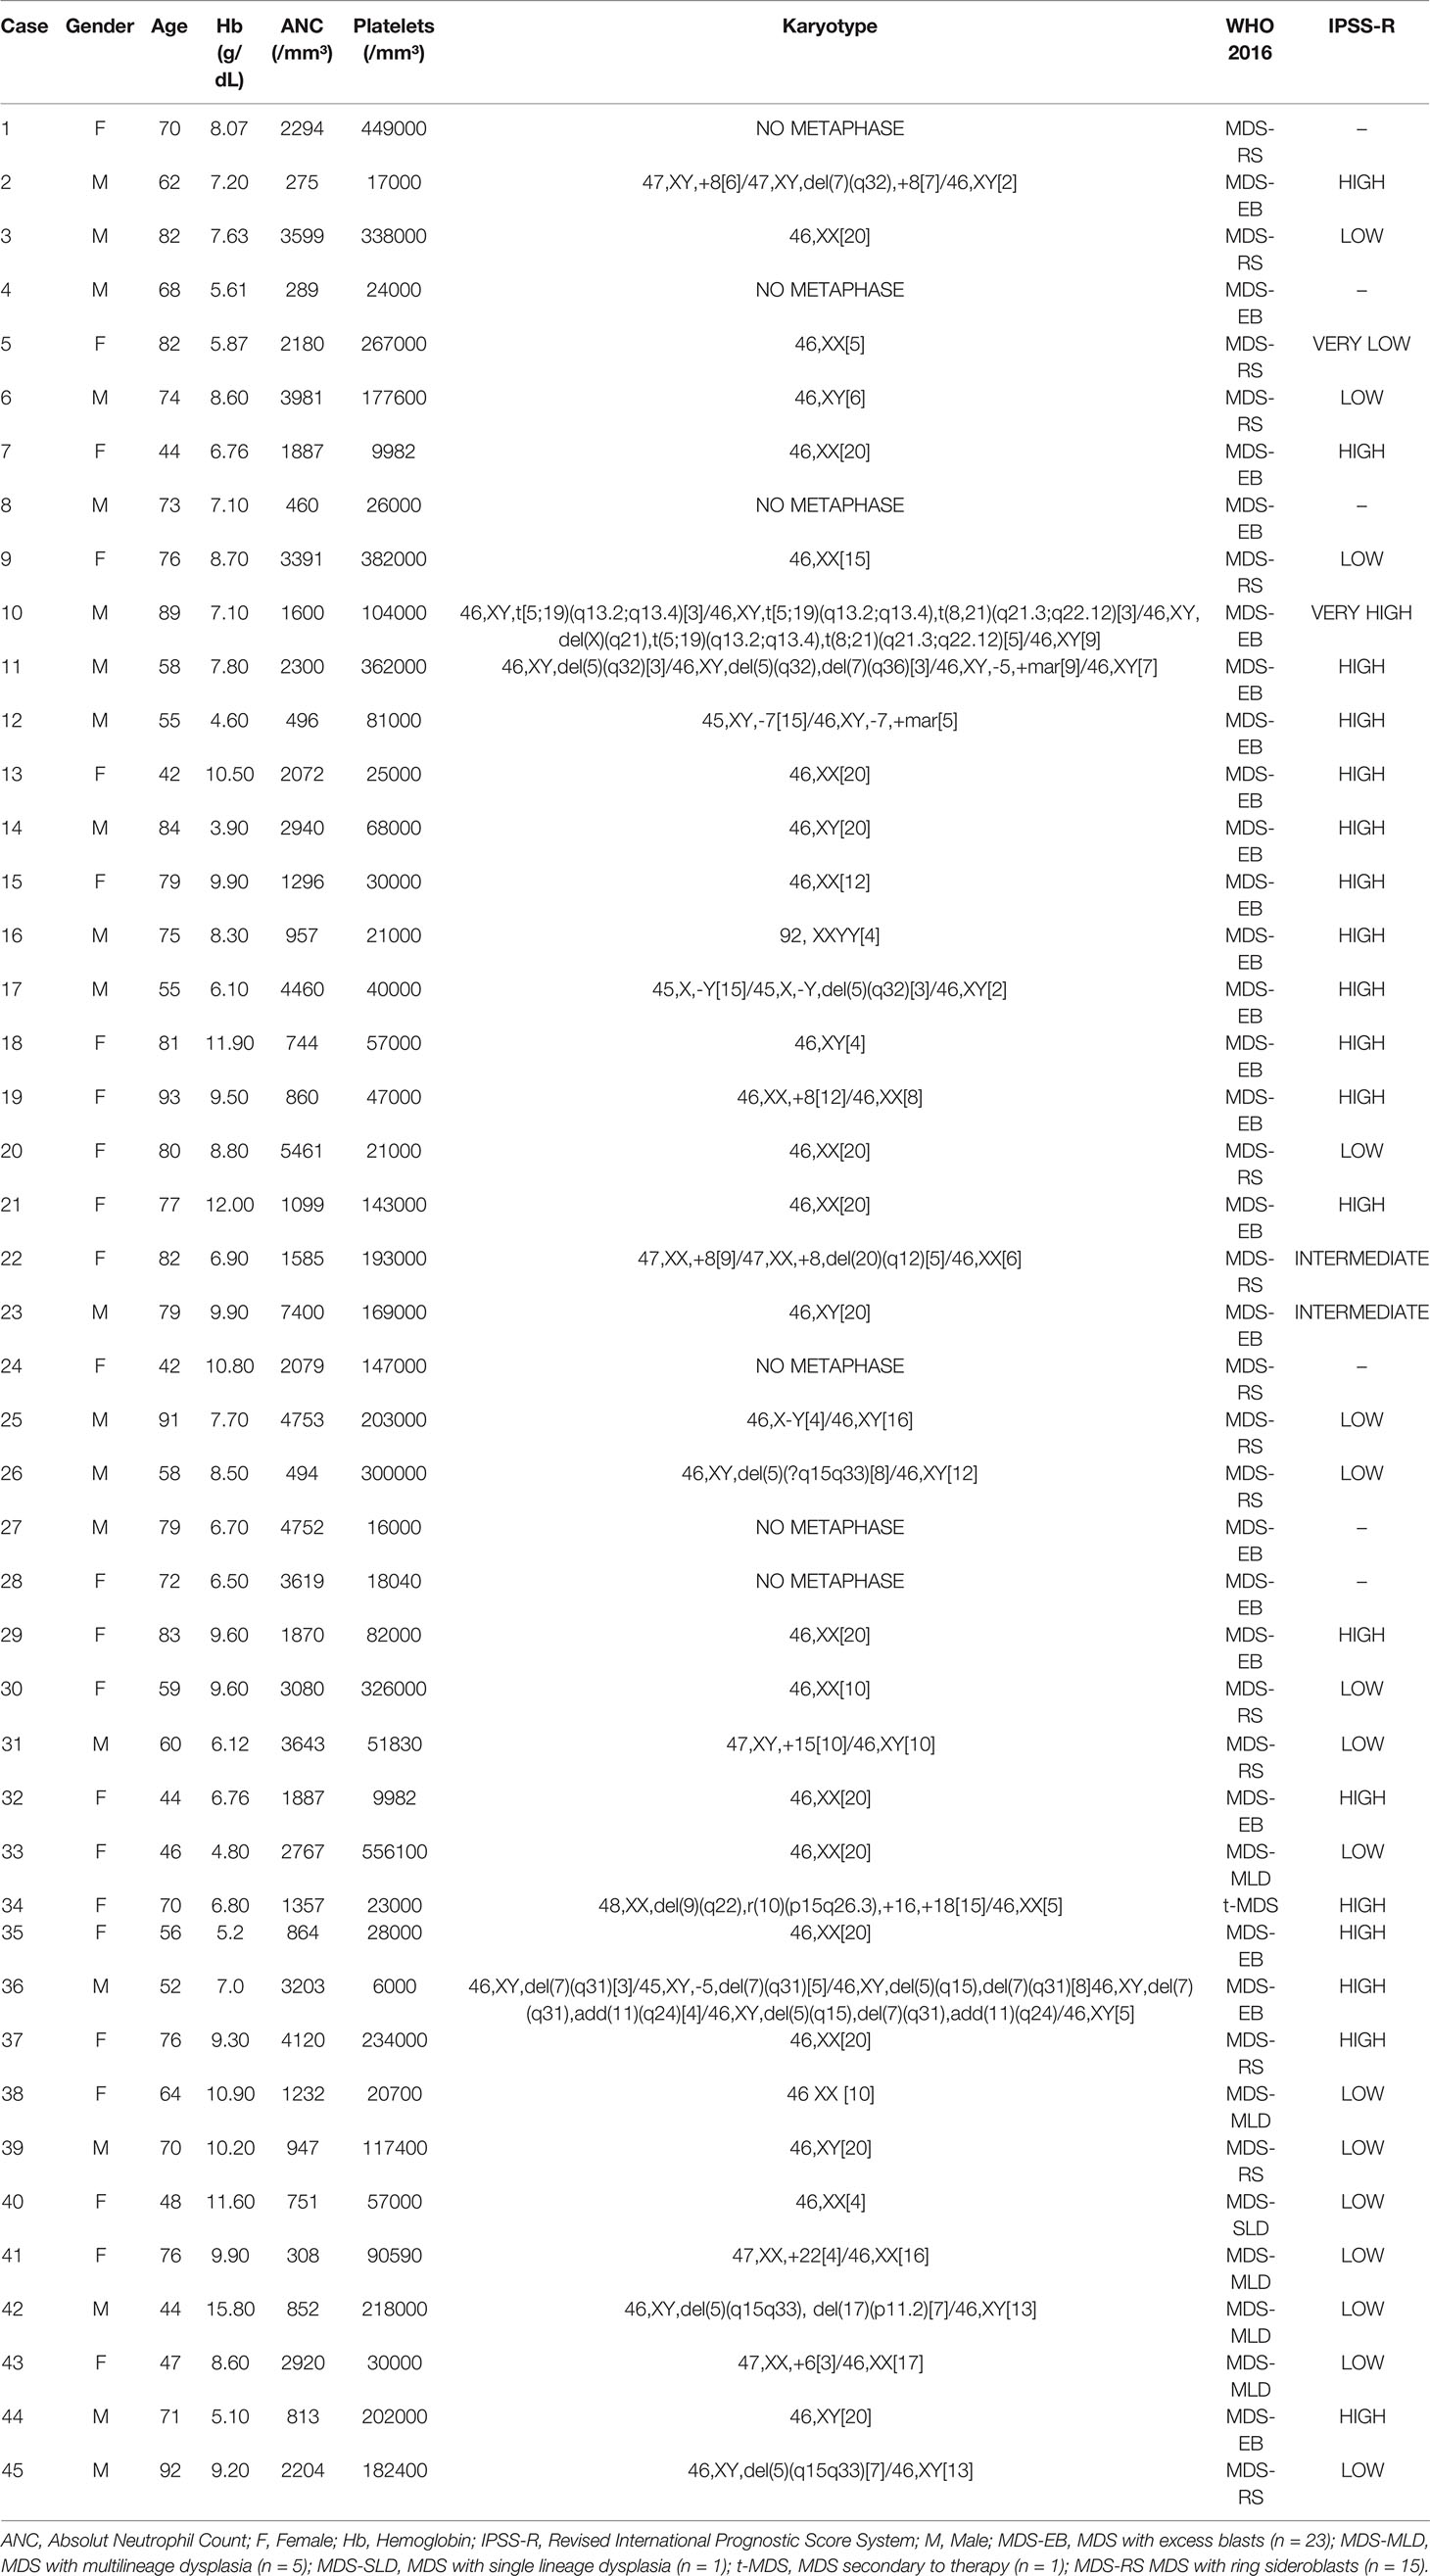
Table 2 Summary of clinical and prognostic characteristics of patients with myelodysplastic syndrome (MDS).
2.2.2.1 Total RNA Extraction and Quantitative Real-Time PCR
Bone marrow was obtained by sternal aspiration of all patients, as described in Study 1. After centrifugation and removal of plasma, mononuclear cells were separated after lysis of red blood cells and subjected to total RNA extractions using Trizol Reagent™ (Invitrogen, Carlsbad, CA, USA), followed by RNA quantification (NanoDrop 2000c; Thermo Scientific, USA). Complementary DNA (cDNA) was obtained using a High-Capacity cDNA Reverse Transcription kit (Applied Biosystems, Foster City, CA, USA) according to the manufacturer’s recommendations. Quantitative real-time PCR (qPCR) reactions were performed using the TaqMan methodology (Applied Biosystems, USA) on 7500 Fast System® (Applied Biosystems, USA). The custom TaqMan Gene Expression Assays were used for CEP55 (Hs01070181_m1), MSN (Hs00792607_mH), TLN1 (Hs00196775_m1), and UBC (Hs00824723_m1) and the reference gene B2M (beta-2-microglobulin, Hs99999907_m1). B2M has been previously validated as a stable reference in gene expression analysis of bone marrow mononuclear cells from MDS patients (38). PCRs were performed using 1× TaqMan® Universal Master Mix II, with UNG® (Applied Biosystems, USA), 1× μl of each probe, and 2× μl of cDNA. The following cycling conditions were performed: initial denaturation at 95°C for 15 min followed by 40 cycles consisting of 95°C for 15 s and 60°C for 1 min. Each sample was performed in duplicate, and the expression ratios were calculated using the 2−ΔCq method (39).
2.3 Statistical Analysis
Normality of mRNA data distribution was evaluated by the Shapiro–Wilk test and Student’s t-test or one-way ANOVA with Tukey/Games–Howell post-hoc test used when normality was detected. The variance homogeneity for all variables analysis was evaluated by Levene’s test. Statistical analyses were performed using SPSS 21.0 (SPSS Inc., Chicaog, IL, USA) and GraphPad Prism 8 (GraphPad Software, La Jolla, CA, USA) software.
2.4 In Silico Analyses of Protein–Protein Interactions, MiRNA-Linked Networks, and CD34+ Gene Expression
Networks of TLN1 and CEP55 proteins were analyzed using String platform version 11.5 (https://string-db.org/ (31, 40)). Protein physical interactions, network type, network edges, and active interaction sources were based on String default settings, using the Homo sapiens National Center for Biotechnology Information (NCBI) database. The number of interactions was limited to 10, considering 0.900 as the minimum interaction score. Interactions of CEP55, MSN, TLN1, and UBC were evaluated with the GeneMANIA platform (www.genemania.org) (41). Protein physical interactions, co-expression, predicted networks, co-localization, pathways, genetic interactions, and shared protein domains were analyzed using the default GeneMANIA approach (automatically selected weighting method) and the Homo sapiens gene nomenclature.
The potential regulation of TLN1 and CEP55 genes by miRNAs was analyzed using the miRNet 2.0 database (https://www.mirnet.ca) (42). The network was built considering a miRNA database for humans and bone marrow as a specific tissue and using a 1.0 degree cutoff of a node. The degree represents the number of connections, and nodes with a higher degree are important hubs in a network. Moreover, functional enrichment of all miRNAs was built, with highlights for main biological functions.
We performed in silico evaluation of CEP55, TLN1, and MSN gene expression in CD34+ cell markers from MDS patients presented in the Gene Expression Omnibus (GEO) data bank (https://www.ncbi.nlm.nih.gov/geo/query/acc.cgi?acc=GSE58831), as described by Gerstung et al. (43) This study evaluated gene expression from 159 patients with MDS patients and 17 healthy controls from bone marrow samples, and microarray gene expression was performed using the Affymetrix GeneChip Human Genome U133 Plus 2.0 arrays.
3 Results
3.1 Study 1: Proteome of the Bone Marrow Plasma of Myelodysplastic Syndrome Patients
As determined by LC-MS/MS, 1,194 proteins were identified in the bone marrow plasma of MDS patients, with 320 and 490 proteins unique to MDS-RS and MDS-EB samples, respectively, and 384 proteins common to both MDS subtypes (Supplementary Table 1A). UniProt accession codes of the 874 proteins identified in the bone marrow plasma of patients diagnosed with MDS-EB were uploaded to the DAVID platform and matched to 310 gene codes, grouped in 54 clusters. In contrast, 704 proteins identified in the bone marrow plasma of MDS-RS patients matched 251 gene codes, organized in 64 clusters. Clusters with the highest enrichment scores associated with both MDS-EB and MDS-RS included biological processes such as complement activation, negative regulation of endopeptidase activity, and receptor-mediated endocytosis. The most enriched molecular functions were defined as cadherin binding involved in cell–cell adhesion, actin binding, phosphatidylcholine binding, and conversion and serine-type endopeptidase activity, among others (Figure 2; Supplementary Tables 1B, C).
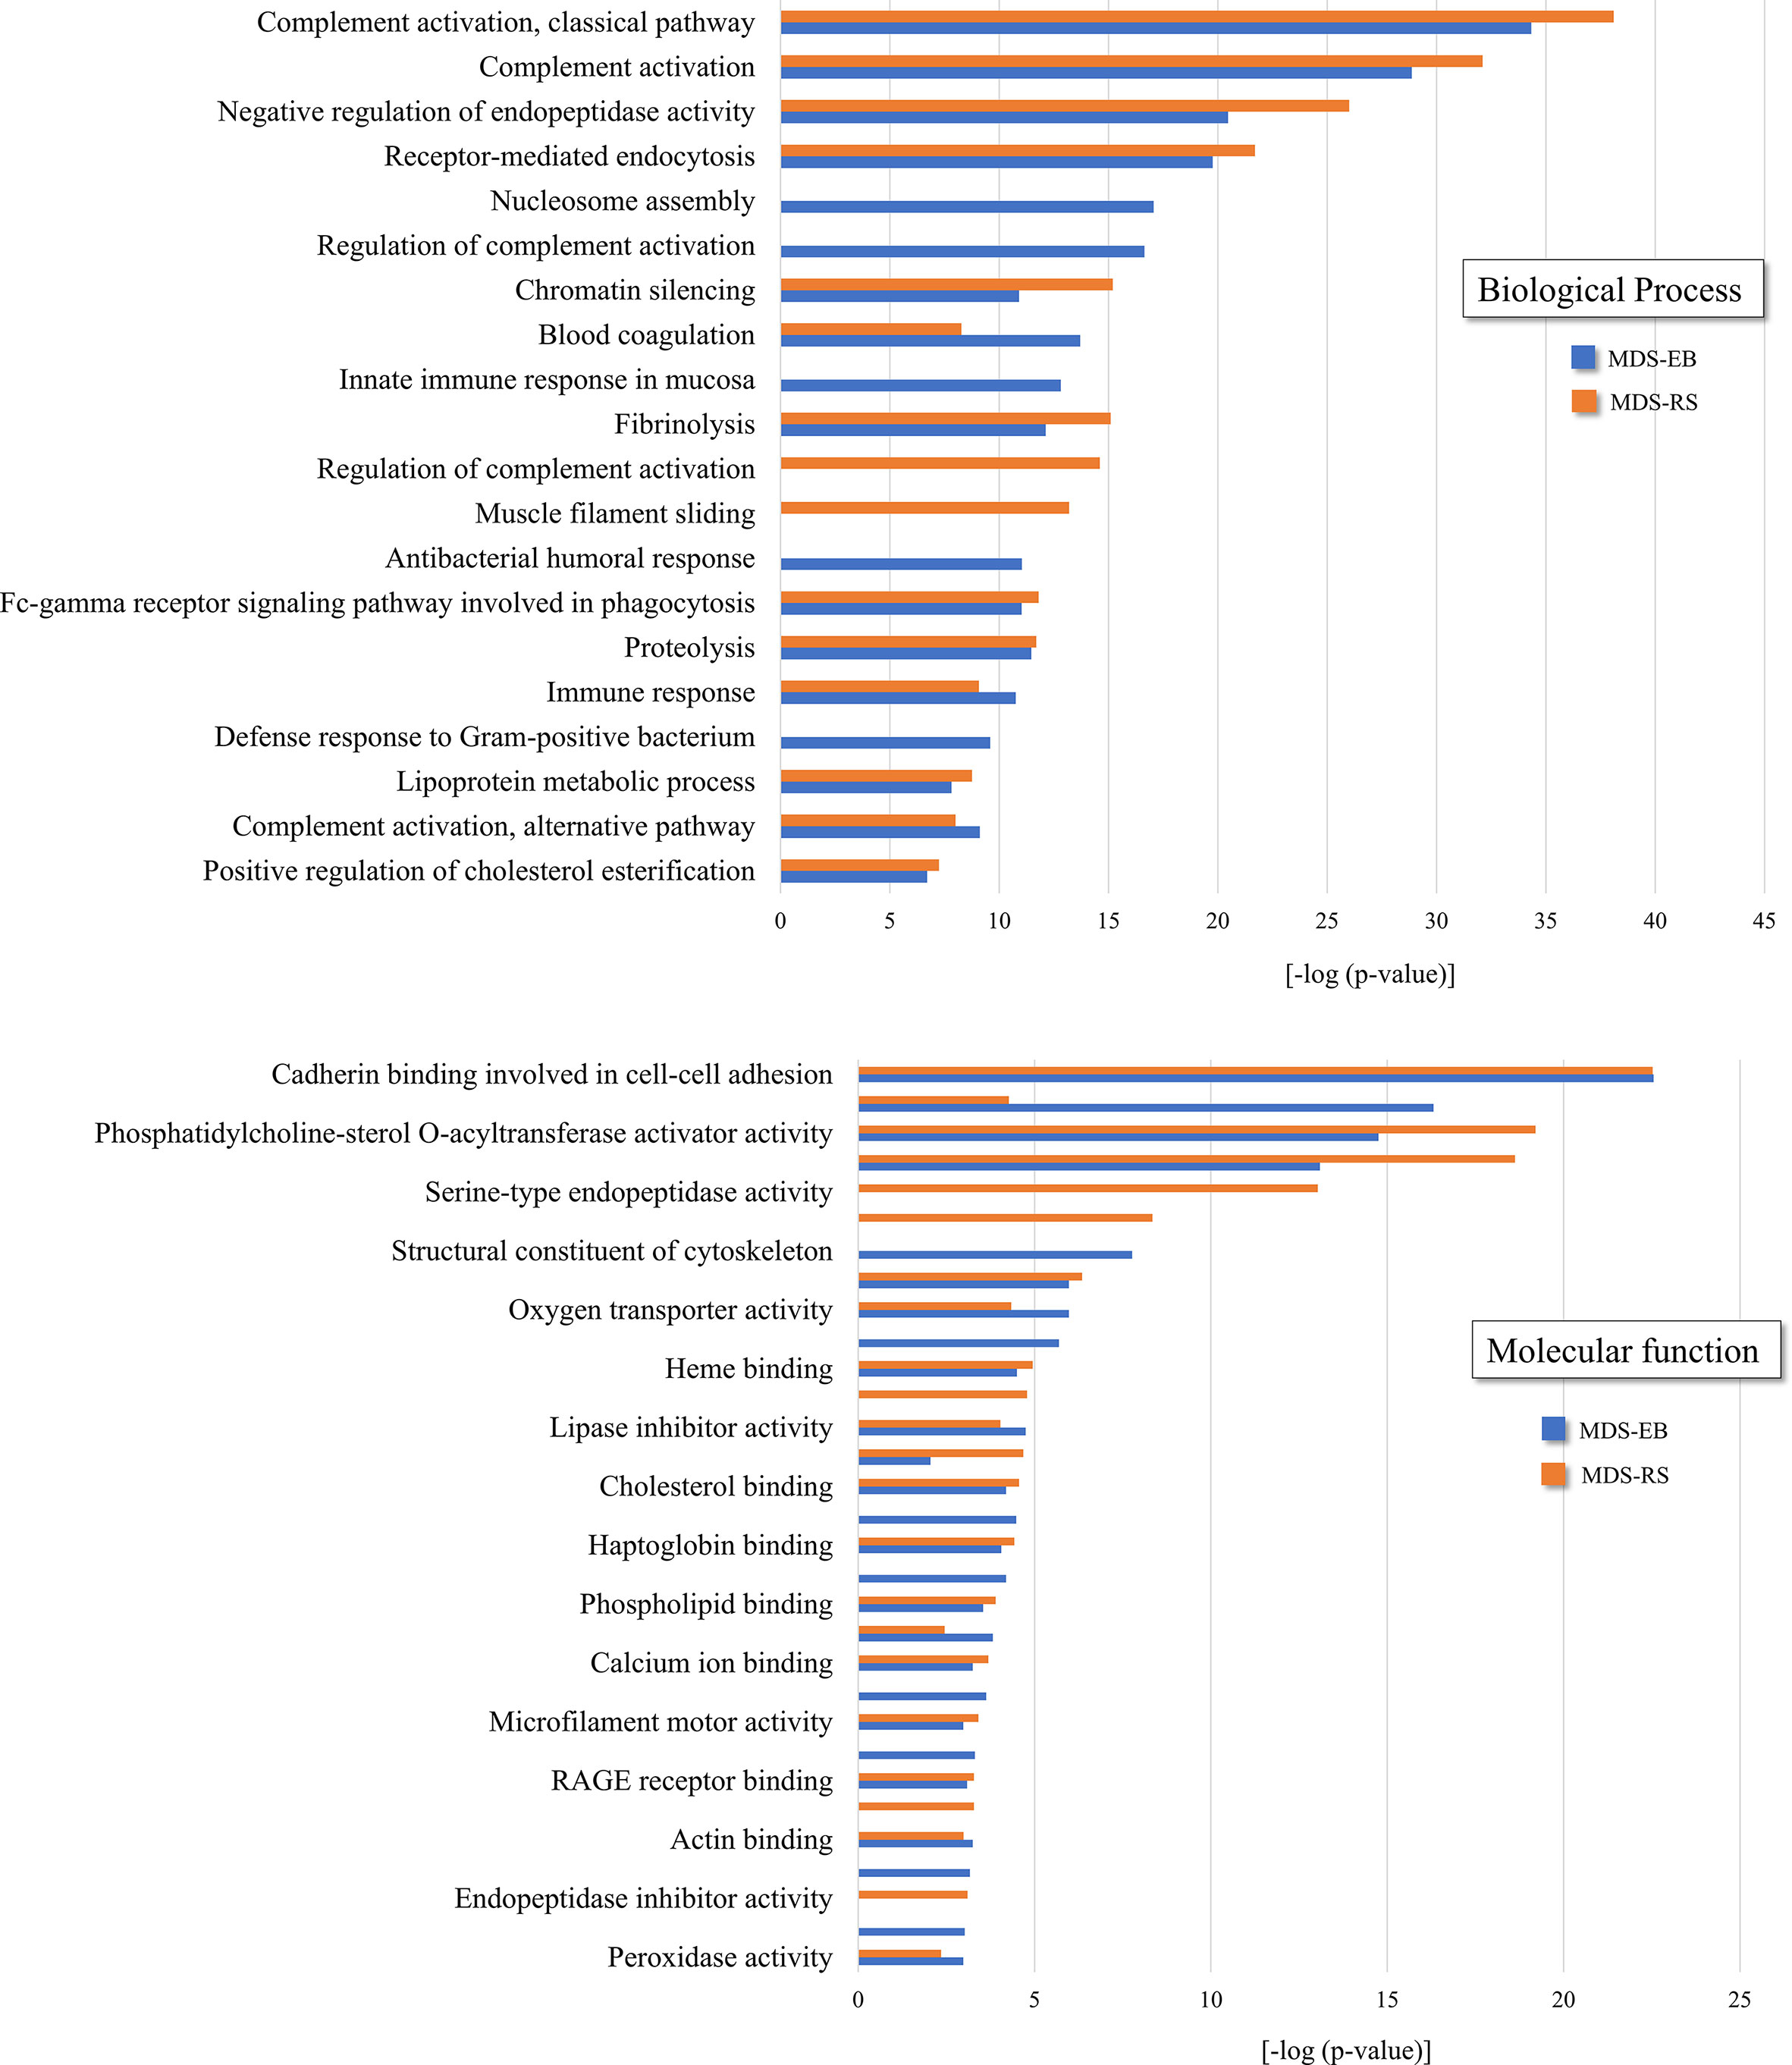
Figure 2 Functional clusters associated with bone marrow plasma proteins of patients diagnosed with MDS-RS and MDS-EB, according to DAVID Functional Annotation Bioinformatics Analysis (https://david.ncifcrf.gov). UniProt accession numbers were uploaded to DAVID platform, and clusters were defined by enrichment scores and p-values [−log (p-value)]. Information shown in the present figure is derived from the complete list of functional clusters presented in Supplementary Table 1.
3.1.1 Differentially Abundant Proteins in the Bone Marrow Plasma of Patients With Myelodysplastic Syndrome With Ring Sideroblasts and Myelodysplastic Syndrome With Excess Blasts
Based on the label-free mass spectrometry and data analysis by Progenesis QI software, there were 73 differentially abundant proteins (p < 0.05) in the bone marrow plasma of MDS-RS and MDS-EB patients (Supplementary Table 2). The partial least square discriminant analysis confirmed a pronounced contrast in the protein profiles of bone marrow plasma from MDS patients (Figure 3A). According to VIP scores, proteins identified as Lactoferrin, Coagulation factor V, Polyubiquitin-C, Immunoglobulin heavy variable 3-66, Inositol 1,4,5-trisphosphate receptor, MSN, Histone H2B type 1-J, cDNA FLJ56274, Kininogen 1 isoform, Talin-1, and Histone H1.5 made the most meaningful contributions to characterize the bone marrow plasma of MDS-EB patients. In contrast, Rheumatoid factor RF-IP12, Immunoglobulin kappa var. 1-6 IgG H chain, and CEP55 defined the major representation of bone marrow plasma from MDS-RS patients (Figure 3B; Table 3). Considering fold-change values, Polyubiquitin-C (UBC), MSN, and Talin-1 (TLN1) showed the highest relative abundances in MDS-EB, and CEP55 was the major protein of the bone marrow plasma from MDS-RS patients (Table 3; Supplementary Table 2).
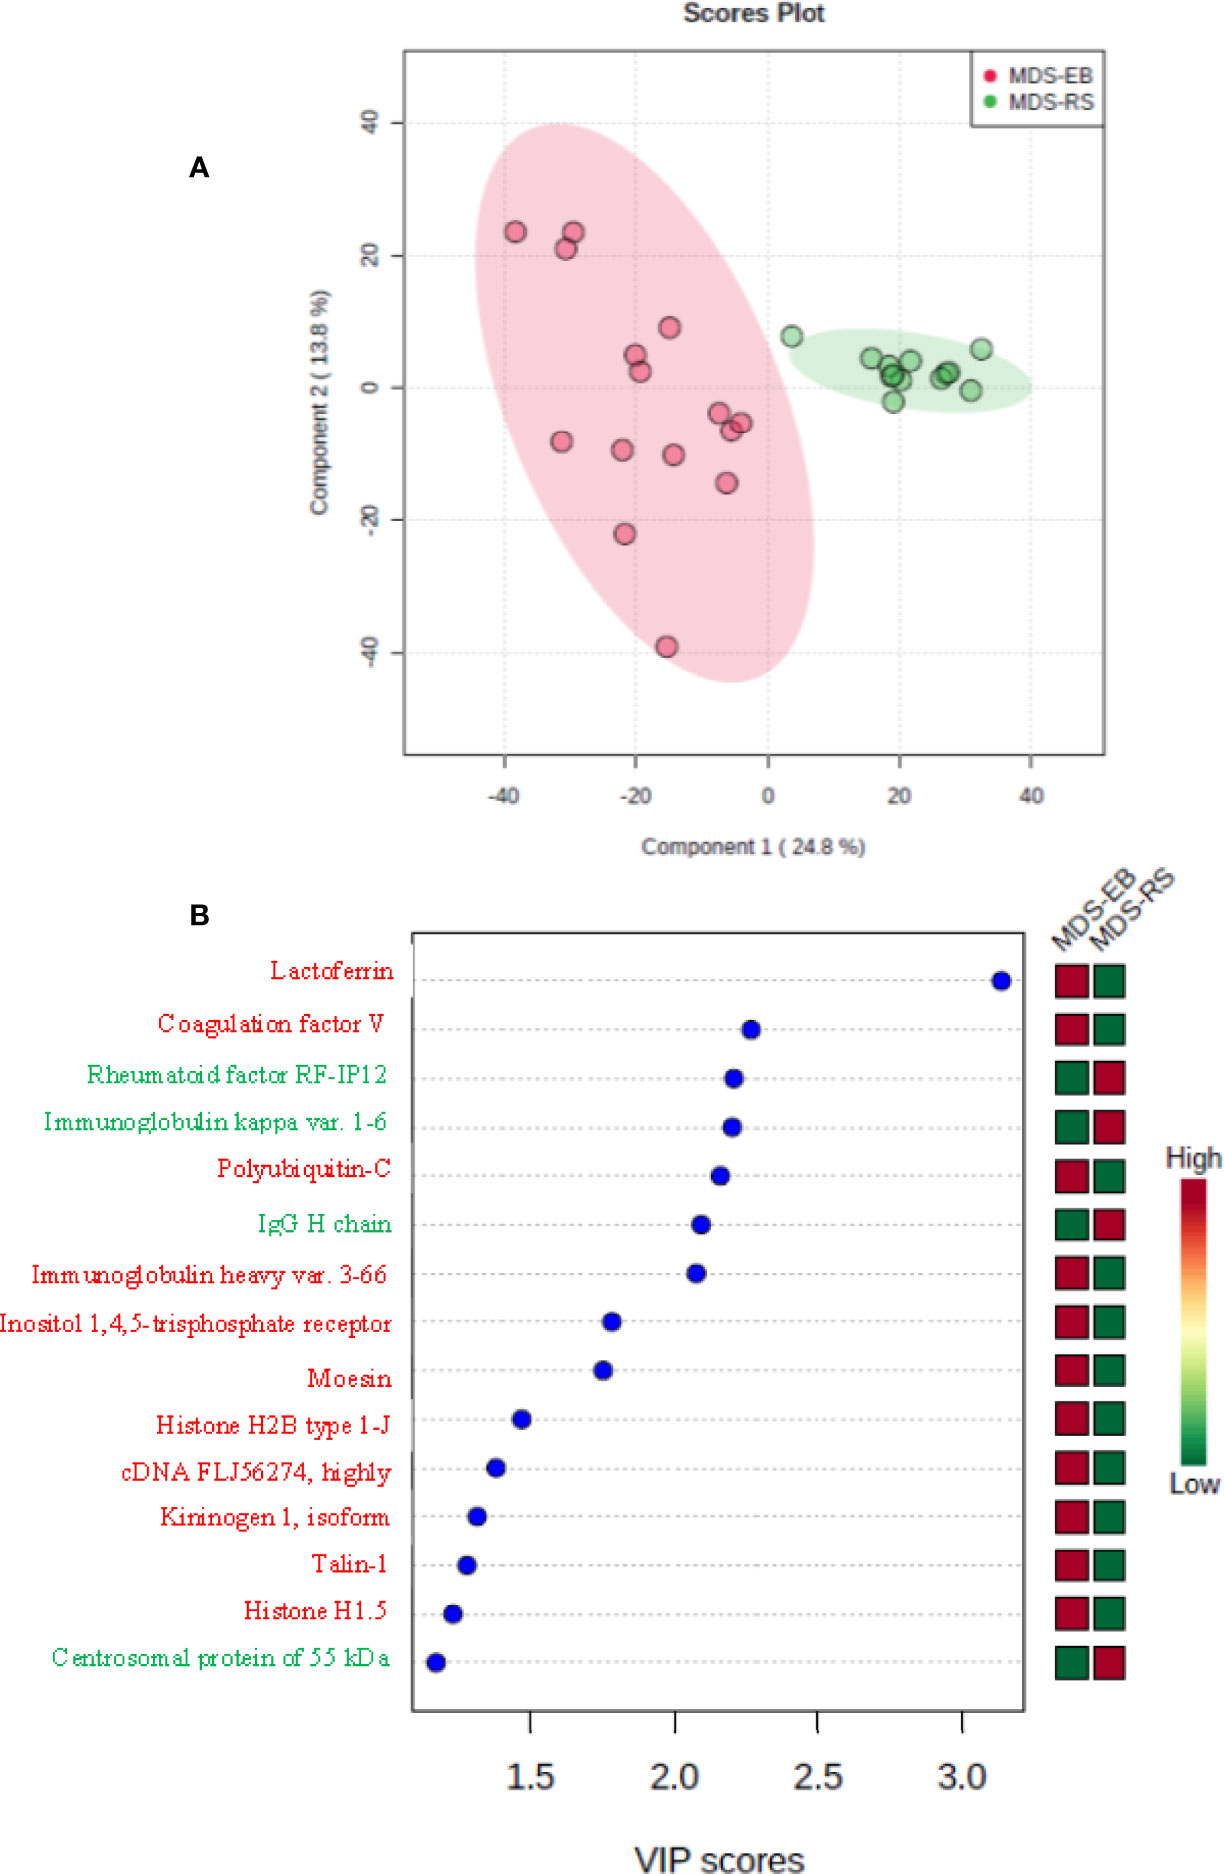
Figure 3 (A) Partial least square discriminant analysis (PLS-DA) of protein abundances in the bone marrow plasma of patients with myelodysplastic syndrome with ring sideroblasts (MDS-RS) and with excess blasts (MDS-EB). Explained variances of components are shown in brackets. (B) Variable importance in projection (VIP) scores associated with bone marrow plasma proteins, as identified by PLS-DA. Colored boxes on the right indicate the relative abundances of proteins in each MDS subtype.
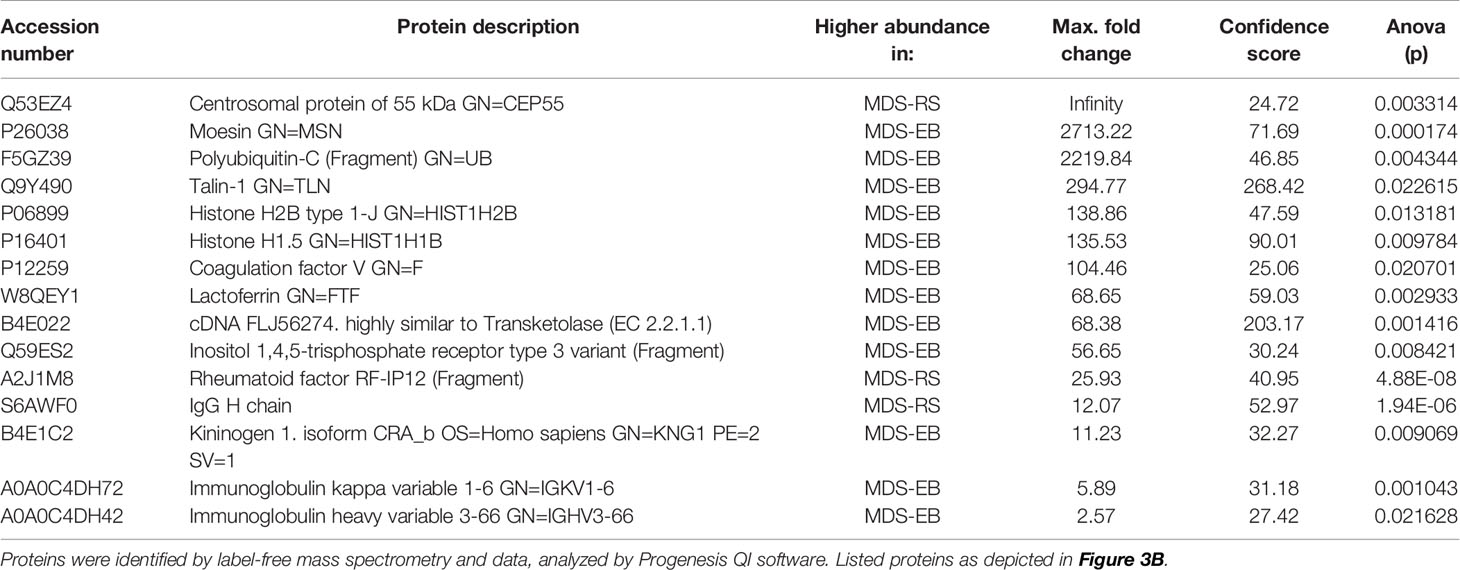
Table 3 Proteins of the bone marrow plasma with the highest VIP scores and different abundances in patients with myelodysplastic syndrome with ring sideroblasts (MDS-RS) and patients diagnosed with myelodysplastic syndrome with excess blasts (MDS-EB).
3.2 Study 2: Gene Expression in Mononuclear Cells of Myelodysplastic Syndrome Patients
Expression of CEP55, MSN, and UBC was similar in mononuclear cells from individuals with MDS-RS and MDS-EB (p > 0.05). TLN1 gene expression, however, was greater in mononuclear cells of MDS-RS than in mononuclear cells of MDS-EB patients (p = 0.049). Relative quantities of MSN, UBC, and TLN1 transcripts were similar (p > 0.05) in mononuclear cells of individuals with normal and abnormal karyotypes, irrespective of the MDS subtype. However, CEP55 gene expression was greater in MDS patients with abnormal karyotypes in comparison with patients with normal karyotypes (p = 0.045; Figure 4; Supplementary Table 3).
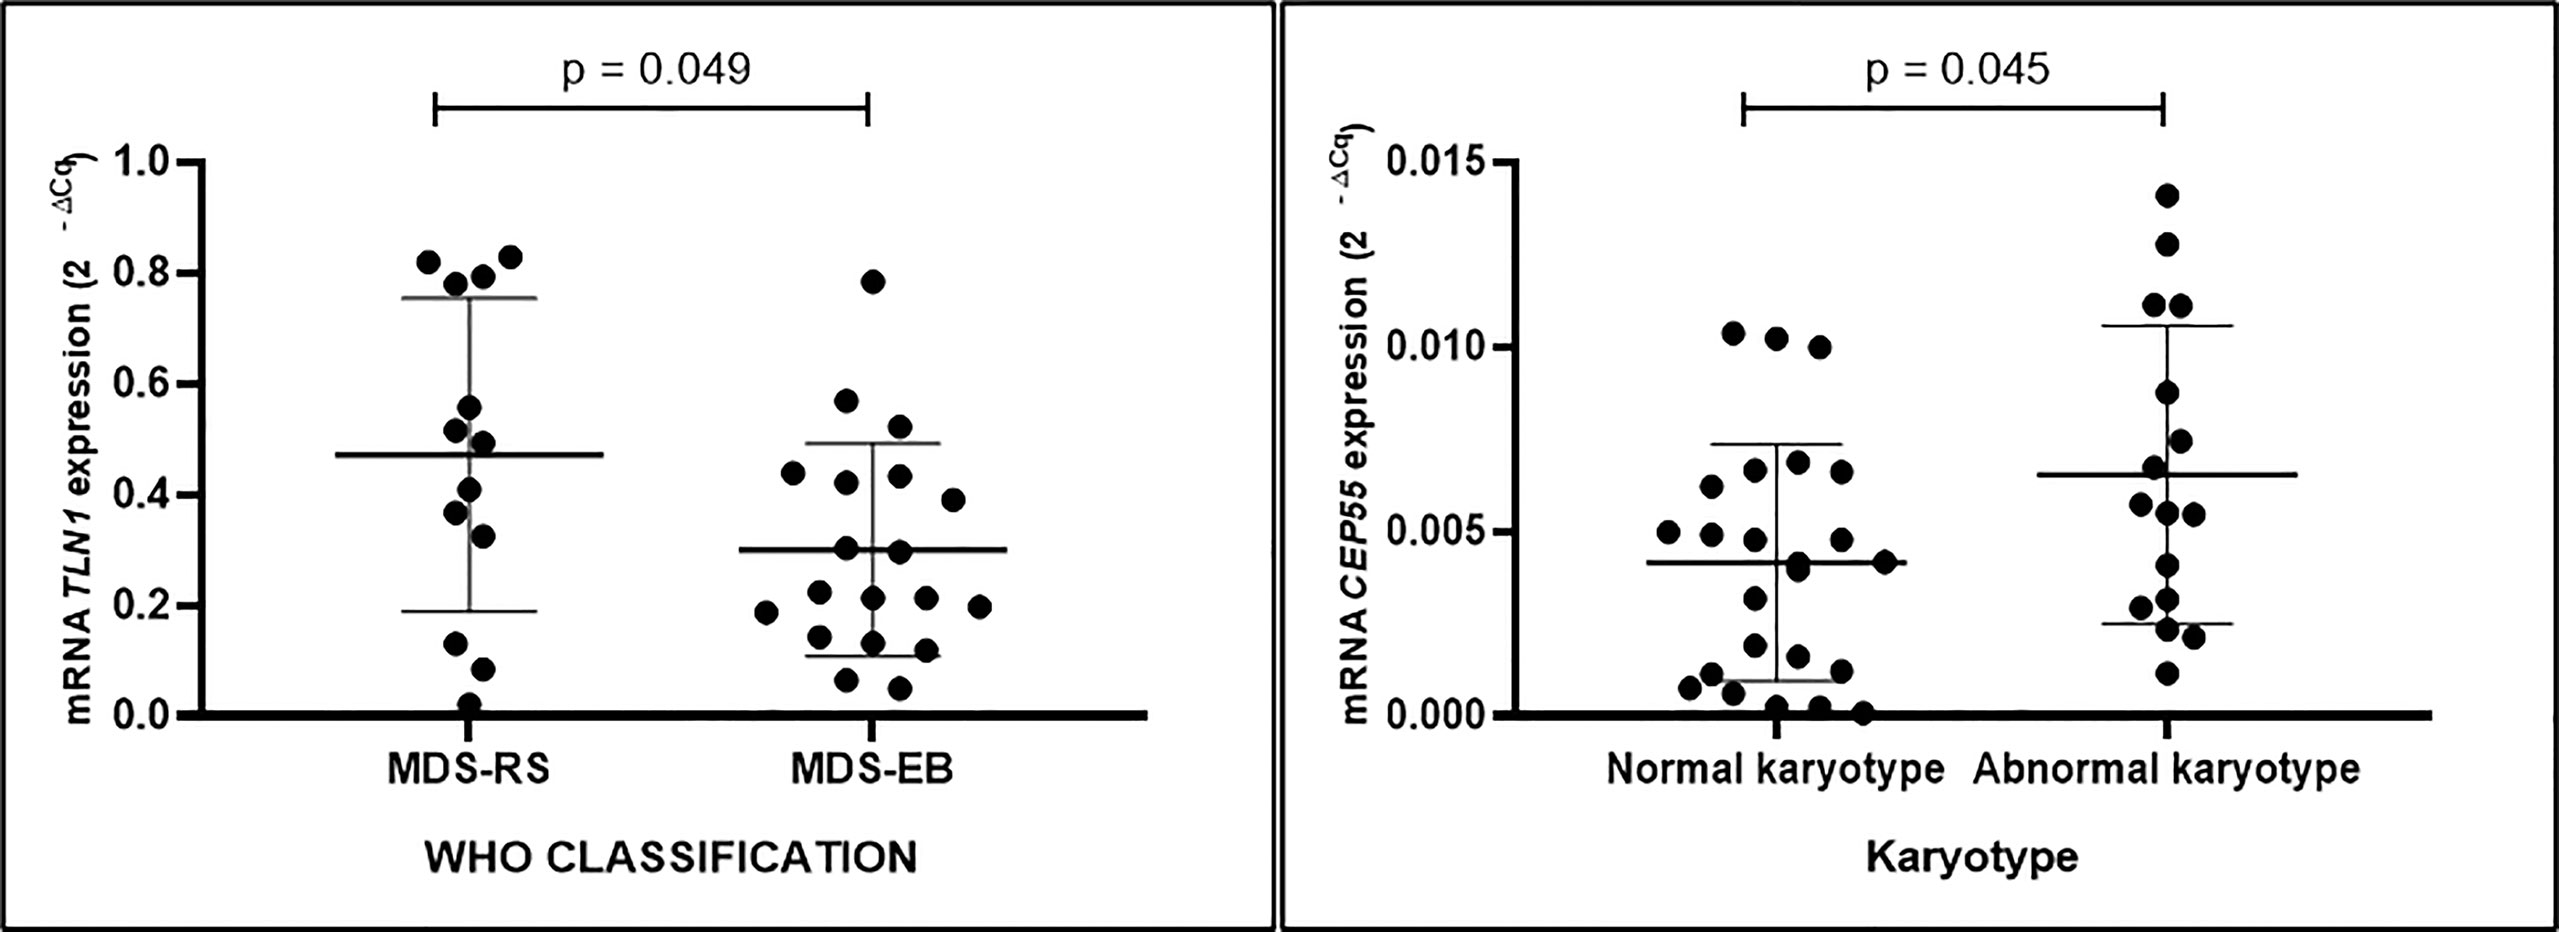
Figure 4 Quantitative data of TLN1 and CEP55 expression (2−ΔCq) based on qPCR analysis of total RNA extracted from bone marrow mononuclear cells of patients with myelodysplastic syndrome with ring sideroblasts (MDS-RS) and with excess blasts (MDS-EB) and patients with normal and abnormal karyotypes, as listed in Table 2.
3.2.1 Protein Networks, MiRNA–Gene Interactions, and CD34+ Cell Gene Expression
As determined by in silico models, the most significant (score ≥ 0.977) components of TLN1 interactome included vinculin, actin filament (F-actin)-binding protein, integrin beta-1, 2 and 3, and alpha-5, paxillin, amyloid beta A4 precursor protein-binding family B member 1-interacting protein, phosphatidylinositol 4-phosphate 5-kinase type-1 gamma, focal adhesion kinase 1, and alpha-actinin-1. The array of CEP55 interactions (score ≥ 0.969) included tumor susceptibility gene 101 protein, kinesin-like protein KIF23, nucleolar and spindle associated protein 1, Rac GTPase-activating protein 1, kinesin-like protein KIF11, disks large-associated protein 5, protein kinase TTK, cyclin-dependent kinase 1, abnormal spindle-like microcephaly-associated protein, and a DNA topoisomerase (Figure 5A). In silico analysis using the GeneMANIA platform indicated that CEP55, MSN, TLN1, and UBC shared pathways, domains, and physical interactions (Figure 5B).
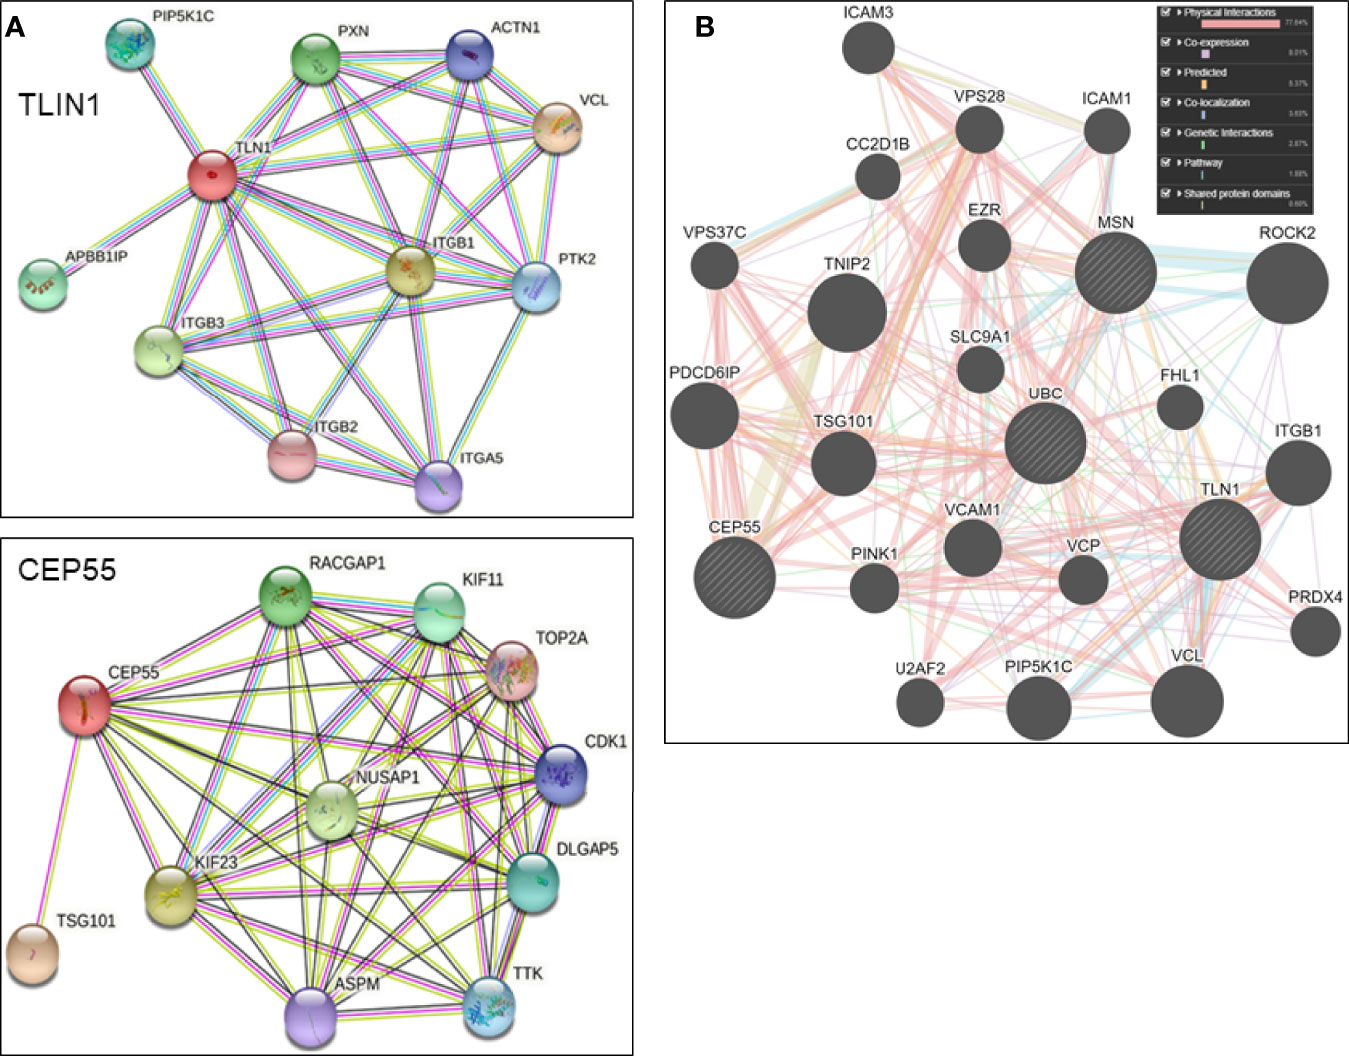
Figure 5 (A) Individual in silico networks associated with TLN1 and CEP55 according to String version 11.5 default settings (https://string-db), using Homo sapiens NCBI database. (B) Combined in silico networks of CEP55, MSN, TLN1, and UBC as determined by the default approach of GeneMANIA platform (www.genemania.org).
Based on the analysis conducted with the miRNet 2.0 database, TLN1 is regulated by onco-miRNAs and other miRNAs associated with cell cycle, bone regeneration, cell death, immune system, angiogenesis, and hematopoiesis, among others (Figure 6). CEP55 gene was regulated by miRNAs associated with bone regeneration, DNA damage, cardiotoxicity, cell cycle, regulation of Akt pathway, and onco-miRNAs, among others (Figure 6; Supplementary Table 4). In silico analysis of CD34+ cell gene expression showed that CPE55 expression was reduced while both TLN1 and MSN were increased in MDS patients compared to healthy controls (Figure 7; Supplementary Tables 1D, E).
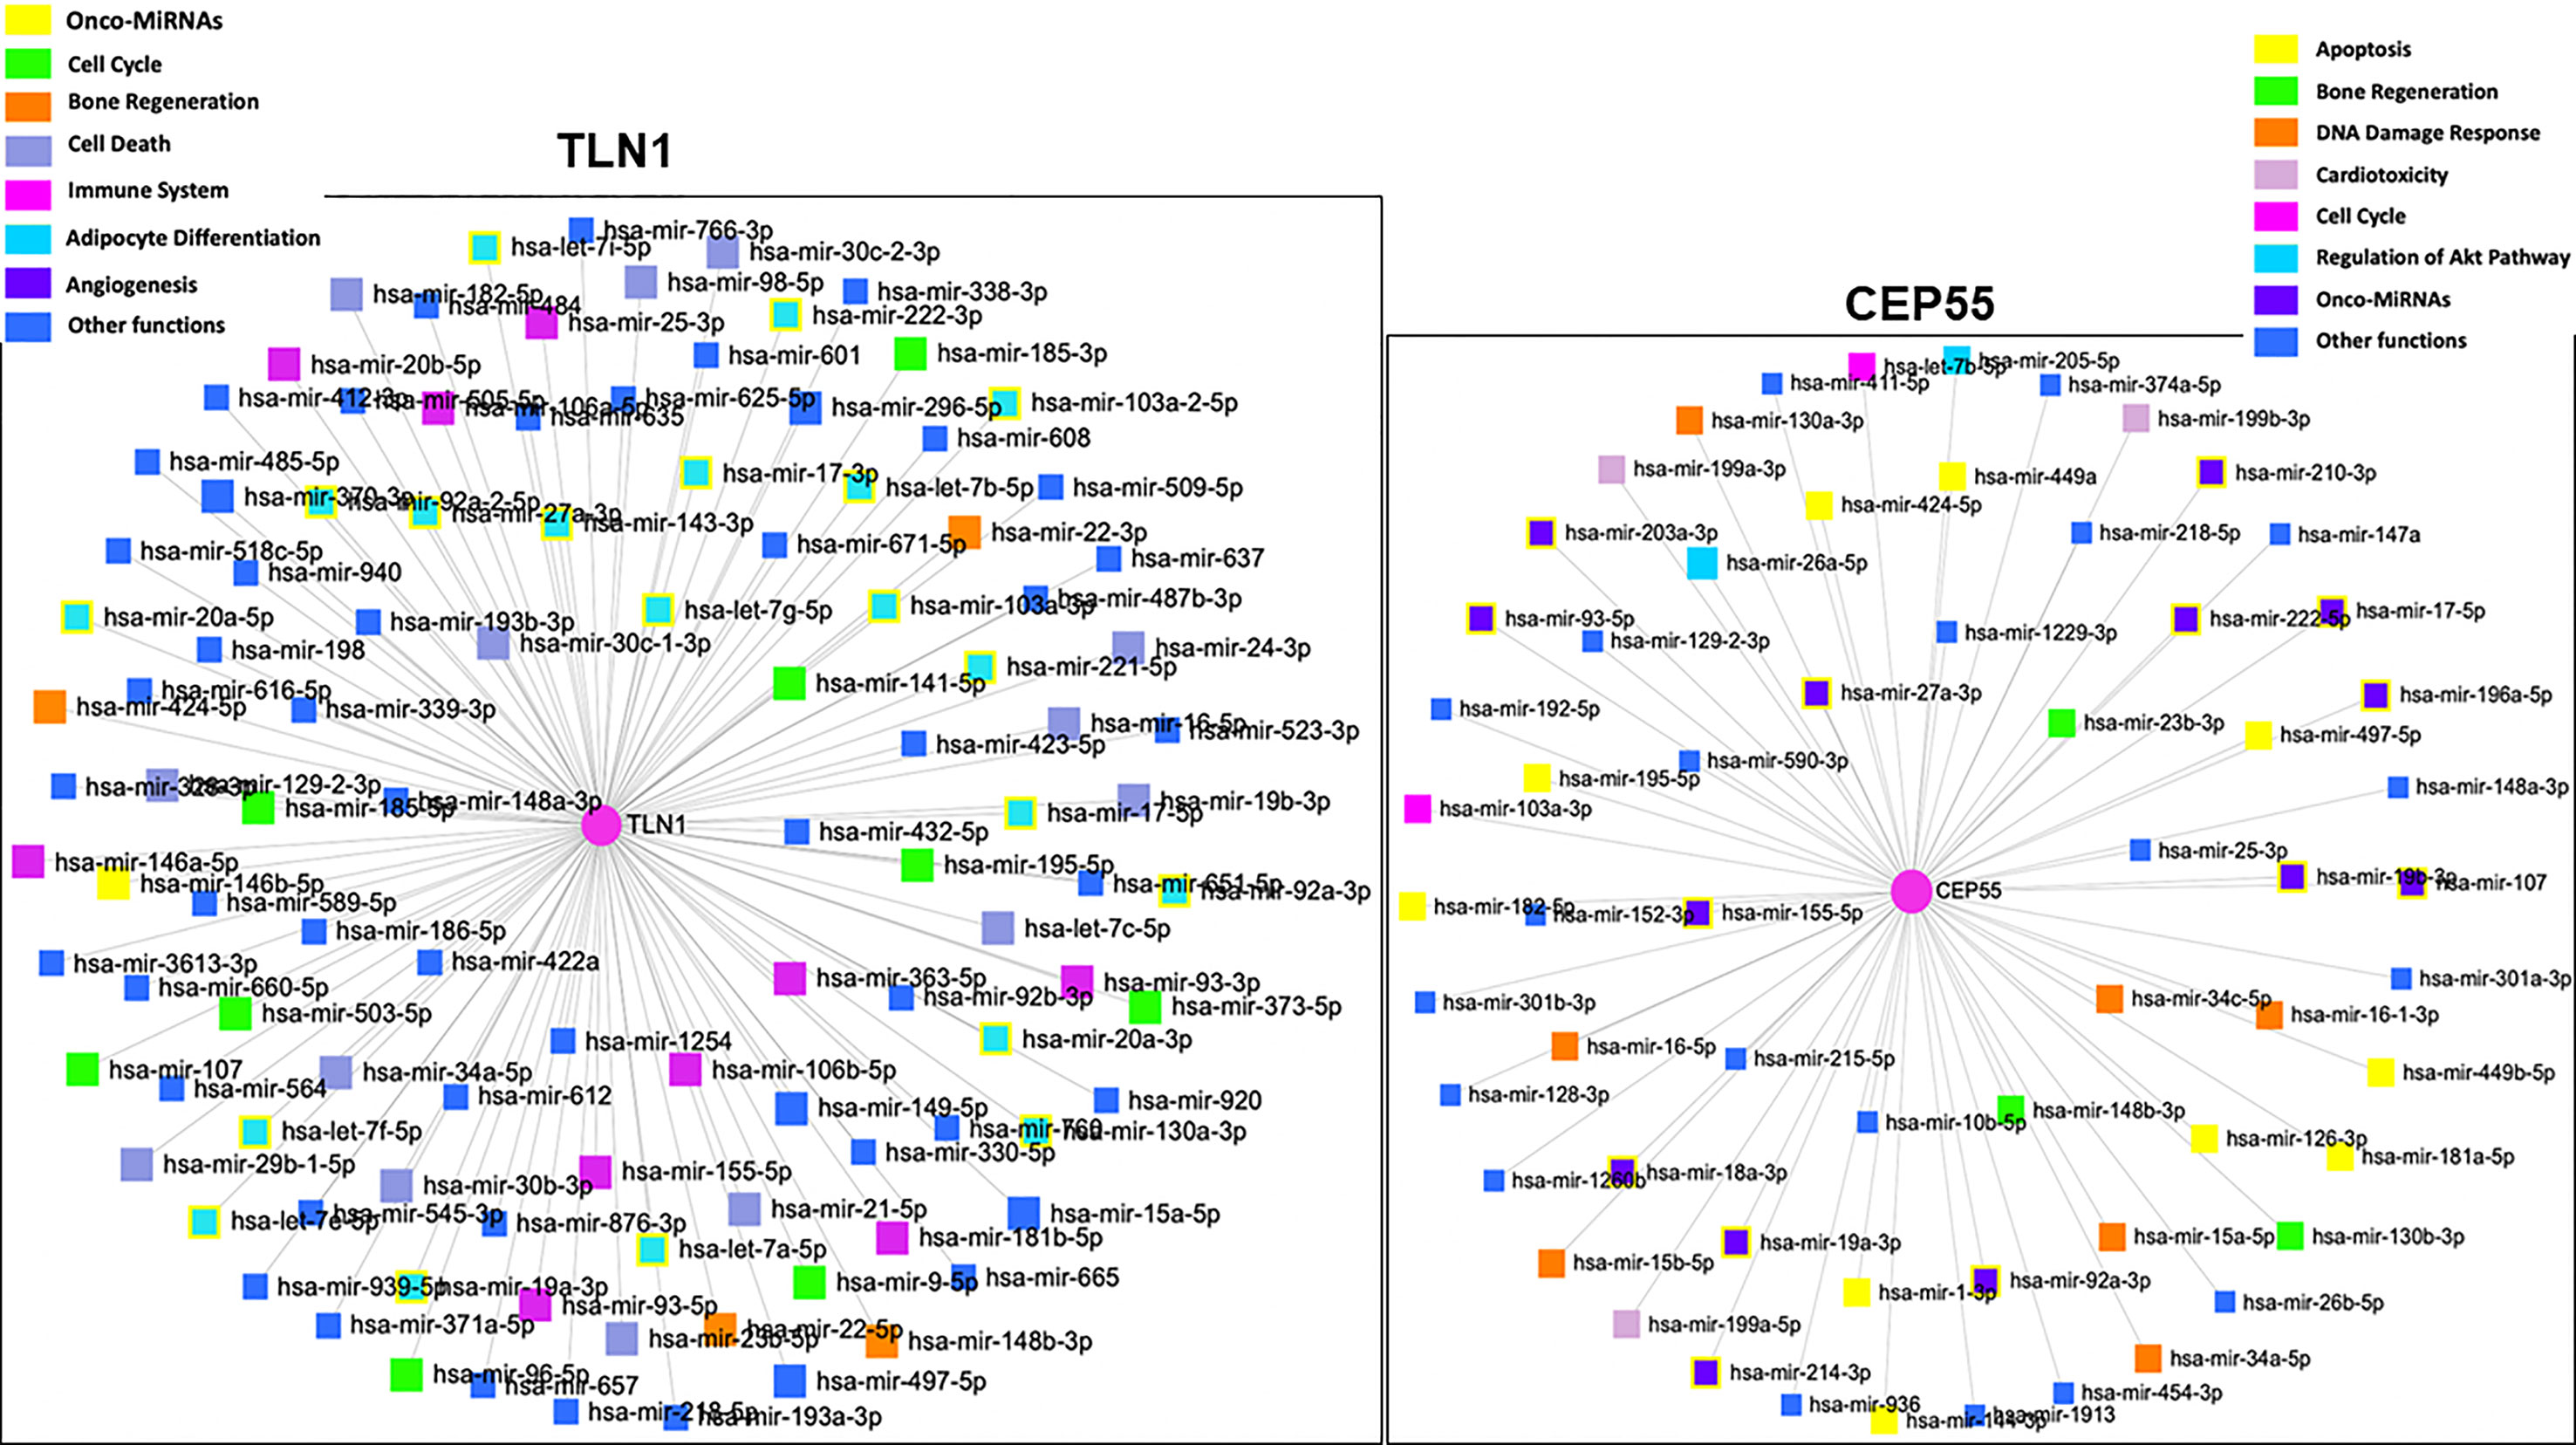
Figure 6 Network and gene set enrichment analysis of miRNAs associated with the regulation of human TLN1 and CEP55 according to the highest p-values obtained from miRNet database (https://www.mirnet.ca).
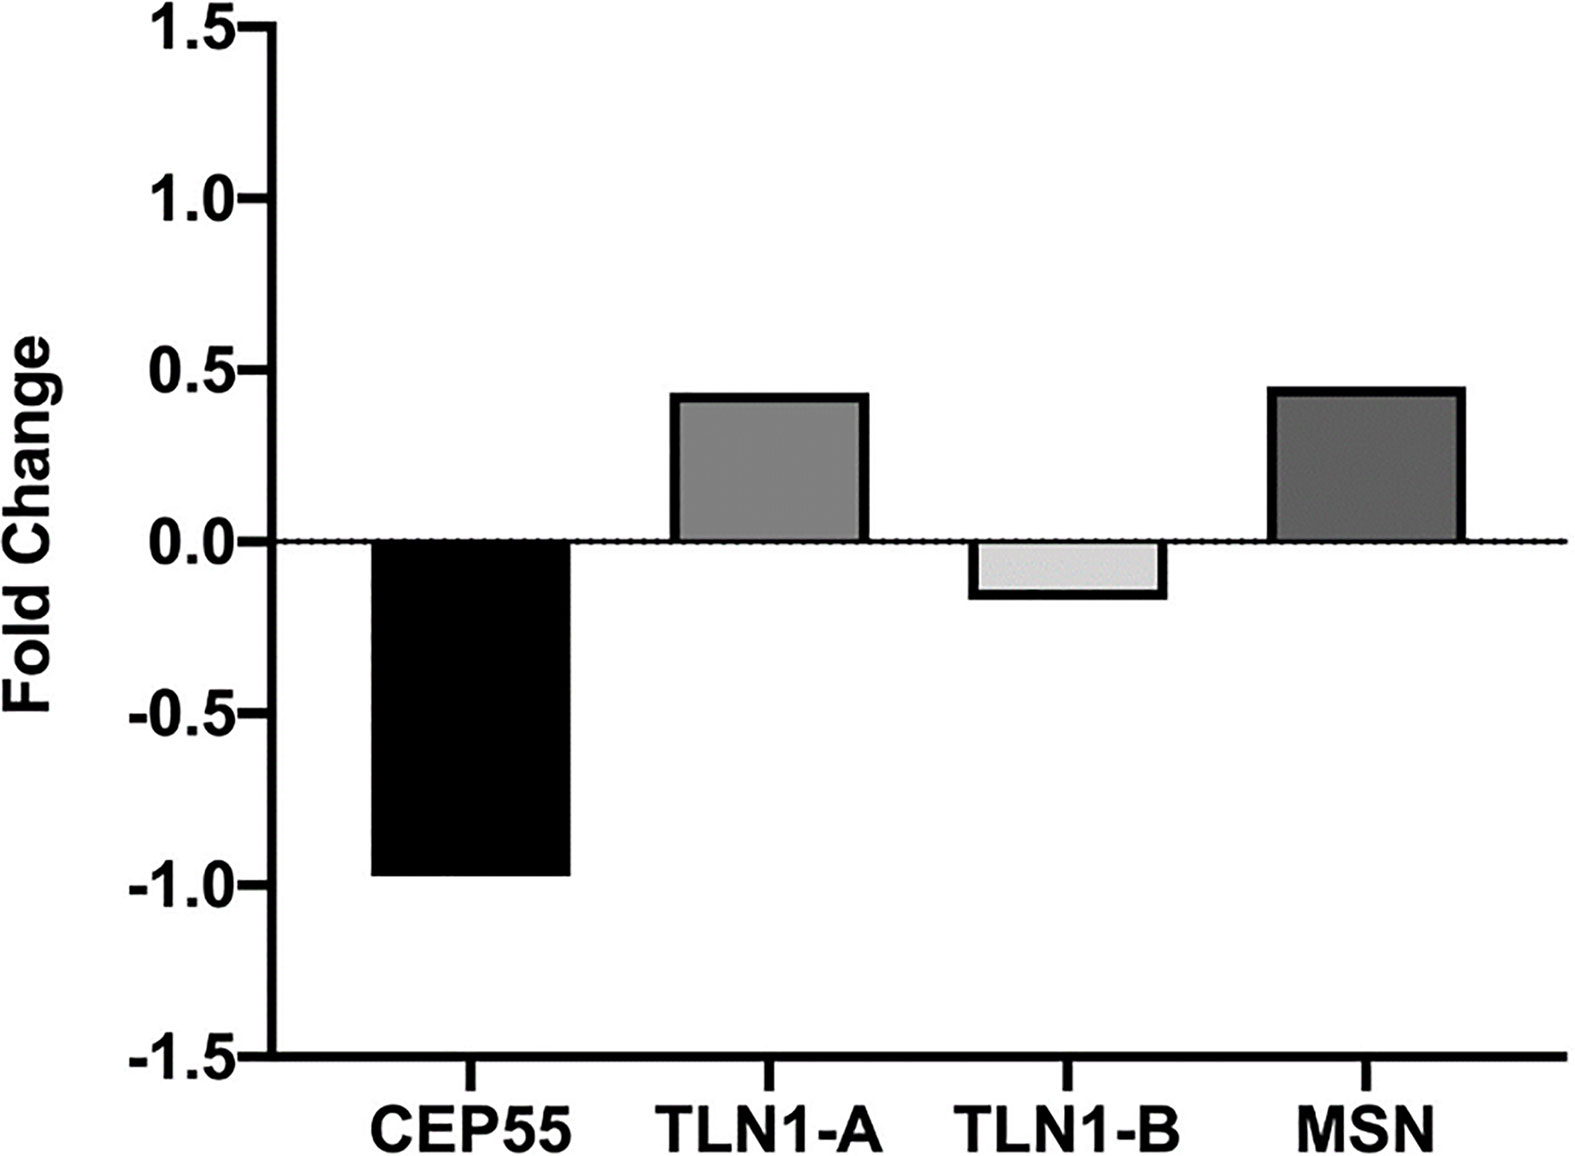
Figure 7 Relative CEP55, TLN1, and MSN expression in CD34+ cell markers from MDS patients presented in the Gene Expression Omnibus data bank (https://www.ncbi.nlm.nih.gov/geo/query/acc.cgi?acc=GSE58831). Analysis was conducted in silico based on bone marrow samples of 159 MDS patients and 17 healthy controls, and microarray gene expression was performed using the Affymetrix GeneChip Human Genome U133 Plus 2.0 arrays.
4 Discussion
Myelodysplastic syndromes are clinically heterogeneous and characterized by dysplasia of bone marrow cells, peripheral blood cytopenia, bone marrow insufficiency, disrupted hematopoiesis, and anemia, among other factors (1, 2–4). Molecular determinants of MDS pathobiology are complex and involve altered genomic and epigenetic factors, protein synthesis and structure, intracellular signaling, and mechanisms that control cell communication and fate. Therefore, our current results advance our knowledge about the molecular landscapes of MDS.
Mass spectrometry coupled with nano-high-performance liquid chromatography (nano-HPLC) allowed the identification of 1,194 proteins in the bone marrow plasma of MDS patients. Gene ontology biological processes and molecular functions basically followed the same pattern for BM plasma proteins of MDS-RS and MDS-EB patients, including complement activation and immune-related events. In fact, chronic inflammatory diseases associated with activated innate immune signaling pathways usually precede MDS, creating the concept that this event in hematopoietic stem cells (HSC) relates to MDS etiology. Immune response-related genes in HSC are overexpressed in more than 50% of MDS patients (44), and our analysis demonstrates that response to stimulus and immune system process were major biological processes associated with the BM plasma proteome of patients with MDS-RS and MDS-EB. Functional clusters associated with the BM plasma proteome included, as expected, immune mechanisms, endocytosis, nucleosome assembly, chromatin silencing, blood coagulation and fibrinolysis, cytolysis, and cell–cell adhesion, among others. There is an important interplay between chronic immune stimulation and MDS pathogenesis. In agreement with this concept, a study conducted by Pellagatti et al. (45) reported upregulation of interferon-stimulated genes in CD34+ cells obtained from the bone marrow of MDS patients. There is also robust evidence of immune deregulation in MDS due to the presence of autoreactive T-cell clones and that interferon γ had meaningful inhibitory effects on hematopoietic stem cells. We have previously detected, in a study with 111 MDS patients (46), that interferon regulatory genes are upregulated and linked to MDS pathogenesis, confirming the fundamental link between genomic instability and immune activation.
Considering the scenario with 1,194 proteins identified in the bone marrow plasma, univariate and multivariate statistical approaches grouped 15 proteins that most defined MDS-RS and MDS-EB subtypes. Among this select group, TLN1, MSN, and UBC had the greatest abundances in the bone marrow plasma of MDS-EB, and CEP55 showed the highest abundance in MDS-RS patients. CEP55 is a major player in cytokinesis, participates in PI3K/AKT signaling pathway, and is associated with tumor progression (47). MSN, in turn, connects actin filaments with the plasma membrane and contributes to cell shape, membrane transport, signal transduction, T- and B-cell homeostasis, and macrophage phagocytosis. Experimental evidence support UBC’s roles in autophagy and signaling in cancer cells (48) and attachment of ubiquitin types to other proteins modulate DNA repair, cell-cycle communication, lysosomal and protein degradation, and kinase activation, among other events (49). As a cytoskeleton molecule, TLN1 connects integrin domains to actin and intermediate filaments, helping cell–cell and cell–extracellular matrix (ECM) attachment, cell migration, and signal transduction (50, 51). In silico analysis based on the GeneMANIA platform showed pathways, domains, and physical interactions shared by CEP55, MSN, TLN1, and UBC, indicating that the actual work of these proteins certainly involves more complex mechanisms than those foreseeing when only their individual roles are analyzed.
Proteomics data gathered in Study 1 and the well-known bio tasks of CEP55, MNS, UBC, and TLN1 prompted us to investigate the expression of these genes in a follow-up study with 45 patients. In this case, TLN1 was overexpressed in mononuclear cells from MDS-RS when compared to MDS-EB patients. TLN1 contains alpha-helices and post-translational modification sites (https://alphafold.ebi.ac.uk/entry/Q9Y490), with actin- and integrin-binding domains (50, 52, 53). TLN1 is a player in mechanotransduction and filopodia function (54, 55), and talin dysregulation results in pathological phenotypes with altered cell spreading, migration, and survival (56, 57). Talin is associated with enhanced cell proliferation (common phenomena of blasts in MDS-EB), anoikis resistance and metastasis (57, 58), hematologic disorders (54), and platelet and neutrophil activation (59). Talin-integrin interdependence affects endothelium linkage, migration of platelets and neutrophils (59, 60) and leukocyte function (61), and TLN1 knockout mouse embryos have defective angiogenesis (62). From the perspective of clinical practice, we know that MDS-EB shows a high risk of AML transformation due to an increase in proliferation and survival of blasts. Thus, functional studies are needed to evaluate if TLN1 expression is related to AML transformation and, if so, this information will generate markers of MDS pathogenesis and possible targets of treatment.
Why, in our research, TLN1 was more abundant in the bone marrow plasma of MDS-EB and TLN1 gene was prevalent in mononuclear cells of MDS-RS patients is not clearly understood. Bone marrow plasma obviously contains molecules synthesized by BM cells and components from blood, suggesting that the content of BM plasma does not entirely reflect what comes from mononuclear cells. Moreover, mRNA and protein quantities in a given biological entity can be unrelated (63–66), and cell lysis and/or apoptosis may have occurred during the collection and separation of BM plasma. Another possible explanation is that MDS-RS cases present serious problems of splice machinery (mutation of SF3B1), leading to disrupted mRNA translation, with increases in some mRNAs without proportional changes in protein synthesis. In this regard, comparisons between protein abundances in BM plasma and mRNA quantities in mononuclear cells are not straightforward because two levels of molecular information were actually generated in our studies, i.e., proteomics of BM plasma and qPCR in mononuclear cells. Thus, these technical approaches provide complementary and not conflicting pieces of information. High TLN1 abundance in the BM plasma of patients with a high-risk MDS subtype (MDS-EB) may relate to TLN1-mediated activation of FAK/AKT signaling and anoikis resistance (67). Low TLN1 gene expression detected in mononuclear cells of MDS-EB patients could be the result of impaired talin/integrin complex.
In silico analyses outline TLN1 interactions with proteins that regulate cell–cell and cell–ECM adhesion, cell migration, apoptosis, and intracellular signals, such as vinculin, integrins, and A4 precursor protein-binding family B member 1-interacting protein (APBB1IP). Vinculin is downregulated in mononuclear cells of MDS patients (21), and APBB1IP is a RAS-related protein acting in high cell proliferation and AML transformation in MDS-EB cases (68). In silico models also identified that onco-miRNAs and miRNAs linked to cell cycle control and death, immune system, angiogenesis, and hematopoiesis are capable of regulating TLN1 expression. Some of those miRNAs, such as miR-17-3p and miR-17-5p, are upregulated in the BM of patients with MDS-RS, refractory cytopenia with multilineage dysplasia (RCMD), and RCMD with ringed sideroblasts, according to a recent review (69) and other studies (70–72). Other miRNAs, such as miR-27a-3p and miR-16-5p, were reduced in the plasma of patients with refractory cytopenia with unilineage dysplasia, refractory anemia with ringed sideroblasts, RCMD, MDS-EB1, and MDS-EB2. Hematopoiesis-related miR-34a-5p and miR-146b-5p were increased in plasma and extracellular vesicles of MDS patients with multilineage dysplasia, MDS-RS, MDS with isolated del(5q), MDS-EB 1, and MDS-EB 2. Given its functional properties and association with cancer processes (54, 73), TLN1 is indeed a potential drug for targeted therapy (74), but more investigation is needed to decipher how drugs should be developed to tackle protein action and/or TLN1 expression. Considering that hematopoietic stem and progenitor cells (HSPCs) are important for MDS prognosis and treatment, we performed an in silico analysis of CD34+ gene expression and verified that CEP55 was reduced and both TLN1 and MSN expressions were increased in the bone marrow of MDS patients without any stratification.
As defined in Study 1, CEP55 was more abundant in the bone marrow plasma of MDS-RS patients. Remarkably, we observed in Study 2 that increased CEP55 expression in mononuclear cells was linked to chromosomal abnormality in MDS patients, regardless of MDS subtypes. CEP55 has domains (https://alphafold.ebi.ac.uk/entry/Q53EZ4) involved in abscission, midbody localization (75), dimerization (76–78), and a ubiquitin-binding domain required for CEP55 action on cytokinesis (75, 77). CEP55 influences aneuploid cells during perturbed mitosis (79), and high CEP55 expression in murine models facilitates exit from mitotic arrest, resulting in aneuploidy and resistance to anti-mitotic drugs. CEP55-depleted organisms have increased multinucleated cells and/or cells arrested at the midbody stage (80). Based on in silico modeling, CEP55 interacts with components of the ESCRT-I complex, a regulator of vesicular transport, cell growth, and differentiation; a microtubule-associated protein; a regulator of Rac GTPase activity and cell cycle during carcinogenesis; and cyclin-dependent kinases. This scenario reflects the multidimensional attributes of CEP55. Similar to TLN1, the expression of CEP55 is potentially regulated by oncogenes and miRNAs linked to DNA damage response, cell cycle, and AKT pathway. Several genes that define normal blood cells are regulated by miRNAs, and MDS prognosis is linked to certain miRNAs of the bone marrow, peripheral blood, and mononuclear cells (69). In fact, some CEP55-controlling miRNAs identified in our in silico model have been listed as differentially expressed in other patients with MDS (70, 71, 81, 82).
Chromosomal abnormalities occur in up to 50% of MDS cases, mostly caused by problems in the spindle assembly checkpoint (SAC), which controls mitotic progression, chromosome alignment, and segregation. SACs delay anaphase until accurate kinetochore-microtubule attachment at metaphase and inhibition of SAC prolongs mitotic arrest. The majority of antimitotic chemotherapies alter microtubule dynamics, but cancer cells can bypass mitotic arrest and prematurely exit mitosis. High CEP55 expression is a marker of chromosomal alterations, aneuploidy, and poor prognosis of cancer patients (79, 83, 84) and promotes tumorigenesis in transgenic mice (85) as well. Clinical practice indicates that overall survival reaches 3 years in MDS patients with normal karyotypes, while cases with complex karyotypes show a 6-month survival. As CEP55 consistently relates to mitotic slippage in certain types of cancers, we urgently need to study the effects of CEP55 reduced expression and if CEP55 plays a central role in the genesis of cytogenetic abnormalities.
In conclusion, proteomic and gene expression approaches were used to unfold some of the molecular signatures related to MDSs. We recognize that our study has limitations, as we did not evaluate other MDS subtypes such as MDS with multilineage dysplasia, MDS secondary to therapy, and hypoplastic MDS. Also, gene expression was not analyzed in specific HSPC such as CD34+ cells, a marker for prognosis and treatment of MDS. To our knowledge, however, this is the first evidence of altered TLN1 and CEP55 in both cellular and non-cellular bone marrow compartments of patients with low- and high-risk MDS and with normal vs. abnormal karyotypes. The current diagnostic criteria and classification for MDS include bone marrow chromosomal alterations, blast count, and cytopenia, which are important to be analyzed for the prognosis of untreated patients. Given the complex and multifactorial characteristics of MDS, a deep molecular investigation of altered pathways provides a better understanding of the disease prognosis, its evolution to AML, and resistance to treatment. The novel potential markers CEP55 and TLN1 bring insights into the molecular signatures of MDS, setting the foundation for further investigations with stratified patients and HSPC and helping in the MDS prognosis and targeted therapy.
Data Availability Statement
The datasets presented in this study can be found in online repositories. The names of the repository/repositories and accession number(s) can be found below: https://massive.ucsd.edu/ProteoSAFe/static/massive.jsp MassIVE ID=MSV000088457.
Ethics Statement
The studies involving human participants were reviewed and approved by the Ethics Committee of the Federal University of Ceará, UFC (#69320817.7.0000.5054). The patients/participants provided their written informed consent to participate in this study. Written informed consent was obtained from the individual(s) for the publication of any potentially identifiable images or data included in this article.
Author Contributions
AAM, CLMF, AMAM, MOM-F, CP, and RFP designed the study and the overall organization of the article. RTGO and RFP collected the bone marrow samples and analyzed the karyotypes. MJBB, AMAM, WF, and RMO prepared the samples and carried out the proteomic analysis. MVS, WF, and CAOR provided the expertise and technical and financial support for the mass spectrometry, data search, and Progenesis analysis. DPB, RTGO, and CLMF did the RNA isolation from mononuclear cells and conducted qPCR and gene expression analysis. AGV, KMF, GGCC, and CRKP contributed to the bioinformatics analysis. MEAM, SMMM, MOM-F, AAM, CP, and RFP were responsible for the supervision of students and postdoctoral fellows and provided financial and institutional support, which was essential for the completion of the project. AAM, MJBB, CLMF, AMAM, CP, WF, RTGO and RFP contributed to the writing process. Final text editing was done by AAM, CLMF, AMAM, CP, and RFP. All authors listed have made a substantial, direct, and intellectual contribution to the work and approved it for publication.
Funding
The present study was funded by the Ceará State Foundation for the Support of Scientific Development (FUNCAP) and The Brazilian Council for Science and Technology Development (CNPq) (grant # PR2-0101-00049.01.00/15). Additional support was provided by CNPq to CLMF (grant # 437037/2018-5), CP (grants # 440755/2018-2, 434821/2018-7, and 303102/2013-6), and AAM (grant # 313160/2017-1). The authors also appreciate the support of FUNCAP, CNPq, and The Brazilian Commission for Higher Education (CAPES) for graduate student and postdoctoral scholarships.
Conflict of Interest
The authors declare that the research was conducted in the absence of any commercial or financial relationships that could be construed as a potential conflict of interest.
Publisher’s Note
All claims expressed in this article are solely those of the authors and do not necessarily represent those of their affiliated organizations, or those of the publisher, the editors and the reviewers. Any product that may be evaluated in this article, or claim that may be made by its manufacturer, is not guaranteed or endorsed by the publisher.
Acknowledgments
The authors appreciate the support from the members of the Experimental Oncology Laboratory, especially from Silvana França, from the Center for Research and Drug Development (NPDM) of the Federal University of Ceará, and the Laboratory of Protein Chemistry and Biochemistry, at the University of Brasília.
Supplementary Material
The Supplementary Material for this article can be found online at: https://www.frontiersin.org/articles/10.3389/fonc.2022.833068/full#supplementary-material
Supplementary Figure 1 | (A) Uni-dimensional gel electrophoresis of bone marrow (BM) plasma proteins. Gels were made with 12.5% acrylamide and BM samples were obtained from a single MDS patient (not included in the present study). (B) Two-dimensional electrophoresis of BM plasma proteins (based on protocols we have previously described in detail (29)). Briefly, 13-cm strips (pH 3-10; GE Healthcare, USA) were rehydrated in a solution containing BM plasma proteins (300 µg) and subjected to isoelectric focusing. The second dimension was run as in (A). All 1-D and 2-D gels were stained with Coomassie blue and scanned at 300 dpi (Image Scanner, GE Healthcare, USA). Gel # 1 refers to BM sample from a patient with MDS with single lineage dysplasia (MDS-SLD); gels # 3, 6 and 7 refer to samples of BM plasma from MDS-RS patients; gels # 2, 4 and 5 contain BM plasma proteins from MDS-EB patients.
Supplementary Table 1 | (A) Proteins of the bone marrow plasma from patients (as listed in ) with myelodysplastic syndrome. Proteins were identified by label-free mass spectrometry and data, analyzed by Progenesis QI software. (B) and (C) Functional clusters associated with bone marrow plasma proteins of patients diagnosed with myelodysplastic syndrome with ring sideroblasts (MDS-RS) and with myelodysplastic syndrome with excess blasts (MDS-EB), according to DAVID Functional Annotation Bioinformatics Analysis (https://david.ncifcrf.gov). Uniprot accession numbers were uploaded to DAVID platform and clusters were defined by enrichment scores and p-values [-log (p-value)]. Data refer to patients listed in . (D) and (E) Quantitative data, statistical analysis and gene symbols associated with in silico analysis of CEP55, TLN1 and MSN gene expression in CD34+ cell markers from MDS patients presented in the Gene Expression Omnibus (GEO) data bank (https://www.ncbi.nlm.nih.gov/geo/query/acc.cgi?acc=GSE58831). This study evaluated gene expression from 159 patients with MDS patients and 17 healthy controls from bone marrow samples and microarray gene expression was performed using the Affymetrix GeneChip Human Genome U133 Plus 2.0 arrays.
References
1. Swerdlow SH, Campo E, Pileri SA, Harris NL, Stein H, Siebert R, et al. The 2016 Revision of the World Health Organization Classification of Lymphoid Neoplasms. Blood (2016) 127(20):2375–90. doi: 10.1182/blood-2016-01-643569
2. Ogawa S. Genetic Basis of Myelodysplastic Syndromes. Proc Japan Acad Ser B Phys Biol Sci (2020) 96(3):107–21. doi: 10.2183/PJAB.96.009
3. Malcovati L, Ambaglio I, Elena C. The Genomic Landscape of Myeloid Neoplasms With Myelodysplasia and its Clinical Implications. Curr Opin Oncol (2015) 27(6):551–9. doi: 10.1097/CCO.0000000000000229
4. Elias HK, Schinke C, Bhattacharyya S, Will B, Verma A, Steidl U. Stem Cell Origin of Myelodysplastic Syndromes. Oncogene (2013) 33(44):5139–50. doi: 10.1038/onc.2013.520
5. Greenberg PL, Tuechler H, Schanz J, Sanz G, Garcia-Manero G, Solé F, et al. Revised International Prognostic Scoring System for Myelodysplastic Syndromes. Blood (2012) 120(12):2454–65. doi: 10.1182/blood-2012-03-420489
6. Arber DA, Orazi A, Hasserjian R, Thiele J, Borowitz MJ, Le Beau MM, et al. The 2016 Revision to the World Health Organization Classification of Myeloid Neoplasms and Acute Leukemia. Blood (2016) 127(20):2391–405. doi: 10.1182/blood-2016-03-643544
7. Arber DA. The 2016 WHO Classification of Acute Myeloid Leukemia: What the Practicing Clinician Needs to Know. Semin Hematol (2018) 56(2):90–5. doi: 10.1053/j.seminhematol.2018.08.002
8. Ali AM, Huang Y, Pinheiro RF, Xue F, Hu J, Iverson N, et al. Severely Impaired Terminal Erythroid Differentiation as an Independent Prognostic Marker in Myelodysplastic Syndromes. Blood Adv (2018) 2(12):1393–402. doi: 10.1182/bloodadvances.2018018440
9. Tefferi A, Vardiman JW. Myelodysplastic Syndromes. N Engl J Med (2009) 361:1872–5. doi: 10.1053/j.semdp.2011.08.005
10. Vardiman JW. The World Health Organization (WHO) Classification of Tumors of the Hematopoietic and Lymphoid Tissues: An Overview With Emphasis on the Myeloid Neoplasms. Chem Biol Interact (2010) 184(1-2):16–20. doi: 10.1016/j.cbi.2009.10.009
11. Malcovati L, Gallì A, Travaglino E, Ambaglio I, Rizzo E, Molteni E, et al. Clinical Significance of Somatic Mutation in Unexplained Blood Cytopenia. Blood (2017) 129(25):3371–8. doi: 10.1182/blood-2017-01-763425
12. Ghobrial IM, Detappe A, Anderson KC, Steensma DP. The Bone-Marrow Niche in MDS and MGUS: Implications for AML and MM. Nat Rev Clin Oncol (2018) 15(4):219–33. doi: 10.1038/nrclinonc.2017.197
13. Roboz GJ. Evolving Treatments in Acute Myeloid Leukemia. Clin Adv Hematol Oncol (2015) 13(2):93–5.
14. Çelik H, Lindblad KE, Popescu B, Gui G, Goswami M, Valdez J, et al. Highly Multiplexed Proteomic Assessment of Human Bone Marrow in Acute Myeloid Leukemia. Blood Adv (2020) 4(2):367–79. doi: 10.1182/bloodadvances.2019001124
15. Braoudaki M, Lambrou GI, Vougas K, Karamolegou K, Tsangaris GT, Tzortzatou-Stathopoulou F. Protein Biomarkers Distinguish Between High- and Low-Risk Pediatric Acute Lymphoblastic Leukemia in a Tissue Specific Manner. J Hematol Oncol (2013) 6(1):1. doi: 10.1186/1756-8722-6-52
16. Nicolas E, Ramus C, Berthier S, Arlotto M, Bouamrani A, Lefebvre C, et al. Expression of S100A8 in Leukemic Cells Predicts Poor Survival in De Novo AML Patients. Leukemia (2011) 25(1):57–65. doi: 10.1038/leu.2010.251
17. Aivado M, Spentzos D, Germing U, Alterovitz G, Meng X-Y, Grall F, et al. Serum Proteome Profiling Detects Myelodysplastic Syndromes and Identifies CXC Chemokine Ligands 4 and 7 as Markers for Advanced Disease. Proc Natl Acad Sci USA (2007) 104(4):1307–12. doi: 10.1073/pnas.0610330104
18. Májek P, Riedelová-Reicheltová Z, Suttnar J, Pečánková K, Čermák J, Dyr JE. Plasma Proteome Changes Associated With Refractory Anemia and Refractory Anemia With Ringed Sideroblasts in Patients With Myelodysplastic Syndrome. Proteome Sci (2013) 11(1):1–9. doi: 10.1186/1477-5956-11-14
19. Majek P, Riedelova-Reicheltova Z, Suttnar J, Pecankova K, Cermak J, Dyr JE. Proteome Changes in the Plasma of Myelodysplastic Syndrome Patients With Refractory Anemia With Excess Blasts Subtype 2. Dis Markers (2014) 2014:178709. doi: 10.1155/2014/178709
20. Fröbel J, Cadeddu RP, Hartwig S, Bruns I, Wilk CM, Kündgen A, et al. Platelet Proteome Analysis Reveals Integrin-Dependent Aggregation Defects in Patients With Myelodysplastic Syndromes. Mol Cell Proteomics (2013) 12(5):1272–80. doi: 10.1074/mcp.M112.023168
21. Pecankova K, Majek P, Cermak J, Dyr JE. Peripheral Blood Mononuclear Cell Proteome Changes in Patients With Myelodysplastic Syndrome. BioMed Res Int (2015) 2015. doi: 10.1155/2015/872983
22. Prebet T, Zeidan A. Trends in Clinical Investigation for Myelodysplastic Syndromes. Clin Lymphoma Myeloma Leuk (2016) 16(August):S57–63. doi: 10.1016/j.clml.2016.02.012
23. Kennedy JA, Ebert BL. Clinical Implications of Genetic Mutations in Myelodysplastic Syndrome. J Clin Oncol (2017) 35(9):968–74. doi: 10.1200/JCO.2016.71.0806
24. Haferlach T. The Molecular Pathology of Myelodysplastic Syndrome. Pathobiology (2019) 86(1):24–9. doi: 10.1159/000488712
25. Komrokji RS, Padron E, Ebert BL, List AF. Deletion 5q MDS: Molecular and Therapeutic Implications. Best Pract Res Clin Haematol (2013) 26(4):365–75. doi: 10.1016/j.beha.2013.10.013
26. Pinheiro RF, Chauffaille MLLF. Comparison of I-FISH and G-Banding for the Detection of Chromosomal Abnormalities During the Evolution of Myelodysplastic Syndrome. Braz J Med Biol Res (2009) 42(11):1110–2. doi: 10.1590/S0100-879X2009001100018
27. McGowan-Jordan J, Simons A, Moore S., ISCN 2020. An International System for Human Cytogenomic Nomenclature. Switzerland: S. Karger AG (2020).
28. Bradford MM. A Rapid and Sensitive Method for the Quantitation of Microgram Quantities of Protein Utilizing the Principle of Protein-Dye Binding. Anal Biochem (1976) 572:248–54. doi: 10.1016/j.cj.2017.04.003
29. Rego JPA, Martins JM, Wolf CA, Tilburg M van, Moreno F, Monteiro-Moreira AC, et al. Proteomic Analysis of Seminal Plasma and Sperm Cells and Their Associations With Semen Freezability in Guzerat Bulls. J Anim Sci (2016) 94(12):5308–20. doi: 10.2527/jas2016-0811
30. Arshid S, Tahir M, Fontes B, Montero EFS, Castro MS, Sidoli S, et al. High Performance Mass Spectrometry Based Proteomics Reveals Enzyme and Signaling Pathway Regulation in Neutrophils During the Early Stage of Surgical Trauma. Proteomics - Clin Appl (2017) 11(1-2):1–34. doi: 10.1002/prca.201600001
31. Viana AGA, Martins AMA, Pontes AH, Fontes W, Castro MS, Ricart CAO, et al. Proteomic Landscape of Seminal Plasma Associated With Dairy Bull Fertility. Sci Rep (2018) 8(1):1–13. doi: 10.1038/s41598-018-34152-w
32. Gomes HAR, da Silva AJ, Gómez-Mendoza DP, Santos Júnior ACM, Cologna NM, Almeida RM, et al. Identification of Multienzymatic Complexes in the Clonostachys Byssicola Secretomes Produced in Response to Different Lignocellulosic Carbon Sources. J Biotechnol (2017) 254(May):51–8. doi: 10.1016/j.jbiotec.2017.06.001
33. Xia J, Psychogios N, Young N, Wishart DS. MetaboAnalyst: A Web Server for Metabolomic Data Analysis and Interpretation. Nucleic Acids Res (2009) 37(SUPPL. 2):652–60. doi: 10.1093/nar/gkp356
34. Chong J, Soufan O, Li C, Caraus I, Li S, Bourque G, et al. MetaboAnalyst 4.0: Towards More Transparent and Integrative Metabolomics Analysis. Nucleic Acids Res (2018) 46(W1):W486–94. doi: 10.1093/nar/gky310
35. Huang DW, Sherman BT, Lempicki RA. Systematic and Integrative Analysis of Large Gene Lists Using DAVID Bioinformatics Resources. Nat Protoc (2009) 4(1):44–57. doi: 10.1038/nprot.2008.211
36. Huang DW, Sherman BT, Lempicki RA. Bioinformatics Enrichment Tools: Paths Toward the Comprehensive Functional Analysis of Large Gene Lists. Nucleic Acids Res (2009) 37(1):1–13. doi: 10.1093/nar/gkn923
37. Gomes FP, Park R, Viana AG, Fernandez-Costa C, Topper E, Kaya A, et al. Protein Signatures of Seminal Plasma From Bulls With Contrasting Frozen-Thawed Sperm Viability. Sci Rep (2020) 10(1):1–14. doi: 10.1038/s41598-020-71015-9
38. Borges DP, dos Santos AWA, Paier CRK, Ribeiro Júnior HL, Costa MB, Farias IR, et al. Prognostic Importance of Aurora Kinases and Mitotic Spindle Genes Transcript Levels in Myelodysplastic Syndrome. Leuk Res (2018) 64(October 2017):61–70. doi: 10.1016/j.leukres.2017.11.013
39. Livak KJ, Schmittgen TD. Analysis of Relative Gene Expression Data Using Real-Time Quantitative PCR and the 2-ΔΔCT Method. Methods (2001) 25(4):402–8. doi: 10.1006/meth.2001.1262
40. Szklarczyk D, Gable AL, Nastou KC, Lyon D, Kirsch R, Pyysalo S, et al. The STRING Database in 2021: Customizable Protein-Protein Networks, and Functional Characterization of User-Uploaded Gene/Measurement Sets. Nucleic Acids Res (2021) 49(D1):D605–12. doi: 10.1093/nar/gkaa1074
41. Warde-Farley D, Donaldson SL, Comes O, Zuberi K, Badrawi R, Chao P, et al. The GeneMANIA Prediction Server: Biological Network Integration for Gene Prioritization and Predicting Gene Function. Nucleic Acids Res (2010) 38(SUPPL. 2):214–20. doi: 10.1093/nar/gkq537
42. Chen W, Gao C, Liu Y, Wen Y, Hong X, Huang Z. Bioinformatics Analysis of Prognostic miRNA Signature and Potential Critical Genes in Colon Cancer. Front Genet (2020) 11:478(June). doi: 10.3389/fgene.2020.00478
43. Gerstung M, Pellagatti A, Malcovati L, Giagounidis A, Porta MGD, Jädersten M. Combining Gene Mutation With Gene Expression Data Improves Outcome Prediction in Myelodysplastic Syndromes. Nat Commun (2015) 6:5901. doi: 10.1038/ncomms6901
44. Barreyro L, Chlon TM, Starczynowski DT. Chronic Immune Response Dysregulation in MDS Pathogenesis. Blood (2018) 132(15):1553–60. doi: 10.1182/blood-2018-03-784116
45. Pellagatti A, Cazzola M, Giagounidis A, Perry J, Malcovati L, Porta MGD, et al. Deregulated Gene Expression Pathways in Myelodysplastic Syndrome Hematopoietic Stem Cells. Leukemia (2010) 24(4):756–64. doi: 10.1038/leu.2010.31
46. de Oliveira RTG, Cordeiro JVA, Vitoriano BF, Melo MML, Sampaio LR, Borges DP, et al. ERVs-TLR3-IRF Axis is Linked to Myelodysplastic Syndrome Pathogenesis. Med Oncol (2021) 38(3):1–12. doi: 10.1007/s12032-021-01466-1
47. Jeffery J, Sinha D, Srihari S, Kalimutho M, Khanna KK. Beyond Cytokinesis: The Emerging Roles of CEP55 in Tumorigenesis. Oncogene (2016) 35(6):683–6390. doi: 10.1038/onc.2015.128
48. Kirkin V, Dikic I. Ubiquitin Networks in Cancer. Curr Opin Genet Dev (2011) 21(1):21–8. doi: 10.1016/j.gde.2010.10.004
49. Dikic I, Wakatsuki S, Walters KJ. Ubiquitin-Binding Domains From Structures to Functions. Nat Rev Mol Cell Biol (2009) 10(10):659–71. doi: 10.1038/nrm2767
50. Goult BT, Yan J, Schwartz MA. Talin as a Mechanosensitive Signaling Hub. J Cell Biol (2018) 217(11):3776–84. doi: 10.1083/jcb.201808061
51. Azizi L, Cowell AR, Mykuliak VV, Goult BT, Turkki P, Hytönen VP. Cancer Associated Talin Point Mutations Disorganise Cell Adhesion and Migration. Sci Rep (2021) 11(1):1–16. doi: 10.1038/s41598-020-77911-4
52. Calderwood DA. Talins and Kindlins; Partners in Integrin-Mediated Adhesion. Nat Rev Mol Cell Biol (2013) 14(8):503–17. doi: 10.1038/nrm3624.Talins
53. Das M, Subbayya Ithychanda S, Qin J, Plow EF. Mechanisms of Talin-Dependent Integrin Signaling and Crosstalk. Biochim Biophys Acta - Biomembr (2014) 1838(2):579–88. doi: 10.1016/j.bbamem.2013.07.017
54. Haining AWM, Lieberthal TJ, Del Río Hernández A. Talin: A Mechanosensitive Molecule in Health and Disease. FASEB J (2016) 30(6):2073–85. doi: 10.1096/fj.201500080R
55. Miihkinen M, Grönloh MLB, Popović A, Vihinen H, Jokitalo E, Goult BT, et al. Myosin-X and Talin Modulate Integrin Activity at Filopodia Tips. Cell Rep (2021) 36(11):109716. doi: 10.1016/j.celrep.2021.109716
56. Sakamoto S, McCann RO, Dhir R, Kyprianou N. Talin1 Promotes Tumor Invasion and Metastasis via Focal Adhesion Signaling and Anoikis Resistance. Cancer Res (2010) 70(5):1885–95. doi: 10.1158/0008-5472.CAN-09-2833.Talin1
57. Desiniotis A, Kyprianou N. Significance of Talin in Cancer Progression and Metastasis Andreas. Int Rev Cell Mol Biol (2011) 289:117–47. doi: 10.1016/B978-0-12-386039-2.00004-3.Significance
58. Lee YG, Kim I, Yoon SS, Park S, Cheong JW, Min YH, et al. Comparative Analysis Between Azacitidine and Decitabine for the Treatment of Myelodysplastic Syndromes. Br J Haematol (2013) 161(3):339–47. doi: 10.1111/bjh.12256
59. Hailing JR, Monkley SJ, Critchley DR, Petrich BG. Talin-Dependent Integrin Activation is Required for Fibrin Clot Retraction by Platelets. Blood (2011) 117(5):1719–22. doi: 10.1182/blood-2010-09-305433
60. Lefort CT, Rossaint J, Moser M, Petrich BG, Zarbock A, Monkley SJ, et al. Distinct Roles for Talin-1 and Kindlin-3 in LFA-1 Extension and Affinity Regulation. Blood (2012) 119(18):4275–82. doi: 10.1182/blood-2011-08-373118
61. Ye F, Petrich BG. Kindlin: Helper, Co-Activator, or Booster of Talin in Integrin Activation? Curr Opin Hematol (2011) 18(5):356–60. doi: 10.1097/MOH.0b013e3283497f09
62. Monkley SJ, Kostourou V, Spence L, Petrich B, Coleman S, Ginsberg MH, et al. Endothelial Cell Talin1 is Essential for Embryonic Angiogenesis. Dev Biol (2011) 349(2):494–502. doi: 10.1016/j.ydbio.2010.11.010
63. Gygi SP, Rochon Y, Franza BR, Aebersold R. Correlation Between Protein and mRNA Abundance in Yeast. Mol Cell Biol (1999) 19(3):1720–30. doi: 10.1128/mcb.19.3.1720
64. Liu L, Mei Q, Zhao J, Dai Y, Fu Q. Suppression of CEP55 Reduces Cell Viability and Induces Apoptosis in Human Lung Cancer. Oncol Rep (2016) 36(4):1939–45. doi: 10.3892/or.2016.5059
65. Fortelny N, Overall CM, Pavlidis P, Freue GVC. Can We Predict Protein From mRNA Levels? Nature (2017) 547(7664):E19–20. doi: 10.1038/nature22293
66. Waldbauer JR, Rodrigue S, Coleman ML, Chisholm SW. Transcriptome and Proteome Dynamics of a Light-Dark Synchronized Bacterial Cell Cycle. PloS One (2012) 7(8). doi: 10.1371/journal.pone.0043432
67. Chang LC, Huang CH, Cheng CH, Chen BH, Chen HC. Differential Effect of the Focal Adhesion Kinase Y397F Mutant on V-Src-Stimulated Cell Invasion and Tumor Growth. J BioMed Sci (2005) 12(4):571–85. doi: 10.1007/s11373-005-7212-5
68. Sundaravel S, Duggan R, Bhagat T, Ebenezer DL, Liu H, Yu Y, et al. Reduced DOCK4 Expression Leads to Erythroid Dysplasia in Myelodysplastic Syndromes. Proc Natl Acad Sci U S A (2015) 112(46):E6359–68. doi: 10.1073/pnas.1516394112
69. Veryaskina YA, Titov SE, Kovynev IB, Fedorova SS, Pospelova TI, Zhimulev IF. MicroRNAs in the Myelodysplastic Syndrome. Acta Naturae (2021) 13(2):4–15. doi: 10.32607/actanaturae.11209
70. Pons A, Nomdedeu B, Navarro A, Gaya A, Gel B, Diaz T, et al. Hematopoiesis-Related microRNA Expression in Myelodysplastic Syndromes. Leuk Lymphoma (2009) 50(11):1854–9. doi: 10.3109/10428190903147645
71. Dostalova Merkerova M, Hrustincova A, Krejcik Z, Votavova H, Ratajova E, Cermak J, et al. Microarray Profiling Defines Circulating microRNAs Associated With Myelodysplastic Syndromes. Neoplasma (2017) 64(4):571–8. doi: 10.4149/neo
72. Hrustincova A, Krejcik Z, Kundrat D, Szikszai K, Belickova M, Pecherkova P, et al. Circulating Small Noncoding RNAs Have Specific Expression Patterns in Plasma and Extracellular Vesicles in Myelodysplastic Syndromes and Are Predictive of Patient Outcome. Cells (2020) 9(4):794. doi: 10.3390/cells9040794
73. Chakraborty S, Banerjee S, Raina M, Haldar S. Force-Directed “Mechanointeractome” of Talin-Integrin. Biochemistry (2019) 58(47):4677–95. doi: 10.1021/acs.biochem.9b00442
74. Malla RR, Vempati RK. Talin: A Potential Drug Target for Cancer Therapy. Curr Drug Metab (2020) 21(1):25–32. doi: 10.2174/1389200221666200214114018
75. Halidi KNS, Fontan E, Boucharlat A, Davignon L, Charpentier M, Boullé M, et al. Two NEMO-Like Ubiquitin-Binding Domains in CEP55 Differently Regulate Cytokinesis. iScience (2019) 20:292–309. doi: 10.1016/j.isci.2019.08.042
76. Fabbro M, Zhou BB, Takahashi M, Sarcevic B, Lal P, Graham ME, et al. Cdk1/Erk2- and Plk1-Dependent Phosphorylation of a Centrosome Protein, Cep55, is Required for its Recruitment to Midbody and Cytokinesis. Dev Cell (2005) 9(4):477–88. doi: 10.1016/j.devcel.2005.09.003
77. Kim HJ, Yoon J, Matsuura A, Na J-H, Lee W-K, Kim H, et al. Structural and Biochemical Insights Into the Role of Testis-Expressed Gene 14 (TEX14) in Forming the Stable Intercellular Bridges of Germ Cells. Proc Natl Acad Sci USA (2015) 112(40):12372–7. doi: 10.1073/pnas.1418606112
78. Lee, Hyung H, Elia N, Ghirlando R, Lippincott-Schwartz J, Hurley JH. Midbody Targeting of the ESCRT Machinery by a Noncanonical Coiled Coil in CEP55. Science (80-). (2008) 322(5901):576–80. doi: 10.1126/science.1162042
79. Kalimutho M, Sinha D, Jeffery J, Nones K, Srihari S, Fernando WC, et al. CEP55 Is a Determinant of Cell Fate During Perturbed Mitosis in Breast Cancer. EMBO Mol Med (2018) 10:1–22. doi: 10.15252/emmm.201708566
80. Zhao Wm, Seki A, Fang G. Cep55, a Microtubule-Bundling Protein, Associates With Centralspindlin to Control the Midbody Integrity and Cell Abscission During Cytokinesis. Mol Biol Cell (2006) 17(September):3881–96. doi: 10.1091/mbc.E06
81. Liang H-W, Luo B, Du L-H, He R-Q, Chen G, Peng Z-G, et al. Expression Significance and Potential Mechanism of Hypoxia-Inducible Factor 1 Alpha in Patients With Myelodysplastic Syndromes. Cancer Med (2019) 8(13):6021–35. doi: 10.1002/cam4.2447
82. Jang SJ, Choi I-S, Park G, Moon D-S, Choi J-S, Nam M-H, et al. MicroRNA-205-5p is Upregulated in Myelodysplastic Syndromes and Induces Cell Proliferation via PTEN Suppression. Leuk Res (2016) 47:172–7. doi: 10.1016/j.leukres.2016.06.003
83. Carter SL, Eklund AC, Kohane IS, Harris LN, Szallasi Z. A Signature of Chromosomal Instability Inferred From Gene Expression Profiles Predicts Clinical Outcome in Multiple Human Cancers. Nat Genet (2006) 38(9):1043–8. doi: 10.1038/ng1861
84. Li F, Jin D, Tang C, Gao D. CEP55 Promotes Cell Proliferation and Inhibits Apoptosis via the Pi3k/Akt/P21 Signaling Pathway in Human Glioma U251 Cells. Oncol Lett (2018) 15(4):4789–96. doi: 10.3892/ol.2018.7934
Keywords: myelodysplastic syndrome, centrosomal protein of 55 kDa (CEP55), Talin-1 (TLN1), bone marrow, karyotype, proteomics
Citation: Moura AA, Bezerra MJB, Martins AMA, Borges DP, Oliveira RTG, Oliveira RM, Farias KM, Viana AG, Carvalho GGC, Paier CRK, Sousa MV, Fontes W, Ricart CAO, Moraes MEA, Magalhães SMM, Furtado CLM, Moraes-Filho MO, Pessoa C and Pinheiro RF (2022) Global Proteomics Analysis of Bone Marrow: Establishing Talin-1 and Centrosomal Protein of 55 kDa as Potential Molecular Signatures for Myelodysplastic Syndromes. Front. Oncol. 12:833068. doi: 10.3389/fonc.2022.833068
Received: 10 December 2021; Accepted: 18 May 2022;
Published: 22 June 2022.
Edited by:
Dawen Zhao, Wake Forest Baptist Medical Center, United StatesReviewed by:
Diego A. Pereira-Martins, University of Groningen, NetherlandsDepei Wu, The First Affiliated Hospital of Soochow University, China
Copyright © 2022 Moura, Bezerra, Martins, Borges, Oliveira, Oliveira, Farias, Viana, Carvalho, Paier, Sousa, Fontes, Ricart, Moraes, Magalhães, Furtado, Moraes-Filho, Pessoa and Pinheiro. This is an open-access article distributed under the terms of the Creative Commons Attribution License (CC BY). The use, distribution or reproduction in other forums is permitted, provided the original author(s) and the copyright owner(s) are credited and that the original publication in this journal is cited, in accordance with accepted academic practice. No use, distribution or reproduction is permitted which does not comply with these terms.
*Correspondence: Arlindo A. Moura, arlindo.moura@gmail.com; Claudia Pessoa, cpessoa@ufc.br; Ronald F. Pinheiro, pinheirorfeitosa@gmail.com