Evolution of complex giant seafloor depressions at the northern Argentine continental margin (SW Atlantic Ocean) under the influence of a dynamic bottom current regime
 Fynn Warnke1*†
  Tilmann Schwenk1,2
  Elda Miramontes1,2
  Volkhard Spiess1,2 Stefan Wenau1,3
  Graziella Bozzano4,5 Michele Baqués4,6
  Sabine Kasten1,2,7
- 1Faculty of Geosciences, University of Bremen, Bremen, Germany
- 2MARUM—Center for Marine Environmental Sciences, University of Bremen, Bremen, Germany
- 3Fraunhofer Institute for Wind Energy Systems IWES, Bremen, Germany
- 4Department of Oceanography, Argentine Hydrographic Service (SHN), Buenos Aires, Argentina
- 5CONICET, Buenos Aires, Argentina
- 6Acoustic Propagation Department, Argentinian Navy Research Office and UNIDEF (National Council of Scientific and Technical Research—Ministry of Defense), Buenos Aires, Argentina
- 7Alfred Wegener Institute Helmholtz Centre for Polar and Marine Research, Bremerhaven, Germany
Seafloor depressions (SD) are features commonly observed on the ocean floor. They often occur as circular, small-sized (up to 10 s of m) incisions caused by fluid expulsion. Larger depressions (100s m to km) are considerably less abundant, and their origin and development have been scarcely studied. This study investigated two giant morphological depressions (>5 km) using recently acquired multibeam bathymetry and backscatter, sediment echosounder, and high-resolution seismic data. An arc-shaped (SD-N) and a sub-circular depression (SD-S) are located on the Ewing Terrace at the Argentine Continental Margin north and south of the Mar del Plata Canyon, respectively. The study area is influenced by the Brazil-Malvinas Confluence, where major counterflowing ocean currents affect sedimentation, and northward flowing currents form a large contourite depositional system. Using an existing seismo-stratigraphy, the onset of SD-N was dated to the middle Miocene (∼15–17 Ma), whereas SD-S started developing at the Miocene/Pliocene boundary (∼6 Ma). Acoustic anomalies indicate the presence of gas and diffuse upward fluid migration, and therefore seafloor seepage is proposed as the initial mechanism for SD-S, whereas we consider a structural control for SD-N to be most likely. Initial depressions were reworked and maintained by strong and variable bottom currents, resulting in prograding clinoform reflection patterns (SD-N) or leading to the build-up of extensive cut-and-fill structures (SD-S). Altogether, this study highlights the evolution of two unique and complex seafloor depressions throughout the geologic past under intense and variable bottom current activity in a highly dynamic oceanographic setting.
1 Introduction
Seafloor depressions are common geomorphological features in marine and lacustrine environments around the globe. Among them, large-scale depressions are characterized by hundreds of meters in diameter and several tens of meters in depth as described, e.g., for the Lower Congo Basin (e.g., Pilcher and Argent, 2007; Sahling et al., 2008; Nöthen and Kasten, 2011; Kasten et al., 2012; Wenau et al., 2017), Chatham Rise off New Zealand (Davy et al., 2010; Collins et al., 2011; Klaucke et al., 2018), the South China Sea (Zhang et al., 2020), and the Korean Peninsula shelf (Cukur et al., 2019). The origin and preservation mechanisms of seafloor depressions, in general, are ascribed to several different processes; however, especially for complex, large-scale depressions, these are often elusive (King and MacLean, 1970; Hovland and Judd, 1988; Judd and Hovland, 2007; León et al., 2010; Cukur et al., 2019). One common mechanism is fluid or gas seepage at the seafloor, which migrates upwards from underlying reservoirs of biogenic or thermogenic gas, water or hydrothermal fluids, but furthermore dependent on lithology or oceanographic setting, among other factors (Judd and Hovland, 2007; Davy et al., 2010; Ingrassia et al., 2015; Riboulot et al., 2016; Wenau et al., 2017). Such depressions related to seafloor seepage often exhibit crater-like shapes, named pockmarks (Judd and Hovland, 2007), that vary greatly in shape, size (Chen et al., 2015), and distribution pattern (Hillman et al., 2015; Schattner et al., 2016). A different type of pockmark is generated by the formation and destabilization of gas-hydrates, which results in a more irregular and complex seafloor depression (Sultan et al., 2010; Riboulot et al., 2016; Riboulot, 2018). Besides this widely discussed mechanism of fluid/gas seepage, more recent studies documented different modes of generation, including groundwater discharge (Hillman et al., 2015), paleo-fluid expulsion focused by localized diagenetic faults (Waghorn et al., 2018), scouring of venting points by bottom currents (Hillman et al., 2018; Klaucke et al., 2018), or local erosion by turbulence caused by bottom currents over an irregular seafloor (Wenau et al., 2021).
Especially in hydrodynamically energetic oceanographic settings, seafloor depressions are maintained and reshaped by bottom currents (García et al., 2016a; Hillman et al., 2018; Klaucke et al., 2018; Miramontes et al., 2019a; Cukur et al., 2019; Isola et al., 2020; Isola et al., 2021). Recent studies on the Falkland/Malvinas Terrace (Nicholson and Stow, 2019) and Piedra Buena Terrace (Isola et al., 2021) have documented circular to elliptical seafloor depressions with distinct sediment deposition on the downstream slope. This interaction of depression with bottom currents has previously been shown using numerical modeling (Hammer et al., 2009) and tank experiments (Pau et al., 2014). When initiated as pockmarks, depressions may be kept open by continuous seepage, potentially in combination with current erosion (e.g., Baraza and Ercilla, 1996; Jané et al., 2010).
Furthermore, seafloor depressions can be linked to mass-wasting, tectonic processes, or a combination of both, as it has been proposed for the Gulf of Cadiz (García et al., 2016a) and the Patagonian continental margin (Isola et al., 2020). In areas of tectonic uplift, e.g., due to salt diapirs, gravitational mass-wasting might erode and rework sediments. The resulting slide scars form distinct seafloor escarpments, potentially infilled by drift deposits (García et al., 2016a).
In this study, the geomorphology, generation, and evolution of two large-scale seafloor depressions (SD-N and SD-S) on the continental slope of the northern Argentine margin are investigated based on newly acquired seismic and acoustic profiles. Specific objectives are to 1) highlight significant morphological similarities and differences for both depressions, 2) identify the possible mechanisms of their generation, 3) assess which processes actively shape the depression geomorphology, and 4) determine their approximate age.
2 Regional setting
2.1 Geological context and slope morphology
The northern Argentine Continental Margin belongs to the rifted volcanic passive continental margin of South America ranging from 35° to 49°S and is filled by thick, relatively undisturbed post-Cretaceous sedimentary sequences (Hinz et al., 1999; Franke et al., 2007). The margin hosts a huge Contourite Depositional System composed of sedimentary drift deposits, contouritic terraces, abraded surfaces, moats, and channels (e.g., Hernández-Molina et al., 2009; Hernández-Molina et al., 2010; Preu et al., 2013; Steinmann et al., 2020; Wilckens et al., 2021a) and is intersected by five major submarine canyon systems (Ewing and Lonardi, 1971; Hernández-Molina et al., 2009; Preu et al., 2013; Bozzano et al., 2017). The interplay of along and across-slope sedimentary processes contributes to the shaping of the slope morphology (e.g., Krastel et al., 2011; Preu et al., 2013; Voigt et al., 2013; Violante et al., 2017; Warratz et al., 2019) since the onset of Antarctic-sourced bottom waters at the Eocene-Oligocene transition (Hinz et al., 1999). The continental slope, which can be differentiated into upper, middle, and lower sectors, shows a step-like morphology due to the presence of three major contouritic terraces whose genesis has been linked to water mass interfaces and related processes (Hernández-Molina et al., 2009; Preu et al., 2013). These terraces are the La Plata Terrace (500–600 m water depth), the Ewing Terrace (1,200–1,500 m, Figure 1), and the Necochea Terrace (∼3,500 m). The Mar del Plata (MdP) Canyon divides the Ewing Terrace in the study area into a northern and southern part (Figure 1), each depicting significant differences in shape and extent (Krastel et al., 2011; Preu et al., 2013; Warratz et al., 2019). South of the MdP Canyon, about half of the Ewing Terrace is covered by an elongated plastered drift deposit, whereas north of the canyon, the plastered drift is absent, and the terrace is almost twice as wide (Preu et al., 2013). The landward part of the terrace terminates at an abraded surface on the slope and contour-parallel moats (“Ewing Terrace Moats-1/2”; Steinmann et al., 2020; Bozzano et al., 2021; Wilckens et al., 2021a) cutting into the seafloor on the Ewing Terrace (Figure 1). The central part of the terrace exhibits a more horizontal shape with accordingly layered seismic reflections in the subsurface (Preu et al., 2013). The seaward limit of the terrace corresponds to the transition to the plastered drift, which has a prominent crest south of the MdP Canyon that is absent to the north.
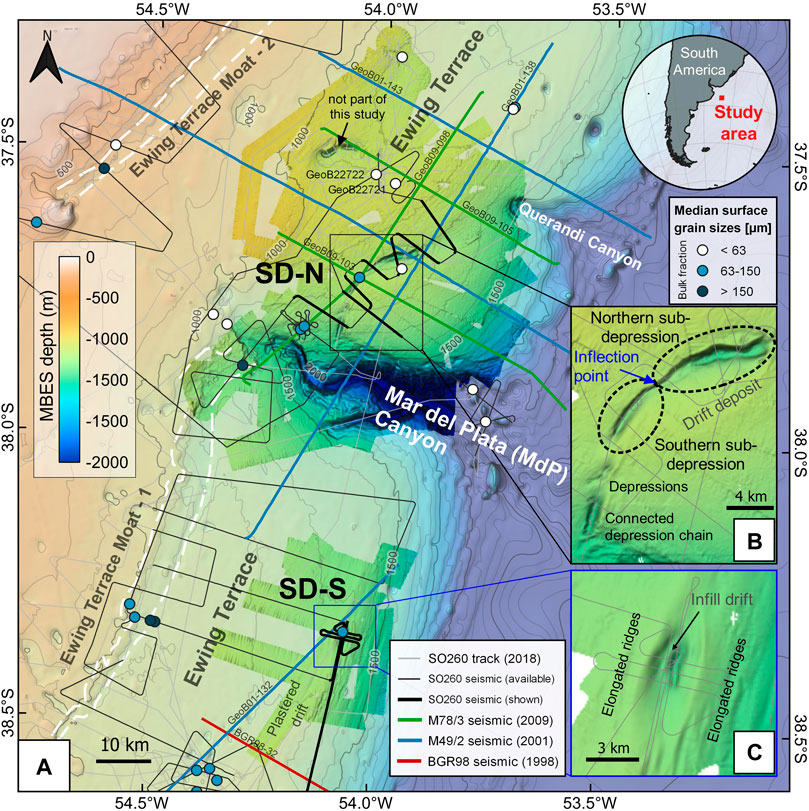
FIGURE 1. Study area located at the northern Argentine continental margin. (A) Overview map. (B) SD-N and (C) SD-S indicate the analyzed seafloor depressions on the northern and southern Ewing Terrace, respectively. Outline of Ewing Terrace Moats adapted from Steinmann et al. (2020) and Wilckens et al. (2021a). Grain sizes of surface sediment samples from Wilckens et al. (2021b), available at DOI:10.1594/PANGAEA.931224. Relevant seismic profiles with color-coding representing different cruises (cf. Section 3.1). Processed multibeam bathymetry acquired during cruise SO260 overlays regional bathymetry from the GEBCO 2021 Grid (GEBCO Compilation Group, 2021).
2.2 Oceanographic setting
The main oceanographic feature at the northern Argentine margin is the Brazil-Malvinas Confluence (BMC) zone, where associated water masses controlling sedimentation in the study area are strongly influenced by oceanographic currents and processes (e.g., Hernández-Molina et al., 2010; Preu et al., 2012; Valla et al., 2018; Steinmann et al., 2020; Wilckens et al., 2021a). The BMC is the result of the Brazil and Malvinas surface currents flowing in opposite directions, with the center of high turbulence and the main zone of eastward deflection located in the study area between 38° and 39°S (Figure 2), whose location varies significantly seasonally (Artana et al., 2019; Piola and Matano, 2019) and on geological timescales (Preu et al., 2013; Hernández-Molina et al., 2016). Furthermore, the dynamic position of the BMC likely changed over glacial/interglacial cycles (Preu et al., 2012 and references therein). The Brazil Current flows southwards mainly within the upper 500 m of the water column, while the Malvinas Current of sub-polar origin flows northwards and is composed of several high-velocity cores constrained by seafloor topography (Piola and Matano, 2019). The Antarctic Intermediate Water (AAIW) is distributed between 700 and 1,200 m (Piola et al., 2001) with its interface to the Circumpolar Deep Water (CDW) located at ∼1,000 m water depth in the study area (Figure 2) (Hernández-Molina et al., 2010; Preu et al., 2013; Steinmann et al., 2020). The CDW is split into upper UCDW and lower LCDW by the presence of the southward-flowing North Atlantic Deep Water (NADW, 1,000–3,000 m) (Reid et al., 1977; Piola and Matano, 2019). The NADW is detached from the seafloor south of the study area, likely marking the southernmost position of the migrating BMC (Preu et al., 2013). The present-day circulation and stratification pattern was presumably established after a major vertical shift of the water mass boundaries during the middle Miocene following the onset of the proto-NADW (Preu et al., 2012). It indicates the occurrence of strong and, on a geological timescale, prevailing, but still variable, bottom currents. After the middle Miocene, the study area was probably located within an area of increased turbulence at the proto-AAIW/proto-UCDW interface (Preu et al., 2012) and downward shifts of the water mass interfaces during glacials (Steinmann et al., 2020). Today, the Ewing Terrace in the study area is impacted by three northward-flowing branches of the Malvinas Current (MC, Figure 2; Wilckens et al., 2021a).
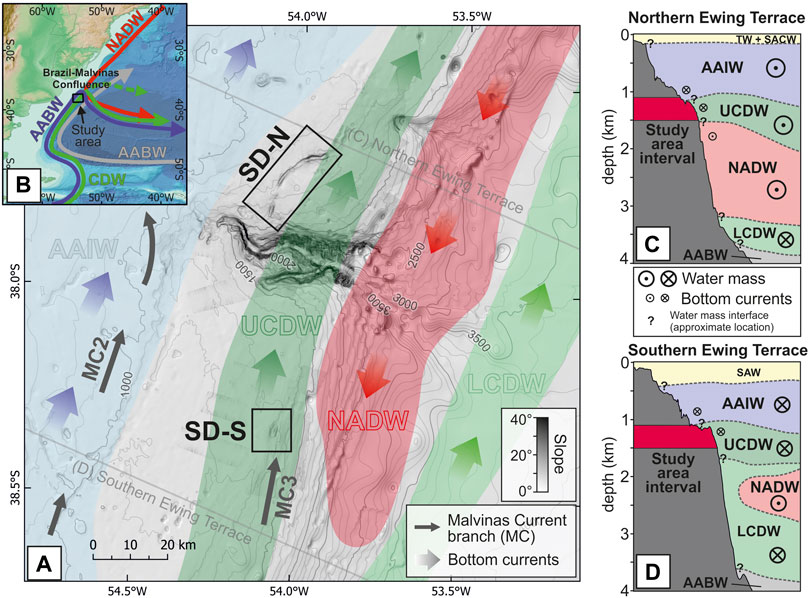
FIGURE 2. Oceanographic setting of the study area. (A) Spatial extent of modern-day near-bottom water masses (adapted from Preu et al., 2013; Steinmann et al., 2020) showing areas without a distinct water mass correlation (grey) for SD-N and upslope of SD-S. Dominant flow directions of modern-day bottom currents (colored arrows) and the locations of two branches of the Malvinas Currents (MC, dark grey arrows) are adapted from Wilckens et al. (2021a). (B) Schematic overview of intermediate and deep-water circulation along the southwest Atlantic margin (adapted from Warratz et al., 2019; Wilckens et al., 2021a). Generalized schematic oceanographic sections along the northern Argentine continental margin, (C) north and (D) south of the Mar del Plata Canyon, display the vertical stratification of the water column and flow directions along the margin (based on Piola et al., 2001; Hernández-Molina et al., 2009; Preu et al., 2012; Wilckens et al., 2021a). Depth range of the study area on the Ewing Terrace is highlighted in red. For simplicity, only the approximate positions of water mass interfaces are indicated (question marks). TW, Tropical Water; SACW, South Atlantic Central Water; AAIW, Antarctic Intermediate Water; UCDW, Upper Circumpolar Deep Water; NADW, North Atlantic Deep Water; LCDW, Lower Circumpolar Deep Water; AABW, Antarctic Bottom Water.
In the study area, the BMC is associated with mesoscale eddies (Gordon, 1989; Berden et al., 2020), meanders, and is considered one of the most energetic regions of the world (Chelton et al., 1990). Internal waves have been reported to occur during spring and summer, propagating along the Patagonian shelf break and continental slope upstream of the Malvinas Current, but few have been observed in the vicinity of our study area (Magalhães and da Silva, 2017). If critically reflected at the continental slope, they can inhibit fine-grained sediment deposition or even contribute to active erosion (e.g., Cacchione, 2002; Puig et al., 2004; Miramontes et al., 2020).
2.3 Regional seismo-stratigraphy and seismic units
The seismic interpretations presented in this study are based on the previously established seismo-stratigraphy for the Argentine Continental Margin (Ewing and Lonardi, 1971; Hinz et al., 1999; Schümann and Littke, 2002; Franke et al., 2007; Hernández-Molina et al., 2009; Hernández-Molina et al. 2010; Violante et al., 2010; Gruetzner et al., 2011; Gruetzner et al., 2012; Preu et al., 2012; Gruetzner et al., 2016; Ercilla et al., 2019) that was ground-truthed using an industrial borehole (Violante et al., 2010). Regional stratigraphic discontinuities of interest for this study are AR5 (middle Miocene, ∼16 Ma, Figure 3), H2 (middle to late Miocene; ∼11 Ma), H1 (end of late Pliocene; ∼3 Ma) for the Ewing Terrace north of the MdP Canyon (Preu et al., 2012) and in addition AR7 (Miocene/Pliocene boundary; ∼6 Ma) south of the MdP Canyon (Gruetzner et al., 2016). AR5 has been originally associated with the major cooling of the Antarctic Peninsula (∼15 Ma; Hinz et al., 1999). There is, however, a controversy about the exact age of this horizon, as already discussed in Ercilla et al. (2019) and visualized in Figure 3. In addition, four major regional Seismic Units (SU1-4), bounded by the unconformities, ranging from oldest (SU1) to youngest age (SU4), and including several internal subunits (a-e), have been described in the subsurface north of the MdP Canyon (Preu et al., 2012). In the study area, SU1 is located deeply beneath the investigated giant seafloor depressions and, thus, is not imaged in this study. SU2b is the lowermost seismic unit identified around SD-N (Figures 7, 8), showing a generally sub-parallel stacking pattern with multiple syn-sedimentary normal faults previously described by Preu et al. (2012). SU3 comprises a plastered drift with the depocenter at the downslope margin of the Ewing Terrace (Preu et al., 2012). H2 is proposed to indicate a sea-level decrease at the end of the middle Miocene when strong currents had developed after the end of the Mid-Miocene Climate Optimum and the onset of the Antarctic ice-sheet expansion (Gruetzner et al., 2011; Preu et al., 2012; Ercilla et al., 2019). The overlying SU4 is associated with a landward depocenter shift showing an aggradational pattern and continuous, high-amplitude reflection patterns (Preu et al., 2012). According to Gruetzner et al. (2012), AR7 represents a strengthening of bottom currents in the late Miocene/early Pliocene, while H1 indicates another unconformity in the study area of late Pliocene age (Preu et al., 2013).
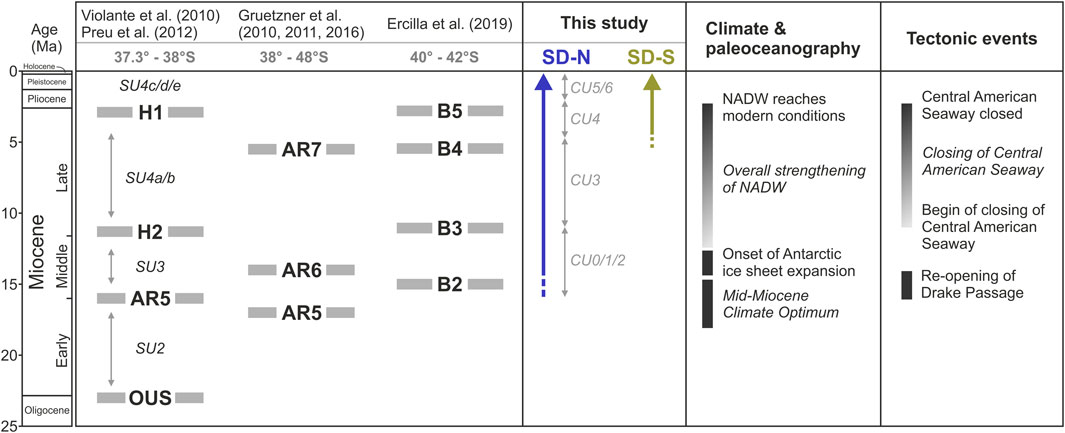
FIGURE 3. Overview of the relevant seismo-stratigraphy in the study area. Seismic horizons for three different stratigraphic schemes, approximate ages of SD-N (blue) and SD-S (green), main climate, palaeoceanographic and tectonic events used in the previous studies to reconstruct the evolution of the northern Argentine Continental Margin (from Violante et al., 2010; Gruetzner et al., 2011; Gruetzner et al., 2012; Preu et al., 2012; Gruetzner et al., 2016; Ercilla et al., 2019 and references therein).
3 Material and methods
The data used in this study were acquired mainly during the research cruise SO260 with RV SONNE in 2018 (Kasten et al., 2019), using the high-resolution multichannel seismic system of the University of Bremen, Germany. In addition, a parametric sediment echosounder and a multibeam echosounder were utilized. Previously acquired seismic and hydroacoustic data from research cruises M49/2 (2001) and M78/3 (2009) with RV METEOR (Spiess, 2001; Krastel et al., 2011) were used to support subsequent analyses and interpretations further.
3.1 Multichannel reflection seismic
The data shown in this manuscript were acquired with a SERCEL Mini GI-Gun and GI-Gun with 0.2 and 0.4 L volumes for the generator and injector, respectively. For receiving the signal, a 96-channel analog TELEDYNE streamer (224 m active length) was deployed featuring varying channel spacing of 1–4 m distance. Four ION DigiBirds for depth control kept the streamer in 1 m water depth. The custom-designed MaMuCS (Marine Multi Channel Seismic Acquisition System) developed at the University of Bremen was used to record and digitize the data signals. The sampling interval was set to 0.25 ms, and the recording length varied between 3 and 6 s.
All seismic data were band-pass filtered (10/20/800/1,200 Hz), stacked, and finally migrated during post-processing using VISTA 2014 Desktop Seismic Data Processing Software (Schlumberger). Moreover, the workflow included an interactive velocity analysis, normal moveout correction, static correction, noise removal, and the despiking of traces. Based on the dominant frequencies of both seismic sources, i.e., 175 and 250 Hz, the vertical resolution is between 1.5 and 3 m. The overall signal penetration is typically about 1 s TWT (∼750 m). The seismic data were visualized and interpreted using the commercial software package The Kingdom Software 2016.1 (IHS). A high-amplitude signal resembling the seafloor reflection with an offset of ∼30 ms that matches the time difference between triggering both chambers of the GI-Gun was identified as artificial noise. The identification of marker horizons and intercalated seismic units was conducted using previously acquired seismic profiles and horizons from Preu et al. (2012) and interpreted seismic images from Gruetzner et al. (2016).
3.2 Sediment echosounder
The hull-mounted parametric sediment echosounder Teledyne ATLAS PARASOUND P70 uses a small opening angle (∼4°), thereby offering a high lateral resolution of ∼7% of the water depth (see details in Grant and Schreiber, 1990). During cruise SO260, the parametric frequency was set to 4 kHz, providing a penetration down to 100 m and a vertical resolution at the decimeter scale. In order to enhance reflector coherency and contrast, The Kingdom Software 2016.1 (IHS) was used to apply a band-pass filter (1,000/2000/6000/8,000 Hz) and calculate the trace envelopes. The initial filtering decreased residual background noise significantly, while strong amplitude spikes persist, likely caused by interference with simultaneously operating multibeam echosounder and acoustic doppler current profiler.
3.3 Multibeam echosounder
During expeditions SO260 and M78-3, the hull-mounted Kongsberg EM122 and EM120 were used for bathymetric mapping of the seafloor, respectively. Both multibeam echosounders operate at a frequency of 12 kHz and offer a maximum opening angle of 150°. The beam footprints of both systems have a dimension of 0.5° × 1° (RV SONNE; along x across-track) and 1° × 2° (RV METEOR). The processing of the swath bathymetry data was conducted using the open-source software MB-System v5.7.5. (Caress and Chayes, 1996). It included navigation editing, interactive sound velocity corrections, erroneous beam flagging, and grid generation. In addition to the bathymetric grids, backscatter grids of the recorded amplitude variations were created after backscatter strength normalizations using an angle-varying gain correction and with consideration of the seafloor morphology. Backscatter grids were interpreted in conjunction with PARASOUND profiles. All grids were visualized and interpreted using the open-source geographic information system QGIS. Several water sound velocity profiles were acquired during the survey using XSVP and a Sea-Bird SBE 9.11 CTD profiler (Kasten et al., 2019).
4 Results
4.1 Modern seafloor morphology
The study area on the northern segment of the Ewing Terrace lies between ∼950 m water depth in the northwestern parts and 1,550 m close to the MdP Canyon (Figure 1) and shows two prominent large-scale seafloor depressions: SD-N and another depression that is not part of this study. SD-N is a complex arc-shaped depression with a total length of 17.5 km and two distinct sub-depressions of up to 250 m in depth. The depression widens and deepens from the southern (6.5 km long, 1 km wide and ∼140 m relief) to the northern sub-depression (11 km long, 1.5 km wide and > 200 m relief, Figure 4) and changes its orientation from a SSW-NNE to a SW-NE direction. Three other small-scale incisions of < 500 m diameter and < 50 m depth were observed southwest of SD-N (Figures 1B, 4A). Close to the MdP Canyon, a connected chain of depressions (300–1,000 m diameter, 40–120 m depth) is in continuation of the southern sub-depression of SD-N. These depressions exhibit an asymmetric cross-section with a shorter (<100 m) upslope and a longer downslope flank (∼200 m). SD-N and both depression groups (small-scale depressions and connected depression chain) form an arc-shaped structure.
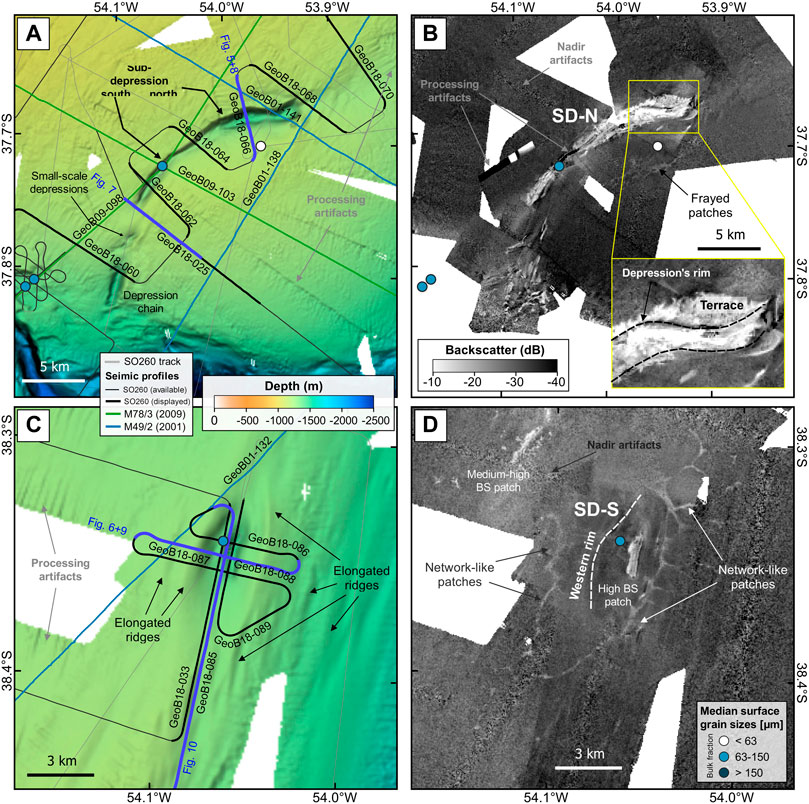
FIGURE 4. Available datasets. (A) Close-up bathymetry around SD-N with seismo-acoustic profiles from cruises M78/3 (2009) and SO260 (2018). Different colored lines show interpreted seismic profiles, cruise track of SO260 (thin grey), and seismic sections (thick blue) displayed in Figures 7, 8. (B) Backscatter mosaic around SD-N showing high backscatter intensities (white) for the area of SD-N, whereas the surrounding seafloor is mainly characterized by low intensities (dark grey). Yellow box marks the extent of the small inset map displaying backscatter anomalies outside the northern sub-depression of SD-N. (C) Close-up bathymetry around SD-S with acoustic profiles from M49/2 (2001) and SO260 (2018). Same color-coded lines as for (A). (D) Backscatter mosaic around SD-S showing a high backscatter intensity patch at the eastwards flank. The western rim (dashed white line) is barely visible, whereas the eastern rim is characterized by fuzzy network-like patches of elevated intensities. Colored circles indicate the grain sizes of sediment surface samples (Wilckens et al., 2021a; Wilckens et al., 2021b).
The southern segment features only one distinct large-scale seafloor depression (SD-S, Figure 1). SD-S has an elliptical shape with the major axis oriented NNE-SSW (8 km length) and the minor axis oriented WNW-ESE (3 km). The structure has a maximum depth of about 200 m. In addition, it is framed laterally by several elongated ridges, oriented NNE-SSW, which rise up to 20 m above the surrounding seafloor (Figures 1C, 4C). Other ridge-like features and furrows with slope-parallel orientations are located to the south of SD-S and further downslope. They show the same orientation as the major axis of SD-S and vary in width between a few hundred meters and 1 km, while maximum relief does not exceed 50 m.
4.2 Backscatter response and shallow subsurface structures
The southern sub-depression of SD-N is characterized by medium to high backscatter intensities, where dominantly sandy surface sediments are present (63–150 μm, Figure 4B). The high backscatter is mostly limited by the rim of the depression; however, high intensities are also displayed outside the depression at the upslope rim of the northern sub-depression (Figure 4B), where the backscatter mosaic appears patchy and frayed. These high backscatter intensities can be associated with a small terrace and outcropping strata north of and inside the SD-N northern sub-depression, respectively (2,700–3,200 m offset on the seismic profile in Figure 5). But in areas where the uppermost subsurface is characterized by mounded deposits (Figure 5B), only low backscatter intensities are recorded (Figure 5A). There, the gradually increasing backscatter values correlate with decreasing thicknesses of the overlying mounded deposits (Figure 5). Overall, high backscatter intensities around SD-N are linked to outcropping older strata with different characteristics and physical properties as younger deposits. Additionally, frayed and patchy backscatter anomalies are visible southeast of SD-N (Figure 4B) in an area of otherwise low backscatter, corresponding to finer, more silty sediments (<63 μm, Figure 4B).
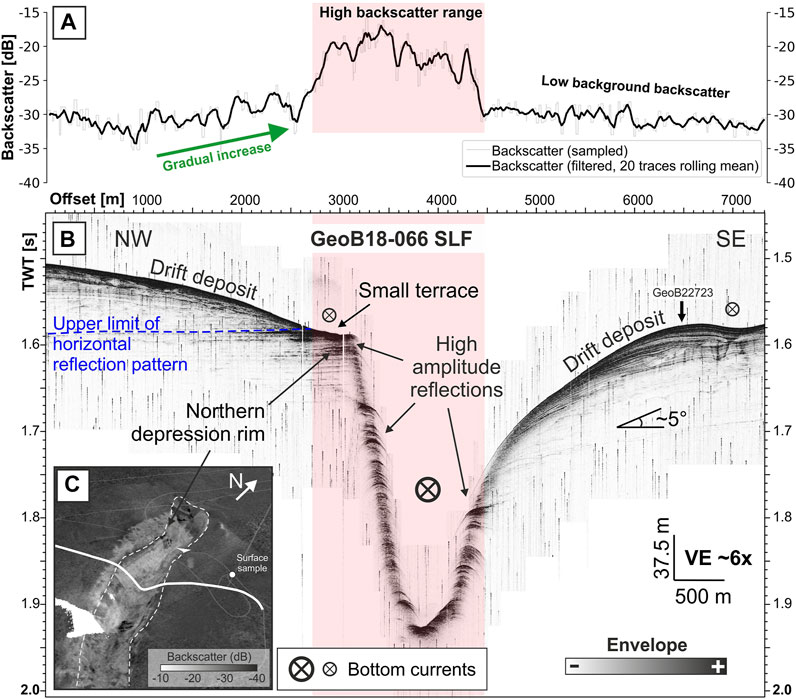
FIGURE 5. (A) Sampled (light grey line) and smoothed (black) backscatter intensities from a mosaic (25 m resolution) along (B) PARASOUND profile GeoB18-066 (4 kHz SLF envelope) crossing the northern sub-depression of SD-N. Area of high backscatter values marked with light red rectangles correlates with high amplitude reflections in the acoustic profile. (C) Perspective view of SD-N from SW showing the spatial extent of high backscatter intensities (white colors) and location of profile (thick white line). For the exact location of the profile, refer to Figure 4.
In the southern segment of the Ewing Terrace, the backscatter mosaic reveals several high backscatter anomalies and artifacts. The location of SD-S is indicated by a prominent patch of high backscatter intensities with a sharp boundary. However, this patch is significantly smaller than the extent of the morphological depression (Figure 4D) and linked to outcropping older strata at the eastern flank (Figure 6). In contrast, the backscatter mosaic exhibits low intensities in the remaining depression or western rim (Figure 4D) even though the western slope is completely covered by younger deposits (Figure 6) that are composed of mainly sandy surface sediments (63–150 μm, Figure 4D). The eastern depression rim is characterized by N-S trending network-like patches of medium-high backscatter values, extending over 16 km along-slope, and similar to features observed close to SD-N as well (Figure 4B). The medium-backscatter network-like anomalies correlates to localized, discontinuous high amplitude reflections in the uppermost subsurface (Figure 6).
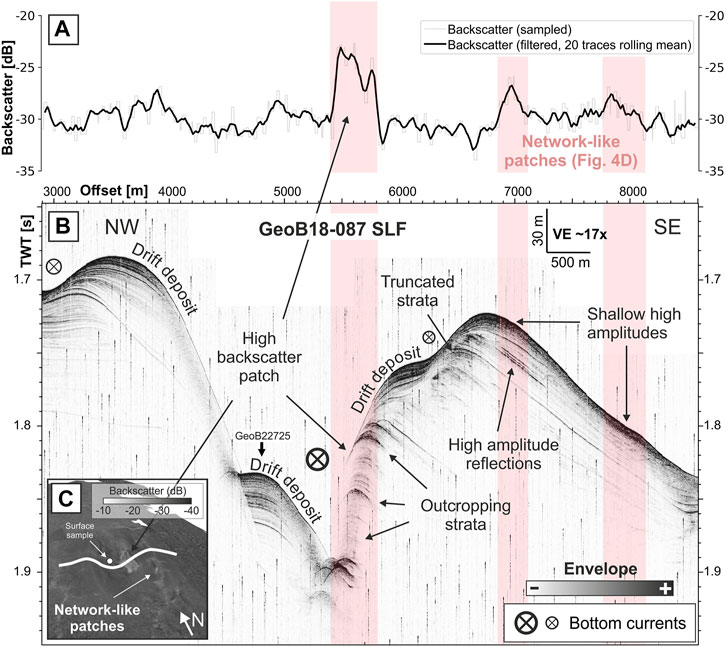
FIGURE 6. (A) Sampled (light grey line) and smoothed (black) backscatter intensities from a mosaic (25 m resolution) along (B) PARASOUND profile GeoB18-087 (4 kHz SLF envelope) crossing SD-S. Areas of high backscatter values marked with light red rectangles correlate with high amplitude reflections in the acoustic profile. (C) Perspective view of SD-S from SW showing the spatial extent of high backscatter patch inside SD-S (white colors) and location of profile (thick white line). For the exact location of the profile, refer to Figure 4.
4.3 Deep subsurface structures and seismo-stratigraphy
4.3.1 SD-N (northern Ewing Terrace)
The subsurface structures identified in the seismic profiles vary significantly along SD-N (Supplementary Figures S1–S5). However, the two most representative ones from the southern (GeoB18-025, Figure 7) and northern sub-depression (GeoB18-066, Figure 8) show the main subsurface characteristics of the depression.
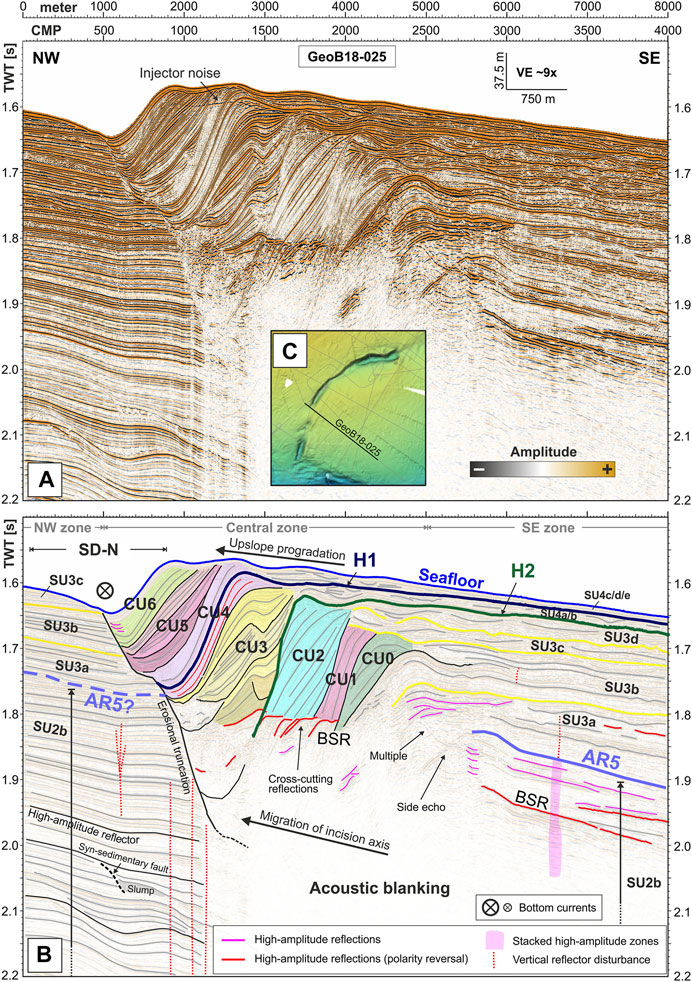
FIGURE 7. Seismic profile GeoB18-025 as (A) migrated section and (B) interpreted line drawing showing a complex clinoform reflection pattern featuring seven main and several secondary clinoform units (CU). Interpretations of stratigraphic horizons H1, H2, and AR5 and seismic units (SU3a-d) are based on Preu et al. (2012) (cf. Section 2.3). Different amplitude anomalies like high amplitude patterns, reflections with reversed seafloor polarity, and narrow vertical zones of disturbed reflections indicate the presence of gas and potential fluid migration. Significant profile parts below 2 s TWT and seaward of SD-N are masked by acoustic blanking. (C) Bathymetry map showing profile location.
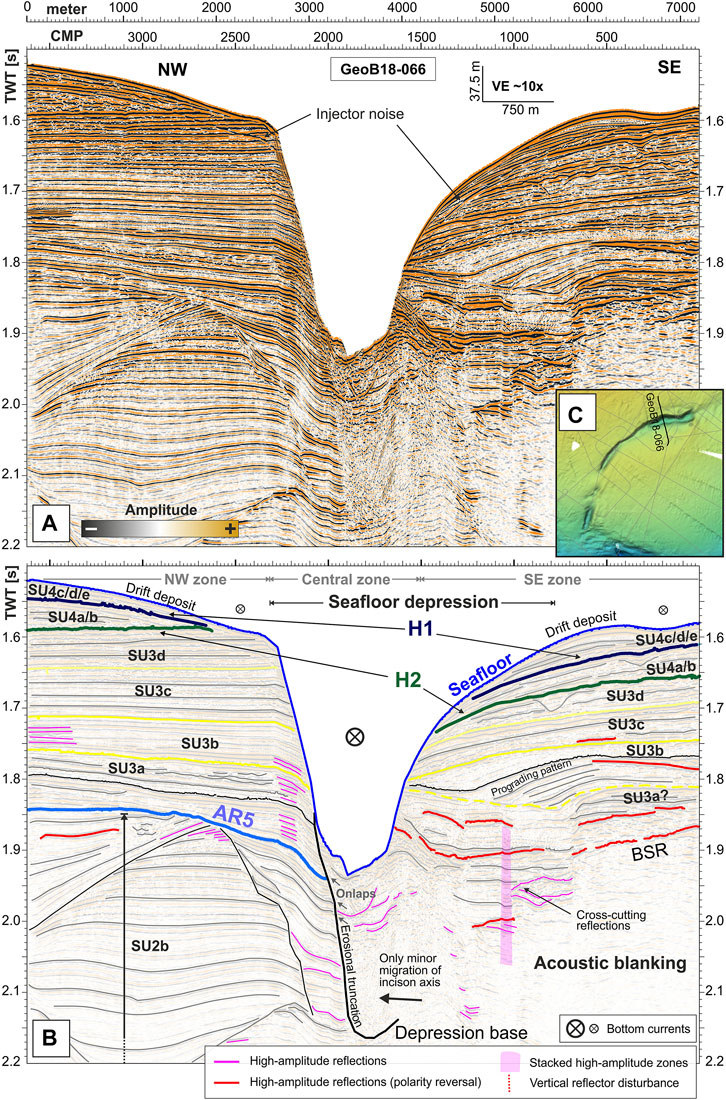
FIGURE 8. Seismic profile GeoB18-066 as (A) migrated section and (B) interpreted line drawing showing a prominent seafloor incision truncating horizontally aligned reflection patterns. Interpretations of stratigraphic horizons H1, H2, and AR5 and seismic units (SU3a-d) are based on Preu et al. (2012) (cf. Section 2.3). Different amplitude anomalies like high amplitude patterns, reflections with reversed seafloor polarity, and vertical high amplitude zones indicate the presence of gas and potential fluid migration. Some profile parts below 2 s TWT are masked by acoustic blanking. (C) Bathymetry map showing profile location.
4.3.1.1 Southern sub-depression
Seismic profile GeoB18-025 crosses the southernmost tip of SD-N (Figure 4A) and displays a complex seismo-stratigraphic architecture where three different lateral zones can be distinguished (Figure 7). In the zone located northwest of the seafloor depression (CMP 0–1,000, Figure 7), the oldest seismic unit (SU2b) is characterized by a succession of low to high amplitude reflections, which appear subparallel to divergent and partly even wavy, vertically separated by local unconformities. A small patch showing a chaotic reflection pattern is located at the base of a small-scale syn-sedimentary fault. Alternations of reflections with medium-high and low amplitudes, appearing slightly divergent to the southeast, are found above a distinct continuous, high-amplitude reflection at ∼1.95 s TWT (Figure 7). Dominantly high-amplitude, continuous reflections are present in the upper part above a strong reflector around 1.75s TWT that we interpret as Horizon AR5 (Preu et al., 2012). The reflection patterns change from sub-parallel, slightly divergent stratification (SU3a) to more parallel patterns close to the seafloor (SU3b, c). Reflections of SU3c are truncated by the seafloor reflector, and seismic units SU3d and SU4, as well as horizons H2 and H1, are missing.
The central zone (Figure 7) comprises a compound prograding unit, separated by an erosional truncation from the (sub)-parallel reflection patterns to the NW (Figure 7). Internally, the prograding structure can be subdivided by unconformities into seven major clinoform units (CU) displaying different geometric relationships. This sequence exhibits a cumulative thickness of >150 m and extends over ∼5 km distance. The bases of CU0 to CU3 are masked by an almost transparent zone below 1.8 s TWT (Figure 7) that shows several discontinuous high-amplitude reflections at the top that cross the inclined CU reflections (red lines, Figure 7). These reflections display a polarity reversal, and their lower parts are inclined according to the dipping strata but then bent into a seafloor-parallel position around 1.8 s TWT (CMP 1,400–2,000, Figure 7). The acoustic blanking is visible in all seismic profiles crossing SD-N and extends down to the lower slope (Supplementary Figure S11, cf. Preu et al., 2012). The unconformities separating the CUs are characterized by erosional truncation of the units below and by down- or onlaps of the units above. Generally, the older subunits (CU0/CU1) show a more oblique reflection pattern along the profile, followed by CU2 displaying a more sigmoidal pattern and CU3 showing a complex sigmoid-oblique reflection pattern. The upper units are characterized by a parallel (CU4, CU6) and a similar oblique pattern (CU5). CU5 can be found as a highly condensed unit in profiles crossing the actual sub-depression, while the uppermost unit CU6 appears only in profile GeoB18-025 (Figure 7) and is not identified on neighboring profiles closer to the MdP Canyon (GeoB18-060) or crossing the modern-day depression (GeoB18-062) (Figure 4). These profiles instead show a comparable greater incision depth at the modern seafloor (>150 m) and less spatially extended progradation (<3 km). The stratigraphic markers H2 and H1 can be traced into the clinoform pattern, revealing that clinoform units CU3 and CU4 belong to SU4a/b and SU4c/d/e, respectively, thus they have been deposited during the late Miocene and late Pliocene (cf. Section 2.3).
Southeast of the clinoform pattern (east of CMP 2500, Figure 7), SU2b features low-amplitude reflections beneath AR5 (around 1.9 s TWT) and displays localized reflections with very high amplitudes, which show polarity reversals in places (Figure 7). Based on different seismic facies, apparent unconformities, and correlation with established regional marker horizons, the column between AR5 and H2 can be vertically separated into four subunits (SU3a-d). They show a discontinuous reflection pattern that becomes progressively more hummocky stratified and exhibits higher amplitudes closer to the seafloor. The upper seismic unit (SU4), separated by horizons H2 and H1, displays generally sub-parallel reflections developing into more undulating and partly erosive patterns closer to SD-N (Figure 7).
4.3.1.2 Northern sub-depression
The architecture of the northern sub-depression of SD-N shows significant differences from the southern sub-depression, particularly the absence of the clinoform units (Figure 8). In the zone northwest of the depression (CMP 2100–3,600, Figure 8), SU2b shows relatively low amplitudes and more complex reflection patterns, including chaotic structures, erosional unconformities, and reflection patterns varying from divergent to subparallel. Reflections above AR5 are mostly parallel to subparallel with high to medium amplitudes that in places are diverging towards the depression (e.g., 1.75–1.85 s TWT, CMP 2200–3,500, Figure 8). This section can be vertically separated into four subunits (SU3a-d) based on reflection truncations or comparable high amplitudes (Figure 8). The marker horizons H1 and H2, as well as the reflection pattern of SU4, converge towards the depression, being either partly truncated (at CMP 2500, Figure 8) or terminating at the seafloor reflection. The western flank of the seafloor incision extends as an erosional truncation into the subsurface (>200 m), where partly chaotic infill structures onlap on this discontinuity (CMP 1,800–2,100, Figure 8).
The zone located southeast of the northern sub-depression displays similar subsurface structures along all seismic profiles (Figure 4) and extended areas of acoustic blanking in lower parts (CMP 0–1,500, Figure 8). This boundary is often accompanied by high amplitude reflection patches with reversed polarity cutting through stratigraphic layers and roughly following the seafloor reflector, which results in a step-like appearance (e.g., 1.95 s TWT, CMP 900, Figure 8). Similar high amplitude spots are also identified in the sediments above the blanking in depths between 1.73 and 1.85 s TWT and CMP 0–700 (Figure 8). The subsurface above AR5 is characterized by more undulating and incising reflection patterns, accompanied by at least one prograding stratified pattern in SU3b between CMP 500 and 1,300 in Profile GeoB18-066 (Figure 8). For this zone southeast of the depression, the subunit boundaries of SU3 and SU4, as well as horizons H1 and H2, appear tilted and locally convergent towards the depression.
4.3.1.3 Changing depositional and erosional patterns along SD-N
Overall, seismic profiles crossing SD-N reveal a complex pattern that changes along the depression. The depression chain close to the canyon shows mainly erosion or at least non-deposition above a sequence of clinoform units (GeoB18-060, Supplementary Figure S1), whereas no seismic data is available in the area of the small-scale depression (Figure 1). With further distance to the canyon, the southern sub-depression displays an extended and complex sequence of sigmoid and oblique clinoform patterns inside the former depression extent (Figure 7). The observed depression infill decreases considerably across the 2 km gap between Profiles GeoB18-025 and -062. The clinoform units above H1 are significantly thinner at the present-day erosion (GeoB18-062, Supplementary Figure S2) than at its almost buried southern tip (GeoB18-025, Figure 7), whereas SU4a/b below H1 shows relatively uniform thicknesses in all seismic sections. Finally, no major progradational clinoform units are present at the northern sub-depression, but rather horizontal reflection patterns are truncated by the seafloor depression (Figure 8).
Mapping the deepest traceable and recent incision axes for SD-N reveals a clear difference between the partly buried southern and the northern sections. While the position of the axis is stable in the northern segment (<1 km variation, Figure 8), a larger axis offset of at least 2.5 km is observed closer to the MdP Canyon (Figure 7). The inflection point is located in the narrow, less incised section around Profile GeoB18-064 (Figures 1, 4A). The former extent of SD-N was larger than the present-day seafloor expression, with an approximate northern extent reaching somewhere between Profiles GeoB18-068 and -070 (Supplementary Figures S4, S5). As indicated by seismic data and bathymetry, SD-N likely extended south to the MdP Canyon sometime in the past with a possible overall length of ∼30 km.
4.3.2 SD-S (southern Ewing Terrace)
Several cross-sections in the W-E direction exhibit the complex relief and subsurface architecture of SD-S (GeoB18-086, -087, and -088; Supplementary Figures S6–S9). These profiles can be subdivided into a western and an eastern section, separated by a distinct discontinuity that can be traced into the subsurface. Seven major erosional cut-and-fill structures can be found in the western sections of Profiles GeoB18-087 (Figure 9) and -088 (Supplementary Figure S8). The fills of older structures are truncated by erosional surfaces, and the resulting depressions infilled by younger sub-units. Towards the East, these cut-and-fill structures show a well-defined boundary to the remaining parallel background strata. The lowermost Truncation G forms a trough-like incision of at least 800 m length (along-slope) that is barely identifiable in the data due to a low amplitude zone beneath strong reflections at 2.0 s TWT (CMP 2,700–3,100, Figure 9).
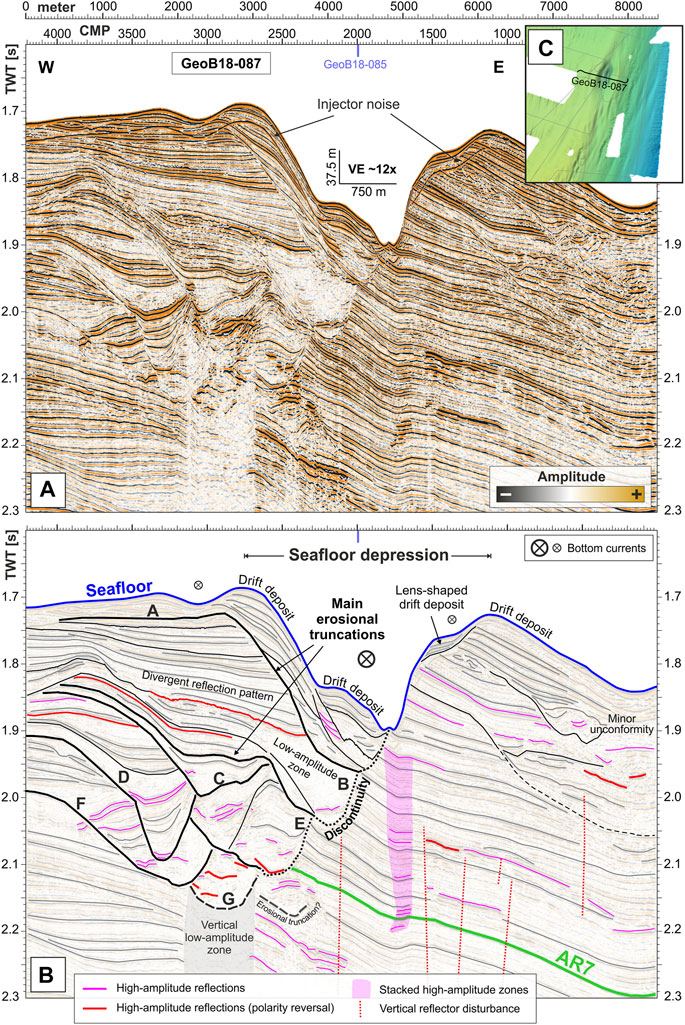
FIGURE 9. Seismic profile GeoB18-087 as (A) migrated section and (B) interpreted line drawing showing stacked cut-and-fill structures (truncations A-G) and more recent drift deposits inside and at the margins of SD-S. Interpretations of stratigraphic horizon AR7 are based on Gruetzner et al. (2016) (cf. Section 2.3). Prominent discontinuities produced by cut-and-fill structures extend the eastern flank of the seafloor depression into the subsurface (dotted lines). Different amplitude anomalies like high amplitude patterns, reflections with reversed seafloor polarity, low amplitude zones, and narrow vertical zones of disturbed reflections indicate the presence of gas and potential fluid migration. (C) Bathymetry map showing profile location.
Low amplitude zones and patterns of stacked high amplitude reflections that partly show a reversed polarity are visible inside these truncations (Figure 9). While the deeper incisions from G to C remain laterally stationary within ∼1.5 km, an eastward shift by ∼2.5 km can be observed from incisions at B to A to the current seafloor depression (Figure 9). Especially Truncation A exhibits deep erosion (∼200 m), whereas the reflections above display an oblique to sigmoid pattern, forming a mounded structure that is located at the western margin of the seafloor depression. This feature comprises an elongated ridge in the bathymetric data (Figure 4C). The sequence above Truncation A inside SD-S displays several secondary discontinuities and erosional truncations (Figure 9, thin black lines). Another mounded drift deposit is present at the toe of the western slope (Figure 9). All truncations forming the distinct cut-and-fill structures display relatively uniform spatial extents (∼3 km across-slope) and incision depths (∼150–200 m) based on their preserved subsurface structures. Seismic profiles north of SD-S show no seismic expression of buried depressions and, thus, indicate that the modern-day seafloor depression marks the most northeastern location of SD-S.
The eastern subsurface section can be subdivided into an upper and lower part. Eastward and thus down-slope tilted reflections are present below the unconformity (1.9–2.05 s TWT) with the position of Reflector AR7 derived from Gruetzner et al. (2016). The upper eastern section displays several minor unconformities and undulating to chaotic reflection patterns for all three parallel profiles (Figure 9). Numerous discontinuous reflections with particularly high amplitudes and partly reversed polarities appear in different places (red lines, Figure 9), and a vertical zone of high amplitudes can be identified below the incision axis of the present-day seafloor depression (Figure 9). Distinct but narrow vertical zones of unusually low amplitudes and disturbed reflections are visible in the seismic data (Figure 9). Both extend to a greater depth than the displayed 2.3 s TWT.
Within the N-S-aligned profiles (GeoB18-085 and -033; Figures 4, 10; Supplementary Figure S6), only the two easternmost truncations A and B can be identified in the subsurface, extending ∼8 km along-slope. Consequently, an exact estimation of the former extent of SD-S for the older erosional truncations C to G is not possible. However, based on the available seismic data we consider a comparable along-slope length of ∼8 km likely. Below Truncation B, all profiles display predominantly sub-parallel reflections with alternating amplitudes (Figure 10). An almost reflection-free zone inside an U-shaped incision is marked by a prominent high-amplitude reflection with reversed polarity (CMP 14800–16000, 1.9 s TWT). That reflection is overlain by packages of parallel reflections that are onlapping on Truncation B (Figure 10), covered by a wedge of chaotic high-amplitude reflections (70–100 m thickness) located directly beneath Truncation A. The incision formed by Truncation A is offset to the north and clearly truncates slightly northward tilted, parallel reflections (Figure 10). Inside this incision, several reflection patches with high amplitudes are visible in an otherwise complex fill pattern. The uppermost subsurface is dominated by a thick package of subparallel reflections overlaying Truncation A outside and draping over the complex fill pattern inside SD-S (Figure 10).
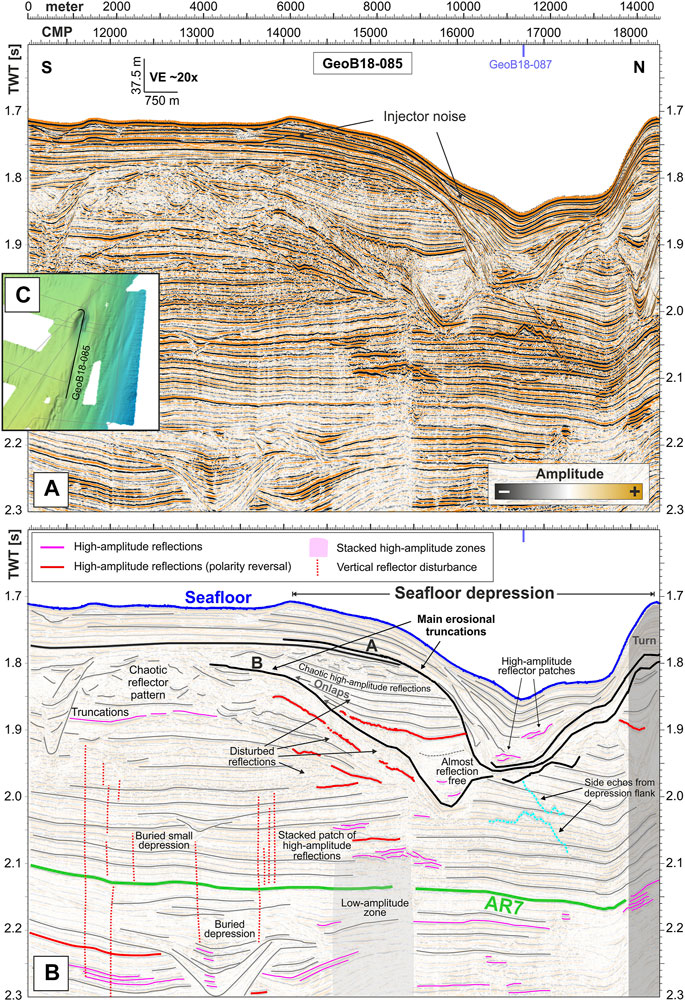
FIGURE 10. Seismic profile GeoB18-085 as (A) migrated section and (B) interpreted line drawing showing the two most recent cut-and-fill structures (truncations A and B) of SD-S and additional depression structures in the lower subsurface. Interpretations of stratigraphic horizon AR7 are based on Gruetzner et al. (2016) (cf. Section 2.3). Different amplitude anomalies like high amplitude patterns or reflections with reversed seafloor polarity might indicate the presence of gas and potential fluid migration. (C) Bathymetry map showing profile location.
5 Discussion
5.1 Onset of the depressions
5.1.1 SD-N
The seismic profiles crossing SD-N show a distinct erosional truncation forming the western, upslope flank of the seafloor depression that extends down into seismic unit SU2b and truncating the upslope reflection patterns and Reflector AR5 (Figures 7, 8). The original (former) depression base is identifiable for the northern sub-depression of SD-N (Figure 8) but cannot be identified for the southern sub-depression due to widespread acoustic blanking (Figure 7). Due to patches of high-amplitude reflections and the acoustic blanking, it was not possible to trace AR5 into the clinoform structure at the southern sub-depression (Figure 7) or determine its location downslope of the northern sub-depression (Figure 8). In contrast, H2 and H1 extend well into the clinoform unit (Figure 7) at the southern segment, while both horizons thinning towards the depression before terminating at the modern seafloor (Figure 8). The observed truncation of AR5 is likely the result of an upslope migration of SD-N, illustrated by the prograding clinoform units at the southern seafloor depression (Figure 7). Therefore, the onset of SD-N must have happened between AR5 and H2 and is estimated to be in the middle Miocene around 15–17 Ma.
5.1.2 SD-S
For SD-S, the location of two horizons (AR5 and AR7) could be inferred from the interpreted seismic Profile BGR 98-32 shown in Gruetzner et al. (2016). AR5 occurs in depths between 2.3 and 2.5 s TWT around SD-S and is not displayed in the seismic sections. Horizon AR7 could be traced in the vicinity of SD-S (Figures 9, 10), but the exact stratigraphic relation to the oldest Truncation G is masked by Truncations F-D. Hence, SD-S was initiated after AR7, likely around the Miocene/Pliocene boundary (c.f. Section 2.3), whereas the presence of Truncation G might indicate the development of an initial seafloor depression already in the Late Miocene.
5.2 Oceanographic impact on the evolution of giant seafloor depressions
5.2.1 Bottom current activity
The prominent clinoform pattern, infilling the southern sub-depression of SD-N (Figure 7) and featuring several unconformities (e.g., H1, H2), reveals a dynamic waxing and waning of bottom current intensity over geologic times. This asymmetric infill of SD-N was probably favored by more moderate and less variable current conditions in the middle Miocene that enabled sedimentation, as it was proposed by Preu et al. (2012). Furthermore, this pattern may be considered as the result of a helical flow caused by the Coriolis force that deflects the current vortex to the west (Faugères and Mulder, 2011; Rebesco et al., 2014), a concept that has been proposed for the Ewing Terrace Moat-1 (Steinmann et al., 2020). This would have enabled the observed upslope migration of the southern segment of SD-N and subsequent erosion while reduced current velocities and, thus, erosive potential allowed the subsequent deposition of sediments at the downslope flank of the depression. Following the strong bottom currents associated with H2 (c.f. Section 2.3), the vertically stacked clinoform sequences of CU3 indicate a depositional setting with a more stationary bottom current pathway over SD-N (Figure 7). The erosional truncation H1 marks strong bottom current activity followed by another period during which the bottom current migrated successively upslope, here associated with a prograding reflection pattern (CU4-6; Figure 7). The upper clinoform units CU4-6 exhibit distinct thickness variations in the southern profiles with significantly thicker sequences in Profile GeoB18-025 (Figure 7) than in GeoB18-062 (Supplementary Figure S2), pointing to increased sediment deposition and thus reduced current strength for the southern segment of SD-N in more recent geological times.
Ocean models for the study area suggest current velocities of 15–20 cm/s during the last decades that can locally increase up to 40–50 cm/s and, thus, indicate the potential to erode and transport grain sizes up to fine sand (Preu et al., 2013; Artana et al., 2019; Wilckens et al., 2021a). Modeled bottom currents over the last 25 years indicate a high variability of the deepest MC branch flowing along the basinward edge of the Ewing Terrace (Figure 2; Wilckens et al., 2021a). Its northernmost extent shifts, reaching the location of SD-S during some periods, while it varies in speed and thus favors the deposition of sediments at the plastered drift crest (Figures 1, 2). Especially south of the MdP Canyon, the measured and modeled bottom currents show large velocity fluctuations over time, and if the MC is weak, even a reversal of the main flow direction may occur (Wilckens et al., 2021a). The model further indicates lower current velocities north of the MdP Canyon, which is supported by measured grain sizes (Figure 1). In the direct vicinity of the MdP Canyon, velocities are lower than more distant on the Ewing Terrace (Wilckens et al., 2021a), which could explain the observed discrepancy between infilled southern and not filled northern segments of SD-N. Such fluctuations in velocity and location of strong bottom currents could favor alternations of erosion and deposition, as seen in the internal architecture of SD-S (Figure 9), and result in different surface grain sizes as measured inside and outside the depressions (Figures 4B, D) (Wilckens et al., 2021b). High backscatter intensities at the center and slopes showing outcropping and truncated reflections at both depressions indicate ongoing current erosion or at least non-deposition (Figures 6, 7). In contrast, low intensities correlate with drift deposits occurring as infill patches draping the depression slopes or as elongated mounded drifts framing the depression (SD-S, Figure 6). Surface grain size measurements depict predominantly fine to very fine sand in proximity to both seafloor depressions with coarser grain sizes found inside the depressions (Figures 1, 4, Kasten et al., 2019; Wilckens et al., 2021a). This further indicates the presence of bottom currents that prevent finer grain sizes from being deposited inside the depressions.
It is important to note that the observations drawn from bottom currents measurements, modeling, and induced features only represent a fairly short geological period, especially considering the proposed onset of the seafloor depressions in Miocene and Pliocene, respectively (cf. Section 5.1). However, these studies could still provide a reasonable assumption of bottom current dynamics since the modern circulation pattern was presumably established in the middle Miocene (Preu et al., 2012). The proposed relocation of the BMC between cold (glacial) and warm (interglacial) periods would have impacted the vertical water mass stratification and, thus, the intensity and flow direction of near-bottom currents (Preu et al., 2013; Hernández-Molina et al., 2016). In this regard, the exact location where near-bottom currents detach from the slope might have played an important role. A recent study suggested that the AAIW/UCDW interface was located ∼150 m deeper during the Last Glacial Maximum (Steinmann et al., 2020). Such vertical rearrangements of the water column would have altered the bottom current dynamics and triggered a change in the depositional setting, as observed for the prograding infill of SD-N and the cut-and-fill structures of SD-S. However, it was not possible to establish an exact relationship between changes in the depositional setting and glacial/interglacial cycles since the seismic exhibits fewer truncations as there are cycles recorded in the Pleistocene (e.g., Kohler and van de Wal, 2020). Sedimentological core descriptions and surface grain size measurements depict predominantly fine to very fine sand in proximity to both seafloor depressions with coarser grain sizes found inside the depressions (Figures 1, 4, Kasten et al., 2019; Wilckens et al., 2021a). This further indicates the presence of bottom currents that prevent finer grain sizes from being deposited inside the depressions. Similar oceanographic conditions featuring strong along-slope bottom currents can be found in the Gulf of Cadiz (e.g., Hernández-Molina et al., 2006; García et al., 2009; García et al., 2016a), along the Iberian margin (e.g., Hernández-Molina et al., 2011), the Alboran Sea (e.g., Ercilla et al., 2016), the Levant margin (e.g., Schattner et al., 2015; Schattner and Lazar, 2016; Kanari et al., 2020), the Scotia Sea (e.g., Maldonado et al., 2003; García et al., 2016b), or the northern European margin (e.g., Masson et al., 2002; Masson et al., 2004).
5.2.2 Sediment waves and eddies
Sediment waves on the Ewing Terrace south of the MdP Canyon suggest an interaction of the northward flowing bottom currents with internal waves propagating along the AAIW-UCDW interface (Figure 2) (Wilckens et al., 2021a) that are capable of actively eroding sediments (Pomar et al., 2012; Shanmugam, 2013; Miramontes et al., 2020). Mesoscale and small-scale eddies may serve as another possible oceanographic impact on the seafloor, as documented at the Argentine continental margin (Piola et al., 2013) and predicted to reach down to ∼3,000 m water depth (Rykova et al., 2017). Surface-generated mesoscale eddies are held accountable for transporting, reworking, and potentially eroding sediments in deep-water environments (Zhang et al., 2015; Breitzke et al., 2017; Miramontes et al., 2019b; Chen et al., 2019), while more localized and short-lived eddies can cause sediment erosion due to increased shear stress in turbulent flows (Pomar et al., 2012; Wilckens et al., 2021a). Such localized eddies might occur where internal waves interfere with the seafloor and result in higher turbulence (Wilckens et al., 2021a). Since the overall oceanographic stratification remained stable after the middle Miocene (Preu et al., 2012), it can be assumed that similar eddies also existed in former times and might have played a role in the initial and ongoing shaping of local seafloor irregularities. However, the detailed impact of internal waves and eddies on the seafloor depressions in the study area has to be investigated by further oceanographic studies.
5.3 Evidence of gas occurrence and vertical fluid flow
All our investigated seismic profiles feature evidence for gas occurrence and (vertical) fluid migration in close vicinity to both seafloor depressions. Some of the described high-amplitude reflection patches, especially when cross-cutting or superimposing underlying reflections, likely indicate free gas (e.g., Wenau et al., 2017; Cukur et al., 2019). The discontinuous reflections with polarity reversals, overlying the prominent area of acoustic transparency visible southeast of SD-N (Figures 7, 8) and cross-cutting the clinoform pattern in the southern sub-depression of SD-N are interpreted as a bottom simulating reflector (BSR). These reflections mark the lowermost occurrence of gas hydrates in the sediment pore space (Shipley et al., 1979; Mienert and Bünz, 2014). Similar observations have been made for inclined strata in the northern Gulf of Mexico (Shedd et al., 2012) or the Lower Congo Basin (Wenau et al., 2015). The acoustic blanking found in all profile sections southeast of SD-N is likely the result of an attenuation of the seismic signal caused by scattering at the gas front. Narrow zones showing locally disturbed reflections are interpreted as seismic chimneys or conduits, indicative of vertical gas migration towards the seafloor (Figure 11) (e.g., Wenau et al., 2017; Waghorn et al., 2018; Cukur et al., 2019).
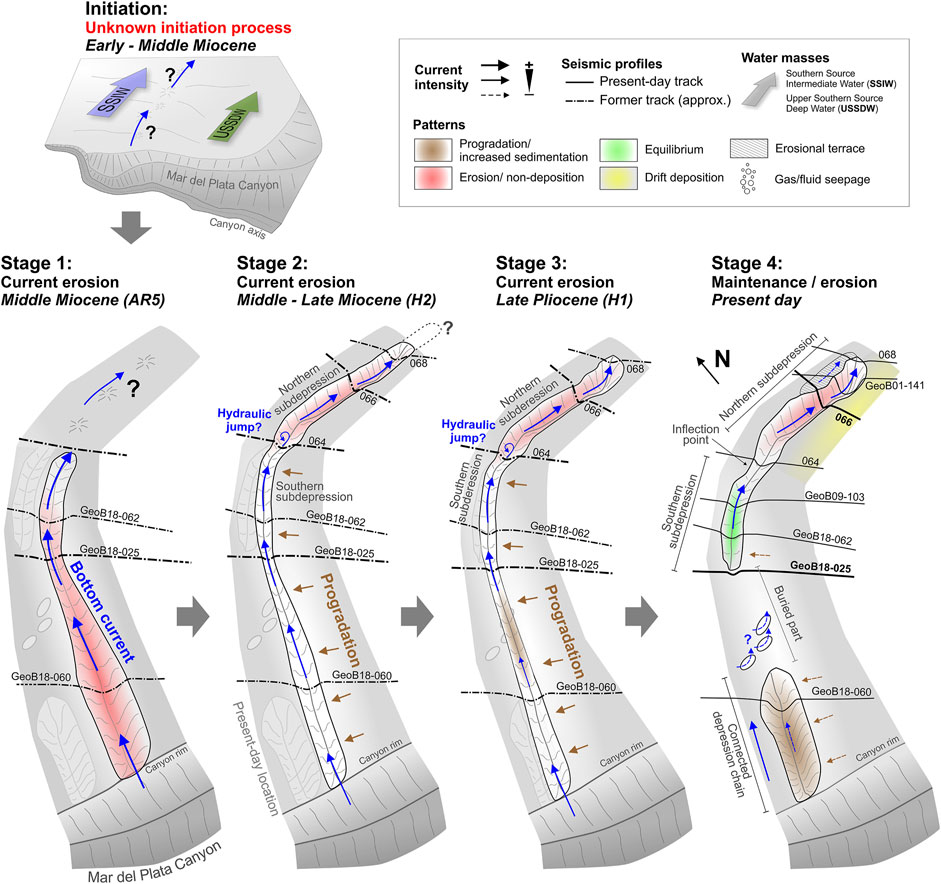
FIGURE 11. Conceptual model showing the proposed development of SD-N (Stage 1–4). For potential initiation processes (Section 5.4.1) and a detailed description of the evolutionary stages (Section 5.4.2), please refer to the text.
Backscatter anomalies found adjacent to the seafloor depressions are not created by outcropping strata but are most likely associated with fluid seepage (c.f. Figures 4B, D, 5, 6). Studies from the Baltic Sea have shown that already small amounts of gas in the pore space result in acoustic blanking of PARASOUND data (Tóth et al., 2014; Tóth et al., 2015). Since no such blanking is present in the PARASOUND data close to SD-S (Figure 6), the observed backscatter anomalies are most likely not caused by free gas in the sediments. Instead, they might indicate the presence of authigenic carbonates, gas hydrates, or seepage-associated fauna close beneath the seafloor (e.g., Judd and Hovland, 2007; Nöthen and Kasten, 2011) and thus resulting in volume backscattering.
Elongated backscatter anomalies have been previously described for pockmark-like venting structures on the continental slope off Congo (Casenave et al., 2017). Those features were linked to active methane seepage outside the initial depressions. Despite showing a different extent and shape at the seafloor, it is likely that the network-like patches observed in our study area (Figures 4, 6) are caused by fluid seepage and associated features like authigenic carbonate (e.g., Nöthen and Kasten, 2011) or benthic fauna (e.g., Casenave et al., 2017). However, additional research needs to be conducted in order to confirm the causes for the network-like structures of higher backscatter visible close to both seafloor depressions (Figures 4B, D).
Fluid migration linked to seafloor depressions has been reported in different areas along the southwestern Atlantic continental margin. Sub-circular depressions and acoustic anomalies have been documented at the Patagonian continental margin (Muñoz et al., 2012; Muñoz et al., 2013; Isola et al., 2020; Isola et al., 2021). In accordance with previous work by Jané et al. (2010) and Roy et al. (2014), they proposed that vertical diffuse fluid flow in permeable strata above faults constrained the pockmark distribution and appearance. Geochemical analyses of pore waters performed in the study area during previous cruises have already shown the presence of methane in shallow subsurface sediments linked to mass transport deposition (Henkel et al., 2011; Henkel et al., 2012) as well as at sites of the lower slope (Riedinger et al., 2005; Riedinger et al., 2014; Riedinger et al., 2017). Preliminary analyses of pore-water sulfate and methane concentrations of sediment cores sampled during cruise SO260 also demonstrate the presence of methane below sediment depths of ∼15 and ∼8 m at sites GeoB22721 and GeoB22722, respectively (Figure 1, data not shown). All our data show clear evidence for gas occurrence and vertical fluid flow in the study area. However, the origin, exact mechanisms of migration, and ages of these features remain ambiguous.
5.4 Evolutionary scenarios for SD-N and SD-S
5.4.1 Possible initiation processes
5.4.1.1 SD-N
Due to acoustic blanking, it is not possible to resolve the deeper subsurface section of SD-N. Although this prevents the identification of an initiation mechanism for SD-N, some hypothesis can be made and are discussed in the following. A structural-controlled origin has been previously proposed for SD-N (Henkel et al., 2011; Preu et al., 2013; Hernández-Molina et al., 2016). Gravitational sediment transport has been described for the slower slope, in association with the submarine canyons in the study area, and is common at the Uruguayan margin further north (Henkel et al., 2011; Krastel et al., 2011; Hernández-Molina et al., 2016). The MdP Canyon, which is likely the result of headward erosion (Bozzano et al., 2017), might have contributed to a destabilization of adjacent contouritic sediment deposits. The development of a local (blind) fault, resulting in irregularities at the seafloor, would be suitable to enable subsequent bottom current erosion. It could thus explain the elongated arc-like shape of SD-N that is not aligned with the contours or any known structural element in the study area (Figure 1). A structural control would also explain the distinct upslope limit of the observed BSR and the associated acoustic blanking beneath (Figure 7, 8). For the most part, the undisturbed sediment sequences landward of SD-N do not exhibit a BSR or any other evidence of gas occurrence or fluid migration (Figure 7, 8; Supplementary Figures S1–S6); only northwest of the northern sub-depression a BSR could be identified (Supplementary Figure S11). A recent study at the southern Namibian continental margin reveals that the initial onset of large-scale seafloor depressions might be linked to slope failures and subsequent headwall scarp formation or mass transport deposits creating an irregular rough surface (Wenau et al., 2021). These authors have shown that depressions be caused by local erosion through turbulence when bottom currents interact with existing seafloor irregularities (Wenau et al., 2021). Although the subsurface of the upslope flank of SD-N (Figures 7, 8) could be interpreted as the footwall of a normal fault, no vertical offset but clear indications of the erosional and depositional pattern are visible at the depression structure (Supplementary Figures S1–S5). Additionally, deep seismic data from the study area show regional faults predominantly further offshore in the oceanic crust (Franke et al., 2007; Gruetzner et al., 2016), and previously acquired seismic data shows no evidence for mass transport deposits in the subsurface at the outer Ewing Terrace (Supplementary Figure S11).
An alternative initiation process for SD-N would be an initial canyon rim erosion by focused strong upwelling currents inside the MdP Canyon. Submarine canyons have been proven to significantly impact the along-slope bottom currents by advection into the canyon and upwelling over the downstream rim (Allen and Hickey, 2010). The morphology of the MdP Canyon exhibits a ledge-like morphology adjacent to the southernmost side of the depressions chain (Figure 4A), which could have acted as an obstacle for an upwelling current, deflecting it to ascend, cross the northern rim and subsequently erode seafloor sediment on the adjacent terrace. However, no comparable studies have been conducted previously showing such an interplay of upwelling currents and focused extensive erosion, which is why we consider this process unlikely.
Based on the shape and location, SD-N might be interpreted as a former but now mainly buried tributary branch of the MdP Canyon, similar to the existing southern branch cutting into the basinward section of the Ewing Terrace (Figure 1). Numerous headwalls are observable along the rim of the main canyon and at the head of this tributary canyon, whose have been previously associated with slope failures and retrogressive erosion (Krastel et al., 2011; Warratz et al., 2019). However, unprocessed seismic data crossing the canyon flank in continuation of SD-N south of the connected depression chain (Figures 1, 4) show relatively undisturbed stratification and, thereby, that SD-N has never been connected to the MdP Canyon (Supplementary Figure S10). Additionally, the orientation of SD-N changes with increasing distance from the canyon from upslope over slope-parallel to almost downslope-facing. Such a pattern would be highly atypical for any dendritic canyon system where tributary canyons are almost always orientated upslope (Harris and Whiteway, 2011). Consequently, we consider this scenario to be rather implausible.
Overall, no single potential initiation mechanism of SD-N can be identified with certainty. Considering the shape and extent of SD-N, however, we believe that a structural-controlled origin is the most likely explanation. A former rotational fault, which is now masked by acoustic transparence, could have created a defined elongated area of seafloor irregularities, similar to the ones proposed by Wenau et al. (2021), which were subsequently reworked by bottom currents. These initial irregularities may have been further strengthened by seafloor fluid seepage following upward migration along the proposed fault, as abundant indications of gas-related features were found in the vicinity of SD-N (Section 5.2). There is, however, no conclusive evidence that the observed gas-related features have been present during the onset of SD-N in the middle Miocene.
5.4.1.2 SD-S
As presented, seismic and acoustic data indicate the widespread occurrence of gas and gas hydrates beneath both investigated seafloor depressions (Section 5.2). Indications of potential active fluid migration pathways was detected beneath the lowermost Truncation G, where high-amplitude reflections mark the upper limit of a vertical low-amplitude zone (Figure 9). Buried depressions (paleo-pockmarks) linked to stacked, high-amplitude reflection patches and vertical conduits pointing to upward gas or fluid migration were observed in older strata in close vicinity of SD-S (Figure 10). Fluid or gas seepage as triggers for pockmark formation are relatively well-known and have been attributed to many large-scale depressions (Davy et al., 2010; León et al., 2010; García et al., 2016a; Wenau et al., 2017; Waghorn et al., 2018; Cukur et al., 2019; Stott et al., 2019). Similar to SD-N, however, the available seismic data show no definitive evidence linking the onset of SD-S to seafloor seepage in the early Pliocene.
Another possible initiation process could be focused seafloor erosion by an oscillating wave field induced by turbulence in bottom currents (Wenau et al., 2021). The authors proposed a self-enhancing effect forming and maintaining seafloor depressions due to increasing current intensities over time. The modern-day SD-S is located at the crest of a plastered contourite drift, which could be indicative for a small-scale and localized unsteady current regime that might have affected former drift crests and thus caused seafloor erosion (c.f. Faugères et al., 1999; Rebesco et al., 2014; Sun et al., 2017).
For SD-S, we found abundant indications for fluid flow linked to presumed paleo-pockmarks in the subsurface. Tectonic or other evidence for different initiation processes as discussed above for SD-N are absent in the analyzed dataset. The exact generation mechanism remains ambiguous but we consider upward fluid/gas migration followed by seafloor seepage and subsequent pockmark build-up as the most likely origin of SD-S. However, we cannot be certain that seepage occurred at the time of the onset of SD-S in the early Pliocene. Alternatively, focused bottom current erosion could have initiated the development of SD-S.
5.4.2 Evolutionary stages of SD-N
After the initiation of SD-N in the middle Miocene (Section 5.1, 5.4.1), mainly bottom currents were shaping SD-N until today (Figure 11) as proposed for many other large-scale seafloor depressions (Davy et al., 2010; Collins et al., 2011; García et al., 2016a; Hillman et al., 2018; Klaucke et al., 2018; Waghorn et al., 2018; Cukur et al., 2019; Stott et al., 2019; Wenau et al., 2021).
Depression development and their subsequent erosion by bottom currents started mainly in the southern segment (Stage 1, Figure 11) and cut into strata older than mid-Miocene (Figures 7, 8), creating an elongated continuous furrow. During the middle to late Miocene (Stage 2, Figure 11), smaller seafloor irregularities were transformed into a longer depression with an arc shape by the action of bottom currents. Thereby two sub-depressions have been eroded that still exist today (southern and northern sub-depressions, Figures 1, 4). The significantly deeper northern sub-depression points to a hydraulic jump at the transition to the southern sub-depression that causes localized zones of strong vertical velocities (Kostic, 2011; Sumner et al., 2013) and turbulence, consequently preventing extensive sediment deposition. Simultaneous upslope erosion due to Coriolis force-induced helicoidal flows (Rebesco et al., 2014) and progradational infill in the southern depression segment (brown arrows, Figure 11) initiated a subsequent westward shift of the depression axis. The progradation continued throughout the Pliocene while the northern sub-depression kept its approximate location and showed only minor sediment infill over time (Stage 3, Figure 11). Bottom current strength decreased for the southern segment of SD-N, as the progradation continuously infilled the former depression (Stages 3–4). In contrast, persistent strong bottom currents are proposed for the northern sub-depression because increased sedimentation in the central part of the southern segment results in an apparent split of the former single feature into the connected depression chain at the MdP Canyon and prominent arc-shaped depression of the modern-day SD-N (Stage 4, Figure 11).
5.4.3 Recurring cut-and-fill sequences forming SD-S
An integrated analysis of all six seismic profiles crossing SD-S was used to derive an approximation of the individual spatial extents of the truncations and to compile the evolutionary model (Figure 12) after the initial development (Sections 5.2, 5.4.1). Localized eddy currents initiated by the interaction of bottom currents with already existing topography (e.g., plastered drift body) might have been a factor for the first broadening of the initial seafloor irregularity, as outlined in Section 5.3. Afterward, a succession of west and eastward shifts took place (F-C), changing into a general eastward and, thus, downslope shift of the depression center (C-recent; Figure 12). Only minor along-slope migration is illustrated by GeoB18-085 (Figure 12), but this interpretation is likely biased by a lack of profiles running further west of SD-S. However, as truncations G-C shows an elongated N-S extent, but truncations A and B were also present south of the modern-day seafloor depression (GeoB18-085, Figure 12), SD-S probably featured an overall NE-orientated migration. The entire development and maintenance of SD-S are interpreted to be dominated by strong bottom currents (Figure 12), which vary in intensity and direction and are likely influenced by the relocation of the BMC between colder and warmer climatic periods (Section 5.3). The general subsurface structure comprises large-scale cut-and-fill sequences building a complex subsurface structure (Figure 9). The only other occurrences of such structures in connection with seafloor depressions were previously described in the Gulf of Cadiz (García et al., 2016a) and recently for giant seafloor depressions on the Namibian Continental Margin (Wenau et al., 2021). Those cut-and-fill structures show distinct erosional truncations and are related to either deep-seated faults (García et al., 2016a) or rough surface formations following mass transport deposition (Wenau et al., 2021) and subsequent variations in bottom current intensities (Baraza and Ercilla, 1996; Wenau et al., 2021).
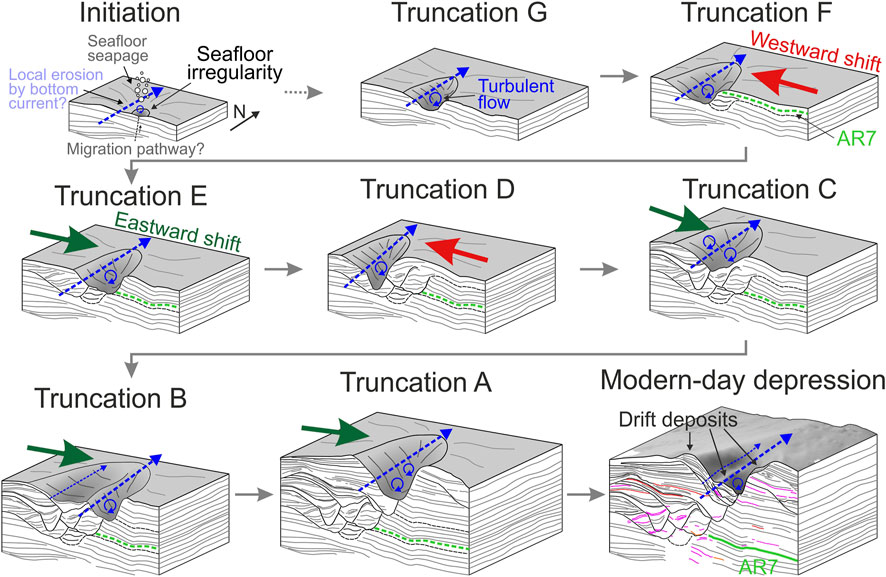
FIGURE 12. Conceptual model showing the development of SD-S over time (truncations G to A). Seafloor irregularities likely caused by seafloor seepage (Section 5.4.1) were enlarged by unidirectional bottom currents. Alternating erosion by strong bottom currents and deposition resulted in successions of cut-and-fill structures that exhibit a primarily eastward (downslope) and slightly northward shift of the depression structure. Colors for line drawing (current depression) from Figure 9. For a more detailed explanation, refer to the text (Section 5.4.3).
5.4.4 Depressions indicate locally dynamic current regime at BMC
Both studied seafloor depressions exhibit quite remarkable differences in their shapes and unique infill structures that are significantly different from most other known large-scale seafloor depressions. In most cases, they display a more simple internal structure, which often comprises a distinct depression flank and mounded sediment drift deposits infilling the depression at the downcurrent slope as observed on the Chatham Rise (e.g., Hillman et al., 2018; Klaucke et al., 2018), in the Korea Strait (Cukur et al., 2019), or in small-scale at the Patagonian continental slope (Isola et al., 2021). In contrast, a recent study proposed a prograding infill on the upcurrent and erosion on the downcurrent depression flank (Wenau et al., 2021), showing that opposing current flow directions can result in similar crescent-shaped depressions. However, these studies indicate a relatively straightforward interaction between bottom currents and the seafloor. In our study area, the significantly more complex prograding infill pattern of SD-N and the cut-and-fill structures of SD-S suggest the waxing and waning of bottom current strengths in one of the world’s most hydrodynamically active regions (Piola and Matano, 2019). The studied depressions, therefore, illustrate the highly variable impact of bottom currents in time and space on the sedimentary regime close to the MdP Canyon. As previously described, the variations in bottom current strength and orientation are likely influenced by the spatial shift of the BMC over geological time scales (Preu et al., 2012; Voigt et al., 2013; Hernández-Molina et al., 2016). The BMC is the dominating oceanographic regime in the study area, leading (today) to a different bottom current pattern north and south of the MdP Canyon (Wilckens et al., 2021a), which is supported by the described morphological differences of both seafloor depressions. It should be further noted that SD-N is located at the interface between AAIW and UCDW, whereas SD-S is located within the UCDW. This further contributes to small-scale variations of the bottom current pattern, especially when sea-level fluctuations affect the vertical water mass distribution (Preu et al., 2012) and, thus, the bottom current circulation in the vicinity of the seafloor depressions. In summary, the remarkable depositional and erosional structures observed at both studied depressions indicate that their evolution is strongly driven by dynamic bottom currents.
6 Conclusion
Giant seafloor depressions have been the target of several previous studies; however, mechanisms leading to their generation are largely unknown or lack evidence. Multibeam and seismo-acoustic data recently acquired during RV SONNE cruise SO260, together with previously recorded data, allowing for the first time a comprehensive analysis of two unique depressions (SD-N and SD-S) at the Argentine Continental Margin north and south of the MdP Canyon, respectively.
SD-N reveals two segments, where significant parts of the southern segment are filled with a complex prograding architecture comprising seven major and several smaller clinoform units, whereas the northern sub-depression displays continuous erosion or non-deposition. In contrast, SD-S on the Southern Ewing Terrace is visible as a single prominent seafloor depression that comprises at least seven large-scale cut-and-fill structures, indicating alternating erosional and depositional periods over time.
The initiation of SD-N could be estimated to the middle Miocene (∼15–17 Ma), whereas the onset of SD-S likely occurred at the Miocene/Pliocene boundary about 6 Ma ago. We propose fluid/gas migration and subsequent seafloor seepage as the most likely initial mechanism forming SD-S, however, focused erosion by bottom currents may also have played a distinct role. No clear initiation process could be identified for SD-N; however, we suggest that some structural control is required to generate such arc-shaped morphology. Hence, our favored initiation process is the development of a small rotational (blind) fault in the early to middle Miocene, potentially accompanied by fluid/gas migration/seepage, which caused a minor vertical displacement and small irregularities at the seafloor.
Since their initiation, the morphology of both depressions has been continuously shaped by strong yet varying bottom currents within the Brazil-Malvinas Confluence (BMC), an observation similar to other large-scale depressions in dynamic oceanographic settings. An upward shift of water masses resulting in lower current speeds in the Miocene likely enabled the infill of the southern segment of SD-N. Varying strengths and northward extents of bottom currents on the Southern Ewing Terrace, influenced by the relocation of the BMC between colder and warmer climatic periods, probably affected the build-up of cut-and-fill structures for SD-S. Different and dynamic bottom current patterns north and south of the MdP Canyon subsequently result in unique internal structures for both depressions, compared to other known and generally simpler giant seafloor depressions.
In summary, the results of our study highlight two exceptional seafloor features shaped by localized seafloor erosion and contribute to a better understanding of the complex interaction between bottom current activity and fluid migration in hydrodynamically active and dynamic depositional settings.
Data availability statement
The datasets presented in this study can be found in online repositories. The names of the repository/repositories and accession number(s) can be found below: The data used for multibeam bathymetry and backscatter figures, as well as the interpretation of sediment echosounder and seismic profiles in this study, is accessible by contacting the corresponding author and are available at the PANGAEA Data Publisher via https://doi.org/10.1594/PANGAEA.938438, https://doi.org/10.1594/PANGAEA.938455, and https://doi.org/10.1594/PANGAEA.938459. The raw multibeam EM122 data of RV SONNE cruise SO260/1 is available at the PANGAEA Data Publisher via https://doi.org/10.1594/PANGAEA.888569.
Author contributions
FW, TS, and EM contributed to the conception and design of the study. FW performed the data processing, analysis, visualization and wrote the original manuscript draft. FW, TS, VS, and SW conducted the data collection. FW was in charge of data curation. TS, VS, and SK acquired the funding for the project leading to this publication and were responsible for the planning and execution of the research. All authors contributed to the manuscript revision, read, and approved the submitted version.
Funding
For funding of the cruise SO260, we acknowledge the DFG Research Centre/Cluster of Excellence “The Ocean in the Earth System” (MARUM—Center for Marine Environmental Sciences at the University of Bremen). For additional funding, we thank the Helmholtz Association (Alfred Wegener Institute Helmholtz Centre for Polar and Marine Research, Bremerhaven).
Acknowledgments
We thank the nautical crews and onboard scientific teams for their support during RV SONNE voyage SO260 in 2018, RV METEOR voyage M78/3 in 2009, and RV METEOR voyage M49/2 in 2001. We especially thank the onboard geophysics team members R. Brune, O. Ogunleye, L. Steinmann, and A. Thieblemont for their assistance in acquiring the seismo-acoustic data during cruise SO260. IHS Global Inc. (The Kingdom Software) and Schlumberger (VISTA 2D/3D Seismic Data Processing) generously provided academic software licenses. We also thank the editor and reviewers for their constructive comments, which helped to considerably improve the manuscript.
Conflict of interest
The authors declare that the research was conducted in the absence of any commercial or financial relationships that could be construed as a potential conflict of interest.
Publisher’s note
All claims expressed in this article are solely those of the authors and do not necessarily represent those of their affiliated organizations, or those of the publisher, the editors and the reviewers. Any product that may be evaluated in this article, or claim that may be made by its manufacturer, is not guaranteed or endorsed by the publisher.
Supplementary material
The Supplementary Material for this article can be found online at: https://www.frontiersin.org/articles/10.3389/feart.2023.1117013/full#supplementary-material
References
Allen, S. E., and Hickey, B. M. (2010). Dynamics of advection-driven upwelling over a shelf break submarine canyon. J. Geophys. Res. 115 (C8), C08018. doi:10.1029/2009JC005731
Artana, C., Provost, C., Lellouche, J. M., Rio, M. H., Ferrari, R., and Sennéchael, N. (2019). The Malvinas current at the confluence with the Brazil current: Inferences from 25 Years of mercator ocean reanalysis. J. Geophys. Res. Oceans 124 (10), 7178–7200. doi:10.1029/2019jc015289
Baraza, J. S., and Ercilla, G. (1996). Gas-charged sediments and large pockmark-like features on the Gulf of Cadiz slope (SW Spain). Mar. Petroleum Geol. 13 (2), 253–261. doi:10.1016/0264-8172(95)00058-5
Berden, G., Charo, M., Möller, O. O., and Piola, A. R. (2020). Circulation and hydrography in the western South Atlantic shelf and export to the deep adjacent ocean: 30°S to 40°S. J. Geophys. Res. Oceans 125 (10). doi:10.1029/2020jc016500
Bozzano, G., Cerredo, M. E., Remesal, M., Steinmann, L., Hanebuth, T. J. J., Schwenk, T., et al. (2021). Dropstones in the Mar del Plata Canyon Area (SW Atlantic): Evidence for Provenance, Transport, Distribution, and Oceanographic Implications. Geochem. Geophys. Geosystems 22. doi:10.1029/2020gc009333
Bozzano, G., Martín, J., Spoltore, D. V., and Violante, R. (2017). Los cañones submarinos del margen continental argentino: Una síntesis sobre su génesis y dinámica sedimentaria. Lat. Am. J. Sedimentology Basin Analysis 24 (1), 85–101.
Breitzke, M., Wiles, E., Krocker, R., Watkeys, M. K., and Jokat, W. (2017). Seafloor morphology in the Mozambique channel: Evidence for long-term persistent bottom-current flow and deep-reaching eddy activity. Mar. Geophys. Res. 38 (3), 241–269. doi:10.1007/s11001-017-9322-7
Cacchione, D. A., Pratson, L. F., and Ogston, A. S. (2002). The shaping of continental slopes by internal tides. Science 296 (5568), 724–727. doi:10.1126/science.1069803
Caress, D. W., and Chayes, D. N. (1996). Improved processing of hydrosweep DS multibeam data on the R/V maurice ewing. Mar. Geophys. Res. 18 (6), 631–650. doi:10.1007/bf00313878
Casenave, V., Gay, A., and Imbert, P. (2017). Spider structures: Records of fluid venting from methane hydrates on the Congo continental slope. Bull. Société géologique Fr. 188 (4), 27. doi:10.1051/bsgf/2017189
Chelton, D. B., Schlax, M. G., Witter, D. L., and Richman, J. G. (1990). Geosat altimeter observations of the surface circulation of the Southern Ocean. J. Geophys. Res. 95 (C10), 17877. doi:10.1029/JC095iC10p17877
Chen, H., Zhang, W., Xie, X., and Ren, J. (2019). Sediment dynamics driven by contour currents and mesoscale eddies along continental slope: A case study of the northern south China sea. Mar. Geol. 409, 48–66. doi:10.1016/j.margeo.2018.12.012
Chen, J., Song, H., Guan, Y., Yang, S., Pinheiro, L. M., Bai, Y., et al. (2015). Morphologies, classification and Genesis of pockmarks, mud volcanoes and associated fluid escape features in the northern Zhongjiannan Basin, South China Sea. Deep Sea Res. Part II Top. Stud. Oceanogr. 122, 106–117. doi:10.1016/j.dsr2.2015.11.007
Collins, J., Molnar, P., and Sheehan, A. (2011). Multibeam bathymetric surveys of submarine volcanoes and mega-pockmarks on the Chatham Rise, New Zealand. N. Z. J. Geol. Geophys. 54 (3), 329–339. doi:10.1080/00288306.2011.589860
Cukur, D., Kong, G.-S., Chun, J.-H., Kang, M.-H., Um, I.-K., Kwon, T., et al. (2019). Morphology and Genesis of giant seafloor depressions on the southeastern continental shelf of the Korean Peninsula. Mar. Geol. 415, 105966. doi:10.1016/j.margeo.2019.105966
Davy, B., Pecher, I., Wood, R., Carter, L., and Gohl, K. (2010). Gas escape features off New Zealand: Evidence of massive release of methane from hydrates: Massive nz gas escape features. Geophys. Res. Lett. 37 (21), n/a. 10/dw73ws.
Ercilla, G., Juan, C., Hernández-Molina, F. J., Bruno, M., Estrada, F., Alonso, B., et al. (2016). Significance of bottom currents in deep-sea morphodynamics: An example from the Alboran Sea. Mar. Geol. 378, 157–170. doi:10.1016/j.margeo.2015.09.007
Ercilla, G., Schwenk, T., Bozzano, G., Spiess, V., Violante, R., Estrada, F., et al. (2019). Cenozoic sedimentary history of the northern Argentine continental slope, off Bahia Blanca, the location of the Ewing Terrace: Palaeogeodynamic and palaeoceanographic implications. Mar. Geol. 417, 106028. doi:10.1016/j.margeo.2019.106028
Ewing, M., and Lonardi, A. G. (1971). Sediment transport and distribution in the Argentine Basin. 5. Sedimentary structure of the Argentine margin, basin, and related provinces. Phys. Chem. Earth 8, 125–251. doi:10.1016/0079-1946(71)90017-6
Faugères, J.-C., and Mulder, T. (2011). “Contour currents and contourite drifts,” in Deep-Sea sediments. Editors H. HüNeke, and T. Mulder, 149–214.
Faugères, J.-C., Stow, D. A. V., Imbert, P., and Viana, A. (1999). Seismic features diagnostic of contourite drifts. Mar. Geol. 162 (1), 1–38. doi:10.1016/s0025-3227(99)00068-7
Franke, D., Neben, S., Ladage, S., Schreckenberger, B., and Hinz, K. (2007). Margin segmentation and volcano-tectonic architecture along the volcanic margin off Argentina/Uruguay, South Atlantic. Mar. Geol. 244 (1-4), 46–67. doi:10.1016/j.margeo.2007.06.009
García, M., Hernández-Molina, F. J., Alonso, B., Vázquez, J. T., Ercilla, G., Llave, E., et al. (2016a). Erosive sub-circular depressions on the Guadalquivir Bank (Gulf of Cadiz): Interaction between bottom current, mass-wasting and tectonic processes. Mar. Geol. 378, 5–19. doi:10.1016/j.margeo.2015.10.004
García, M., Hernández-Molina, F. J., Llave, E., Stow, D. A. V., León, R., Fernández-Puga, M. C., et al. (2009). Contourite erosive features caused by the mediterranean outflow water in the Gulf of Cadiz: Quaternary tectonic and oceanographic implications. Mar. Geol. 257 (1-4), 24–40. doi:10.1016/j.margeo.2008.10.009
García, M., Lobo, F. J., Maldonado, A., Hernández-Molina, F. J., Bohoyo, F., and Pérez, L. F. (2016b). High-resolution seismic stratigraphy and morphology of the Scan Basin contourite fan, southern Scotia Sea, Antarctica. Mar. Geol. 378, 361–373. doi:10.1016/j.margeo.2016.01.011
Gordon, A. L. (1989). Brazil-Malvinas confluence–1984. Deep Sea Res. Part A. Oceanogr. Res. Pap. 36 (3), 359–384. doi:10.1016/0198-0149(89)90042-3
Grant, J. A., and Schreiber, R. (1990). “Modern swathe sounding and sub-bottom profiling technology for research applications: The atlas hydrosweep and parasound systems,” in Marine Geological Surveying and Sampling (Springer), 9–19.
Gruetzner, J., Uenzelmann-Neben, G., and Franke, D. (2016). Evolution of the northern Argentine margin during the Cenozoic controlled by bottom current dynamics and gravitational processes. Geochem. Geophys. Geosystems 17 (8), 3131–3149. doi:10.1002/2015gc006232
Gruetzner, J., Uenzelmann-Neben, G., and Franke, D. (2011). Variations in bottom water activity at the southern Argentine margin: Indications from a seismic analysis of a continental slope terrace. Geo-Marine Lett. 31 (5-6), 405–417. doi:10.1007/s00367-011-0252-0
Gruetzner, J., Uenzelmann-Neben, G., and Franke, D. (2012). Variations in sediment transport at the central Argentine continental margin during the Cenozoic. Geochem. Geophys. Geosystems 13 (10), n/a. doi:10.1029/2012gc004266
Hammer, Ø., Webb, K. E., and Depreiter, D. (2009). Numerical simulation of upwelling currents in pockmarks, and data from the Inner Oslofjord, Norway. Geo-Marine Lett. 29 (4), 269–275. doi:10.1007/s00367-009-0140-z
Harris, P. T., and Whiteway, T. (2011). Global distribution of large submarine canyons: Geomorphic differences between active and passive continental margins. Mar. Geol. 285 (1-4), 69–86. doi:10.1016/j.margeo.2011.05.008
Henkel, S., Schwenk, T., Hanebuth, T. J. J., Strasser, M., Riedinger, N., Formolo, M., et al. (2012). Pore water geochemistry as a tool for identifying and dating recent mass-transport deposits. Submar. Mass Movements Their Consequences, 87–97. doi:10.1007/978-94-007-2162-3_8
Henkel, S., Strasser, M., Schwenk, T., Hanebuth, T. J. J., Hüsener, J., Arnold, G. L., et al. (2011). An interdisciplinary investigation of a recent submarine mass transport deposit at the continental margin off Uruguay. Geochem. Geophys. Geosystems 12 (8), n/a. doi:10.1029/2011gc003669
Hernández-Molina, F. J., Serra, N., Stow, D. A. V., Llave, E., Ercilla, G., and Van Rooij, D. (2011). Along-slope oceanographic processes and sedimentary products around the Iberian margin. Geo-Marine Lett. 31 (5-6), 315–341. doi:10.1007/s00367-011-0242-2
Hernández-Molina, F. J., Llave, E., Stow, D. A. V., García, M., Somoza, L., Vázquez, J. T., et al. (2006). The contourite depositional system of the Gulf of cádiz: A sedimentary model related to the bottom current activity of the mediterranean outflow water and its interaction with the continental margin. Deep Sea Res. Part II Top. Stud. Oceanogr. 53 (11-13), 1420–1463. doi:10.1016/j.dsr2.2006.04.016
Hernández-Molina, F. J., Paterlini, M., Somoza, L., Violante, R., Arecco, M. A., de Isasi, M., et al. (2010). Giant mounded drifts in the Argentine Continental Margin: Origins, and global implications for the history of thermohaline circulation. Mar. Petroleum Geol. 27 (7), 1508–1530. doi:10.1016/j.marpetgeo.2010.04.003
Hernández-Molina, F. J., Paterlini, M., Violante, R., Marshall, P., de Isasi, M., Somoza, L., et al. (2009). Contourite depositional system on the Argentine Slope: An exceptional record of the influence of Antarctic water masses. Geology 37 (6), 507–510. doi:10.1130/g25578a.1
Hernández-Molina, F. J., Soto, M., Piola, A. R., Tomasini, J., Preu, B., Thompson, P., et al. (2016). A contourite depositional system along the Uruguayan continental margin: Sedimentary, oceanographic and paleoceanographic implications. Mar. Geol. 378, 333–349. doi:10.1016/j.margeo.2015.10.008
Hillman, J. I. T., Gorman, A. R., and Pecher, I. A. (2015). Geostatistical analysis of seafloor depressions on the southeast margin of New Zealand's South Island — investigating the impact of dynamic near seafloor processes on geomorphology. Mar. Geol. 360, 70–83. doi:10.1016/j.margeo.2014.11.016
Hillman, J. I. T., Klaucke, I., Pecher, I. A., Gorman, A. R., Schneider von Deimling, J., and Bialas, J. (2018). The influence of submarine currents associated with the Subtropical Front upon seafloor depression morphologies on the eastern passive margin of South Island, New Zealand. N. Z. J. Geol. Geophys. 61 (1), 112–125. doi:10.1080/00288306.2018.1434801
Hinz, K., Neben, S., Schreckenberger, B., Roeser, H. A., Block, M., Souza, K. G. d., et al. (1999). The Argentine continental Margin north of 48S: Sedimentary successions, volcanic activity during breakup. Mar. Petroleum Geol. 16 (1), 1–25. doi:10.1016/S0264-8172(98)00060-9
Hovland, M., and Judd, A. (1988). Seabed pockmarks and seepages - impact on geology, biology and the marine environment.
Ingrassia, M., Martorelli, E., Bosman, A., Macelloni, L., Sposato, A., and Chiocci, F. L. (2015). The Zannone Giant Pockmark: First evidence of a giant complex seeping structure in shallow-water, central Mediterranean Sea, Italy. Mar. Geol. 363, 38–51. doi:10.1016/j.margeo.2015.02.005
Isola, J. I., Bravo, M. E., Bozzano, G., Palma, F. I., Ormazabal, J. P., Principi, S., et al. (2021). The Late-Quaternary deposits of the Piedra Buena Terrace (Patagonian continental slope, SW Atlantic): An example of interaction between bottom currents and seafloor morphology. Mar. Geol. 435, 106459. doi:10.1016/j.margeo.2021.106459
Isola, J. I., Ormazabal, J. P., Flores, G., Arismendi, S., Druet, M., Muñoz, A., et al. (2020). Tectonic and structural controls on neogene fluid release in the patagonian continental margin. Mar. Petroleum Geol. 115, 104246. doi:10.1016/j.marpetgeo.2020.104246
Jané, G., Maestro, A., Ercilla, G., López-Martínez, J., De Andrés, J. R., Casas, D., et al. (2010). Occurrence of pockmarks on the ortegal spur continental margin, northwestern iberian Peninsula. Mar. Petroleum Geol. 27 (7), 1551–1564. doi:10.1016/j.marpetgeo.2010.04.001
Judd, A., and Hovland, M. (2007). Seabed fluid flow: The impact on geology, biology and the marine environment. Cambridge University Press.
Kanari, M., Tibor, G., Hall, J. K., Ketter, T., Lang, G., and Schattner, U. (2020). Sediment transport mechanisms revealed by quantitative analyses of seafloor morphology: New evidence from multibeam bathymetry of the Israel exclusive economic zone. Mar. Petroleum Geol. 114, 104224. doi:10.1016/j.marpetgeo.2020.104224
Kasten, S., Nöthen, K., Hensen, C., Spieß, V., Blumenberg, M., and Schneider, R. R. (2012). Gas hydrate decomposition recorded by authigenic barite at pockmark sites of the northern Congo Fan. Geo-Marine Lett. 32 (5-6), 515–524. doi:10.1007/s00367-012-0288-9
Kasten, S., Schwenk, T., Aromokeye, D. A., Baques, M., Baumann, K.-H., Bergenthal, M., et al. (2019). Dynamics of sedimentation processes and their impact on biogeochemical reactions on the continental slope off Argentina and Uruguay (MARUM), cruise No. SO260/Leg 1 & Leg2, leg 1: January 12 - january 30, 2018, buenos aires (Argentina) - montevideo (Uruguay). DosProBio. Leg 2: February 2 - February, 14, 2018, Montevideo. doi:10.2312/cr_so260
King, L. H., and MacLean, B. (1970). Pockmarks on the scotian shelf. Geol. Soc. Am. Bull. 81 (10), 3141. doi:10.1130/0016-7606(1970)81[3141:potss]2.0.co;2
Klaucke, I., Sarkar, S., Bialas, J., Berndt, C., Dannowski, A., Dumke, I., et al. (2018). Giant depressions on the Chatham Rise offshore New Zealand – morphology, structure and possible relation to fluid expulsion and bottom currents. Mar. Geol. 399, 158–169. doi:10.1016/j.margeo.2018.02.011
Kohler, P., and van de Wal, R. S. W. (2020). Interglacials of the Quaternary defined by northern hemispheric land ice distribution outside of Greenland. Nat. Commun. 11 (1), 5124. doi:10.1038/s41467-020-18897-5
Kostic, S. (2011). Modeling of submarine cyclic steps: Controls on their formation, migration, and architecture. Geosphere 7 (2), 294–304. doi:10.1130/GES00601.1
Krastel, S., Wefer, G., Hanebuth, T. J. J., Antobreh, A. A., Freudenthal, T., and Preu, B. (2011). Sediment dynamics and geohazards off Uruguay and the de la Plata River region (Northern Argentina and Uruguay). Geo-Marine Letters 31 (4), 271–283. doi:10.1007/s00367-011-0232-4
León, R., Somoza, L., Medialdea, T., Hernández-Molina, F. J., Vázquez, J. T., Díaz-del-Rio, V., et al. (2010). Pockmarks, collapses and blind valleys in the Gulf of Cádiz. Geo-Marine Lett. 30 (3-4), 231–247. doi:10.1007/s00367-009-0169-z
Magalhães, J., and da Silva, J. (2017). Internal waves along the Malvinas current: Evidence of transcritical generation in satellite imagery. Oceanography 30 (3). doi:10.5670/oceanog.2017.319
Maldonado, A., Barnolas, A., Bohoyo, F., Galindo-Zaldı́var, J., Hernández-Molina, J., Lobo, F., et al. (2003). Contourite deposits in the central Scotia Sea: The importance of the antarctic circumpolar current and the weddell gyre flows. Palaeogeogr. Palaeoclimatol. Palaeoecol. 198 (1-2), 187–221. doi:10.1016/s0031-0182(03)00401-2
Masson, D. G., Howe, J. A., and Stoker, M. S. (2002). Bottom-current sediment waves, sediment drifts and contourites in the northern Rockall Trough. Mar. Geol. 192 (1-3), 215–237. doi:10.1016/s0025-3227(02)00556-x
Masson, D. G., Wynn, R. B., and Bett, B. J. (2004). Sedimentary environment of the Faroe-Shetland and Faroe Bank Channels, north-east Atlantic, and the use of bedforms as indicators of bottom current velocity in the deep ocean. Sedimentology 51 (6), 1207–1241. doi:10.1111/j.1365-3091.2004.00668.x
Mienert, J., and Bünz, S. (2014). “Bottom-simulating seismic reflectors (BSRs),” in Encyclopedia of marine Geosciences. Editors J. Harff, M. Meschede, S. Petersen, and J. Thiede (Dordrecht: Springer Netherlands), 1–9.
Miramontes, E., Jouet, G., Thereau, E., Bruno, M., Penven, P., Guerin, C., et al. (2020). The impact of internal waves on upper continental slopes: Insights from the Mozambican margin (southwest Indian ocean). Earth Surf. Process. Landforms 45 (6), 1469–1482. doi:10.1002/esp.4818
Miramontes, E., Garreau, P., Caillaud, M., Jouet, G., Pellen, R., Hernández-Molina, F. J., et al. (2019a). Contourite distribution and bottom currents in the NW Mediterranean Sea: Coupling seafloor geomorphology and hydrodynamic modelling. Geomorphology 333, 43–60. doi:10.1016/j.geomorph.2019.02.030
Miramontes, E., Penven, P., Fierens, R., Droz, L., Toucanne, S., Jorry, S. J., et al. (2019b). The influence of bottom currents on the zambezi valley morphology (Mozambique channel, SW Indian ocean): In situ current observations and hydrodynamic modelling. Mar. Geol. 410, 42–55. doi:10.1016/j.margeo.2019.01.002
Muñoz, A., Acosta, J., Cristobo, J., Druet, M., and Uchupi, E. (2013). Geomorphology and shallow structure of a segment of the Atlantic Patagonian margin. Earth-Science Rev. 121, 73–95. doi:10.1016/j.earscirev.2013.03.002
Muñoz, A., Cristobo, J., Rios, P., Druet, M., Polonio, V., Uchupi, E., et al. (2012). Sediment drifts and cold-water coral reefs in the Patagonian upper and middle continental slope. Mar. Petroleum Geol. 36 (1), 70–82. doi:10.1016/j.marpetgeo.2012.05.008
Nicholson, U., and Stow, D. (2019). Erosion and deposition beneath the subantarctic front since the early oligocene. Sci. Rep. 9 (1), 9296. doi:10.1038/s41598-019-45815-7
Nöthen, K., and Kasten, S. (2011). Reconstructing changes in seep activity by means of pore water and solid phase Sr/Ca and Mg/Ca ratios in pockmark sediments of the Northern Congo Fan. Mar. Geol. 287 (1-4), 1–13. doi:10.1016/j.margeo.2011.06.008
Pau, M., Gisler, G., and Hammer, Ø. (2014). Experimental investigation of the hydrodynamics in pockmarks using particle tracking velocimetry. Geo-Marine Lett. 34 (1), 11–19. doi:10.1007/s00367-013-0348-9
Pilcher, R., and Argent, J. (2007). Mega-pockmarks and linear pockmark trains on the West African continental margin. Mar. Geol. 244 (1-4), 15–32. doi:10.1016/j.margeo.2007.05.002
Piola, A. R., Franco, B. C., Palma, E. D., and Saraceno, M. (2013). Multiple jets in the Malvinas current: Multiple jets in the Malvinas current. J. Geophys. Res. Oceans 118 (4), 2107–2117. doi:10.1002/jgrc.20170
Piola, A. R., and Matano, R. P. (2019). “ocean currents: Atlantic western boundary—Brazil current/falkland (Malvinas) current,” in Encyclopedia of ocean Sciences (Elsevier), 414–420.
Piola, A. R., Matano, R. P., Steele, J. H., Thorpe, S. A., and Turekian, K. K. (2001). “Brazil and Falklands (Malvinas) currents,” in Encyclopedia of ocean Sciences (London: Academic Press).
Pomar, L., Morsilli, M., Hallock, P., and Bádenas, B. (2012). Internal waves, an under-explored source of turbulence events in the sedimentary record. Earth-Science Rev. 111 (1-2), 56–81. doi:10.1016/j.earscirev.2011.12.005
Preu, B., Hernández-Molina, F. J., Violante, R., Piola, A. R., Paterlini, C. M., Schwenk, T., et al. (2013). Morphosedimentary and hydrographic features of the northern Argentine margin: The interplay between erosive, depositional and gravitational processes and its conceptual implications. Deep Sea Res. Part I Oceanogr. Res. Pap. 75, 157–174. doi:10.1016/j.dsr.2012.12.013
Preu, B., Schwenk, T., Hernández-Molina, F. J., Violante, R., Paterlini, M., Krastel, S., et al. (2012). Sedimentary growth pattern on the northern Argentine slope: The impact of North Atlantic Deep Water on southern hemisphere slope architecture. Mar. Geol. 329-331, 113–125. doi:10.1016/j.margeo.2012.09.009
Puig, P., Palanques, A., Guillén, J., and El Khatab, M. (2004). Role of internal waves in the generation of nepheloid layers on the northwestern Alboran slope: Implications for continental margin shaping. J. Geophys. Res. 109 (C9), C09011. doi:10.1029/2004JC002394
Rebesco, M., Hernández-Molina, F. J., Van Rooij, D., and Wåhlin, A. (2014). Contourites and associated sediments controlled by deep-water circulation processes: State-of-the-art and future considerations. Mar. Geol. 352, 111–154. doi:10.1016/j.margeo.2014.03.011
Reid, J. L., Nowlin, W. D., and Patzert, W. C. (1977). On the characteristics and circulation of the southwestern atlantic ocean. J. Phys. Oceanogr. 7 (1), 62–91. doi:10.1175/1520-0485(1977)007<0062:otcaco>2.0.co;2
Riboulot, V. (2018). Geomorphology of gas hydrate-bearing pockmark. Gas. Hydrates, 37–48. doi:10.1002/9781119451174.ch4
Riboulot, V., Sultan, N., Imbert, P., and Ker, S. (2016). Initiation of gas-hydrate pockmark in deep-water Nigeria: Geo-mechanical analysis and modelling. Earth Planet. Sci. Lett. 434, 252–263. doi:10.1016/j.epsl.2015.11.047
Riedinger, N., Brunner, B., Krastel, S., Arnold, G. L., Wehrmann, L. M., Formolo, M. J., et al. (2017). Sulfur cycling in an iron oxide-dominated, dynamic marine depositional system: The Argentine continental margin. Front. Earth Sci. 5. doi:10.3389/feart.2017.00033
Riedinger, N., Formolo, M. J., Lyons, T. W., Henkel, S., Beck, A., and Kasten, S. (2014). An inorganic geochemical argument for coupled anaerobic oxidation of methane and iron reduction in marine sediments. Geobiology 12 (2), 172–181. doi:10.1111/gbi.12077
Riedinger, N., Pfeifer, K., Kasten, S., Garming, J. F. L., Vogt, C., and Hensen, C. (2005). Diagenetic alteration of magnetic signals by anaerobic oxidation of methane related to a change in sedimentation rate. Geochimica Cosmochimica Acta 69 (16), 4117–4126. doi:10.1016/j.gca.2005.02.004
Roy, S., Senger, K., Braathen, A., Noormets, R., Hovland, M., and Olaussen, S. (2014). Fluid migration pathways to seafloor seepage in inner Isfjorden and Adventfjorden, Svalbard. Nor. J. Geol. 94, 99–119.
Rykova, T., Oke, P. R., and Griffin, D. A. (2017). A comparison of the structure, properties, and water mass composition of quasi-isotropic eddies in Western boundary currents in an eddy-resolving ocean model. Ocean. Model. 114, 1–13. doi:10.1016/j.ocemod.2017.03.013
Sahling, H., Bohrmann, G., Spiess, V., Bialas, J., Breitzke, M., Ivanov, M., et al. (2008). Pockmarks in the Northern Congo Fan area, SW Africa: Complex seafloor features shaped by fluid flow. Mar. Geol. 249 (3-4), 206–225. doi:10.1016/j.margeo.2007.11.010
Schattner, U., Gurevich, M., Kanari, M., and Lazar, M. (2015). Levant jet system—Effect of post LGM seafloor currents on nile sediment transport in the eastern mediterranean. Sediment. Geol. 329, 28–39. doi:10.1016/j.sedgeo.2015.09.007
Schattner, U., and Lazar, M. (2016). Hierarchy of source-to-sink systems — example from the Nile distribution across the eastern Mediterranean. Sediment. Geol. 343, 119–131. doi:10.1016/j.sedgeo.2016.08.006
Schattner, U., Lazar, M., Souza, L. A. P., ten Brink, U., and Mahiques, M. M. (2016). Pockmark asymmetry and seafloor currents in the Santos Basin offshore Brazil. Geo-Marine Lett. 36 (6), 457–464. doi:10.1007/s00367-016-0468-0
Schümann, T. K., and Littke, R. (2002). The hydrocarbon potential of the deep offshore along the Argentine volcanic rifted margin: A numerical simulation. Fak. für Georessourcen Mater.
Shanmugam, G. (2013). Modern internal waves and internal tides along oceanic pycnoclines: Challenges and implications for ancient deep-marine baroclinic sands. AAPG Bull. 97 (5), 799–843. doi:10.1306/10171212101
Shedd, W., Boswell, R., Frye, M., Godfriaux, P., and Kramer, K. (2012). Occurrence and nature of “bottom simulating reflectors” in the northern Gulf of Mexico. Mar. Petroleum Geol. 34 (1), 31–40. doi:10.1016/j.marpetgeo.2011.08.005
Shipley, T. H., Houston, M. H., Buffler, R. T., Shaub, F. J., Mcmillen, K. J., Laod, J. W., et al. (1979). Seismic evidence for widespread possible gas hydrate horizons on continental slopes and rises. AAPG Bull. 63 (12), 2204–2213. doi:10.1306/2f91890a-16ce-11d7-8645000102c1865d
Spiess, V. (2001)., 49/2. Report and preliminary results of METEOR Cruise M, Montevideo (Uruguay)-Montevideo. 13.02.-07.03.2001.
Steinmann, L., Baques, M., Wenau, S., Schwenk, T., Spiess, V., Piola, A. R., et al. (2020). Discovery of a giant cold-water coral mound province along the northern Argentine margin and its link to the regional Contourite Depositional System and oceanographic setting. Mar. Geol. 427, 106223. doi:10.1016/j.margeo.2020.106223
Stott, L., Davy, B., Shao, J., Coffin, R., Pecher, I., Neil, H., et al. (2019). CO2 release from pockmarks on the Chatham rise-bounty trough at the glacial termination. Paleoceanogr. Paleoclimatology 34, 1726–1743. doi:10.1029/2019PA003674
Sultan, N., Marsset, B., Ker, S., Marsset, T., Voisset, M., Vernant, A. M., et al. (2010). Hydrate dissolution as a potential mechanism for pockmark formation in the Niger delta. J. Geophys. Res. 115 (B8), B08101. doi:10.1029/2010jb007453
Sumner, E. J., Peakall, J., Parsons, D. R., Wynn, R. B., Darby, S. E., Dorrell, R. M., et al. (2013). First direct measurements of hydraulic jumps in an active submarine density current: Hydraulic jumps in a density current. Geophys. Res. Lett. 40 (22), 5904–5908. doi:10.1002/2013GL057862
Sun, Q., Cartwright, J., Lüdmann, T., Wu, S., Yao, G., and Trofimovs, J. (2017). Three-dimensional seismic characterization of a complex sediment drift in the South China Sea: Evidence for unsteady flow regime. Sedimentology 64 (3), 832–853. doi:10.1111/sed.12330
Tóth, Z., Spiess, V., and Keil, H. (2015). Frequency dependence in seismoacoustic imaging of shallow free gas due to gas bubble resonance. J. Geophys. Res. Solid Earth 120 (12), 8056–8072. doi:10.1002/2015JB012523
Tóth, Z., Spieß, V., and Jensen, J. (2014). Seismo-acoustic signatures of shallow free gas in the bornholm basin, Baltic Sea. Cont. Shelf Res. 88, 228–239. doi:10.1016/j.csr.2014.08.007
Valla, D., Piola, A. R., Meinen, C. S., and Campos, E. (2018). Strong mixing and recirculation in the northwestern Argentine basin. J. Geophys. Res. Oceans 123 (7), 4624–4648. doi:10.1029/2018jc013907
Violante, R. A., Laprida, C., and García Chapori, N. L. (2017). The Argentina continental margin: A potential paleoclimatic-paleoceanographic archive for the southern ocean. Cham: Springer International Publishing.
Violante, R. A., Paterlini, C. M., Costa, I. P., Hernández-Molina, F. J., Segovia, L. M., Cavallotto, J. L., et al. (2010). Sismoestratigrafia y evolución geomorfológica del talud continental adyacente al litoral del este bonaerense, Argentina. Lat. Am. J. sedimentology basin analysis 17 (1), 33–62.
Voigt, I., Henrich, R., Preu, B. M., Piola, A. R., Hanebuth, T. J. J., Schwenk, T., et al. (2013). A submarine canyon as a climate archive — interaction of the Antarctic Intermediate Water with the Mar del Plata Canyon (Southwest Atlantic). Mar. Geol. 341, 46–57. doi:10.1016/j.margeo.2013.05.002
Waghorn, K. A., Pecher, I., Strachan, L. J., Crutchley, G., Bialas, J., Coffin, R., et al. (2018). Paleo-fluid expulsion and contouritic drift formation on the Chatham Rise, New Zealand. Basin Res. 30 (1), 5–19. doi:10.1111/bre.12237
Warratz, G., Schwenk, T., Voigt, I., Bozzano, G., Henrich, R., Violante, R., et al. (2019). Interaction of a deep-sea current with a blind submarine canyon (Mar del Plata Canyon, Argentina). Mar. Geol. 417, 106002. doi:10.1016/j.margeo.2019.106002
Wenau, S., Spiess, V., Pape, T., and Fekete, N. (2015). Cold seeps at the salt front in the Lower Congo Basin I: Current methane accumulation and active seepage. Mar. Petroleum Geol. 67, 894–908. doi:10.1016/j.marpetgeo.2014.07.032
Wenau, S., Spiess, V., and Zabel, M. (2021). Giant seafloor depressions caused by slope failures and bottom currents on the Namibia continental margin. Geochem. Geophys. Geosystems 22. doi:10.1029/2020gc009548
Wenau, S., Spieß, V., Pape, T., and Fekete, N. (2017). Controlling mechanisms of giant deep water pockmarks in the Lower Congo Basin. Mar. Petroleum Geol. 83, 140–157. doi:10.1016/j.marpetgeo.2017.02.030
Wilckens, H., Miramontes, E., Schwenk, T., Artana, C., Zhang, W., Piola, A., et al. (2021a). The erosive power of the Malvinas Current: Influence of bottom currents on morpho-sedimentary features along the northern Argentine Margin (SW Atlantic Ocean). Mar. Geol. 439, 106539. doi:10.1016/j.margeo.2021.106539
Wilckens, H., Miramontes, E., Schwenk, T., Artana, C., Zhang, W., Piola, A. R., et al. (2021b). Grain size metadata of surface sediment samples from SONNE cruise SO260 and METEOR cruise M78. doi:10.1594/PANGAEA.931224
Zhang, K., Guan, Y., Song, H., Fan, W., Li, H., Kuang, Y., et al. (2020). A preliminary study on morphology and Genesis of giant and mega pockmarks near Andu Seamount, Nansha Region (South China Sea). Mar. Geophys. Res. 41 (1), 2. doi:10.1007/s11001-020-09404-y
Keywords: giant seafloor depression, bottom currents, cut-and-fill structures, Argentine continental margin, reflection seismic, fluid expulsion
Citation: Warnke F, Schwenk T, Miramontes E, Spiess V, Wenau S, Bozzano G, Baqués M and Kasten S (2023) Evolution of complex giant seafloor depressions at the northern Argentine continental margin (SW Atlantic Ocean) under the influence of a dynamic bottom current regime. Front. Earth Sci. 11:1117013. doi: 10.3389/feart.2023.1117013
Received: 06 December 2022; Accepted: 27 January 2023;
Published: 08 February 2023.
Edited by:
Michel Michaelovitch Mahiques, University of São Paulo, BrazilReviewed by:
Uri Schattner, University of Haifa, IsraelEleonora Martorelli, National Research Council (CNR), Italy
Copyright © 2023 Warnke, Schwenk, Miramontes, Spiess, Wenau, Bozzano, Baqués and Kasten. This is an open-access article distributed under the terms of the Creative Commons Attribution License (CC BY). The use, distribution or reproduction in other forums is permitted, provided the original author(s) and the copyright owner(s) are credited and that the original publication in this journal is cited, in accordance with accepted academic practice. No use, distribution or reproduction is permitted which does not comply with these terms.
*Correspondence: Fynn Warnke, fwarnke@uni-bremen.de
†Present address: Fynn Warnke, School of Environment, Faculty of Science, University of Auckland, Auckland, New Zealand