Prediction of Chongqing's grain output based on support vector machine
 Jia Wang1
  Guixian Tian
- 1School of Business, Zhejiang Wanli University, Ningbo, China
- 2School of Business, Pingxiang University, Pingxiang, China
- 3Shandong Marine Economic and Cultural Research Institute, Shandong Academy of Social Science, Qingdao, China
Scientific prediction of agricultural food production plays an essential role in stabilizing food supply. In order to improve the accuracy of grain yield prediction and reduce the error of grain yield prediction in Chongqing, this paper proposes a new method for the grain yield prediction in Chongqing by using support vector machine (SVM). In this paper, based on the support vector regression structure, the support vector regression algorithm is designed, and then the support vector machine is adopted in the replacement of the error back propagation process in BP neural network. The results of case analysis show that the method based on support vector machine can effectively reduce the error of grain yield prediction.
1. Introduction
Food is the basic material for the survival of human life. Food has been an important issue concerning the development of human society since ancient times. Drought exacerbated by global warming and rising prices of the food in the world have once again heightened concerns about food security (Bingjun and Weiming, 2019). Food supply and demand are closely related to food security. Food security is not only an economic issue, but also related to the long-term and stable development of a country.
With a population of more than 1.4 billion, China is both a major grain producer and a major grain consumer. The food shortage is likely to become a major bottleneck issue impeding China's economic development and social stability. Therefore, it is very essential to ensure the food security and strike the balance between the food supply and demand (Tian et al., 2018). With the increasing population, the decrease in arable land, accelerated urbanization and the improvement in people's livelihood, the Chinese increasingly need more and more food supply, the food supply fails to meet people's demands for food. Moreover, as a special commodity related to the national economy and people's livelihood, food is highly susceptible to non-traditional factors, such as food hegemony and biofuel development. Therefore, food security has become a long-term strategic task for China (Dai et al., 2020).
At present, remote sensing prediction model, statistical dynamic growth simulation model, meteorological yield prediction model and other technologies are applied for predicting the grain yield (Hayashi et al., 2018). Generally speaking, prediction models are the major method used to predict the future situation of food supply and demand and determine its potential impact on the world food market. For example, the United States Department of Agriculture (USDA) uses econometric methods to carry out long-term prediction of the production, consumption, and trade of major agricultural products in China. In addition, scholars have used a partial equilibrium model, to predict grain yield for the agricultural sector. The model is a global, non-regional economic model, including 35 countries and regions, 17 products, and it is a highly comprehensive model in nature. The model predicts that China's grain production will grow at an annual rate of 1.7 to 1.8 percent, reaching 640 to 660 million tons by 2030. Meanwhile, according to the prediction, China's food demand will range from 680 million tons to 717 million tons by 2030, with a gap of between 0.4 million and 57 million tons (Chao et al., 2018). A model is OECF model. It is used by the Overseas Foundation of Japan to forecast grain production and perform trend analysis without considering the effect of price.
In addition, techniques, such as time series model, regression model, systematic integrated factor forecasting method, simulation technology forecasting method, neural network forecasting method, chaos forecasting method, and gray forecasting method to forecast grain production (Fei and Xing, 2019). For example, he investment occupancy output technique and the variable coefficient forecasting model method were used to predict China's grain production, grain imports, and self-sufficiency rate by 2030. It is predicted that by 2030, China will produce 685 million tons of grain, import 50 million tons of grain, and have a self-sufficiency rate of about 93%. In addition, grain production can be divided into economic and technical production and meteorological production by calculating the climatic productivity, and the regression prediction model can be established by using the fertilizer application, percentage of planting area and monthly average temperature.
Located in the upper reaches of the Yangtze River, Chongqing is rich in biological resources and water resources, and has a developed agricultural industry, which has made a great contribution to China's grain production. In 2017, Chongqing accounted for only 3.02% of the country's arable land and 6.5% of the country's total grain production, making it the seventh largest grain-producing province and the highest rice production in China. The grain production of Chongqing not only meets the residents' requirements for better livelihood and higher income and development, but also makes an outstanding contribution to the national grain development, making Chongqing take a pivotal position in terms of the grain production in the whole country. However, in recent years, Chongqing has experienced prominent contradictions in agricultural structure, sloppy business models, serious shrinkage of arable land, and low motivation of farmers to grow grain, resulting in a declining trend of grain production in the past 2 years. It is urgent to analyze and study the grain production in Chongqing. Therefore, it is of great theoretical and practical significance to analyze the influencing factors of grain production in Chongqing, predict the future trend of grain output, and discuss the effective countermeasures to coordinate the contradiction between man and land. Through the analysis and research on the development pattern and prediction of grain yield in Chongqing, the forward-looking evaluation can be conducted on the evolution of grain production and development trend in Chongqing, and possible unreasonable phenomena and problems in the process of grain production can be detected in advance, to prevent and timely measures to solve these problems in advance, making the food production satisfy the market economy, and improving the efficiency of the government macroeconomy.
A prediction model was (Yafei et al., 2019) proposed based on principal component analysis (PCA) and particle swarm optimization (PSO) neural network. Firstly, the correlation coefficient between each influencing factor and grain yield is calculated, the principal component analysis method is used to reduce the dimension of the influencing factor, the reduced dimension factor is used as the input of the neural network, then the BP neural network is used to establish the grain yield prediction model. The PSO algorithm is adopted to optimize the weights and thresholds of the BP neural network, and finally the trained BP neural network is used to predict the grain yield value. Also, hydraulic processes in roots and the rhizosphere pertinent to increasing yield of water-limited grain crops have been proposed by some scholars (Ahmed-mutez et al., 2018): a critical review. According to a first-order approximation, the yield of water-limited food crops depends on (1) the amount of water available to the crops, and (2) the water distribution of the crops during the growing season. The water distribution of the crops during the growing season determines the harvest index of crops, that is, the proportion of aboveground biomass of crops that are converted into grains. A preferred condition is that about 30% of the seasonal available water supply is used during flowering and grain filling. This paper has analyzed the role of roots in the amount and time of extracting water from the soil, which may lead to maximum grain yield, and the mechanisms behind. These features can be categorized into architectural and anatomical features; the biophysics of water movement from soil through roots to leaves, particularly the nature and processes at the interface between roots and soil and the role of mucilage therein; and the physiological role of the root system in influencing crop canopy growth and transpiration processes that can optimize seasonal patterns of water use.
In order to predict the grain yield of Chongqing effectively, this study is based on the theory of support vector machine. As grain output is susceptible to factors related to production inputs, the level of cultivation technology, climate, environment and other natural conditions, national policy adjustment and other factors. Therefore, it is necessary to regard the formation process of food production as a gray dynamic system with both known information and unknown information, to avoid the mutual fluctuation of many external factors behind food production. At the same time, as a machine learning algorithm, support vector machine (SVM) is based on the VC dimension theory of statistical learning theory and the principle of structural risk minimization. It can minimize the actual predicted risk by minimizing the structural risk by reducing the structural risk to the minimum (Ye et al., 2020). Therefore, the algorithm can achieve a better learning result when the sample size is limited. In the process of grain production forecasting, support vector machine forecasting model is established by processing and analyzing the original data and understanding the development pattern of grain extraction and quantitative forecasting of the future condition of grain, the uniqueness and high accuracy of the required data. One of the most important functions for the model is to optimize the performance. Therefore, support vector function can make up for the shortage of econometric modeling. In this study, grain yield is taken as the behavioral characteristic quantity of support vector. An analysis and prediction model of grain yield is established using vector machine theory, and the model is optimized for prediction. On this basis, the internal change rule of grain system is studied, to make a more scientific and accurate prediction of grain production in Chongqing. A new adaptive learning support degree regression algorithm is designed to improve the prediction accuracy of grain yield. Instead of the error back propagation algorithm of BP neural network, the support vector machine algorithm is used to change the particle weights and thresholds in the BP neural network. The weights of the neural network can be obtained by determining particle parameters, and the fitness of particles can be determined through the training of the neural network. By adopting this method, BP neural network can no longer fall into the local optimum, thus effectively improving the prediction effect of grain yield.
2. Prediction method design
2.1. Design of support vector regression algorithm
In order to improve the prediction accuracy of grain yield, this study designs a new adaptive learning support quantity regression algorithm. The structure of support vector regression is shown in Figure 1.
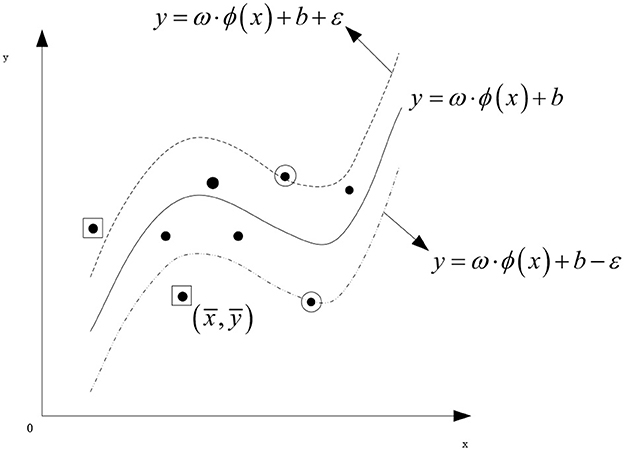
Figure 1. Structure diagram of support vector regression.
Generally speaking, in the application of support vector regression, it is necessary to define a class of undefined target variables before the learning model is established. However, such variables can hardly be defined accurately. In fact, this type of target variable is a comparative value and only requires a relative value used for comparison rather than a very precise definition (Zhang and Xu, 2019). However, the target variable is affected by many factors. Suppose these factors are defined as n-dimensional vector X(x1, x2, ⋯ , xn), X∈Rn is mapped to Y∈R, and the target variable Y can be defined as X↦Y(Rn↦R).
Then, the support vector regression algorithm established and applied to grain yield prediction can be expressed as the following steps:
Step 1: According to the index observation sample, construct a sample set D = {x1, x2, ⋯ , xi}∈X that defines the target variable.
Step 2: The target variable yi∈Y = R is calculated based on the algorithm of the target variable.
Step 3: and yi∈Y = R are used to form the matrix A = (A1⋯Ai⋯), wherein,
Step 4: Calculate Ā, wherein, ,āi∈Ā.
Step 5: Calculate covA.
Step 6: Calculate the partial correlation coefficient.
Step 7: In D, k rows corresponding to the largest k partial correlation coefficients are retained to convert D into D′∈Rk.
Step 8: The target variable is recalculated using the target variable definition algorithm.
Step 9: On the basis of D′, the attributes that do not meet the criteria for the definition of the target variable but are very important for it are added to each sample (Yaodong, 2019), the non-useful attribute is deleted from X, then , thus constituting the training sample set T = {(x1, y1), ⋯ , (xi, yi)}∈(X, Y), where,, yi∈Y = R, i = 1, 2, ⋯ , n.
Step 10: Train the support vector regression machine about X and Y with Y as the reference variable.
Step 11: The definition of the support vector regression machine of the target variable is obtained:.
It is difficult to obtain the usage in this process, but the impact on the properties of the target variable to meet the strict increase or decrease in the loosely defined target variable, while using accessible impact factors, as well as properties with high practical value, has been defined roughly as the benchmark for the target variable, support vector regression machine, the implementation of the target variable non-linear definition. As a result, the definition of the target variable and the efficiency of the application are greatly improved (Bibb et al., 2018).
Based on the algorithm of support vector regression for grain yield prediction, the SVM is used to replace the error back propagation of BP neural network and change the particle weight and threshold, to realize the grain yield prediction of Chongqing.
2.2. Prediction of grain output in Chongqing
By determining the particle parameters, the weights of the neural network can be obtained and the fitness of the particles can be determined through the training of the neural network. Therefore, BP neural network can hardly fall into the local optimum, and thus effectively the prediction effect of grain yield is improved.
The prediction process of grain yield in Chongqing is as follows:
Step 1: Pre-processing of historical data of grain yield in Chongqing.
The historical data of grain yield are analyzed by using support vector machine. The influencing factors are determined and used as initial parameters to normalize the historical data of grain yield (Weichert et al., 2017).
Step 2: Initialize the neural network and construct the neural network.
Support vector machine is one of the basic structures of neural network. Therefore, the number of nodes in the input and output layers of the neural network can be determined based on the input and output data of the neural network. In this process, there is no value algorithm that can be used directly in the selection of the number of nodes in the hidden layer, so an empirical method is adopted instead to select the number of nodes in the hidden layer, i.e., the number of nodes in the hidden layer that works best after several experiments (Tadesse et al., 2018). In addition, attention should be paid to avoid the adverse effects of the initial settings on the convergence speed and accuracy of the network.
Step 3: Set the initial parameters, including the position and speed of particles, learning factors and other parameters required by the algorithm.
Step 4: The support vector regression algorithm designed in the previous section is used to determine the optimal particle of grain yield population N in Chongqing. The particle positions and velocities are updated by successive iterations. In the whole process of iterative updating, the optimal position searched by the qth particle is the individual extreme value and the global extreme value.
Step 5: Calculate the fitness value.
Fitness can be used to determine whether the current particle position is optimal position. In the process of successive iteration and update, each particle moves through the solution space at a set speed, and keeps converging to the individual best position pbest and the global best position gbest. The fitness function of grain yield prediction is set as:
Where, fitness represents the fitness function of grain yield prediction, b is usually a constant, ei represents the expected output value of the neural network, and ti means the actual output value of the neural network.
The fitness value adopted in this study is a linear function of the mean square error and reciprocal between the actual value and the predicted value. The smaller the error is, the larger the corresponding fitness value is and the better its fitness is (Sundaram et al., 2018).
Step 6: Update individual extreme values and group global extreme values.
The fitness value of the calculated current fitness value of each particle is compared with the fitness value of the individual extremum. In comparison, if the current particle has a better fitness value than the individual, the current particle's position is assigned to the individual's extreme value. Then, the fitness value of the individual extreme value of each particle is compared with the fitness value of the global extreme value of the population, and the individual extreme of the particle with the better fitness value is selected and the value is assigned to the global extreme of the population.
Step 7: Determine whether the termination condition is satisfied, that is, whether the expected convergence accuracy is achieved. In this process, the global optimal solution obtained above should be applied to search the weight and threshold of BP neural network. If the termination condition is not met, repeat Step 4 to 6 until the termination condition is met.
Step 8: Achieve grain yield prediction.
The BP neural network with the optimal weight and threshold is used to predict the grain yield.
The grain yield prediction process is shown in Figure 2.
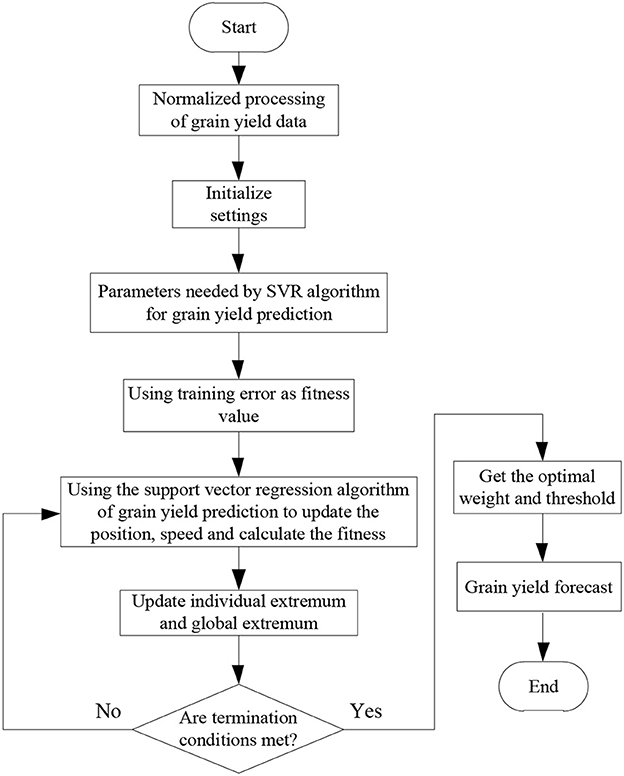
Figure 2. Schematic diagram of predicting the grain yield.
In conclusion, by introducing the structure of support vector regression, the implementation of support vector regression algorithm for grain yield prediction was designed, and the algorithm design of support vector regression was completed. On this basis, the effective prediction of grain yield in Chongqing is realized by searching the optimal particle weight and threshold of neural network.
3. Empirical analysis of grain yield prediction in Chongqing
In order to verify the effectiveness of the prediction method of grain yield in Chongqing based on support vector machine designed in this study, and to carry out effective prediction of grain yield in Chongqing, this study designs the following experimental verification and empirical analysis.
3.1. Prediction and testing of total grain output
The total grain yield in Chongqing has shown a linear trend in the past 5 years. In order to ensure the stability and similarity of the original data, the support vector machine model only needs “poor data.” The historical data of grain output in Chongqing are shown in Table 1 (Yao et al., 2020).
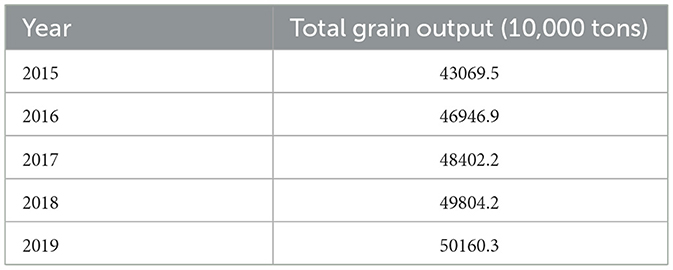
Table 1. Statistics on total grain yield of Chongqing from 2015 to 2019.
When the total grain production development coefficient of Chongqing a = 0.022509922 ≤ 0.3, the total grain production model of Chongqing can predict medium—and long-term trend.
According to the above historical data of grain yield in Chongqing, the corresponding time function can be obtained as follows:
At k = 0, 1, 2, ⋯ , n, the predicted value of the original sequence can be obtained based on . As shown in Table 2, the prediction results of grain output in Chongqing in recent 5 years are obtained based on the prediction method designed in this study (Yao et al., 2020).
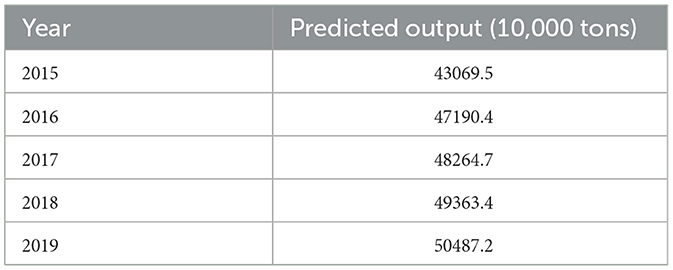
Table 2. Prediction of total grain output of Chongqing municipality.
By comparing the results in Tables 1, 2, the prediction results of Chongqing grain yield prediction method based on support vector machine designed in this study are close to the actual results, indicating the effectiveness of the method.
According to the results in Table 2, the total grain output of Chongqing shows a trend of continuous growth. From 2015 to 2019, the grain production in Chongqing exceeds 430 million tons, 460 million tons, 480,000 tons, 49,000 tons and 50,000 tons, respectively. There is no doubt that the formation of such a sustained growth trend is closely related to the preferential agricultural policies of the Central Committee of the Communist Party of China and the State Council, thus enhancing the enthusiasm of farmers to grow grain. In addition, with the continuous scientific and technological development, the grain yield per unit area has been constantly improved, to expand the grain yield on the limited farmland.
On this basis, a support vector machine-based grain yield forecasting method is applied to examine the residuals of grain yield forecasts for 2015–2019 in Chongqing. The results are shown in Table 3.
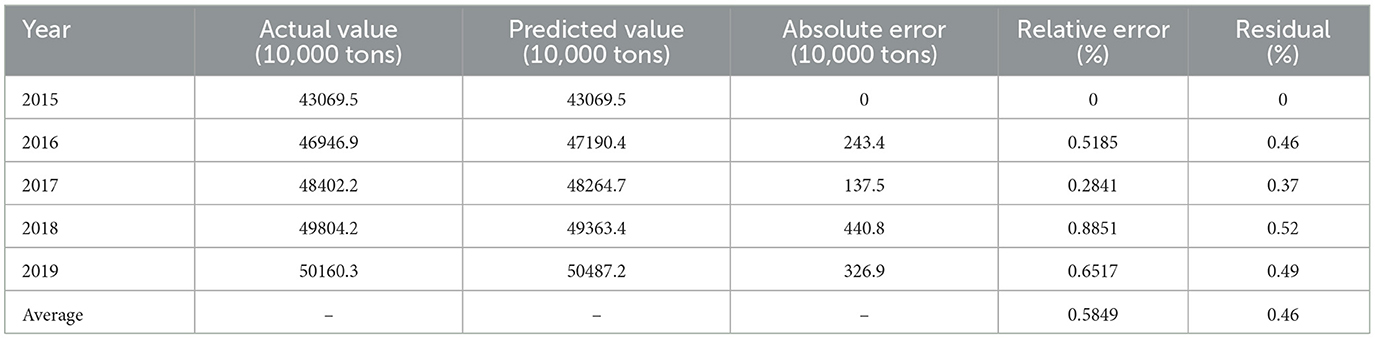
Table 3. Residual test of forecast total grain output in Chongqing.
According to the data shown in Table 3, the relative error of the prediction results of Chongqing grain yield prediction method based on support vector machine is < 1%, and the average residual is 0.46%. According to the residual test criteria, the model passed the residual test. Therefore, the validity of grain yield prediction based on support vector machine in Chongqing can be further illustrated.
3.2. Yield prediction and result analysis of main grain varieties
On the basis of the preliminary verification of the effectiveness of the support vector machine based grain yield prediction method in Chongqing, the method is applied to predict the yield of rice, wheat and corn in Chongqing and is compared with the historical data so as to verify the effectiveness of the method in predicting the yield of different crops.
3.2.1. Prediction and testing of rice yield
Combined with Chongqing rice yield from 2015 to 2019, the residual test results of predicted rice yield in Chongqing are shown in Table 4 (Yao et al., 2020).
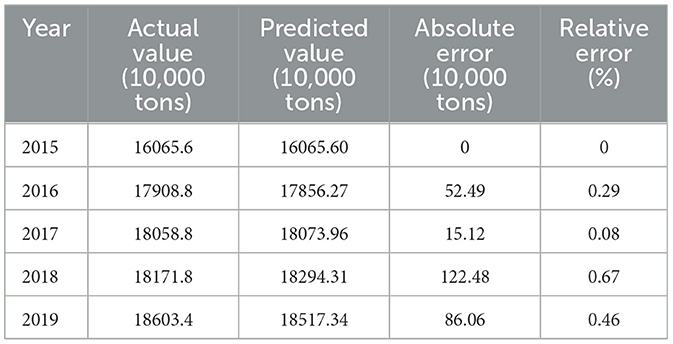
Table 4. Residual test of predicted rice yield in Chongqing from 2015 to 2019.
Based on Table 4, the predicted value of total rice output in Chongqing will increase steadily year by year. The projected output from 2015 to 2019 is 16.0656 m tons, 17.85627 m tons, 18.0739 m tons, 18.29431 m tons and 18.51734 m tons, respectively. It will reach the highest level ever by 2019. The relative errors of the rice yield model in Chongqing are all < 0.7%, so the model can pass the residual test. As shown in Figure 3, the fitting of the actual value and the predicted value of the predicted rice yield in Chongqing is described. The fitting degree of the actual value and the predicted value of the rice yield prediction in Chongqing is very high, and it can fully demonstrate that the prediction method of Chongqing grain yield based on support vector machine can effectively achieve accurate prediction of rice production in Chongqing.
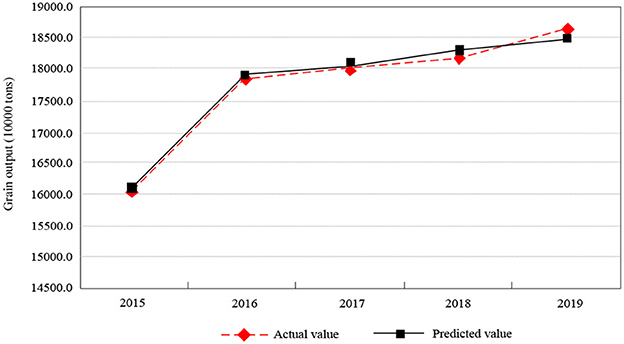
Figure 3. The fitting results of actual value and predicted value of rice yield forecast in Chongqing city.
3.2.2. Wheat yield prediction and testing
Combined with Chongqing wheat yield from 2015 to 2019, the residual test results of wheat yield prediction in Chongqing are shown in Table 5.
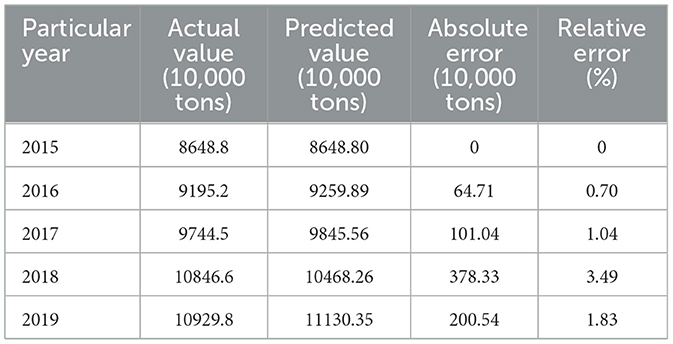
Table 5. Residual test of wheat yield prediction in Chongqing from 2015 to 2019.
As it is illustrated in Table 5, the projected output from 2015 to 2019 is 86.488 million tons, 92.5989 million tons, 98.4556 million tons, 104.6826 million tons and 111.3035 million tons, respectively. The year 2019 witnessed the historical peak. The relative errors of the rice yield model in Chongqing are all < 3.5%, so the model can pass the residual test. As shown in Figure 4, the fitting of actual and predicted wheat yield forecasts in Chongqing is described. The actual value and the predicted value of the wheat yield forecast in Chongqing have a high degree of fit, which can fully demonstrate that the prediction method of Chongqing grain yield based on support vector machine can effectively realize the accurate prediction of the rice yield in Chongqing.
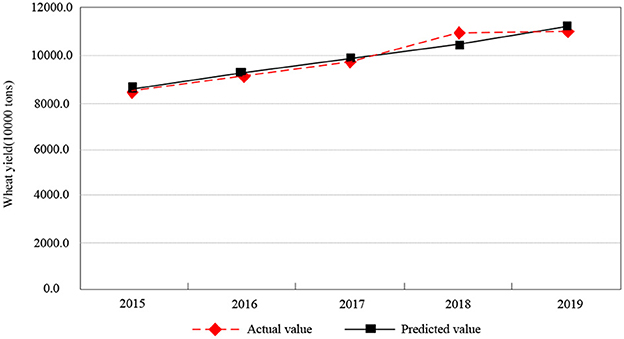
Figure 4. Fitting results of actual value and predicted value of wheat yield prediction in Chongqing city.
3.2.3. Corn yield prediction and testing
Combined with Chongqing maize yield from 2015 to 2019, the residual test results of corn yield prediction in Chongqing are shown in Table 6.
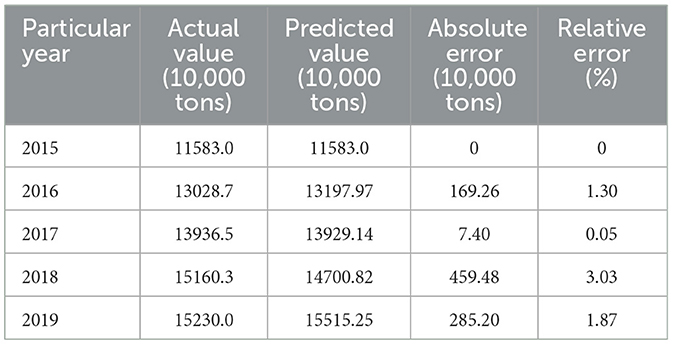
Table 6. Residual test of corn yield prediction in Chongqing from 2015 to 2019.
Based on Table 6, the projected output from 2015 to 2019 is 115.833 million tons, 131.997 million tons, 139.2914 million tons, 147.082 million tons and 155.1525 million tons, and will reach the highest level in history by 2019. The relative errors of the maize yield model in Chongqing are all < 3.1%, and the model can pass the residual test. As shown in Figure 5, the fitting of the actual value and the predicted value of corn yield prediction in Chongqing is described. The actual value and the predicted value of the corn yield in Chongqing are highly fit with each other and they can fully demonstrate that the method of grain yield prediction based on support vector machine can effectively realize the accurate prediction of corn yield in Chongqing.
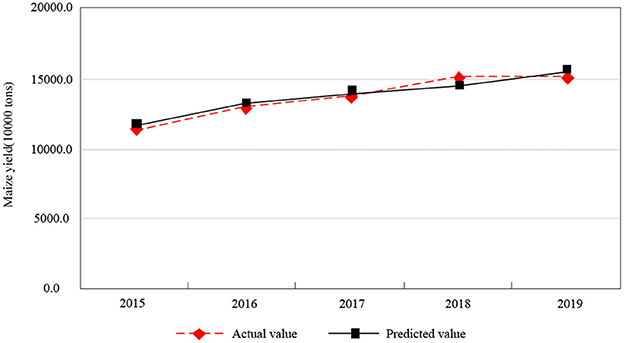
Figure 5. Fitting results of actual value and predicted value of corn yield forecast in Chongqing city.
Based on the above data, the prediction result of Chongqing grain yield prediction method based on support vector machine is highly fitting with the actual grain yield, so this method can be used for medium- and long-term prediction.
From the prediction results of support vector machine, the total grain production and the output of major grain varieties in Chongqing tend to grow continuously year by year. This has laid a solid foundation for ensuring food security in Chongqing in the coming years. However, as there are many factors behind the grain output, the grain production in Chongqing still faces some new challenges.
Adaptive neuro-fuzzy inference system and weighted k-nearest neighbor algorithm are compared with the proposed methods. The comparison results of different methods for corn yield prediction in Chongqing are shown in Figure 6.
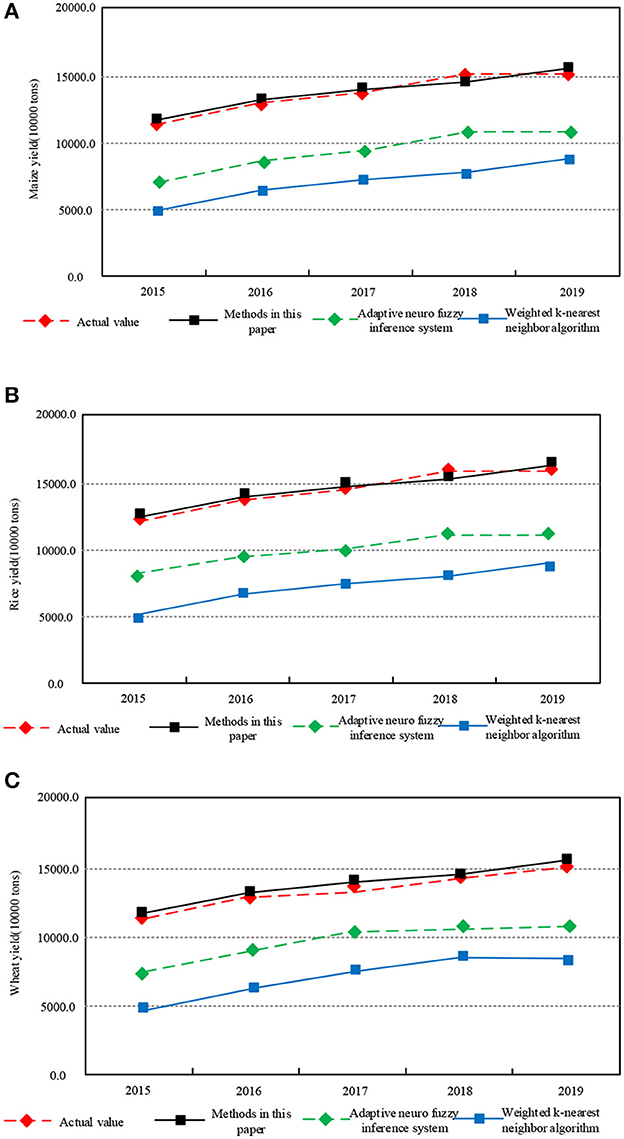
Figure 6. Comparison of yield prediction results of maize, rice and wheat with different methods in Chongqing. (A) Corn yield. (B) Rice yield. (C) Wheat yield.
Based on Figure 6, the prediction results of Chongqing grain yield prediction method based on support vector machine are highly fit with the actual output and it can be used for medium- and long-term prediction. However, the prediction results of Adaptive neuro-fuzzy inference system and weighted k-nearest neighbor algorithm have a low fit with the actual output. The results show that the grain yield forecasting method based on support vector machine can effectively realize the accurate forecast of maize, rice and wheat yield in Chongqing.
4. Conclusions
In this study, a new method for predicting agricultural grain production in Chongqing was designed by using support vector machine, and good results were obtained.
Support vector machine (SVM) has good performance in grain yield prediction, but there are some difficulties in the application of SVM. Therefore, in the future, the prediction method will be further optimized to provide theoretical guidance for the selection of kernel functions and parameters in the field of support vector machine (SVM) algorithm, and also to resolve the contradiction between large-scale data sets and training set size and training speed to provide more advanced grain production prediction and effective technical support.
Data availability statement
The original contributions presented in the study are included in the article/supplementary material, further inquiries can be directed to the corresponding author.
Author contributions
JW has made a significant contribution to the revised draft, modified the article, added relevant literature, and made polish the article. CL contributed to the motivation, the interpretation of the methods, the data analysis and results, provided the draft versions, revised versions, and references. GT provided the data and results, the revised versions, and references. YT provided the related concepts and minor recommendations and extracted the conclusion and discussion. All authors contributed to the article and approved the submitted version.
Funding
This study was supported by the Humanities and Social Science Research Project of the Ministry of Education: Research on the Impact Mechanism and Countermeasures of Global Value Chain Embedding on the Complexity of China's Service Industry Export Technology (17YJC790147), Research Project of Zhejiang Federation of Social Sciences: Research on the impact mechanism and countermeasures of OFDI on industrial green innovation efficiency in Zhejiang Province from the perspective of dual gradient (2023N074), National Natural Science Foundation of China (42261036), and the special project of the innovative team of the new provincial think tank jointly cultivated by Ningbo Haisi Academy “Research on the Countermeasures to Promote the Development of Digital Trade between Zhejiang and Central and Eastern European Countries” (HSY2022ZK03).
Conflict of interest
The authors declare that the research was conducted in the absence of any commercial or financial relationships that could be construed as a potential conflict of interest.
Publisher's note
All claims expressed in this article are solely those of the authors and do not necessarily represent those of their affiliated organizations, or those of the publisher, the editors and the reviewers. Any product that may be evaluated in this article, or claim that may be made by its manufacturer, is not guaranteed or endorsed by the publisher.
References
Ahmed-mutez, A., Passioura, J., and Carminati, A. (2018). Hydraulic processes in roots and the rhizosphere pertinent to increasing yield of water-limited grain crops: a critical review. J. Exp. Bot. 69, 3255–3265. doi: 10.1093/jxb/ery183
Bibb, J. L., Cook, D., Catchot, A., Musser, F., Stewart, S. D., Leonard, B. R., et al. (2018). Impact of corn earworm (lepidoptera: noctuidae) on field corn (poales: poaceae) yield and grain quality. J. Econ. Entomol. 111, 1249–1255. doi: 10.1093/jee/toy082
Bingjun, L., and Weiming, Y. (2019). The structural equilibrium analysis of grain supply and demand in China based on grey interval prediction and GM (1, N) model. Jiangsu Agric. Sci. 47, 325–329. doi: 10.15889/j.issn.1002-1302.2019.18.068
Chao, F., Peige, C., Yafei, G., and Tiejun, Y. (2018). Prediction of grain yield based on grayscale limit learning machine. Jiangsu Agric. Sci. 46, 212–214. doi: 10.15889/j.issn.1002-1302.2018.05.056
Dai, Z., Zhou, H., Wen, F., and He, S. (2020). Efficient predictability of stock return volatility: the role of stock market implied volatility. North Am. J. Econ. Fin. 52, 101174. doi: 10.1016/j.najef.2020.101174
Fei, F., and Xing, Z. (2019). Prediction of grain yield based on BP neural network optimized by hybrid swarm intelligence algorithm. J. Jiangsu Univ. 40, 209–215. doi: 10.3969/j.issn.1671-7775.2019.02.014
Hayashi, K., Llorca, L., Rustini, S., and Setyanto, P. (2018). Reducing vulnerability of rainfed agriculture through seasonal climate predictions: a case study on the rainfed rice production in Southeast Asia. Agric. Syst. 162, 66–76. doi: 10.1016/j.agsy.2018.01.007
Sundaram, P., Samineni, S., Sajja, S., Singh, S. P., Sharma, R. N., Gaur, P. M., et al. (2018). Genetic studies for seed size and grain yield traits in kabuli chickpea. Euphytica 214, 63–63. doi: 10.1007/s10681-018-2147-x
Tadesse, M., Funga, A., Fikre, A., Degefu, T., Eshete, M., Korbu, L., et al. (2018). Breeding progress for grain yield and yield related characters of kabuli chickpea (Cicer arietinum L.) in ethiopia using regression analysis. J. Agric. Sci. 10, 195–195. doi: 10.5539/jas.v10n2p195
Tian, B., Talukder, S. K., Fu, J., Fritz, A. K., and Trick, H. N. (2018). Expression of a rice soluble starch synthase gene in transgenic wheat improves the grain yield under heat stress conditions. In Vitro Cell. Dev. Biol. Plant 54, 1–12. doi: 10.1007/s11627-018-9893-2
Weichert, H., Högy, P., Mora-Ramirez, I., Fuchs, J., Eggert, K., Koehler, P., et al. (2017). Grain yield and quality responses of wheat expressing a barley sucrose transporter to combined climate change factors. J. Exp. Bot. 68, 5511–5525. doi: 10.1093/jxb/erx366
Yafei, G., Chao, F., and Hongtao, Y. (2019). Prediction of grain yield based on principal component analysis and particle swarm optimization neural network. Jiangsu Agric. Sci. 47, 241–245. doi: 10.15889/j.issn.1002-1302.2019.19.056
Yao, X., Menglu, D., Wujun, Z., Xiujian, D., Rongli, T., Yongqun, T., et al. (2020). Analysis of economic benefits and proposals for development of rice production in Chongqing. Hybrid Rice. 35, 1–8. doi: 10.16267/j.cnki.1005-3956.20200218.036
Yaodong, W. (2019). Improved extreme learning machine model for grop yield prediction. Computer and Digital Engineering, 47, 1283–1286+1302.
Keywords: support vector machine, food production, to predict, neural network, weights of the particle
Citation: Wang J, Tian G, Tao Y and Lu C (2023) Prediction of Chongqing's grain output based on support vector machine. Front. Sustain. Food Syst. 7:1015016. doi: 10.3389/fsufs.2023.1015016
Received: 09 August 2022; Accepted: 27 February 2023;
Published: 16 March 2023.
Edited by:
Vinod Kumar Singh, Indian Agricultural Statistics Research Institute (ICAR), IndiaReviewed by:
Sapna Langyan, National Bureau of Plant Genetic Resources (ICAR), IndiaKrishna Kumar Chaturvedi, Indian Agricultural Statistics Research Institute (ICAR), India
Copyright © 2023 Wang, Tian, Tao and Lu. This is an open-access article distributed under the terms of the Creative Commons Attribution License (CC BY). The use, distribution or reproduction in other forums is permitted, provided the original author(s) and the copyright owner(s) are credited and that the original publication in this journal is cited, in accordance with accepted academic practice. No use, distribution or reproduction is permitted which does not comply with these terms.
*Correspondence: Guixian Tian, 16010039@pxu.edu.cn