 Yafei Li
 Werner Eugster
 Andreas Riedl1
 Marco M. Lehmann
 Franziska Aemisegger
 Nina Buchmann
- 1Institute of Agricultural Sciences, ETH Zurich, Zurich, Switzerland
- 2Forest Dynamics, Swiss Federal Institute for Forest, Snow and Landscape Research (WSL), Birmensdorf, Switzerland
- 3Institute for Atmospheric and Climate Science, ETH Zurich, Zurich, Switzerland
Increasing frequencies of heatwaves combined with simultaneous drought stress in Europe threaten the ecosystem water and carbon budgets of alpine grasslands. Dew as an additional water source can promote ecosystem carbon assimilation. It is known that grassland ecosystems keep high evapotranspiration as long as soil water is available. However, it is rarely being investigated whether dew can mitigate the impact of such extreme climatic events on grassland ecosystem carbon and water exchange. Here we use stable isotopes in meteoric waters and leaf sugars, eddy covariance fluxes for H2O vapor and CO2, in combination with meteorological and plant physiological measurements, to investigate the combined effect of dew and heat-drought stress on plant water status and net ecosystem production (NEP) in an alpine grassland (2000 m elevation) during the June 2019 European heatwave. Before the heatwave, enhanced NEP in the early morning hours can be attributed to leaf wetting by dew. However, dew benefits on NEP were cancelled out by the heatwave, due to the minor contribution of dew in leaf water. Heat-induced reduction in NEP was intensified by the combined effect of drought stress. The recovery of NEP after the peak of the heatwave could be linked to the refilling of plant tissues during nighttime. Among-genera differences of plant water status affected by dew and heat-drought stress can be attributed to differences in their foliar dew water uptake, and their reliance on soil moisture or the impact of the atmospheric evaporative demand. Our results indicate that dew influence on alpine grassland ecosystems varies according to the environmental stress and plant physiology.
1 Introduction
A record-breaking heatwave struck Europe in June 2019 (Mitchell et al., 2019; WMO, 2019), one in a series of severe heatwaves and droughts since summer 2003 (Ciais et al., 2005), 2010 (Barriopedro et al., 2011), 2016 (Zschenderlein et al., 2018), and 2018 (Gharun et al., 2020). Drought often is associated with a concurrent heatwave that affects terrestrial ecosystems (Overpeck, 2013), creating a so-called compound extreme event or period (Zscheischler and Fischer, 2020; Zscheischler et al., 2020). Compared to forests, grasslands are less vulnerable to drought stress, because of their relatively stable water use efficiency (i.e., the ratio of gross primary productivity per unit ecosystem evapotranspiration; Wolf et al., 2013) during a drought period. However intense and prolonged droughts and heatwaves do negatively affect grasslands (e.g., Gharun et al., 2020). A heatwave increases evapotranspiration of grasslands, thereby relieving the vegetation from heat stress, but at the expense of available water supply, which becomes scarcer the longer the heatwave persists (Teuling et al., 2010). Cremonese et al. (2017) reported that the combined drought and heat stress caused a reduction of canopy greenness in a mountain grassland. Also, De Boeck et al. (2016) reported that a heatwave combined with drought stress caused a reduction in above-ground biomass of alpine grassland plants. Li et al. (2020) found that gross primary production (GPP) in a semi-arid grassland was reduced more by drought than by a heatwave. However, Gharun et al. (2020) showed very different responses to the 2018 summer drought (as compared to the previous two years) among temperate grasslands at different elevations, with annual GPP decreasing at lower elevations but increasing at the alpine elevation due to abundant soil water after snowmelt. Thus, our understanding of the response of grasslands to a compound extreme drought and heatwave is controversial, particularly for alpine grasslands.
Dew was widely observed across arid (Uclés et al., 2013), temperate (Jacobs et al., 2006) and tropical (Clus et al., 2008) ecosystems, and can contribute up to 0.7–0.8 mm of water per day (Beysens, 2018). Dew amounts were quantified by lysimeters (Riedl et al., 2022), eddy-covariance (Jacobs et al., 2006), and isotopic (Kim and Lee, 2011) approaches. Nocturnal dew formation and its evaporation in the early morning hours is expected to alleviate drought and heat stress imposed by a compound extreme event due to the following reasons: (1) Dew formation is driven by radiative cooling of plant canopies with stronger long-wave outgoing radiation than that of atmospheric air on clear and calm nights (Oke, 1970), hence relieving canopy heat stress. (2) High humidity conditions under dew formation and dew water films covering foliage reduce plant transpiration (Gerlein-Safdi et al., 2018). (3) Foliar uptake of dew droplets or atmospheric water vapor alleviates plant water stress (Boucher et al., 1995; Dawson and Goldsmith, 2018). (4) Leaf gas exchange during the morning hours — when dew evaporates — might be highly relevant to alleviate plant stress, since transpiration and photosynthesis during most of the day are strongly impaired during a compound heat-drought event (Gharun et al., 2020). Oliveira et al. (2021) pointed out that evaporation of dew induced CO2 loss of a maritime pine forest during the rain-free period after wildfire. On the contrary, Simonin et al. (2009) reported that carbon gain was improved by fog which alleviated leaf water deficit, and addressed that the effect of dew/fog on net ecosystem exchange can vary by the duration of canopy wetting and the wettability of the leaf surface. However, it remains to be shown whether dew alleviates negative effects of a combined heat-drought on plant water status and ecosystem carbon exchange of grasslands, and which of the above mechanisms might dominate such a response.
Leaf water isotope signatures (δ18O and δ2H) are useful to assess this question because they are natural tracers that can be used to assess plant physiological responses to environmental conditions (Bachmann et al., 2015; Prechsl et al., 2015). Evapotranspiration causes 18O enrichment in leaf water compared to the source water (Dongmann et al., 1974; Farquhar and Lloyd, 1993). The magnitude of leaf water 18O enrichment is strongly affected by the isotope signal of water vapor (Cernusak et al., 2002) and dew/fog (Kim and Lee, 2011; Goldsmith et al., 2017; Gerlein-Safdi et al., 2018), but also affected by foliar transpiration rates (Gessler et al., 2013). Typically, the leaf water 18O signal is transferred onto leaf sugars via photosynthetic processes during daytime (Brandes et al., 2006; Gessler et al., 2013), and via the non-photosynthetic oxygen isotope exchange between leaf water and carbonyl groups of sugars (Wang et al., 2021). Leaf sugars are typically more enriched in 18O compared to the leaf water due to the isotopic fractionation occurring during carbonyl hydration (Yakir and Deniro, 1990). Chamber experiments also suggested the transfer of the isotope signal of dew/fog on leaf water isotope signal during light and dark conditions (Kim and Lee, 2011; Gerlein-Safdi et al., 2018; Lehmann et al., 2020), and on leaf sugars during daytime conditions (Lehmann et al., 2020). However, it is not clear how large the photosynthetic and non-photosynthetic isotope imprints of leaf water on sugars are during nighttime as well as under low light and temperature conditions in the field.
Therefore, the main goals of this study focus on these three aims:
1) Quantify the combined effects of heat-drought stress and dew on net ecosystem production (NEP) by comparing the NEP before and during the heatwave, and analyzing leaf water-sugar isotope exchange in a chamber tracer experiment.
2) Quantify the combined effect of heat-drought stress and dew on plant water status by physiological and water isotope measurements.
3) Identify controls of atmospheric and soil conditions on plant water via analyzing the correlations of environmental variables with plant physiological and isotopic indicators.
We addressed these three aims using field data collected at an alpine grassland before and during the June 2019 heatwave, when a combined daytime heat-drought stress for the vegetation occurred during the day and dew formed during the night. H2O vapor and net ecosystem CO2 exchange were measured with the eddy-covariance (EC) technique to assess the effects of these environmental conditions on the vegetation at the ecosystem scale. Physiological and water isotope measurements were employed to analyze the response of vegetation to these environmental conditions at plant scales.
2 Materials and methods
2.1 Study site
The Alp Weissenstein research site (CH-AWS, at 2000 m.a.s.l.) is part of a managed (grazed) alpine grassland ranging from 1900 to 2500 m.a.s.l. The vegetation composition was classified as Deschampsio cespitosae–Poetum alpinae community with red fescue (Festuca rubra), Alpine cat’s tail (Phleum rhaeticum), white clover (Trifolium repens) and dandelion (Taraxacum officinale) as dominant species (Keller, 2006), complemented by alpine meadow-grass (Poa alpina) and lady’s mantle (Alchemilla vulgaris). The soil types are slightly humous to humous sandy loam (Hiller et al., 2008), hence the permanent wilting point is estimated at around 0.1 m3 m-3. The mean annual air temperature and precipitation were 1.9 °C (2015–2020; measured all year round at the site between 2015 and 2020; before 2015, data were only collected between May and October at the site) and 1213 mm (2013–2020; measured all year round between 2013 and 2020; before 2012, only the liquid precipitation was measured at the site), respectively. During the main growing season (May to September), monthly mean air temperatures were between 5.0 °C and 10.8 °C (2006–2018) with July as the hottest month (Figure 1A), while average monthly precipitation ranged from 87 to 128 mm (Figure 1B). During the growing season in 2019, the monthly temperature ranged from 0.8 °C to 11.7 °C with June as the hottest month (Figure 1A), whilst the monthly precipitation ranged from 61 mm to 173 mm (Figure 1B).
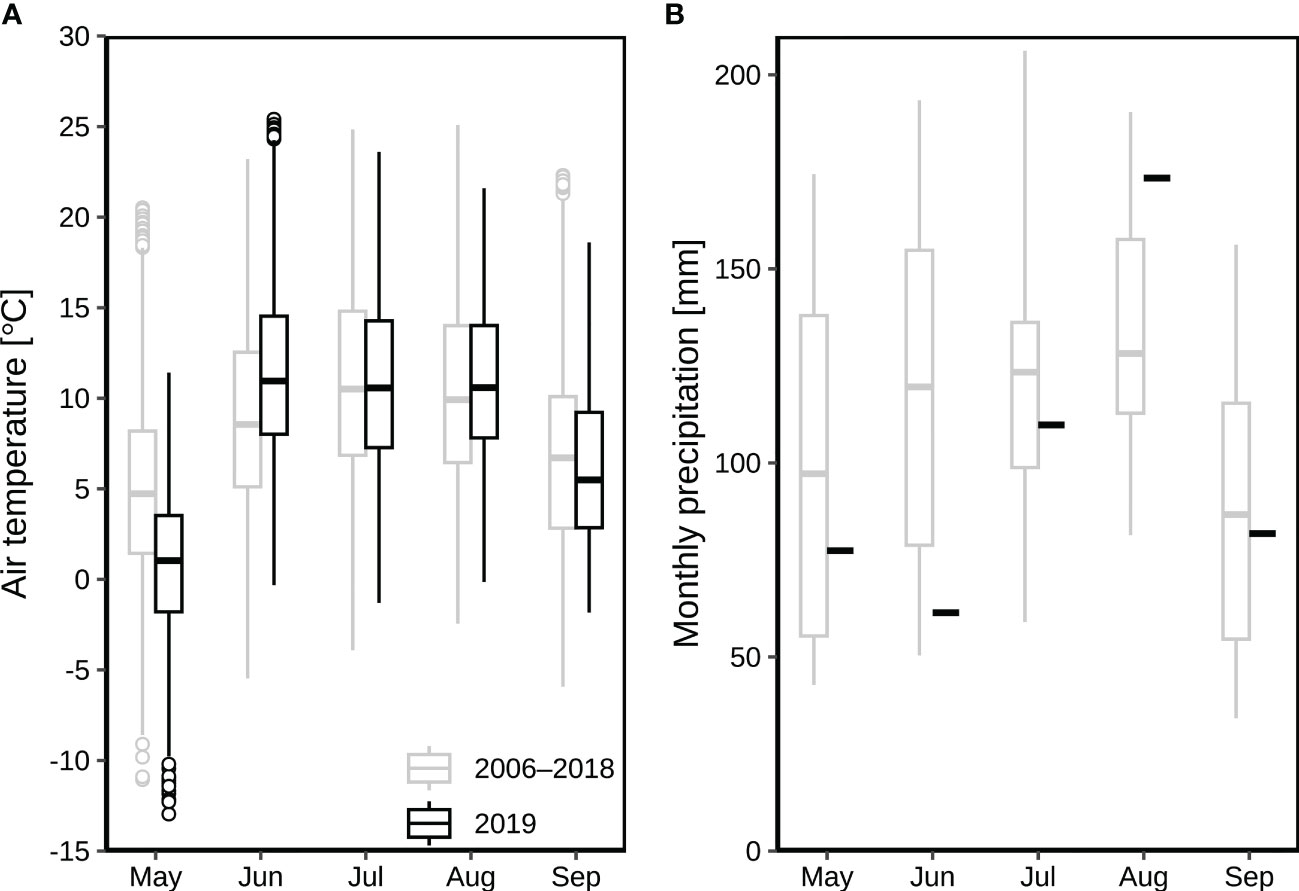
Figure 1 Air temperature and precipitation at the alpine grassland site CH-AWS in 2019 as compared to the period 2006–2018 (all data collected at the site): (A) average monthly air temperatures from May to September; (B) monthly precipitation from May to September. The boxplots show the medians, 25, and 75 quantile values (the inter-quartile range, IQR), with whiskers showing the data range up to 1.5 times the IQR. Values outside that range are shown with symbols.
2.2 Eddy covariance and meteorological measurements
EC measurements for H2O vapor and net ecosystem CO2 exchange have been carried out during the growing season since 2006 (tower coordinates: 46°34’59.5” N, 9°47’25.5” E at 1978 m.a.s.l.). In mid-November 2014, the site was equipped with mains power for year-round operation. The EC instruments at CH-AWS in 2019 consisted of a three-dimensional sonic anemometer (model HS-50, Gill Instruments, Solent, UK) and an enclosed-path infrared gas analyzer (IRGA; Li-7200, Li-Cor, Lincoln, NB, USA), installed at 1.4 m agl (above ground level). EC measurements were recorded at 20 Hz and processed to 30 min averages using the EddyPro software Version 7.0.6 (LI-COR, 2019) following established community guidelines (Aubinet et al., 2012) for H2O (FH2O in mmol m-2 s-1) and CO2 fluxes (FCO2 in μmol m-2 s-1; net ecosystem exchange NEE). The micro-meteorological sign convention was used, with negative values denoting a downward flux, while positive values stand for upward fluxes. See details of footprint analysis of eddy-covariance measurements in Zeeman et al. (2010). Vapor pressure deficit (VPD) was quantified for 30-min intervals from ancillary air temperature and relative humidity measurements at 1.4 m agl (HygroClip HC2, Rotronic, Bassersdorf, Switzerland). Photosynthetic photon flux density (PPFD in μmol m-2 s-1) was measured at 1.3 m agl every 10 s (PARlite, Kipp & Zonen B.V., Delft, The Netherlands) and then averaged to 30-min intervals. Volumetric soil water content (SWC) was measured by two sensors (EC-5, Decagon Devices, Inc., Pullman, WA, USA) at 5 cm depth. NEP was calculated with the opposite sign of NEE (NEP = –NEE).
Diurnal NEP (g C m-2) was calculated from the CO2 flux ():
where Mc is the molar mas of carbon (12 g C mol-1), t is measurement intervals (1800 s) of , and a is a unit conversion factor (10-6 mol μmol-1).
For a long-term data series of air temperature at standard 2 m agl, an additional meteorological measurement setup was operating since 2006, installed at about 1180 m distance to the east and at approximately 40 m higher elevation compared to the flux tower (Michna et al., 2013). This additional setup provided air temperature (Ta) at 2 m agl (shaded, sheltered HydroClip S3, Rotronic AG, Basserdorf, Switzerland), and precipitation from an unheated pluviometer (LC, Texas Electronics, Dallas, USA). In November 2012, a precipitation gauge (1518H3, LAMBRECHT meteo GmbH, Göttingen, Germany) with a heatable orifice was installed between these two measurement stations (Michna et al., 2013) and provided annual total precipitation, including snowfall. Leaf wetness data were averaged from the measurements of two leaf wetness sensors (BNS, G. Lufft Mess-und Regeltechnik GmbH, Fellbach, Germany) installed since 2005 at 0.1 m agl close to the grassland canopy, using blotting paper inside a clip holder. The leaf wetness data was recorded by the voltage signal resulting from a fixed current applied from the center to the rim of the blotting paper. When the paper got wet by dew, fog, or rain, the blotting paper became conductive, and an increase in voltage signal was observed. We note that the leaf wetness sensors overestimated the leaf wetting duration (Figure S2), because the blotting paper dries out slower than the vegetation. By comparing the BNS sensor with a more accurate leaf wetness sensor (PHYTOS 31, Meter Group AG, Munich, Germany) at a later time of our observation campaigns (5–6 July 2020), the termination of leaf wetting was defined as the point when leaf wetness by BNS steeply and linearly decreased (Figure S2).
All variables were aggregated to 30 min averages or sums. The time series was recorded in CET (UTC+1 hour).
The evapotranspiration rate (ET in mm h-1) was calculated from the H2O flux () as (Stull, 1988):
where is the molar mass of H2O (18 g mol-1), and b is a unit conversion factor [= (10-3 mol mmol-1) · (10-6 m3 g-1) · (3600 s h-1) · (103 mm m-1) = 0.0036 mol m2 s mm mmol-1 g-1 h-1].
2.3 June 2019 heatwave and drought
According to our measurements at the CH-AWS site during 2006 to 2018, the hottest three months were typically June, July, and August, with average air temperatures (at standard 2 m agl) of 8.9, 10.8 and 10.3 °C (Figure 1A), respectively. As compared to the long-term averages, the respective three months in 2019 were hotter with 11.7, 10.9, 10.8 °C (Figure 1A). The precipitation in June 2019 was 61 mm, which was only 51% of the long-term average of 120 mm in June during 2006–2018 (Figure 1B).
The 2019 heatwave occurred in Switzerland from 25 June to 1 July in 2019 (MeteoSwiss, 2019). No rain was recorded at the site from 23 June to 30 June 2019, but 0.2 mm rain was collected at 16:00 CET on 1 July 2019. Therefore, in this study, we only considered the 8-day rain-free period between 23 and 30 June 2019, with 23–24 June before the heatwave, and 25–30 June during the heatwave. Sunrise was around 04:30, and sunset was around 20:20 during the heatwave.
2.4 Experimental setup during measurement campaigns
To assess the combined effect of a well-developed natural drought during the heatwave in June 2019, we conducted two intensive measurement campaigns as intensive observation periods (IOP) at the end of the heatwave. These campaigns were carried out during two consecutive dew nights on 28–29 (IOP1 from 12:00 to 12:00 the next day) and on 29–30 (IOP2) June 2019.
2.4.1 Destructive sampling for isotope composition of water samples
To measure the isotope composition (δ18O and δ2H) of leaf water, xylem water of root crowns, soil water, and dew droplets on leaf surfaces, destructive sampling was carried out during the IOP within 1 h before sunset (19:30 of IOP1 and IOP2), during the night (00:00 and 03:00 of IOP1 and IOP2), and after sunrise (06:00 of IOP1). Bulk leaf samples were taken in triplicates from randomly selected plants of four genera within an area of 70×20 m2, i.e., Alchemilla with palmately-lobed and hairy leaves, as well as toothed leaf edges; Poa with long and narrow grass leaves; Taraxacum with a rosette of long and wide jagged leaves; and Trifolium with obovate leaves (Figure S1). The average vegetation height was around 20 cm during our field campaigns. Root crown xylem samples were taken in triplicates after removing the attached soil and debris from randomly selected plants for each genus. Dew droplets were absorbed with cotton balls in six replicates from randomly selected plants. Soil cores were taken with a soil auger in triplicates and were then cut into slabs to separate four soil depths of 0–5 cm, 5–10 cm, 10–15 cm, and 15–20 cm. Leaf samples were taken at 19:30, 00:00, 03:00 and 06:00 during IOP1, as well as at 19:30, 00:00 and 03:00 during IOP2. Root crown samples were taken at 19:30, 00:00 and 03:00 during IOP1 and IOP2. Dew droplets were taken at 03:00 during IOP1 (no dew droplets were observed at 00:00), as well as at 00:00 and 03:00 during IOP2. The 0–5 cm soil samples were taken at 19:30, 00:00 and 03:00 during IOP1 and IOP2, while soil samples of 5–10 cm, 10–15 cm and 15–20 cm depth were taken at 19:30 and 03:00 during IOP1 and IOP2.
All samples were immediately transferred into glass tubes (Labco Exetainer® 12 ml Vial, Labco Ltd., Lampeter, UK), sealed with caps and parafilm, and stored in a portable freezing box filled with dry ice blocks. Samples were then taken back to the laboratory and stored at –19 °C. Dew water from cotton balls, and water from all plant and soil samples were extracted using a cryogenic vacuum extraction system (Prechsl et al., 2015). Using the high-temperature carbon reduction method (Werner and Brand, 2001; Gehre et al., 2004), the isotope composition of the respective water samples was determined by an isotope ratio mass spectrometer (IRMS, DeltaplusXP, Finnigan MAT, Bremen, Germany) coupling with a high-temperature conversion elemental analyzer (TC/EA, Finnigan MAT, Bremen, Germany) via a ConFlo III reference unit (Finnigan MAT, Bremen, Germany). The precision of δ18O and δ2H measurements for all the samples was ±0.3‰ and ±0.7‰, respectively. All isotope values of this study are expressed in the delta notation δ=(Rsample/Rstandard–1) in per mil (‰), where Rstandard and Rsample are the molar ratios of either 2H/1H or 18O/16O of the standard (Vienna Standard Mean Ocean Water, V-SMOW) and the sample (IAEA, 2009; Coplen, 2011).
2.4.2 Isotope composition of atmospheric water vapor
The atmospheric water vapor at around 1 m agl was collected during IOP2 from 20:30 to 23:30, and from 00:00 to 03:00. Atmospheric air was pulled through a U-shaped glass tube that was placed in a Dewar filled with a cold slurry of ethanol and dry ice. After 3 h, the trapped water vapor frozen to the inner walls of the U-shaped glass tube was thawed, and the liquid water was filtered (Syringe filter, PTFE-Hydrophobic, 0.45μm) and transferred into glass vials. The samples were measured with the TC/EA-IRMS for their isotope composition (δ18Ovapor and δ2Hvapor) as described above. To compare the isotope composition of atmospheric water vapor with the liquid water pools (i.e., dew droplets, leaf water, xylem water of root crowns, and soil water), the isotope composition of the liquid (δ18Oeq and δ2Heq) in equilibrium with this vapor was calculated under the corresponding air temperature measured at 1.4 m agl following Horita and Wesolowski (1994).
2.4.3 Leaf water potential
To investigate the mechanism of dew influence on ecosystem water and carbon exchanges, leaf water status was measured at the end of the heatwave during our intensive observation campaigns (IOP1 and IOP2). The comparison of LWP before and after 29 June heatwave as well as two dew nights (the 28–29 and 29–30 nights) allows to compare the influence of heatwave and dew on leaf water status.
Leaf water potential (LWP) of the four genera Alchemilla, Poa, Taraxacum, and Trifolium was measured in triplicates with a Scholander pressure chamber (Model 1505D, PMS Instruments Co., Albany, OR, USA) using a grass compression gland for Poa and Taraxacum, and a round compression gland for Alchemilla and Trifolium. The LWP was measured within 1 h before sunset (19:30; before-sunset) and 2 h before sunrise (03:00; predawn) during IOP1 and IOP2.
2.4.4 Complementary in-situ chamber tracer experiment
Complementary to the sampling campaigns under natural conditions, an in-situ chamber tracer experiment was carried out during IOP1 (28–29 June) to investigate whether dew signal was used for carbon assimilation by determining the δ18O and δ2H values of leaf water and sugars. Within around 1 h before sunset, a 50 × 50 cm2 grassland plot was marked for the chamber tracer experiment. We used liquid water depleted in 18O and 2H as tracer (δ18O = –364.7 ± 1.9‰ and δ2H = –775.0 ± 0.3‰) and homogenously sprayed it onto the plot at around 19:30. After spraying, the vegetation was immediately covered with a custom-made canopy chamber (50 × 50 × 50 cm3) wrapped with 0.1 mm thick polyethylene film, with a 76% transmissivity for thermal (longwave) infrared radiation (Horiguchi et al., 1982). With this tracer addition, we simulated dew, which was much more depleted in 18O and 2H than natural dew droplets. We note that we did not isolate the soil during the tracer amending on the grassland plot, hence the tracer could drip into the soil, and the amended tracer on vegetation can also drip to the soil, both of which can occur during natural dew formation processes. The canopy chamber did not fully isolate the grassland from the surrounding; thus, gas emission could still occur from the bottom rim of the chamber. But the chamber sufficiently suppressed the water vapor exchange between the within-chamber air and the open atmosphere. About 2 h before (03:00; predawn) and after sunrise (06:00), bulk leaf samples were taken in triplicates from randomly selected plants per genus in the plot. In addition, bulk leaf samples taken before sunset (19:30) acted as control for this experiment. Leaf water was extracted for isotope analyses (δ18Olw and δ2Hlw) as described in Section 2.3.1.
Leaf dry matter after cryogenic water extraction was milled to fine powder for δ18Ols and δ13Cls analysis of leaf sugars. Bulk sugars were extracted from 60 mg of this leaf powder with 1.5 mL deionized water at 85 °C for 30 min (Lehmann et al., 2020). The neutral sugar fraction (defined here as “sugars”) was then further purified from ionic and phenolic substances by ion-exchange cartridges (OnGuard II A, H and P, Dionex; Thermo-Fisher Scientific, Bremen, Germany) following the protocol by Rinne et al. (2012). For the analysis of δ18Ols, the purified bulk leaf sugars were filled into silver capsules, frozen and freeze-dried. The measurement precision (standard deviation) of the quality control standard (cellulose with 27.6‰ for δ18O) was ≤ 0.3‰ for δ18Ols (Lehmann et al., 2018), and 0.1‰ for δ13Cls (Bögelein et al., 2019). δ13C is the carbon isotope ratio in δ-notation in per mill (‰), relative to the international Vienna-Pee Dee Belemnite (V-PDB) standard, and were normalized by IAEA-CH7 (polyethylene, −32.2‰) and IAEA-CH3 (cellulose, −24.7‰) (Bögelein et al., 2019). Higher δ13Cls indicated lower water use efficiency (WUE) of plants.
In the chamber tracer experiment, the contribution of the tracer (ftracer) to leaf water at 03:00 (δ18Olw_03:00) was simulated using a linear two-pool mixing model. One source of the leaf water was assumed to be the δ18Oroot at 03:00 of IOP1 (δ18Oroot, 03:00) under natural conditions and the second source was the mean tracer δ18O (δ18Otracer, mean) taken up by the leaves during the night. We calculated δ18Otracer, mean as the mean of the original tracer δ18O (δ18Otracer, 19:30 = –364.7 ± 1.9‰) and the δ18O of the tracer which remained on the leaf surfaces by 03:00 (δ18Otracer, 03:00 measured by absorbing the remaining tracer in form of simulated dew from the leaf surfaces at 03:00). ftracer was calculated as:
Due to the chamber acting as a heat-trap, the within-chamber temperature should be slightly higher than the open-air temperature. This temperature difference might affect the leaf-air water vapor exchange, but was assumed to have minor effect on foliar water uptake of liquid-phase dew and water-sugar isotope exchange.
2.5 Statistics
Tukey’s honest significance test was used to assess differences among averages over sampling times and genera by the R-function agricolae::HSD.test (Steel, 1997) and one-way ANOVA. Reported statistical significance represents p < 0.05 with capital letters indicating temporal differences, and lower-case letters denoting genera or soil-depth differences. The isotopic and LWP results were reported in mean and standard errors of mean (SEM). We note that differences of isotope composition are always reported in absolute terms in per mil (‰). Correlation coefficients of regressions of NEP with Ta, PPFD, and RH were analyzed before and during the heatwave, with “***”, “**”, “*” and “ns” indicating p < 0.001, p < 0.01, p < 0.05, and p ≥ 0.05, respectively. During IOP1 and IOP2 at the end of the heatwave, considering the individual variability of plants, median values of leaf water isotope (δ18Olw) and LWP by species at each sampling time were used for analyzing their correlations with environmental conditions (RH, SWC, and δ18Osoil), with “***”, “**”, “*” and “ns” indicating p < 0.001, p < 0.01, p < 0.05, and p ≥ 0.05, respectively. All analyses were carried out with R version 4.1.2 (R Core Team, 2021).
3 Results
3.1 Diel environmental variability before and during the heatwave
The diurnal and nocturnal air temperature averaged 14.5 °C and 7.3 °C before the heatwave during 23-24 June, but was 20.1 °C and 11.2 °C on average during the heatwave from 25 to 30 June (Figure 2A). The highest temperature of 25.4 °C was observed on 26 June 2019 (15:30; Figure 2A), indicating the peak of the heatwave, followed by 27 June 2019, the second hottest day. H2O fluxes varied from –0.3 to 13.7 mmol m-2 s-1 (Figure 2B), corresponding to 3.0–4.7 mm of diurnal ET before the heatwave, and 4.9–5.7 mm during the heatwave (Figure 3A). SWC decreased from 0.32 to 0.15 m3 m-3 during this rain-free period from 23 to 30 June (Figure 2C). NEP varied from –22 to 21 μmol m-2 s-1 (Figure 2D). The daytime NEP was 4.2–6.3 g C m-2 before the heatwave, but ranged from 5.4 to –2.9 g C m-2 during the heatwave (Figure 3B). Negative NEP (–2.9 g C m-2) occurred on 27 June, the day after the hottest day (26 June). Highest VPD was 2.06 kPa and 2.65 kPa before and during the heatwave (Figure 2E), respectively. The leaf wetness levels indicated that dew occurred during each night of the rain-free period, being fully evaporated from vegetation surfaces after 07:30 of day (Figure 2F). With dew occurrence during each night of the rain-free period (23–30 June), the corresponding nocturnal VPD was as low as 0.14–1.41 kPa (Figure 2E).
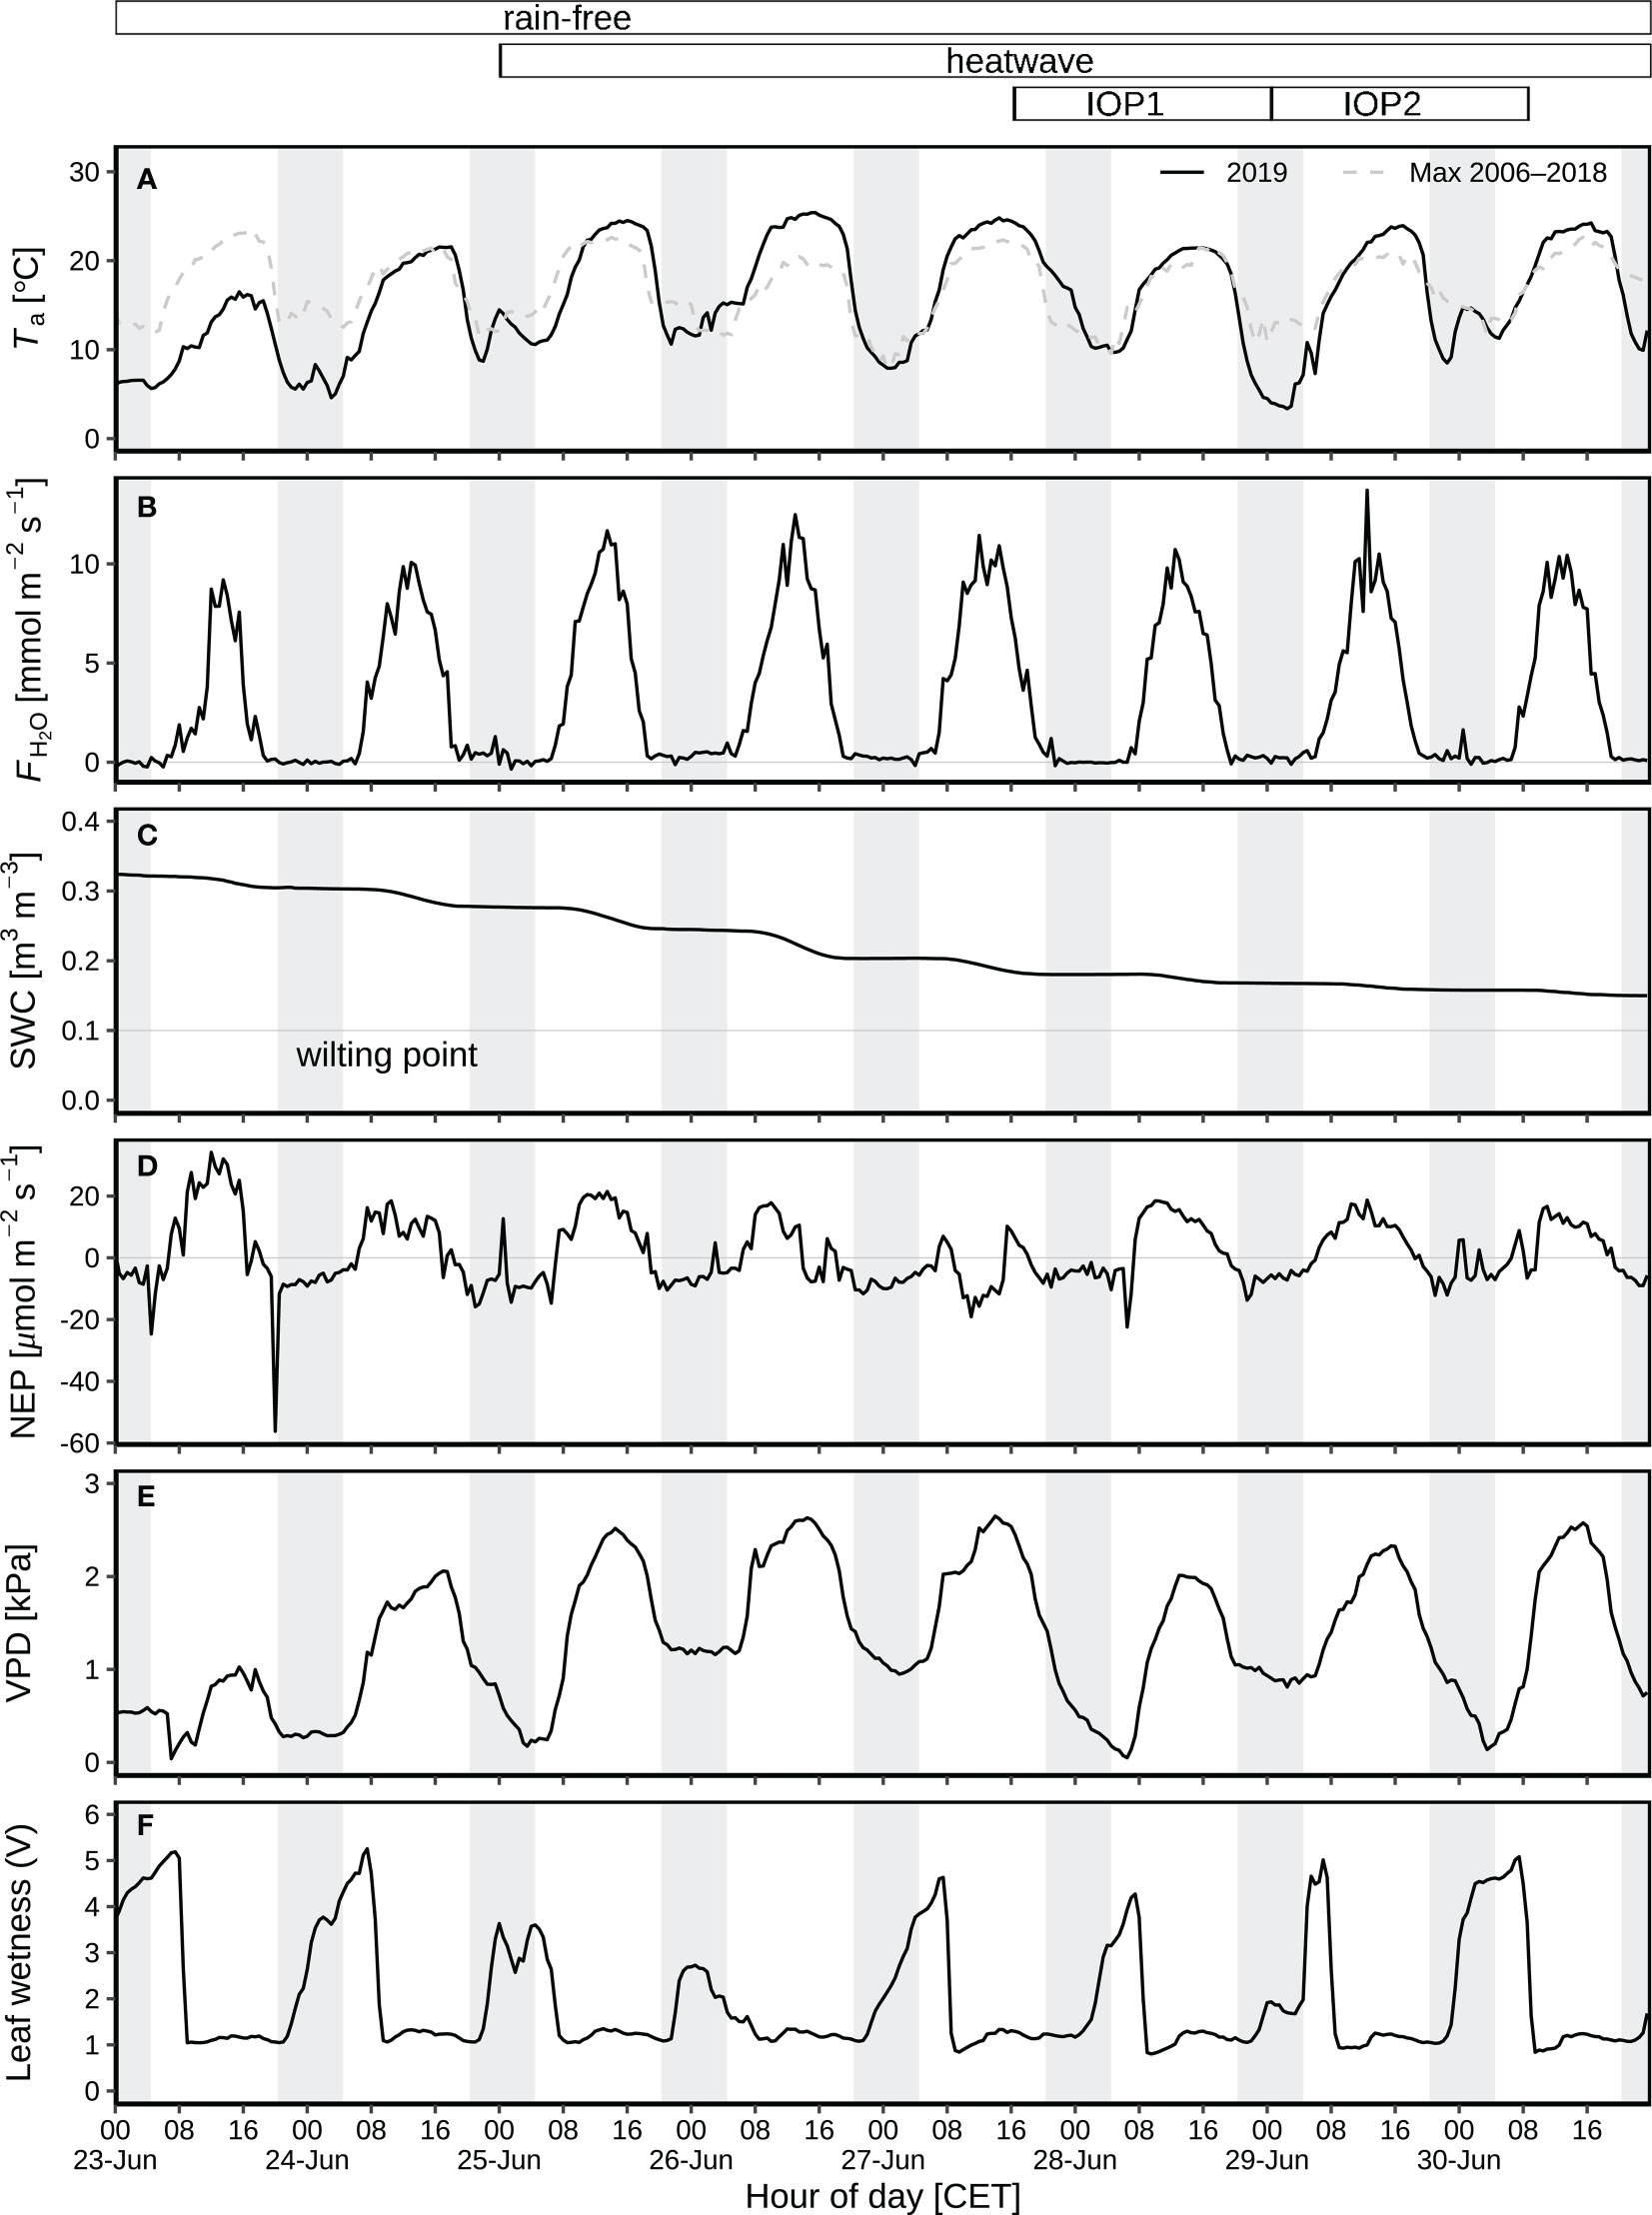
Figure 2 Environmental variables during the rain-free period (23–30 June) at CH-AWS site before the heatwave on 23–24 June, and during the June 2019 heatwave on 25–30 June: (A) air temperature (Ta) at 2 m agl as compared to the long-term maximum 2006–2018. (B) Eddy-covariance H2O flux. (C) Volumetric soil water content (SWC) at 5 cm depth. (D) Net ecosystem production (NEP); positive numbers indicate CO2 emission, and negative numbers represent CO2 uptake. (E) Vapor pressure deficit (VPD). (F) Leaf wetness recorded by the voltage signal resulting from a fixed current applied from the center to the rim of the blotting paper; substantial increase in leaf wetness during nighttime and early morning indicate leaf wetting by dew during the rain-free period; dew occurred on each night of the period. Field campaigns were carried out during two intensive observation periods (IOP) on 28–29 (IOP1) and 29–30 (IOP2) June 2019. Hours of day are given in CET. The grey shaded areas represent nocturnal periods.
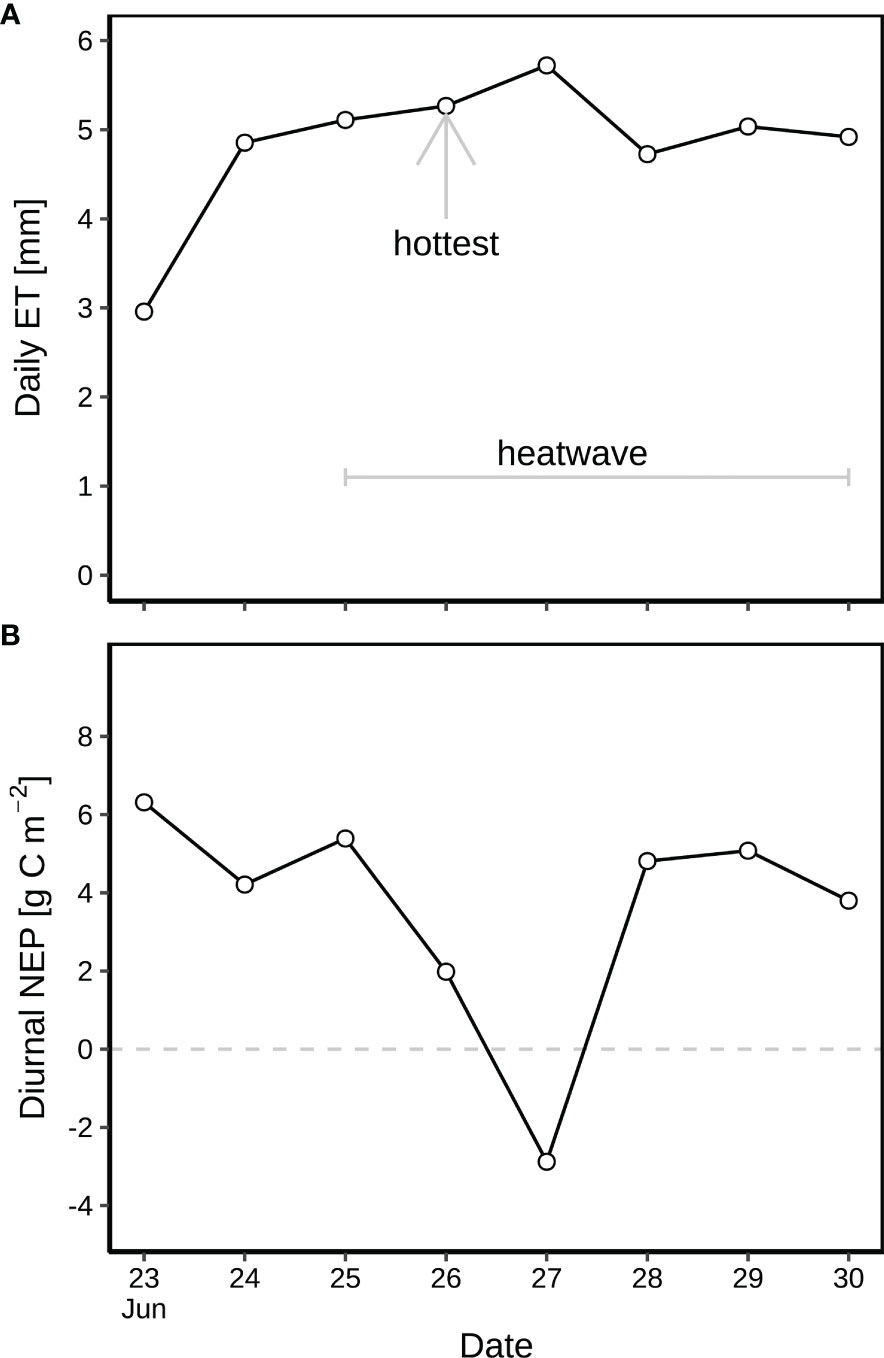
Figure 3 (A) Diurnal evapotranspiration (ET) and (B) net ecosystem production (NEP) during the rain-free period (23–30 June) at CH-AWS site before the heatwave on 23–24 June, and during the June 2019 heatwave on 25–30 June. Dew occurred on each night of the period. 26 June was hottest during the heatwave.
3.2 Effects of heat-drought and dew on net ecosystem production
Before the heatwave, NEP almost linearly increased with PPFD (Figure 4), with higher diurnal NEP (6.3 g C m-2) on 23 June than that on 24 June (4.2 g C m-2; Figure 3B). The suppression of heat-drought stress on NEP was substantial on the hottest day (26 June with 2.0 g C m-2) during the heatwave (Figure 3B), with 63% of reduction in NEP compared to the previous day (25 June with 5.4 g C m-2 of NEP). Negative diurnal NEP (–2.9 g C m-2) occurred on the second hottest day (27 June; Figure 3B), with longer period (09:00–15:00) of net carbon emission (negative NEP) under PPFD > 1300 μmol m-2 s-1 and Ta > 22.5 °C (Figure 4E), as compared to the hottest day during 14:00–16:30 under PPFD > 1800 μmol m-2 s-1 and Ta > 25.3 °C (Figure 4D). Daily NEP recovered to the levels of 4.7–5.0 g C m-2 on 28–30 June after the hottest two days on 26–27 June (Figure 3B).
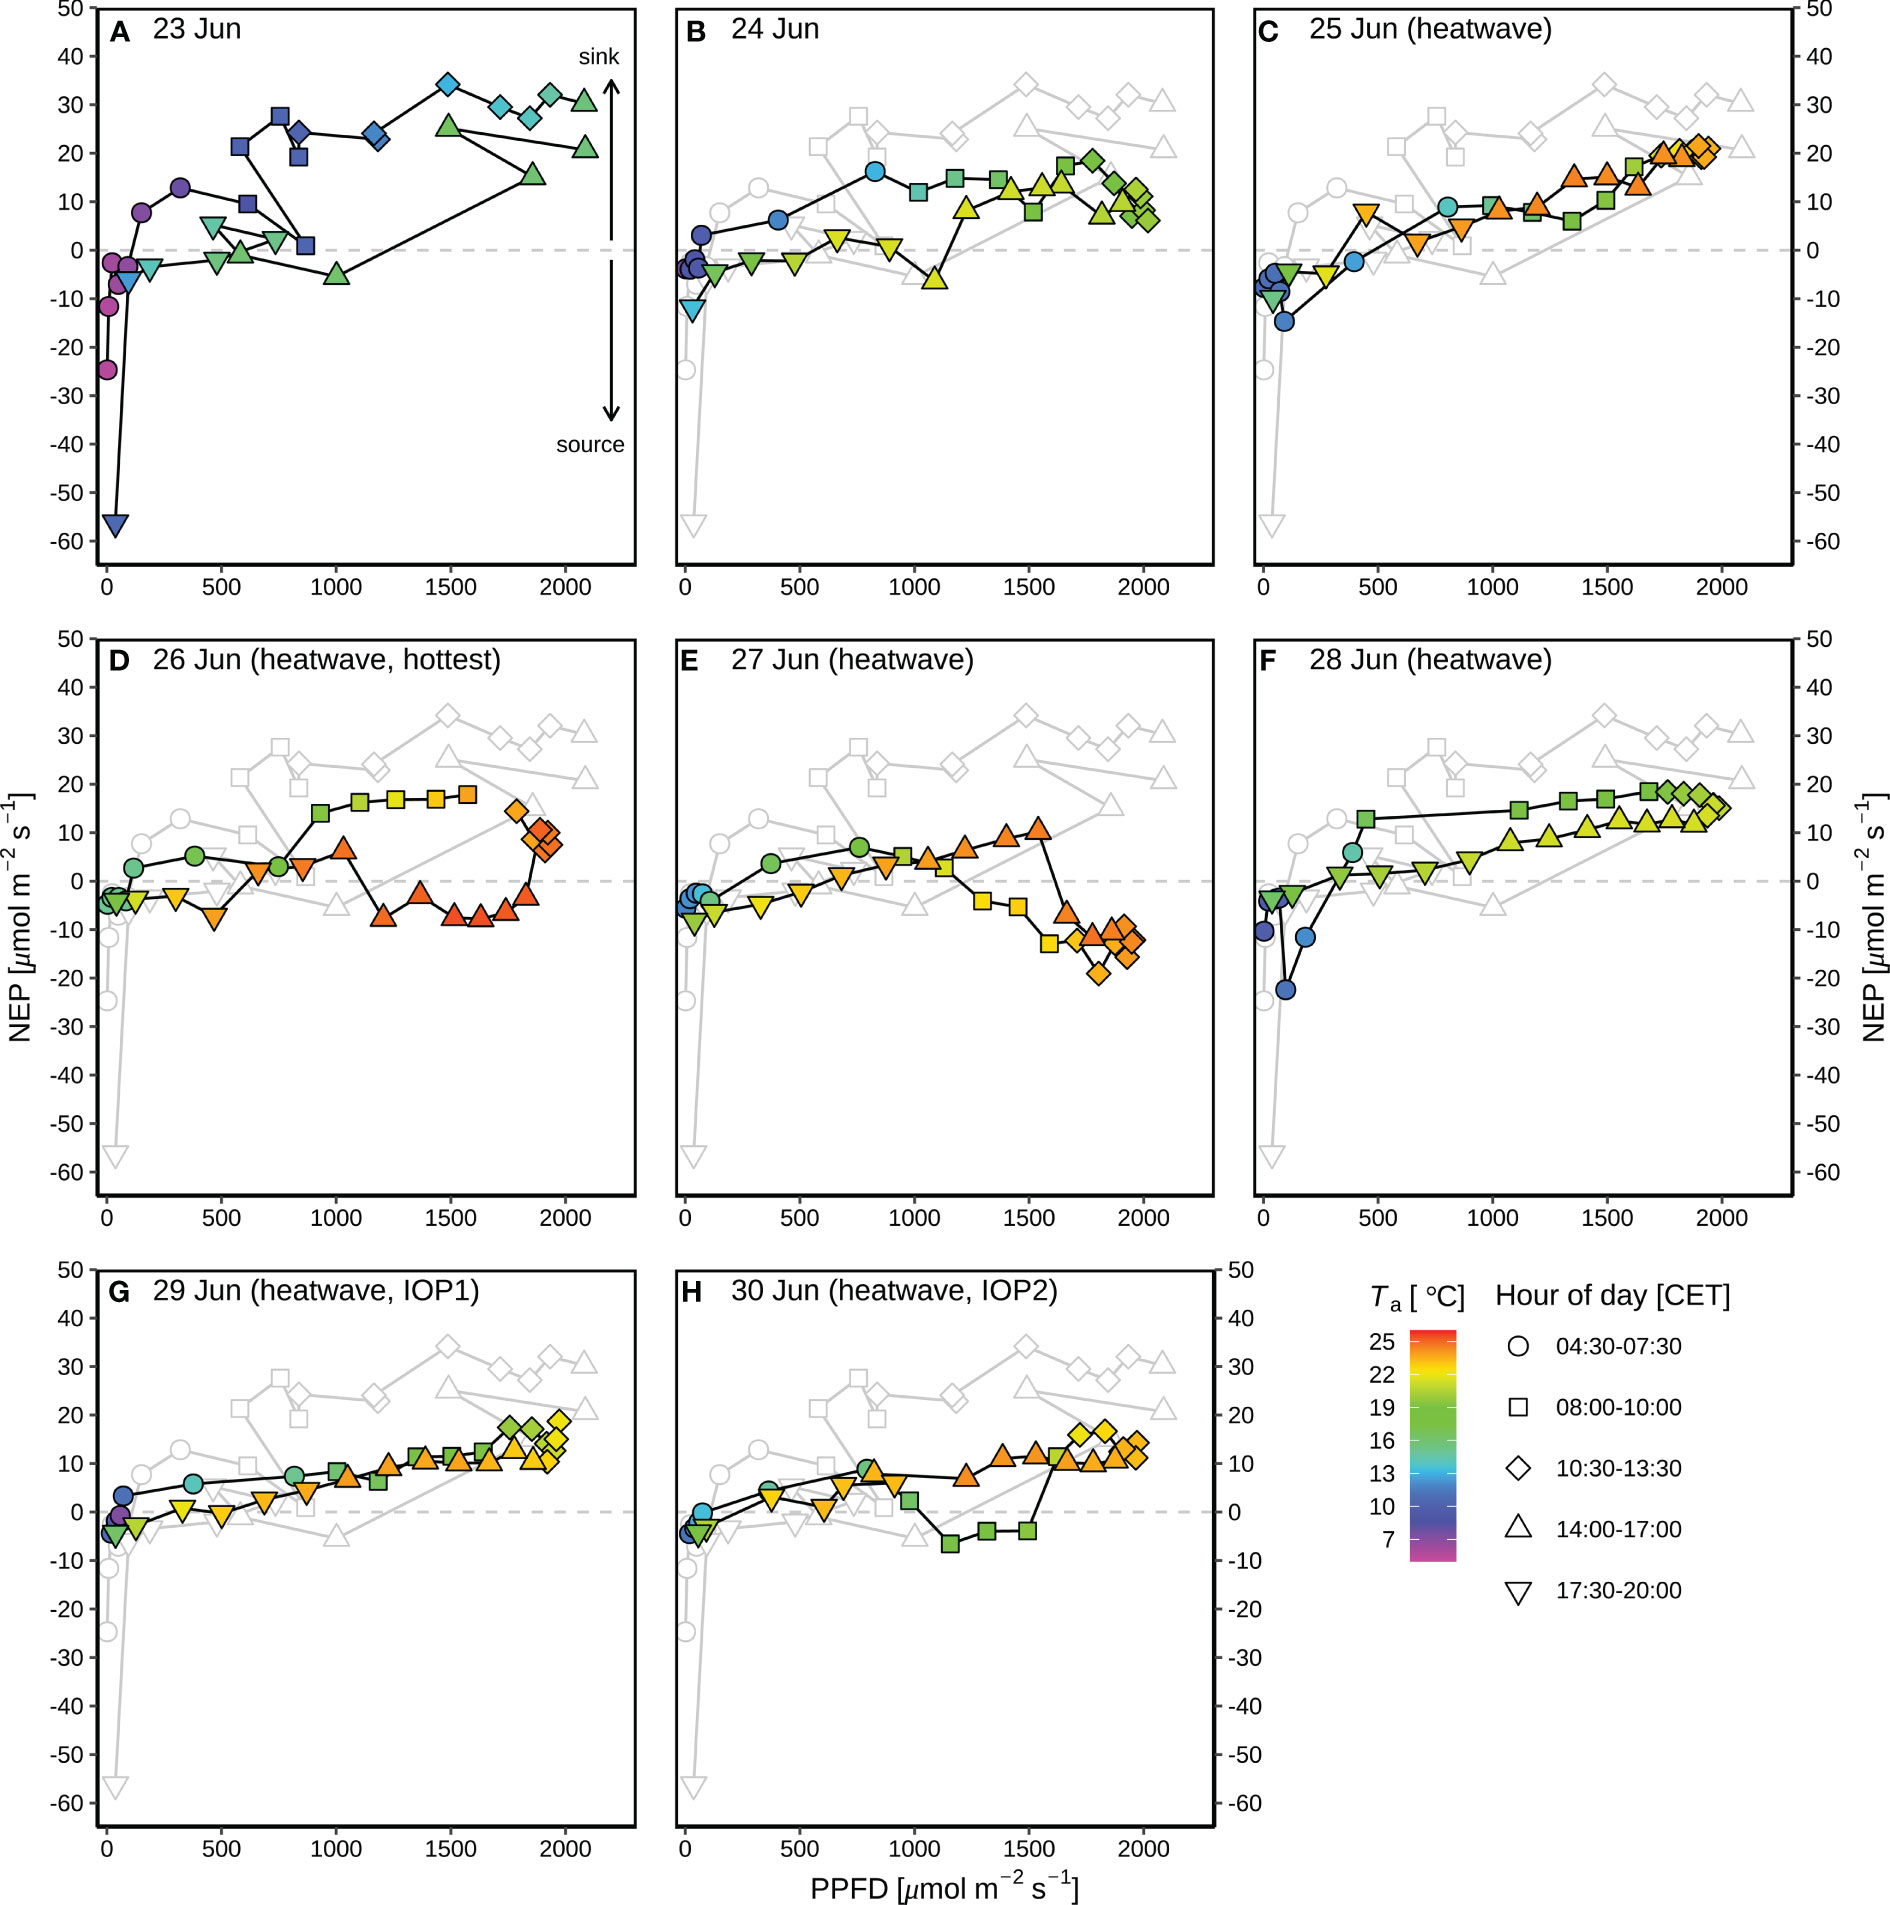
Figure 4 Response curves of diurnal net ecosystem production (NEP) to photosynthetic photon flux density (PPFD) during the rain-free period (23–30 June) at CH-AWS site before the heatwave on 23–24 June (A, B), and during the June 2019 heatwave on 25–30 June (C–H). Different hours of day (CET) are shown in different shapes; the colors of the symbols indicate the corresponding air temperature (Ta). Dew occurred during each night of the period. For comparison, the grey plots in panels (B–H) show the NEP-PPFD response curve on 23 June 2019 before the heatwave.
During the early morning hours before 07:30 with leaf wetting by dew, NEP increased by Ta before and during the heatwave (Figure 5A; p < 0.01 and p < 0.001 before and during the heatwave, respectively), but the turning Ta from negative (net carbon emission) to positive (net carbon sequestration) NEP was higher during the heatwave period (13.7 °C for 25-30 June) than that before the heatwave (8.2 °C for 23-24 June). With vegetation wetting by dew in the early morning hours, NEP exponentially increased with PPFD (p < 0.01 and p < 0.001 before and during the heatwave, respectively), but NEP was lower during the heatwave than that before the heatwave under same levels of PPFD (Figure 5B). In the early morning hours with vegetation wetting, NEP slightly increased by leaf wetness levels before the heatwave (Figure 5C; p ≥ 0.05), but significantly decreased by leaf wetness levels at the beginning of the heatwave on 25–26 June (Figure 5D; p < 0.01).
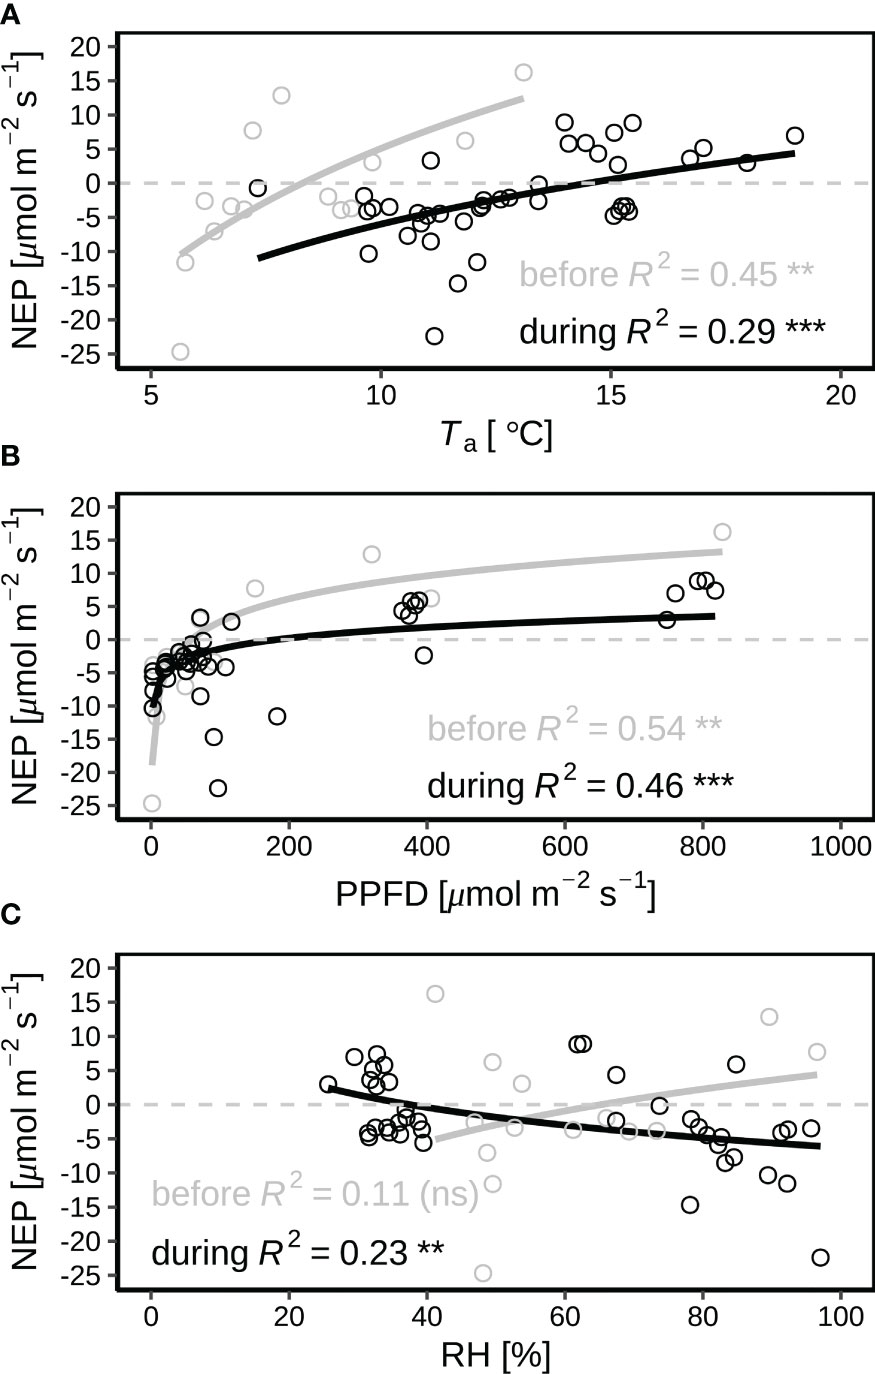
Figure 5 Correlations of net ecosystem production (NEP) with (A) air temperature (Ta at 2 m agl), (B) photosynthetic photon flux density (PPFD), and (C) relative humidity (RH) in the early morning hours (from sunrise to 07:30) with wet leaves by dew before (23–24 June in grey) and during the June 2019 heatwave (25–30 June in black). Dew occurred during each night of the period. 26 June was hottest during the heatwave. The values of p for the correlation coefficients are indicated by “***”, “**”, “*” and “ns” for p < 0.001, p < 0.05, p < 0.01, and p ≥ 0.05.
3.3 Effects of heat-drought and dew on leaf water status and leaf isotopes
3.3.1 Leaf water status
Comparing predawn (03:00) periods of IOP1 and IOP2 (Figure 6), Poa LWP significantly decreased from –0.9 to –1.5 MPa (p < 0.05), Trifolium LWP slightly decreased from –0.4 to –0.7 MPa (p ≥ 0.05), Taraxacum LWP was at similar levels (–0.6 to –0.6 MPa; p ≥ 0.05), whilst Alchemilla LWP slightly increased from –0.7 to –0.3 MPa (p ≥ 0.05). Comparing before-sunset (19:30) periods of IOP1 and IOP2 (Figure 6), Poa LWP significantly decreased from –0.9 to –1.8 MPa (p < 0.05), Taraxacum LWP (–1.1 to –1.1 MPa) was at similar levels, whilst Trifolium LWP slightly increased from –1.3 to –1.0 MPa (p ≥ 0.05) and Alchemilla LWP increased from –1.6 to –0.6 MPa (p ≥ 0.05). The LWP of all four genera slightly increased during both IOP nights (p ≥ 0.05; Figure 6), i.e., from before-sunset (19:30) to predawn periods (03:00). Among the four genera, Alchemilla had the lowest LWP before sunset of IOP1 (p ≥ 0.05), but had slightly higher LWP than the other three genera before sunset of IOP2 (p ≥ 0.05). On the contrary, Poa had slightly lower LWP than the other three genera at the predawn period of IOP1 (p ≥ 0.05), but had much lower LWP than the other three genera at predawn of IOP2 (p < 0.05). Therefore, Poa LWP significantly decreased (p < 0.05) at the end of the heatwave, whilst Alchemilla LWP significantly increased (p < 0.05), Taraxacum and Trifolium slightly increased (p ≥ 0.05) although heat-drought stress.
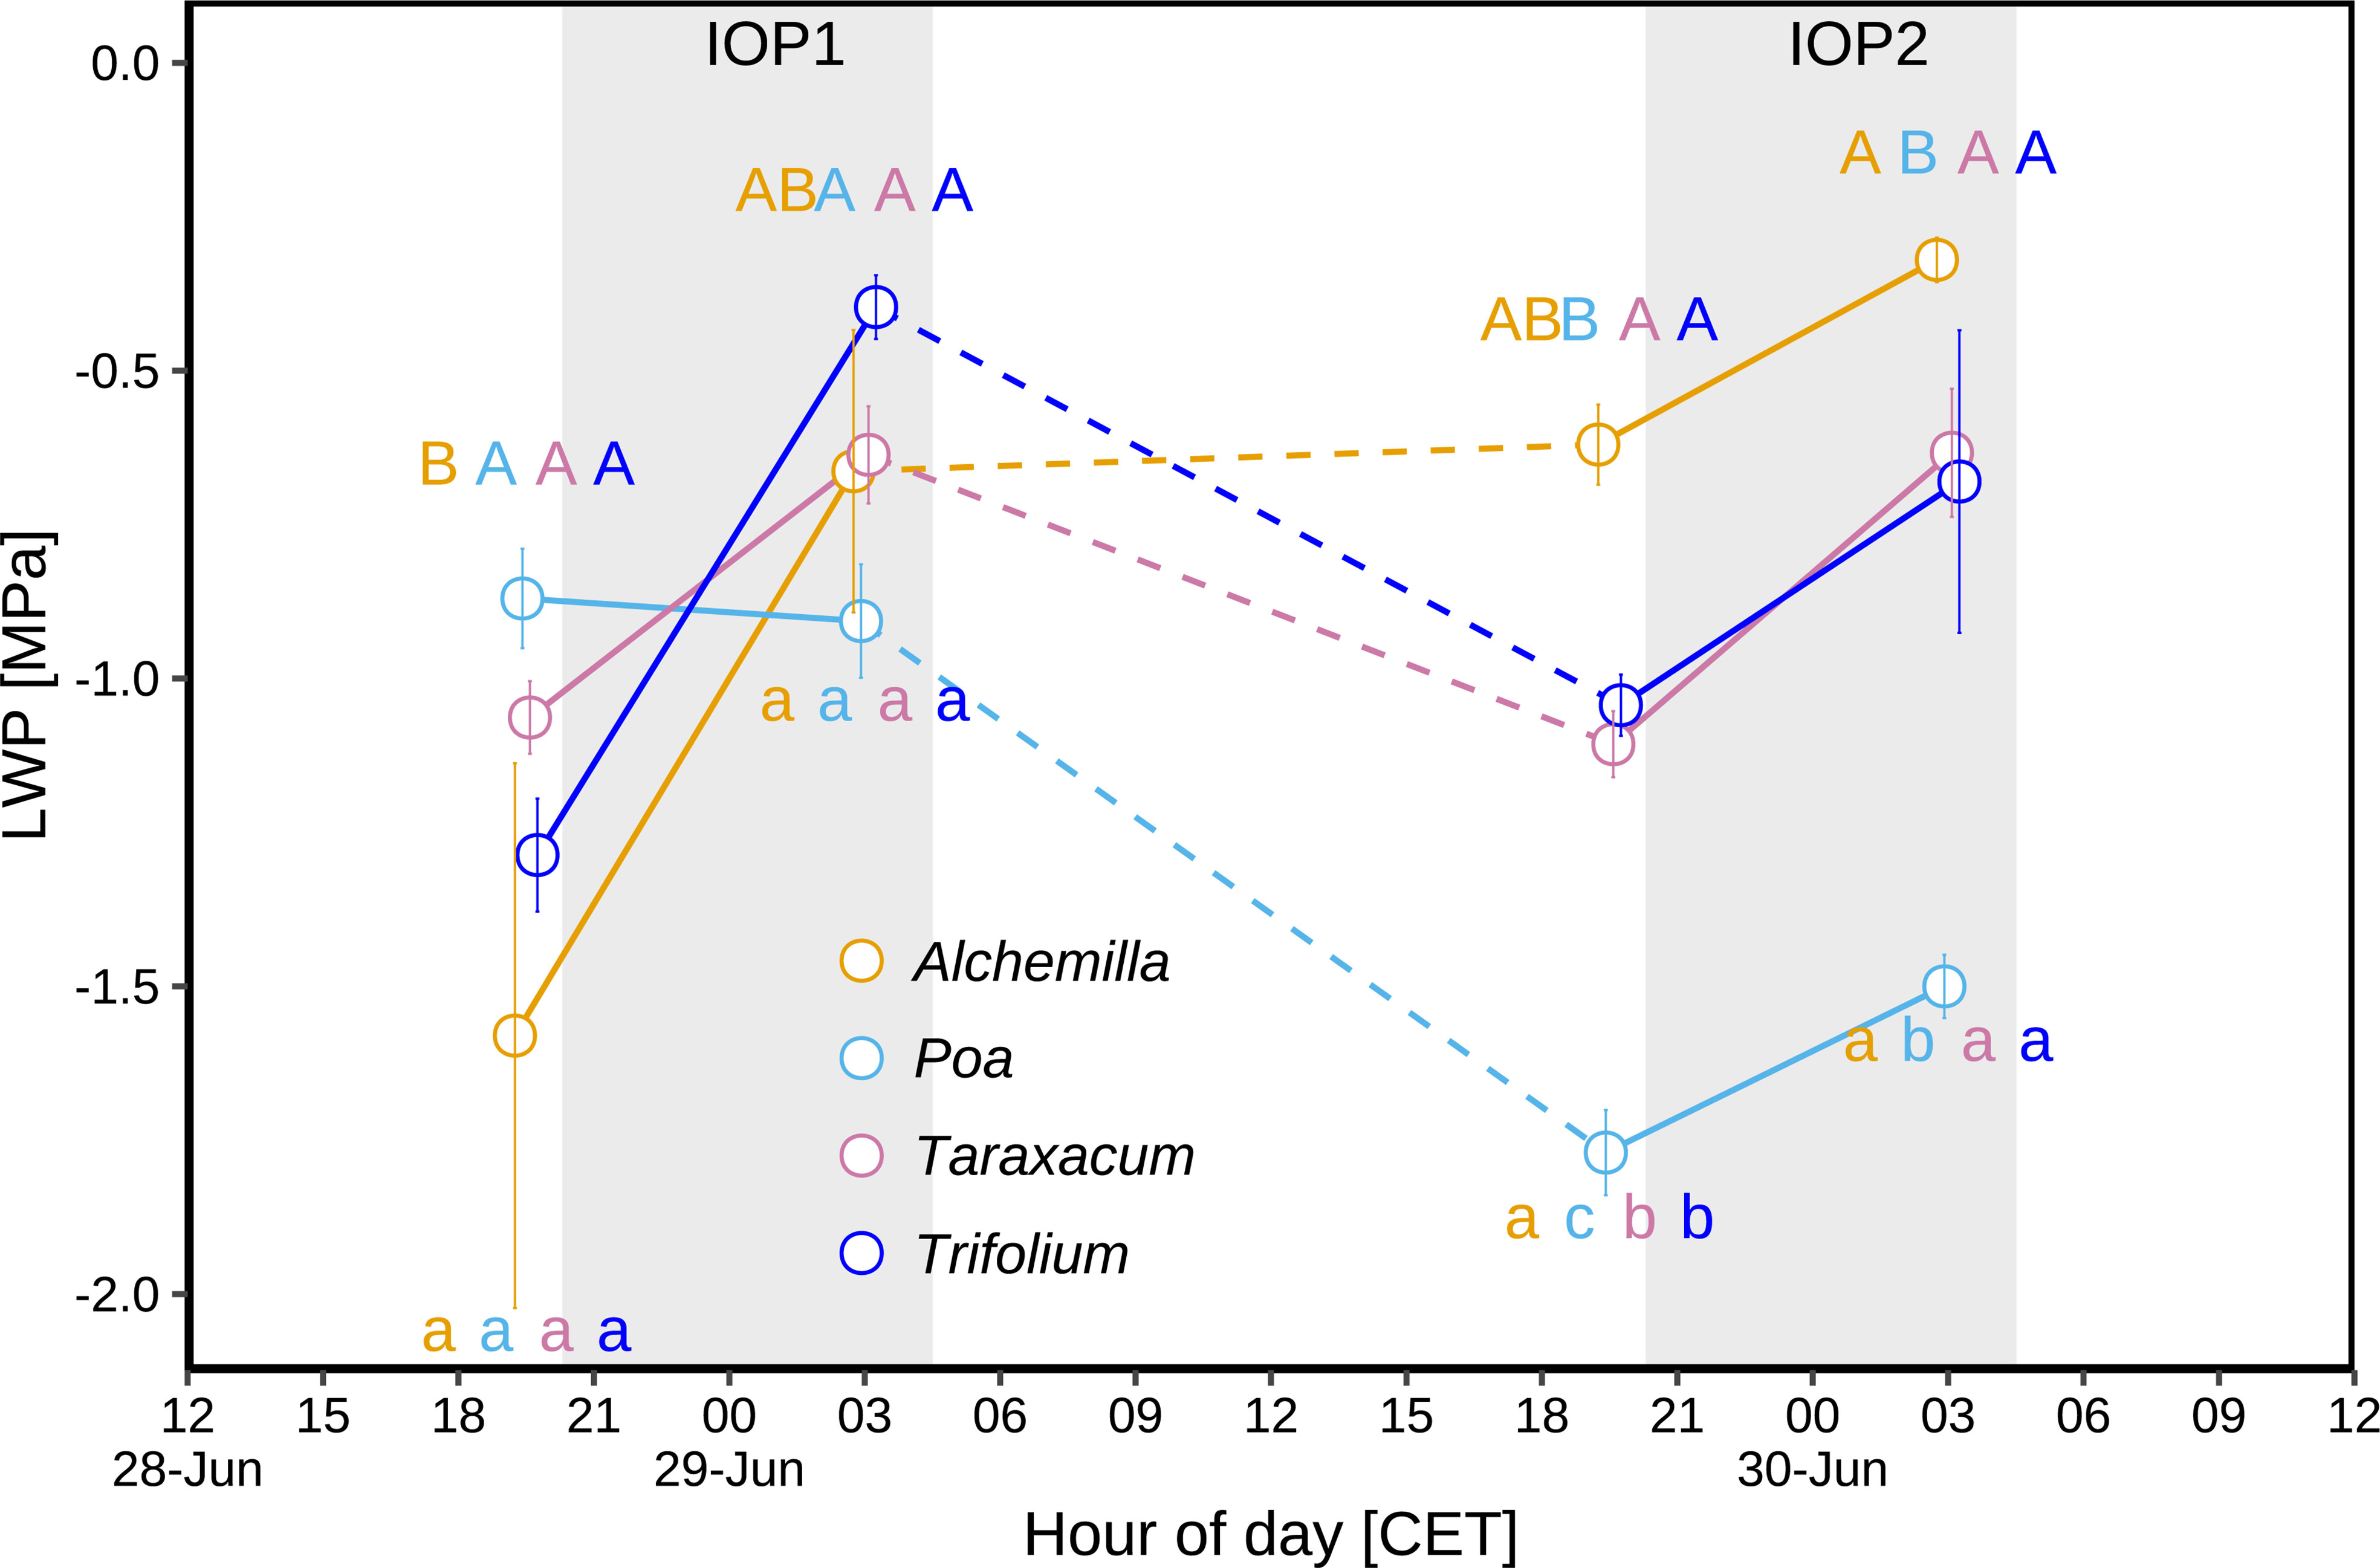
Figure 6 Leaf water potential (LWP) during two intensive observation periods (IOP1 and IOP2) with nocturnal dew occurrence at the end of the June 2019 heatwave: LWP of different plant genera (Alchemilla, Poa, Taraxacum, and Trifolium) were measured before sunset (at 19:30 within around 1 h before sunset) and before sunrise (03:00 within around 2 h before sunrise) of two dew events. Different letters indicate statistically significant differences (p < 0.05), with capital letters indicating temporal comparison, and lower cases indicating among-genera comparison. The grey shaded areas represent nocturnal periods.
3.3.2 Isotope composition of different water pools at natural isotope abundances
The δ18Osoil (–9.5 ± 1.6‰; Figure 7A) varied with depth (p < 0.05), with higher δ18Osoil (–8.1 ± 1.4‰) in top soil layer (0–5 cm depth) and lower δ18Osoil (–10.2 ± 1.2‰) in subsoil layers (5–20 cm depth). δ18Oroot was within the range of δ18Osoil (Figures 7A, B), indicating soil water as the main source of plant water. δ18Oroot of Alchemilla and Trifolium was between the topsoil and the subsoil δ18Osoil, whilst δ18Oroot of Poa and Taraxacum was close to subsoil δ18Osoil. δ18Oroot varied with plant genera (p < 0.05; Figure 7B), with higher δ18Oroot for Alchemilla and Trifolium (–9.0 ± 1.0‰), but lower δ18Oroot for Poa and Taraxacum (–10.6 ± 1.0‰). The comparison of δ18Osoil and δ18Oroot (Figure 7B) indicated that Alchemilla and Trifolium used shallower soil water as compared to Poa and Taraxacum.
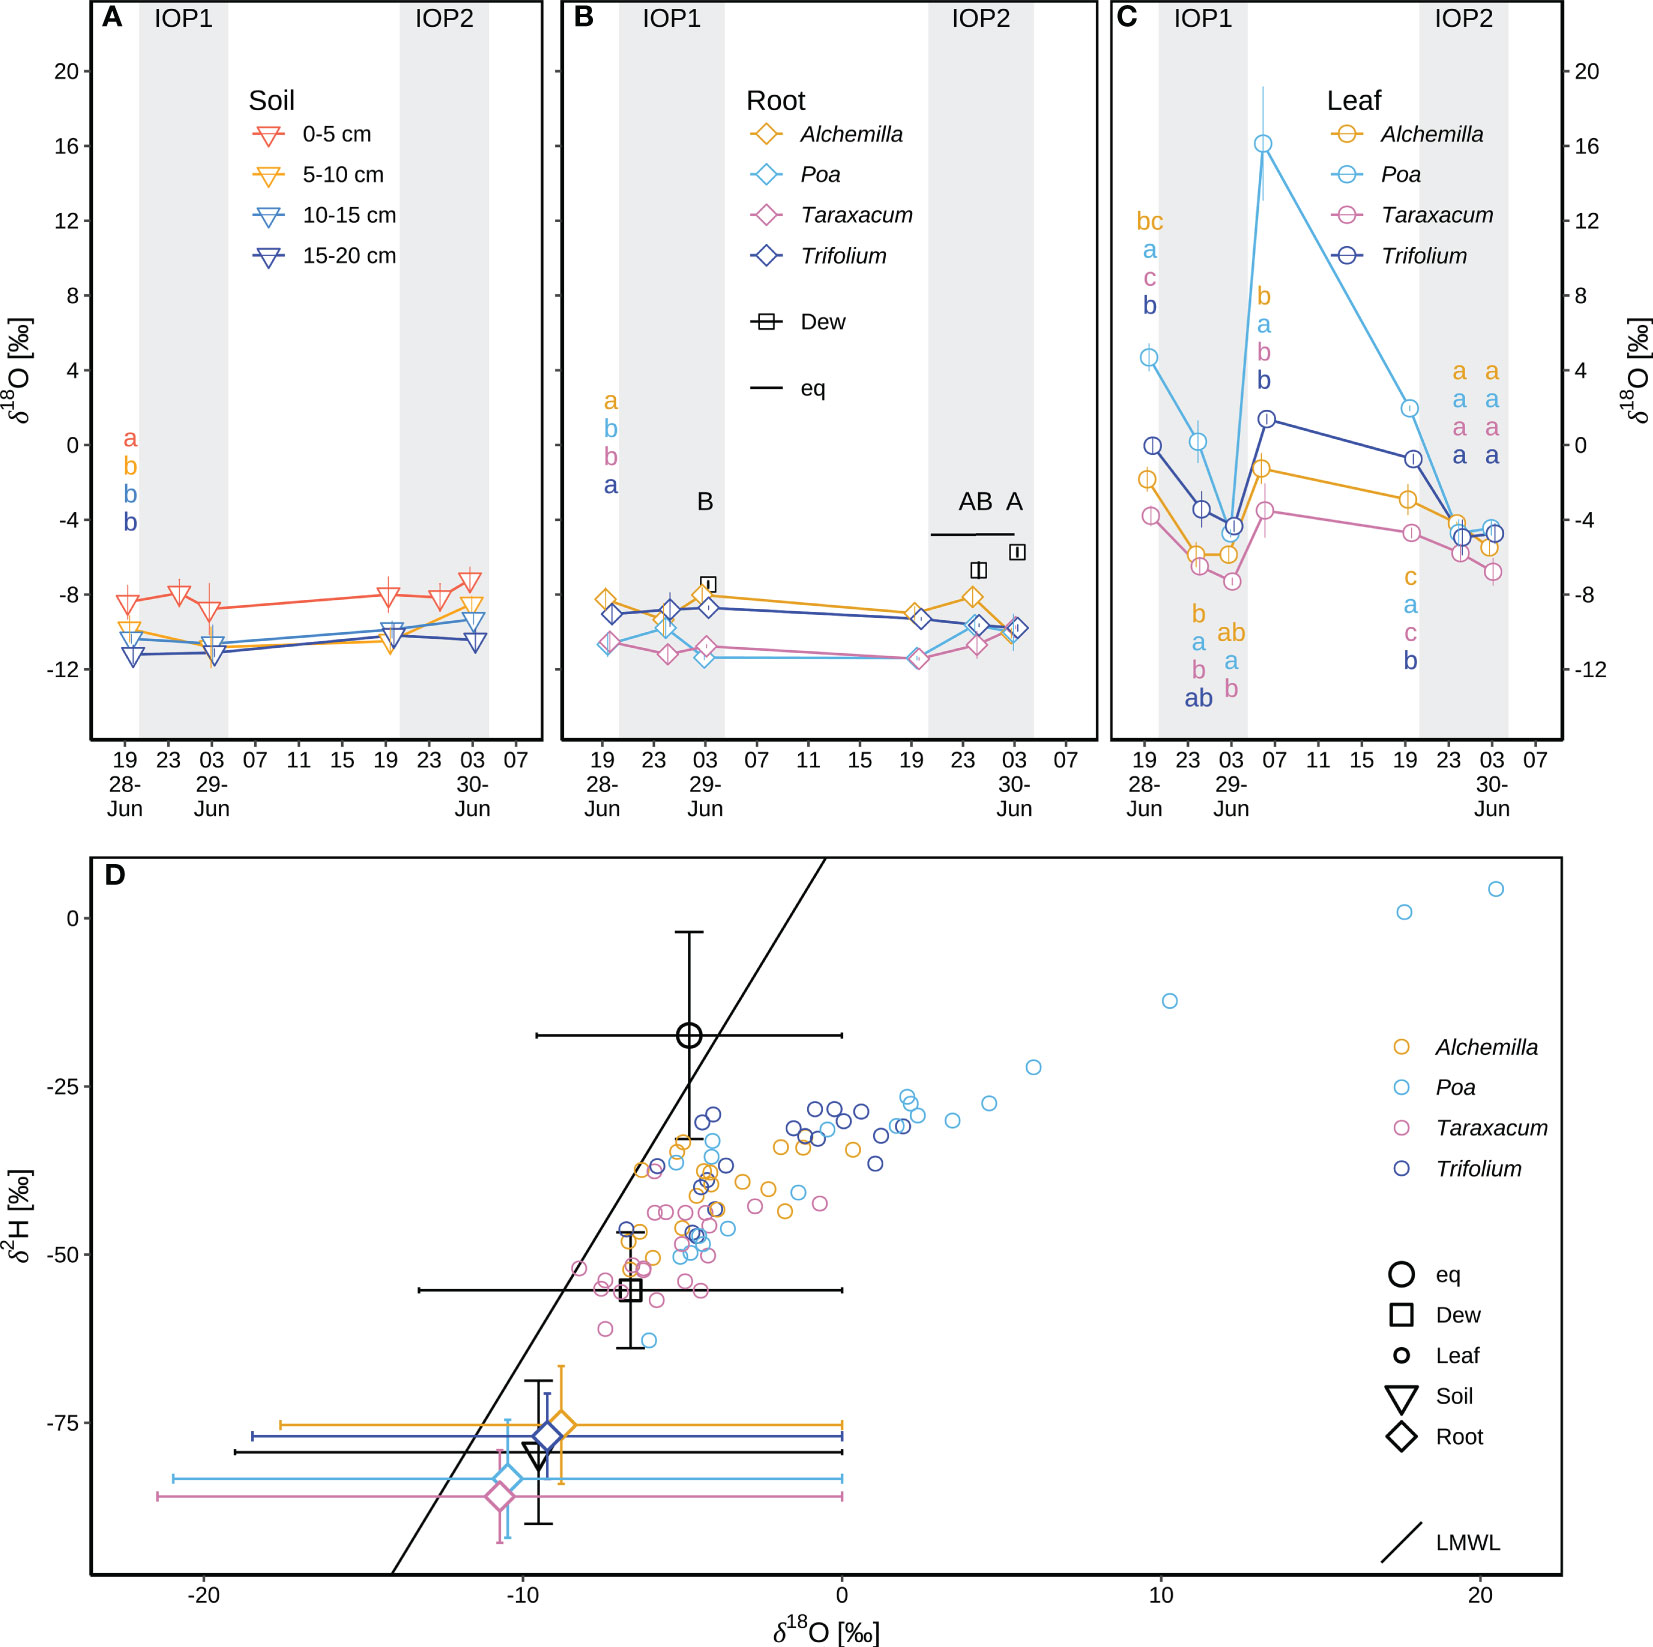
Figure 7 Isotope composition of different water pools during two consecutive intensive observation periods (IOP1 and IOP2) with nocturnal dew formation at the end of the June 2019 heatwave: (A) soil water δ18Osoil at different depths (0–5, 5–10, 10–15, and 15–20 cm); different lower-case letters indicate statistical significance of among-soil-depth difference (p < 0.05) of δ18Osoil over IOPs. (B) Dew droplets δ18Odew on plant surfaces; the liquid δ18Oeq in equilibrium with atmospheric water vapor; xylem water of root crown δ18Oroot for four genera (Alchemilla, Poa, Taraxacum, Trifolium); different lower-case letters indicate statistical significance of among-genera difference (p < 0.05) of δ18Oroot over IOPs; different capital letters in black indicate statistical significance of among-sampling-time difference (p < 0.05) of δ18Odew. (C) Leaf water δ18Olw for four genera; different lower-case letters indicate statistical significance of among-genera difference (p < 0.05) for δ18Olw at each sampling time. Mean and standard errors of mean (SEM) are shown in panels (A–C). (D) δ2H–δ18O pairs compared to the local meteoric water line (LMWL: δ2H = 7.83δ18O + 12.97) following Prechsl et al. (2014); δ2H–δ18O of equilibrium liquid, dew samples, and soil samples was mean and SEM over IOPs; δ2H–δ18O of xylem water of root crown was mean and SEM by species over IOPs; raw data of leaf water δ2H–δ18O were shown for four genera at each sampling time. The grey shaded areas in panels (A-C) represent nocturnal periods.
Across all four genera, leaf water δ18Olw (–2.6 ± 4.8‰; Figure 7C) was on average higher than δ18Oroot (–9.8 ± 1.3‰; Figure 7B), indicating evaporative processes of leaf water as compared to xylem water. Poa had the highest δ18Olw among the four genera (p < 0.05; Figure 7C), indicating strongest water stress of Poa derived from their stronger evaporation or stress-induced partial stomatal closure. Taraxacum tended to have the lowest δ18Olw, but not significantly different from Alchemilla and Trifolium (p ≥ 0.05). δ18Odew changed over time, with –7.5 ± 0.4‰ at 03:00 of IOP1, increasing to –6.7 ± 1.0‰ at 00:00 and –5.7 ± 0.5‰ at 03:00 during IOP2 (p ≥ 0.05; Figure 7B). δ18Oeq of the liquid water in equilibrium with atmospheric water vapor was –5.0‰ to –4.7‰ during 20:30 to 03:00 of IOP2. Compared to the local meteoric water line (LMWL; δ2H = 7.83 δ18O + 12.97; following Prechsl et al., 2014), δ2Heq–δ18Oeq was above the LMWL. In contrast, all δ2H–δ18O pairs for dew droplets, plants and soil water fell below the LMWL, indicating evaporation of these water pools compared to local precipitation, particularly of leaf water (Figure 7D).
3.3.3 Effect of isotopically labelled dew on leaf water and sugar isotopes
Adding isotopically 18O-depleted water as a tracer in the chamber tracer experiment on IOP1 night induced a substantial 18O-depletion in leaf water (δ18Olw; p < 0.05), but not so in leaf sugars (δ18Ols; p ≥ 0.05; Figure 8A). Before applying the tracer at 19:30 (before sunset), δ18O of leaf sugar (δ18Ols) for the four genera (29.9 ± 2.9‰; Figure 8A) was 30.1‰ higher than their respective δ18Olw (–0.2 ± 3.4‰). During the following 7.5 h overnight (until 03:00), δ18Olw of the four genera decreased by a further 26.6 ± 10.4‰ as compared to before-sunset levels. In contrast, δ18Ols (29.2 ± 4.5‰) of the four genera did not change after tracer amendment, and consequently δ18Ols of the four genera was 55.7‰ higher than the respective δ18Olw (Figure 8A). Wet foliage due to tracer application persisted for 10.5 h, thus after sunrise (06:00), δ18Olw of the four genera increased to –14.6 ± 4.7‰ in respect to predawn δ18Olw, whereas the corresponding δ18Ols (26.3 ± 1.3‰) remained almost constant over the night until sunrise, indicating minor effect of amended tracer on soil moisture. As a result, δ18Ols of the four genera after sunrise was 40.9‰ higher than the corresponding δ18Olw (Figure 8A).
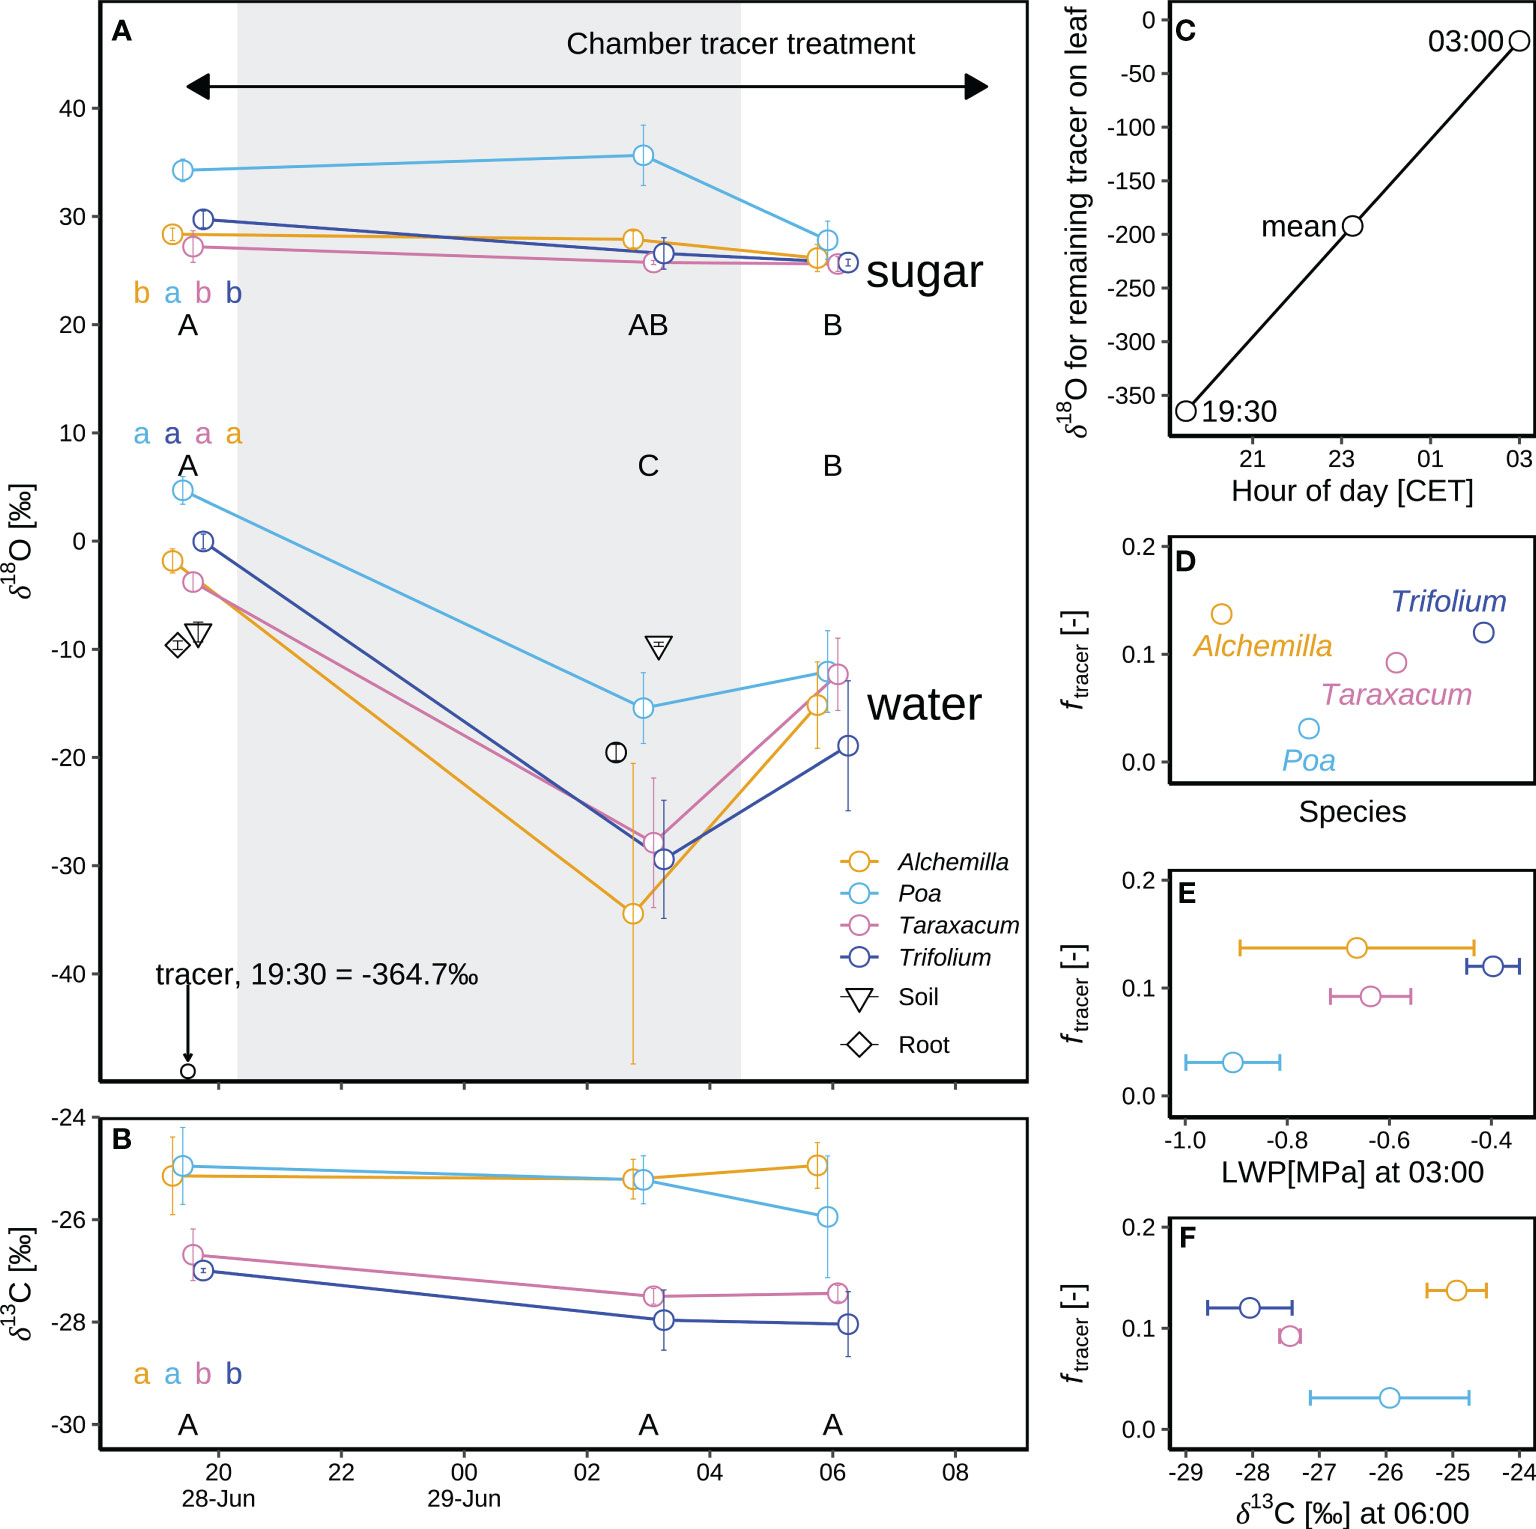
Figure 8 Oxygen isotope composition of leaf sugars (δ18Ols and δ13Cls) and leaf water (δ18Olw) in a chamber tracer experiment during an intensive observation period (IOP1) for four plant genera (Alchemilla, Poa, Taraxacum, and Trifolium) at the end of the June 2019 heatwave: (A) Mean and standard errors of mean (SEM) for the isotope composition of bulk leaf sugar (δ18Ols) and leaf water (δ18Olw) with the corresponding xylem water of root crown, soil water (at 5 cm soil depth) and tracer on leaf surface. The grey shaded area corresponds to the nocturnal period. Leaf samples taken before sunset in IOP1 (19:30 CET) acted as a control for natural isotope abundances. (B) Mean and SEM for the carbon isotope composition of bulk leaf sugar (δ13Cls) for four genera. (C) Changes in δ18O of tracer remaining on the leaves, from 19:30 (δ18Otracer_19:30) when the tracer was sprayed on the leaves until 03:00 (δ18Otracer_03:00) before sunrise; the mean tracer δ18O (δ18Otracer_mean) was calculated as arithmetic mean. (D) Contributions of δ18Otracer in leaf water (ftracer) at 03:00 on 29 June 2019 are based on a two-pool mixing model. (E) Correlation of ftracer with leaf water potential (LWP) for four genera. (F) Correlation of ftracer with δ13Cls. Different letters in panels a–b indicate statistically significant difference (p < 0.05) of leaf water and sugar with capital letters representing temporal differences and lower-cases representing among-genera differences over IOP1.
The changes in δ18Olw varied by genus before and during the chamber tracer experiment. Before sunset and tracer amendment, Poa δ18Olw (4.7 ± 1.3‰) was 6.6‰ higher than δ18Olw of the other three genera (–1.9 ± 1.8‰; Figure 8A), indicating more severe water stress of Poa. However, the difference for predawn (03:00) δ18Olw of Poa (–15.4 ± 2.8‰; Figure 8A) increased to 15.3‰ compared to the corresponding δ18Olw of the other three genera (–30.7 ± 8.9‰; Figure 8), which might be due to the stronger evaporation and less foliar water uptake of Poa, or stress-induced partial stomatal closure. Overall, the ranking of the genera stayed relatively stable, with Poa typically showing the highest δ18Olw.
During the experiment, δ18O of the added tracer increased from –364.7‰ at 19:30 to –19.5 ± 1.8‰ at 03:00 (Figure 8C). The contribution (ftracer) of the added tracer (δ18Otracer_mean of –192.1‰) to plant leaf water was 3–14%, highest for Alchemilla and lowest for Poa (Figure 8D). ftracer was positively correlated with the corresponding predawn LWP, except for Alchemilla with large variability in their predawn LWP (Figure 8E).
δ13Cls was rather constant over the IOP1 night. Higher δ13Cls of Alchemilla and Poa indicated their lower WUE, as compared to Taraxacum and Trifolium (Figure 8B). δ13Cls of Poa, Taraxacum and Trifolium was negatively correlated with ftracer (Figure 8F), whilst Alchemilla with highest ftracer showed highest δ13Cls and thus lowest WUE.
3.4 Controls of atmospheric and soil conditions on plant water
LWP of Taraxacum and Trifolium were positively correlated with RH (Figure 9A), indicating the controls of atmospheric humidity on their LWP. LWP of Poa was positively correlated with SWC (Figure 9B), indicating the controls of soil moisture on their LWP. This corresponded to the significant decline of Poa LWP at the end of the heatwave (Figure 6), under the conditions of low SWC (0.15 m3 m-3; Figure 2C) close to wilting point. LWP and δ18Olw of Alchemilla, Taraxacum and Trifolium were negatively correlated (Figure 9C), indicating the controls of leaf water content on their δ18Olw. Stronger drought-stress of Poa might induce partial stomatal closure, and thus result in their more enriched leaf water isotopes (higher δ18Olw) not relevant to LWP. The slightly improved Alchemilla LWP at the end of the heatwave might be derived from the accumulated benefits by dew, which contributed more to Alchemilla leaf water (14%; Figure 8D) compared to the other three genera (≤ 12%). δ18Olw of Alchemilla, and Taraxacum was negatively correlated with RH (Figure 9D), indicating the control of atmospheric conditions on their δ18Olw. δ18Olw did not show significant correlation with SWC and δ18Osoil (Figures 9E, F), indicating the minor control of soil water on leaf water isotopes.
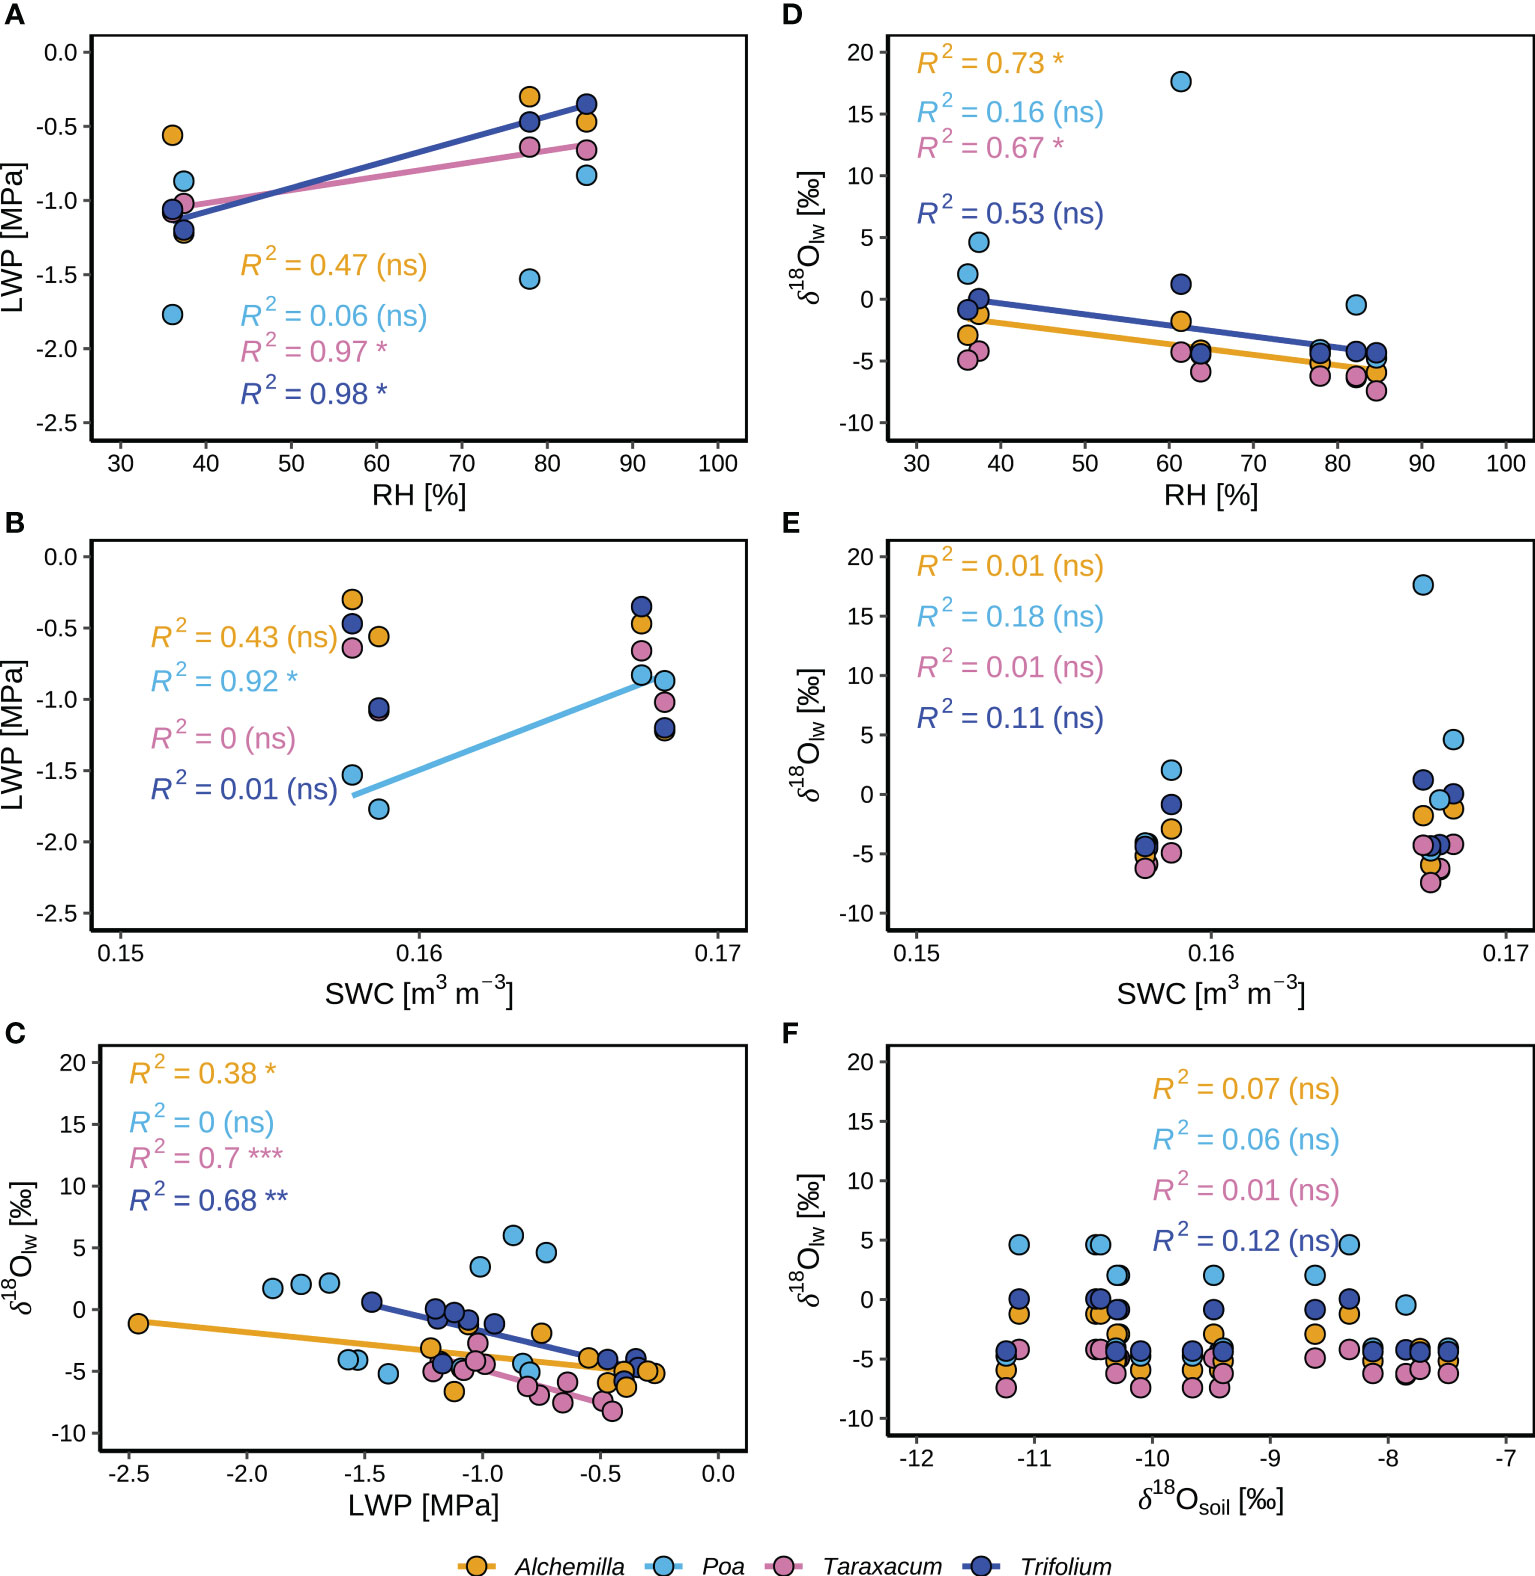
Figure 9 Correlations between different environmental and plant variables for four plant genera (Alchemilla, Poa, Taraxacum, and Trifolium) during two consecutive intensive observation periods (IOP1 and IOP2) with nocturnal dew formation at the end of the June 2019 heatwave: (A) Median leaf water potential (LWP) and corresponding relative humidity (RH, at 2 m agl). (B) Median LWP and corresponding volumetric soil water content (SWC) at 5 cm depth. (C) Leaf water isotopes (δ18Olw) and LWP. (D) Meidian δ18Olw and corresponding RH. (E) Median δ18Olw and corresponding SWC. (F) Median δ18Olw and median soil water isotopes (δ18Osoil).
4 Discussion
4.1 Dew benefits cancelled out by heat-drought stress
The benefits of dew on NEP were observed in the early morning hours of 23–24 June before the heatwave (Figure 10). From sunrise to 06:30 on 23 and 24 June, PPFD was at similar levels (Figure 10C), hence higher NEP on 24 June (Figure 10A) might be induced by higher temperature (Figure 10D) as compared to 23 June. But from 06:30 to 07:30, although higher PPFD and temperature on 24 June, NEP was at the similar levels as that on 23 June (Figure 10C), probably induced by higher potential of dew formation as indicated in higher RH on 23 June (Figure 10B).
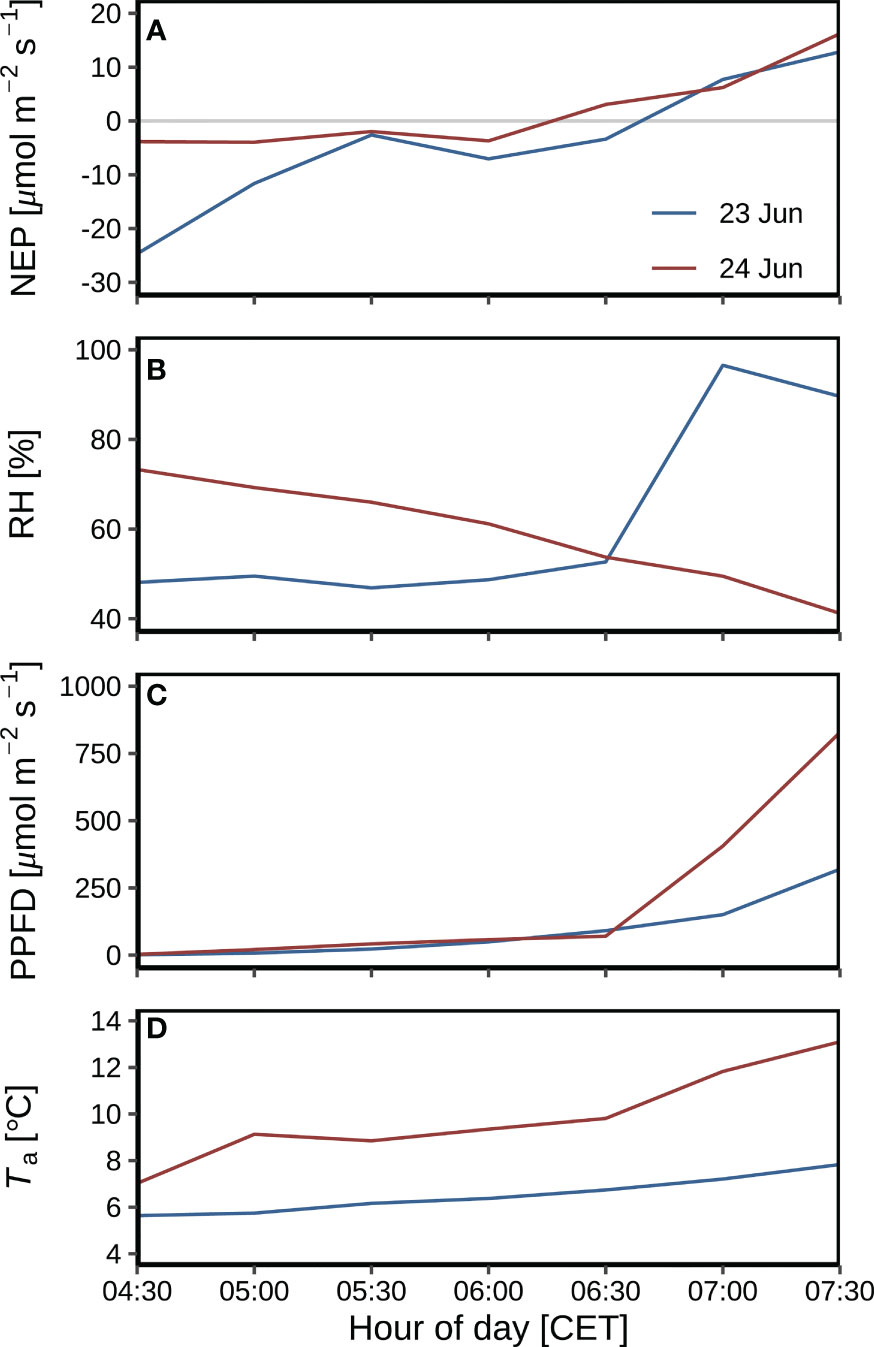
Figure 10 Environmental variables during leaf wetting by dew in the early mornings of 23-24 June before the heatwave: (A) Net ecosystem production (NEP). (B) Leaf wetness. (C) Photosynthetic photon flux density (PPFD). (D) air temperature (Ta) at 2 m agl.
However, with the occurrence of heatwave, dew benefits on NEP were cancelled out, as shown in the reduced NEP with increasing RH (Figure 5C). The chamber tracer experiment at the end of the heatwave showed that dew isotope signal was not transferred to leaf sugar (Figure 8A), indicating that dew water did not participate in carbon assimilation during the heatwave. The possible reason could be derived from the minor contribution (3–14%) of dew water to plant leaf water (Figure 8D), corresponding to previous research that foliar water uptake can only increase leaf water content by 2–11% (Limm et al., 2009). Due to the heat-drought stress, partial stomatal closure and vapor pressure gradient (Li et al., 2023) from leaf to atmosphere (saturated leaf internal environment vs unsaturated atmospheric conditions) might limit the uptake of dew water via leaf, thus most of the dew water during the heatwave could evaporate after sunrise instead of being used for carbon assimilation. Oliveira et al. (2021) showed that dew evaporation processes induced CO2 loss of a maritime pine forest during the rain-free period after wildfire, but Simonin et al. (2009) reported that the reduction in leaf water deficit by fog water can result in improved carbon gain. Therefore, the effect of dew on ecosystem exchange varied by environmental conditions, e.g., environmental stress (Oliveira et al., 2021), the duration of canopy wetting (Simonin et al., 2009), the wettability of the leaf surface (Brewer and Smith, 1994; Hanba et al., 2004), and the foliar water uptake capacity of plants (Simonin et al., 2009).
Our tracer chamber experiment was carried out in a single chamber, and with only once sampling after sunrise, thus it was not possible to investigate the effect of dew on carbon assimilation after dew totally evaporating from surfaces. Future research on hourly resolution and longer period of after-sunrise isotope measurements is recommended to answer this question.
4.2 Ecosystem water and carbon exchange
Despite heat-drought stress, alpine grassland kept high ET during the heatwave (Figure 3A), as long as soil moisture was available (Figure 2C) to meet its evaporative demand (Teuling et al., 2010; Wolf et al., 2013).
De Boeck et al. (2016) showed that a combined heatwave and drought stress induced a reduction in above-ground biomass of alpine grassland plants. In this study, the reduction of NEP by the heat-drought stress was most pronounced during the two hottest days (26 and 27 June; Figures 4D, E) of the heatwave period, Compared to 26 June (25.4 °C; Figure 4B), 27 June showed a longer period of net carbon emission (Figure 4E) despite lower maximum Ta (24.8 °C; Figure 5E) and SWC (Figure 2C). This might be explained by an intensifying effect of drought stress, corresponding to previous research by De Boeck et al. (2016), and the influence of severe heat stress on nighttime refilling. Nevertheless, heat stress was a bit relieved after the heatwave peak, when temperatures only reached 21.5 °C, and NEP recovered immediately. The rapid re-growth ability of alpine plants after heat-drought stress (Brilli et al., 2011) might explain the recovery of NEP during 28–30 June (Figure 3B) after the hottest two days. This also corresponded to the fact that LWP of plants (except Poa) did not significantly decreased at the end of the heatwave (Figure 6). The refilling of plant tissues during the night is a well-known phenomenon (Schulze et al., 2019), helping to relieve water losses during heat-drought stress, and might contribute to the recovery of diurnal NEP on 28–30 June after the peak of the heatwave to the levels slightly lower than the beginning of the heatwave on 23–25 June. The redistribution of soil water by deeper plant roots to the shallower soil depths might provide sufficient soil moisture sources for plant tissue refilling (Burgess and Bleby, 2006) after the peak of the heatwave. This may also explain why the predawn LWP of Alchemilla, Taraxacum, and Trifolium did not decline at the end of the heatwave. Yet, the nighttime refilling mechanism of plant tissues might not always lead to a full recovery of NEP at daily scales, particularly in the case of extreme heat-drought stress. As a result, the most severe decline of NEP was observed during the peak of the heatwave on 26–27 June. The most severe heat stress on 26 June might cause the suppression of tissue refilling during the following night, and thus more pronounced NEP reduction was observed on the next day (27 June) instead of on the hottest day (26 June). The decline of Poa LWP (Figure 6) might be due to their more severe drought stress (as indicated in their higher δ18Olw as compared to the other three genera; Figures 7A, 8A) and dependence on soil moisture (Figure 9B). The decline of Poa LWP had minor effect on NEP, probably due to their small plant size and stress-induced partial stomatal closure. We could not quantify the individual contribution of different genera on ecosystem water and carbon fluxes, and effect of eddy-covariance footprint; thus, we suggest that future research can combine ecosystem-scale eddy-covariance fluxes, footprint models and plant-scale chamber fluxes, complemented by plant community compositions to quantify the effect of different genera on ecosystem exchange.
Dew amount was found to be underestimated by eddy-covariance H2O fluxes because dew occurs on clear and calm nights with stably stratified nocturnal boundary layer (Jacobs et al., 2006; Li et al., 2021). High accuracy weighing lysimeters can be an option to quantify dew amount into ecosystems (Riedl et al., 2022; Ucles et al., 2013). CO2 fluxes can be measured by eddy-variance (Eugster and Siegrist, 2000) and laser (Maier et al., 2022) approaches. For alpine ecosystems, a challenge is the topographic variability that induces large uncertainties of CO2 fluxes (Hammerle et al., 2007). Due to the low quality of CO2 fluxes during nighttime by eddy-covariance measurements, we could not assess the dew effect in darkness. Furthermore, the benefits of dew on ecosystems can continue after dew drying out on vegetation surfaces, which could be traced by high-resolution measurements of H2O and CO2 isotopes, but was not possible in this study based on 3–13 h intervals of destructive isotope sampling. Therefore, additional methods, e.g., synchronized and continuous laser measurements of H2O and CO2 fluxes (Li et al., 2021; Maier et al., 2022) and their isotopic fluxes (Siegwolf et al., 2021) at both plant and ecosystem scales need to be explored to assess the long-term benefits of dew at plant (e.g., among species difference) and ecosystem scales.
4.3 Genus variability
Plant water stress can be induced by low soil moisture or high atmospheric water demand (Liu et al., 2020). In this study, leaf water status of Poa was dependent on soil moisture (Figure 9B), whilst LWP of Alchemilla, Taraxacum, and Trifolium were mainly controlled by atmospheric humidity conditions (Figure 9C). Among the four genera, Poa was most substantially affected by heat-drought stress as indicated in their lower LWP (Figure 6), higher δ18Olw and δ13Cls (Figures 7A, 8A, B). This could be induced by the reliance of Poa on soil moisture (Figure 9B), and lower foliar water uptake of Poa (Figure 8D). More severe drought stress of Poa induced their lower WUE (higher δ13Cls; Figure 8F) as compared to Taraxacum, and Trifolium. Palmately-lobed and hairy leaves of Alchemilla might prolong the dew water retention on their leaves, and thus induced stronger foliar water uptake (Figure 8D) and slightly increased LWP (Figure 6) compared to the other three genera.
Both Alchemilla and Trifolium depended on shallower soil water depth (Figure 7B), but they probably benefited from dew water to maintain their plant water status (Figure 6) in response to heat and drought stress. In the case of Trifolium, the hairy trichomes on the edges of the leaves probably promoted foliar water uptake (Figure 8D). Many high-elevation plants have hairy structures to help reduce water loss, reflect excess radiation, and protect plants from pathogens (Zeng et al., 2013; Hamaoka et al., 2017). The control experiment at the same site by Prechsl et al. (2015) found that C3-grasses did not shift to deeper soil water under drought treatment, indicating that high-elevation plants could benefit from leaf structures regulating their energy and water balances. On the contrary, with deeper soil water sources, the plant water status of Poa strongly declined (Figure 6) in response to heat-drought stress. The maintenance of Taraxacum LWP (Figure 6) in response to heat-drought stress might be beneficial from their waxy leaf surfaces (Figure S1) and deeper soil water uptake (Figure 7B). These results indicated that both soil moisture and atmospheric conditions can affect the ecosystem carbon and water exchange under heat-drought stressed conditions through their varied influence on different plant genera. Due to the similar δ18O values for dew and soil water (Figure 7B), we could not split the contributions of dew (foliar water uptake) and nighttime plant tissue refilling (root water uptake; Schulze et al., 2019) on plant water status using the natural-conditioned data, because both root water uptake and foliar water uptake could occur during nighttime, and dew water can also drip off to the soil (Dawson, 1998) and disturb the isotopic signal of root water uptake fluxes. But our chamber-tracer experiment indicated that the contribution of dew on leaf water can vary from 3% to 14% (Figure 8D). We did not isolate the soil from the vegetation when amending tracer on the grassland plots, hence the tracer could have been directly applied on the soil, and the tracer sprayed on leaf surfaces could also have dripped into the soil. But according to the slight depletion of δ18Olw in our chamber-tracer experiment, the drip-off effect of dew was probably minor compared to direct foliar uptake of dew and atmospheric water vapor. Based on the facts of similar isotopic signal of dew and soil moisture in natural conditions, previous research used excised leaves and isotopically depleted/enriched water to distinguish the two (root and foliar) water sources (Kim and Lee, 2011; Goldsmith et al., 2017). However, these controlled experiments were performed with self-made chambers acting as a heat trap preventing radiative cooling, which is the most important driver of dew formation in natural conditions (Curtis, 1936; Li et al., 2023), and may thus not reflect natural conditions. Future research should therefore apply approaches that allow to estimate the dew influence on plant water under varying soil moisture conditions in the field (Li et al., 2021).
5 Conclusions
The combination of stable isotope analyses in meteoric waters and leaf sugars, meteorological and plant physiological measurements, complemented by eddy-covariance fluxes for H2O vapor and CO2 provided novel insights into the effects of combined heat-drought stress on the water and carbon exchange of an alpine grassland.
(1) Before the heatwave, NEP increased with RH levels, but the dew benefits were cancelled out during the heatwave. NEP decreased with RH levels at the beginning of the heatwave, and showed no significant correlation with leaf wetness at the later stages of the heatwave.
(2) The isotope signal of amended dew in the chamber tracer experiment was not transferred to leaf sugar, indicating that dew water did not participate in the carbon assimilation. The minor effect of dew on NEP might be derived from low contribution (3-14%) of dew in leaf water, and the partial stomatal closure induced by heat-drought stress.
(3) NEP reduction was most severe on the hottest two days, with the shift from net ecosystem uptake to net ecosystem emission on the second hottest day just after the peak of the heatwave, indicating that the heat effect was intensified by drought stress.
(4) The recovery of NEP after the peak of the heatwave indicated the regrowth ability of alpine plants. Plants benefited from the minor effect of heat-drought stress on their water status, which could be recovered via the refilling of plant tissues during nighttime.
(5) The among-genera difference of leaf water status and isotopes in response to heat-drought stress and dew occurrence indicated the varied controls of soil moisture and atmospheric evaporative demand on plant water status, with soil-dependent genera suffering from more severe drought stress compared to the atmospheric-reliant genera.
Our results thus reveal that dew influence on ecosystem water and carbon exchange varied by the levels and stages of environmental stress and plant physiology.
Data availability statement
The datasets presented in this study can be found in the ETH Zurich research collection at https://doi.org/10.3929/ethz-b-000537314.
Author contributions
YL, WE, AR, and ML designed the experiment. YL conducted the field and laboratory work. YL and ML performed the purification of plant sugars. YL wrote and revised the manuscript, with contributions and feedback from NB, WE, ML, FA and AR. All authors contributed to the article and approved the submitted version. WE passed away on 23 May 2022 before the final submission of this study.
Funding
This study was funded by the Swiss National Science Foundation (grant no. 175733). We also acknowledge funding from the EU project SUPER-G (Developing SUstainable PERmanent Grassland systems and polices; project 774124) and open access funding by ETH Zurich. ML was funded by the Swiss National Science Foundation (grant no. 179978).
Acknowledgments
We thank Dr. Lukas Hörtnagl (Grassland Sciences group at ETH Zurich) and Dr. Shiva Ghiasi (Agroscope, the Swiss Center of Excellence for Agricultural Research) for flux data processing. We thank Annika Ackermann and Dr. Roland A. Werner (Grassland Sciences group at ETH Zurich) as well as Manuela Oettli and Dr. Matthias Saurer (Stable Isotope Research Center at WSL Birmensdorf) for their assistance with isotope analyses. We further thank Oliver Rehmann at WSL for laboratory assistance, Tobia Lezuo at ETH Zurich for field work, as well as the AgroVet-Strickhof staff (Eschikon, Switzerland) and the technician team of the Grassland Sciences group for their field site support.
Conflict of interest
The authors declare that the research was conducted in the absence of any commercial or financial relationships that could be construed as a potential conflict of interest.
Publisher’s note
All claims expressed in this article are solely those of the authors and do not necessarily represent those of their affiliated organizations, or those of the publisher, the editors and the reviewers. Any product that may be evaluated in this article, or claim that may be made by its manufacturer, is not guaranteed or endorsed by the publisher.
Supplementary material
The Supplementary Material for this article can be found online at: https://www.frontiersin.org/articles/10.3389/fpls.2023.1136037/full#supplementary-material
References
Aubinet, M., Vesala, T., Papale, D. (2012). Eddy covariance: a practical guide to measurement and data analysis (Dordrecht: Springer). doi: 10.1007/978-94-007-2351-1
Bachmann, D., Gockele, A., Ravenek, J. M., Roscher, C., Strecker, T., Weigelt, A., et al. (2015). No evidence of complementary water use along a plant species richness gradient in temperate experimental grasslands. PloS One 10 (1), e0116367. doi: 10.1371/journal.pone.0116367
Barriopedro, D., Fischer, E. M., Luterbacher, J., Trigo, R. M., García-Herrera, R. (2011). The hot summer of 2010: redrawing the temperature record map of Europe. Science 332 (6026), 220–224. doi: 10.1126/science.1201224
Bögelein, R., Lehmann, M. M., Thomas, F. M. (2019). Differences in carbon isotope leaf-to-phloem fractionation and mixing patterns along a vertical gradient in mature European beech and Douglas fir. New Phytol. 222 (4), 1803–1815. doi: 10.1111/nph.15735
Boucher, J. F., Munson, A. D., Bernier, P. Y. (1995). Foliar absorption of dew influences shoot water potential and root-growth in pinus-strobus seedlings. Tree Physiol. 15 (12), 819–823. doi: 10.1093/treephys/15.12.819
Brandes, E., Kodama, N., Whittaker, K., Weston, C., Rennenberg, H., Keitel, C., et al. (2006). Short-term variation in the isotopic composition of organic matter allocated from the leaves to the stem of pinus sylvestris: effects of photosynthetic and postphotosynthetic carbon isotope fractionation. Global Change Biol. 12 (10), 1922–1939. doi: 10.1111/j.1365-2486.2006.01205.x
Brewer, C. A., Smith, W. K. (1994). Influence of simulated dewfall on photosynthesis and yield in soybean isolines (Glycine max [L.] merr. cv williams) with different trichome densities. Int. J. Plant Sci. 155 (4), 460–466. doi: 10.1086/297183
Brilli, F., Hörtnagl, L., Hammerle, A., Haslwanter, A., Hansel, A., Loreto, F., et al. (2011). Leaf and ecosystem response to soil water availability in mountain grasslands. Agric. For. Meteorology 151 (12), 1731–1740. doi: 10.1016/j.agrformet.2011.07.007
Burgess, S. S. O., Bleby, T. M. (2006). Redistribution of soil water by lateral roots mediated by stem tissues. J. Exp. Bot. 57 (12), 3283–3291. doi: 10.1093/jxb/erl085
Cernusak, L. A., Pate, J. S., Farquhar, G. D. (2002). Diurnal variation in the stable isotope composition of water and dry matter in fruiting lupinus angustifolius under field conditions. Plant Cell Environ. 25 (7), 893–907. doi: 10.1046/j.1365-3040.2002.00875.x
Ciais, P., Reichstein, M., Viovy, N., Granier, A., Ogee, J., Allard, V., et al. (2005). Europe-Wide reduction in primary productivity caused by the heat and drought in 2003. Nature 437 (7058), 529–533. doi: 10.1038/nature03972
Clus, O., Ortega, P., Muselli, M., Milimouk, I., Beysens, D. (2008). Study of dew water collection in humid tropical islands. J. Hydrol 361 (1-2), 159–171. doi: 10.1016/j.jhydrol.2008.07.038
Coplen, T. B. (2011). Guidelines and recommended terms for expression of stable-isotope-ratio and gas-ratio measurement results. Rapid Commun. Mass Spectrometry 25 (17), 2538–2560. doi: 10.1002/rcm.5129
Cremonese, E., Filippa, G., Galvagno, M., Siniscalco, C., Oddi, L., di Cella, U. M., et al. (2017). Heat wave hinders green wave: the impact of climate extreme on the phenology of a mountain grassland. Agric. For. Meteorology 247, 320–330. doi: 10.1016/j.agrformet.2017.08.016
Curtis, O. F. (1936). Leaf temperatures and the cooling of leaves by radiation. Plant Physiol. 11 (2), 343–364. doi: 10.1104/pp.11.2.343
Dawson, T. E. (1998). Fog in the California redwood forest: ecosystem inputs and use by plants. Oecologia 117 (4), 476–485. doi: 10.1007/s004420050683
Dawson, T. E., Goldsmith, G. R. (2018). The value of wet leaves. New Phytol. 219 (4), 1156–1169. doi: 10.1111/nph.15307
De Boeck, H. J., Bassin, S., Verlinden, M., Zeiter, M., Hiltbrunner, E. (2016). Simulated heat waves affected alpine grassland only in combination with drought. New Phytol. 209 (2), 531–541. doi: 10.1111/nph.13601
Dongmann, G., Nurnberg, H. W., Forstel, H., Wagener, K. (1974). On the enrichment of H218O in the leaves of transpiring plants. Radiat. Environ. Biophysics 11 (1), 41–52. doi: 10.1007/BF01323099
Eugster, W., Siegrist, F. (2000). The influence of nocturnal CO2 advection on CO2 flux measurements. Basic Appl. Ecol. 1 (2), 177–188. doi: 10.1078/1439-1791-00028
Farquhar, G. D., Lloyd, J. (1993). “Carbon and oxygen isotope effects in the exchange of carbon dioxide between terrestrial plants and the atmosphere,” in Stable isotopes and plant carbon-water relations. Eds. Ehleringer, J. R., Hall, A. E., Farquhar, G. D. (San Diego: Academic Press), 47–70. doi: 10.1016/B978-0-08-091801-3.50011-8
Gehre, M., Geilmann, H., Richter, J., Werner, R. A., Brand, W. A. (2004). Continuous flow 2H/1H and 18O/16O analysis of water samples with dual inlet precision. Rapid Commun. mass spectrometry 18 (22), 2650–2660. doi: 10.1002/rcm.1672
Gerlein-Safdi, C., Gauthier, P. P. G., Caylor, K. K. (2018). Dew-induced transpiration suppression impacts the water and isotope balances of colocasia leaves. Oecologia 187 (4), 1041–1051. doi: 10.1007/s00442-018-4199-y
Gessler, A., Brandes, E., Keitel, C., Boda, S., Kayler, Z. E., Granier, A., et al. (2013). The oxygen isotope enrichment of leaf-exported assimilates–does it always reflect lamina leaf water enrichment? New Phytol. 200 (1), 144–157. doi: 10.1111/nph.12359
Gharun, M., Hortnagl, L., Paul-Limoges, E., Ghiasi, S., Feigenwinter, I., Burri, S., et al. (2020). Physiological response of Swiss ecosystems to 2018 drought across plant types and elevation. Philos. T R Soc. B 375 (1810), 20190521. doi: 10.1098/rstb.2019.0521
Goldsmith, G. R., Lehmann, M. M., Cernusak, L. A., Arend, M., Siegwolf, R. T. W. (2017). Inferring foliar water uptake using stable isotopes of water. Oecologia 184 (4), 763–766. doi: 10.1007/s00442-017-3917-1
Hamaoka, N., Yasui, H., Yamagata, Y., Inoue, Y., Furuya, N., Araki, T., et al. (2017). A hairy-leaf gene, BLANKET LEAF, of wild oryza nivara increases photosynthetic water use efficiency in rice. Rice 10 (1), 20. doi: 10.1186/s12284-017-0158-1
Hammerle, A., Haslwanter, A., Schmitt, M., Bahn, M., Tappeiner, U., Cernusca, A., et al. (2007). Eddy covariance measurements of carbon dioxide, latent and sensible energy fluxes above a meadow on a mountain slope. Bound-Lay Meteorol 122 (2), 397–416. doi: 10.1007/s10546-006-9109-x
Hanba, Y. T., Moriya, A., Kimura, K. (2004). Effect of leaf surface wetness and wettability on photosynthesis in bean and pea. Plant Cell Environ. 27 (4), 413–421. doi: 10.1046/j.1365-3040.2004.01154.x
Hiller, R., Zeeman, M. J., Eugster, W. (2008). Eddy-covariance flux measurements in the complex terrain of an alpine valley in Switzerland. Bound-Lay Meteorol 127 (3), 449–467. doi: 10.1007/s10546-008-9267-0
Horiguchi, I., Sugaya, H., Tani, H. (1982). The measurement of longwave radiation properties upon plastic films used in greenhouses. J. Agric. Meteorology 38 (1), 9–14. doi: 10.2480/agrmet.38.9
Horita, J., Wesolowski, D. J. (1994). Liquid-vapor fractionation of oxygen and hydrogen isotopes of water from the freezing to the critical temperature. Geochimica Cosmochimica Acta 58 (16), 3425–3437. doi: 10.1016/0016-7037(94)90096-5
IAEA (2009). Reference sheet for VSMOW2 and SLAP2 international measurement standards. Int. Atomic Energy Agency (IAEA) Vienna Austria pp, 8. Available at: https://nucleus.iaea.org/sites/ReferenceMaterials/Shared%20Documents/ReferenceMaterials/StableIsotopes/VSMOW2/VSMOW2_SLAP2.pdf.
Jacobs, A. F. G., Heusinkveld, B. G., Kruit, R. J. W., Berkowicz, S. M. (2006). Contribution of dew to the water budget of a grassland area in the Netherlands. Water Resour Res. 42 (3), W03415. doi: 10.1029/2005WR004055
Keller, P. (2006). Vegetationskundliche Untersuchungen und Ertrag der Grünlandflächen im Gebiet der ETH-Forschungsstation Alp Weissenstein GR (Zurich, Switzerland: University of Zurich), 119 pp.
Kim, K., Lee, X. (2011). Transition of stable isotope ratios of leaf water under simulated dew formation. Plant Cell Environ. 34 (10), 1790–1801. doi: 10.1111/j.1365-3040.2011.02375.x
Lehmann, M. M., Goldsmith, G. R., Mirande-Ney, C., Weigt, R. B., Schonbeck, L., Kahmen, A., et al. (2020). The 18O-signal transfer from water vapour to leaf water and assimilates varies among plant species and growth forms. Plant Cell Environ. 43 (2), 510–523. doi: 10.1111/pce.13682
Lehmann, M. M., Goldsmith, G. R., Schmid, L., Gessler, A., Saurer, M., Siegwolf, R. T. W. (2018). The effect of 18O-labelled water vapour on the oxygen isotope ratio of water and assimilates in plants at high humidity. New Phytol. 217 (1), 105–116. doi: 10.1111/nph.14788
Li, Y., Aemisegger, F., Riedl, A., Buchmann, N., Eugster, W. (2021). The role of dew and radiation fog inputs in the local water cycling of a temperate grassland during dry spells in central Europe. Hydrol. Earth Syst. Sci. 25 (5), 2617–2648. doi: 10.5194/hess-25-2617-2021
Li, Y., Riedl, A., Eugster, W., Buchmann, N., Cernusak, L. A., Lehmann, M. M., et al. (2023). The role of radiative cooling and leaf wetting in air–leaf water exchange during dew and radiation fog events in a temperate grassland. Agric. For. Meteorology 328, 109256. doi: 10.1016/j.agrformet.2022.109256
Li, L. F., Zheng, Z. Z., Biederman, J. A., Qian, R. Y., Ran, Q. W., Zhang, B., et al. (2020). Drought and heat wave impacts on grassland carbon cycling across hierarchical levels. Plant Cell Environ. doi: 10.1111/pce.13767
LI-COR (2019). Eddy covariance processing software (Version 7.0.6) (Bad Homburg, Germany: LI−COR. LI−COR, Inc). Available at: https://www.licor.com/env/products/eddy_covariance/software.html.
Limm, E. B., Simonin, K. A., Bothman, A. G., Dawson, T. E. (2009). Foliar water uptake: a common water acquisition strategy for plants of the redwood forest. Oecologia 161 (3), 449–459. doi: 10.1007/s00442-009-1400-3
Liu, L., Gudmundsson, L., Hauser, M., Qin, D., Li, S., Seneviratne, S. I. (2020). Soil moisture dominates dryness stress on ecosystem production globally. Nat. Commun. 11 (1), 4892. doi: 10.1038/s41467-020-18631-1
Maier, R., Hörtnagl, L., Buchmann, N. (2022). Greenhouse gas fluxes (CO2, N2O and CH4) of pea and maize during two cropping seasons: drivers, budgets, and emission factors for nitrous oxide. Sci. Total Environ. 849, 157541. doi: 10.1016/j.scitotenv.2022.157541
MeteoSwiss. (2019). “Climate bulletin summer 2019.” In.: Federal Office for Meteorology and Climatology MeteoSwiss. Available at: https://www.meteoswiss.admin.ch/home/search.subpage.html/en/data/publications/2019/9/klimabulletin-sommer-2019.html?pageIndex=1&query=Climate%20bulletin%20summer%202019&tab=search_tab.
Michna, P., Eugster, W., Hiller, R. V., Zeeman, M. J., Wanner, H. (2013). Topoclimatological case-study of alpine pastures near the albula pass in the eastern Swiss Alps. Geogr. Helv. 68 (4), 249–263. doi: 10.5194/gh-68-249-2013
Mitchell, D., Kornhuber, K., Huntingford, C., Uhe, P. (2019). The day the 2003 European heatwave record was broken. Lancet Planetary Health 3 (7), e290–e292. doi: 10.1016/S2542-5196(19)30106-8
Oliveira, B. R. F., Schaller, C., Keizer, J. J., Foken, T. (2021). Estimating immediate post-fire carbon fluxes using the eddy-covariance technique. Biogeosciences 18 (1), 285–302. doi: 10.5194/bg-18-285-2021
Overpeck, J. T. (2013). Climate science: the challenge of hot drought. Nature 503 (7476), 350–351. doi: 10.1038/503350a
Prechsl, U. E., Burri, S., Gilgen, A. K., Kahmen, A., Buchmann, N. (2015). No shift to a deeper water uptake depth in response to summer drought of two lowland and sub-alpine C3-grasslands in Switzerland. Oecologia 177 (1), 97–111. doi: 10.1007/s00442-014-3092-6
Prechsl, U. E., Gilgen, A. K., Kahmen, A., Buchmann, N. (2014). Reliability and quality of water isotope data collected with a lowbudget rain collector. Rapid Commun. Mass Spectrometry 28 (8), 879–885. doi: 10.1002/rcm.6852
R Core Team (2021). R: a language and environment for statistical computing (Vienna, Austria: R Foundation for Statistical Computing).
Riedl, A., Li, Y., Eugster, J., Buchmann, N., Eugster, W. (2022). High-accuracy weighing micro-lysimeter system for long-term measurements of non-rainfall water inputs to grasslands. Hydrology and Earth System Sciences 26(1), 91–116. doi: 10.5194/hess-26-91-2022
Rinne, K. T., Saurer, M., Streit, K., Siegwolf, R. T. W. (2012). Evaluation of a liquid chromatography method for compound-specific δ13C analysis of plant carbohydrates in alkaline media. Rapid Commun. Mass Spectrometry 26 (18), 2173–2185. doi: 10.1002/rcm.6334
Schulze, E., Beck, E., Buchmann, N., Clemens, S., Müller-Hohenstein, M., Scherer-Lorenzen, M. (2019). Plant ecology (Heidelberg, Germany: Springer Berlin, Heidelberg). doi: 10.1007/978-3-662-56233-8
Siegwolf, R., Lehmann, M., Goldsmith, G., Churakova, O., Mirande-Ney, C., Gruspante, G., et al. (2021). The dual c and O isotope–gas exchange model: a concept review for understanding plant responses to the environment and its application in tree rings. Authorea Preprints. doi: 10.22541/au.163844646.68129291/v1
Simonin, K. A., Santiago, L. S., Dawson, T. E. (2009). Fog interception by sequoia sempervirens (D. don) crowns decouples physiology from soil water deficit. Plant Cell Environ. 32 (7), 882–892. doi: 10.1111/j.1365-3040.2009.01967.x
Steel, R. G. (1997). Pinciples and procedures of statistics a biometrical approach (Auckland: McGraw-Hill Kogakusha, Ltd.), 633 pp.
Stull, R. B. (1988). “Stable boundary layer,” in An introduction to boundary layer meteorology. Ed. Stull, R. B. (Dordrecht: Springer, Dordrecht), 499–543. doi: 10.1007/978-94-009-3027-8_12
Teuling, A. J., Seneviratne, S. I., Stöckli, R., Reichstein, M., Moors, E., Ciais, P., et al. (2010). Contrasting response of European forest and grassland energy exchange to heatwaves. Nat. Geosci. 3 (10), 722–727. doi: 10.1038/ngeo950
Uclés, O., Villagarcía, L., Cantón, Y., Domingo, F. (2013). Microlysimeter station for long term non-rainfall water input and evaporation studies. Agri. For. Meteorology 182, 13–20. doi: 10.1016/j.agrformet.2013.07.017
Wang, A., Siegwolf, R. T. W., Joseph, J., Thomas, F. M., Werner, W., Gessler, A., et al. (2021). Effects of soil moisture, needle age and leaf morphology on carbon and oxygen uptake, incorporation and allocation: a dual labeling approach with 13CO2 and H218O in foliage of a coniferous forest. Tree Physiol. 41 (1), 50–62. doi: 10.1093/treephys/tpaa114
Werner, R. A., Brand, W. A. (2001). Referencing strategies and techniques in stable isotope ratio analysis. Rapid Commun. Mass Spectrometry 15 (7), 501–519. doi: 10.1002/rcm.258
WMO (2019). European Heatwave sets new temperature records (Geneva, Switzerland: World Meteorological Organization).
Wolf, S., Eugster, W., Ammann, C., Häni, M., Zielis, S., Hiller, R., et al. (2013). Contrasting response of grassland versus forest carbon and water fluxes to spring drought in Switzerland. Environ. Res. Lett. 8 (3), 35007. doi: 10.1088/1748-9326/8/3/035007
Yakir, D., Deniro, M. J. (1990). Oxygen and hydrogen isotope fractionation during cellulose metabolism in Lemna-Gibba l. Plant Physiol. 93 (1), 325–332. doi: 10.1104/pp.93.1.325
Zeeman, M. J., Hiller, R., Gilgen, A. K., Michna, P., Plüss, P., Buchmann, N., et al. (2010). Management and climate impacts on net CO2 fluxes and carbon budgets of three grasslands along an elevational gradient in Switzerland. Agric. For. Meteorology 150 (4), 519–530. doi: 10.1016/j.agrformet.2010.01.011
Zeng, Y., Zhu, Y., Lian, L., Xie, H., Zhang, J., Xie, H. (2013). Genetic analysis and fine mapping of the pubescence gene GL6 in rice (Oryza sativa l.). Chin. Sci. Bull. 58 (24), 2992–2999. doi: 10.1007/s11434-013-5737-y
Zscheischler, J., Fischer, E. M. (2020). The record-breaking compound hot and dry 2018 growing season in Germany. Weather Clim Extreme 29, 100270. doi: 10.1016/j.wace.2020.100270
Zscheischler, J., Martius, O., Westra, S., Bevacqua, E., Raymond, C., Horton, R. M., et al. (2020). A typology of compound weather and climate events. Nat. Rev. Earth Env. 1 (7), 333–347. doi: 10.1038/s43017-020-0060-z
Keywords: heatwave, dew, alpine grassland, drought, stable isotope, net ecosystem production
Citation: Li Y, Eugster W, Riedl A, Lehmann MM, Aemisegger F and Buchmann N (2023) Dew benefits on alpine grasslands are cancelled out by combined heatwave and drought stress. Front. Plant Sci. 14:1136037. doi: 10.3389/fpls.2023.1136037
Received: 02 January 2023; Accepted: 04 April 2023;
Published: 09 May 2023.
Edited by:
Biao Jin, Yangzhou University, ChinaReviewed by:
Georg Leitinger, University of Innsbruck, AustriaRaquel Lobo-do-Vale, University of Lisbon, Portugal
Copyright © 2023 Li, Eugster, Riedl, Lehmann, Aemisegger and Buchmann. This is an open-access article distributed under the terms of the Creative Commons Attribution License (CC BY). The use, distribution or reproduction in other forums is permitted, provided the original author(s) and the copyright owner(s) are credited and that the original publication in this journal is cited, in accordance with accepted academic practice. No use, distribution or reproduction is permitted which does not comply with these terms.
*Correspondence: Yafei Li, l.yafei@outlook.com; yafei.li@usys.ethz.ch