Marine Debris Floating in Arctic and Temperate Northeast Atlantic Waters
 Mine B. Tekman
 Lars Gutow
 Melanie Bergmann
- Alfred-Wegener-Institut, Helmholtz-Zentrum für Polar- und Meeresforschung, Bremerhaven, Germany
Floating marine debris is ubiquitous in marine environments but knowledge about quantities in remote regions is still limited. Here, we present the results of an extensive survey of floating marine debris by experts, trained scientists from fields other than pollution or non-professional citizen scientists. A total of 276 visual ship-based surveys were conducted between 2015 and 2020 in the Northeast (NE) Atlantic from waters off the Iberian Peninsula to the Central Arctic, however, with a focus on Arctic waters. Spatiotemporal variations among regional seas (Central Arctic, Barents Sea, Greenland Sea, Norwegian Sea, North Sea) and oceanic regions (Arctic waters and the temperate NE Atlantic) were explored. The overall median debris concentration was 11 items km-2, with considerable variability. The median concentration was highest in the North Sea with 19 items km-2. The Nordic seas, except the Central Arctic showed median concentrations ranging from 9 to 13 items km-2. Plastic accounted for 91% of all floating items. Miscellaneous fragments, films, ropes and nets, packaging materials, expanded polystyrene and straps were the most frequently observed plastic types. Although the median debris concentration in the Central Arctic was zero, this region was not entirely free of floating debris. The variations between regional seas and oceanic regions were statistically not significant indicating a continuous supply by a northward transportation of floating debris. The data show a slight annual decrease and clear seasonal differences in debris concentrations with higher levels observed during summer. A correlation between debris concentrations and environmental and spatial variables was found, explaining partly the variability in the observations. Pollution levels were 500 times lower than those recorded on the seafloor indicating the seafloor as a sink for marine debris. The Arctic was characterised by similar pollution levels as regions in temperate latitudes highlighting that Arctic ecosystems face threats from plastic pollution, which add to the effects of rapid climate change.
Introduction
Marine debris refers to “any solid, manufactured or processed material disposed of or abandoned in marine environments” (UNEP, 2005). By definition, this comprises materials such as glass, metal or processed wood. However, plastics account for the great majority of marine debris in most regions of the oceans (Bergmann et al., 2017b). Global plastic emissions from land into aquatic environments were estimated at 19 – 23 million metric tons (MMT) in 2016, which constitute 11% of the annual global plastic production and are projected to reach up to 90 MMT by 2030 under current growth trajectories (Borrelle et al., 2020). Its accumulation in the environment is poorly reversible, especially in the aquatic realm, where it affects biogeochemical processes, habitats and species and has societal impacts (MacLeod et al., 2021). Since plastic production has outpaced the global capacity for monitoring and governance, plastic pollution, along with other man-made contaminants, is assumed to exceed safe planetary boundaries (Persson et al., 2022).
More than 2,000 marine species have been reported to encounter plastics in their natural habitats (Tekman et al., 2022). The severity and type of impact is mostly evaluated in relation to the size of the plastic debris. For example, there is still debate about the effects of microplastic (< 5mm) on marine organisms because of unrealistically high particle concentrations applied in many laboratory experiments (Koelmans et al., 2022). On the contrary, the effects of interactions with macroplastics are well-established. Entanglement with and ingestion of macroplastics can cause suffocation, restrained mobility, obstruction, false sense of satiety and, ultimately, also the death of marine organisms (Kühn and van Franeker, 2020; Tekman et al., 2022). Because of continuous campaigns by NGOs driven by the intensive scientific research efforts in recent years, plastic pollution has become widely acknowledged as a global threat. Accordingly, the fifth United Nations Environment Assembly adopted a resolution to negotiate a legally binding global treaty by 2024 to combat plastic pollution (Bundela and Pandey, 2022).
An estimated amount of more than 5 trillion plastic pieces are floating at the surface of the oceans (Eriksen et al., 2014). Floating marine debris is known to accumulate in subtropical gyres (Lebreton et al., 2018), enclosed basins (Everaert et al., 2020), or coastal margins (Olivelli et al., 2020). However, relatively little is known about concentrations of floating marine debris over vast stretches of the open ocean, especially in remote geographic regions such as the polar oceans (Bergmann et al., 2022). Recent surveys revealed substantial amounts of marine debris on Arctic beaches (Bergmann et al., 2017a; Falk-Andersson et al., 2019; Haarr et al., 2020) and on the deep Arctic seafloor (Parga Martínez et al., 2020). Meanwhile, it has been well established that polar regions have become significantly polluted by plastics and that direct land-based input is only one part of the problem (Bergmann et al., 2017a; Suaria et al., 2020). The Arctic Ocean is connected to the global oceanic circulation system via the Bering Strait, the Canadian Arctic Archipelago, Davis Strait, Fram Strait, and the entrance to the Barents Sea (Beszczynska-Möller et al., 2011). This complex circulation pattern complicates the identification of sources and pathways of Arctic plastic pollution. Nevertheless, a decade of intense research highlighted the high contribution of sea-based input (Bergmann et al., 2017a; Węsławski and Kotwicki, 2018), long-distance transport (Cózar et al., 2017), and deposition and accumulation on the seafloor (Parga Martínez et al., 2020).
A wide variety of sampling and analysis methods are used to investigate the distribution of floating debris. Neuston nets have been widely used, yet this method allows to sample only a limited surface area for macroplastic and requires dedicated ship time (Ryan et al., 2020). Floating marine debris has also been reported from aerial surveys or satellite imagery (Pichel et al., 2007; Bergmann et al., 2016; Lebreton et al., 2018; Biermann et al., 2020; Unger et al., 2021). However, small items are easily missed by these methods. On visual ship-based surveys, trained observers (Chiu et al., 2020) can quantify and characterise floating debris even without specific scientific expertise. These surveys can be conducted opportunistically from virtually any kind of ship, including ferries (Campana et al., 2018) or pole-and-line tuna fishing boats (Chambault et al., 2018). However, survey locations are bound to the ship’s route and dependent on the availability of observers and conditions (Chambault et al., 2018; Gutow et al., 2018; Connan et al., 2021), which can induce bias in surveyed regions. Moreover, different qualification and characterisation criteria can impede the comparability of debris concentrations among studies.
Standardised sampling campaigns by citizen scientists have been widely used to assess marine debris pollution (e.g. Hidalgo-Ruz and Thiel, 2015; Nelms et al., 2017; Falk-Andersson et al., 2019; Haarr et al., 2020; Gacutan et al., 2022). Even in the remote Arctic, the distribution of marine debris was reported based on the data and samples collected by trained non-professionals or local people (Bergmann et al., 2017a; Bergmann et al., 2019; Bourdages et al., 2020; Ershova et al., 2021). Unlike public campaigns for beach debris, visual surveys of floating debris by citizen scientists (Chiu et al., 2020) are not common. Currently, the OSPAR marine debris monitoring program for the Northeast (NE) Atlantic involves beach surveys as well as quantification of ingested plastics by northern fulmars (Fulmarus glacialis) in the North Sea only. Extending the program by standardized quantifications of floating marine debris by ship-based visual surveys could fill some blind spots, and promote environmental awareness, especially if citizen scientists were involved in data collection. Accordingly, a recent experimental evaluation of visual surveys in the Mediterranean Sea suggested a standardisation, which considers the potentially confounding effects of ship type, speed, survey effort, size detection limits, observer experiences and weather conditions on the results (Arcangeli et al., 2020).
In the present study, we investigate the spatial and temporal distribution of floating marine debris in the NE Atlantic and Arctic Ocean by ship-based visual surveys partly conducted by citizen scientists during ten expeditions between 2015 and 2020. The effect of spatial, annual and seasonal variations on debris concentrations as well as on size and material compositions of floating anthropogenic items in Arctic waters, in the temperate NE Atlantic and in the regional seas (Central Arctic, Barents Sea, Norwegian Sea, Greenland Sea, North Sea) were explored. Specific environmental variables were tested for their potential to control the distribution of floating marine debris. Moreover, debris captured opportunistically in pelagic and bottom trawls around Svalbard and hand-picked floating plastics from the Fram Strait provided additional information regarding the origin and distribution of marine debris in Arctic waters. Finally, the floating debris data gathered in the Greenland Sea were compared with quantities reported from the seafloor in the same study region to identify potential sinks of plastic debris in this area and help answering the question ‘Where is all the plastic?’ (Thompson et al., 2004; van Sebille et al., 2015).
Material and Methods
Visual Surveys
A vessel-based surface observer programme (visual surveys) was conducted in the Northeast (NE) Atlantic between 2015 and 2020 during ten expeditions of the German research vessels Heincke, Maria S. Merian and Polarstern, and the sailing vessel Antigua (Figure 1). The amount of floating debris was assessed from the moving ship (average speed ± SD: 9.4 ± 2.2 kn) during times of daylight whenever the weather and sea conditions were suitable for the observers to perform a visual survey and the waves were deemed not too high to submerge debris items. In addition to marine debris experts, trained scientists from fields other than marine pollution and non-professional citizen scientists composed of cruise tourists and crew of SV Antigua were carefully instructed and conducted surveys to increase the spatial coverage. The surveys were conducted by one observer, unless a practical training was required for others. A total of 276 visual surveys was conducted (Table S1). Overall, the duration of each survey was approximately 1 hour (average ± SD duration: 59 ± 16 minutes). Sometimes it had to be shortened when the ship stopped for station work, or due to deteriorating weather and sea conditions.
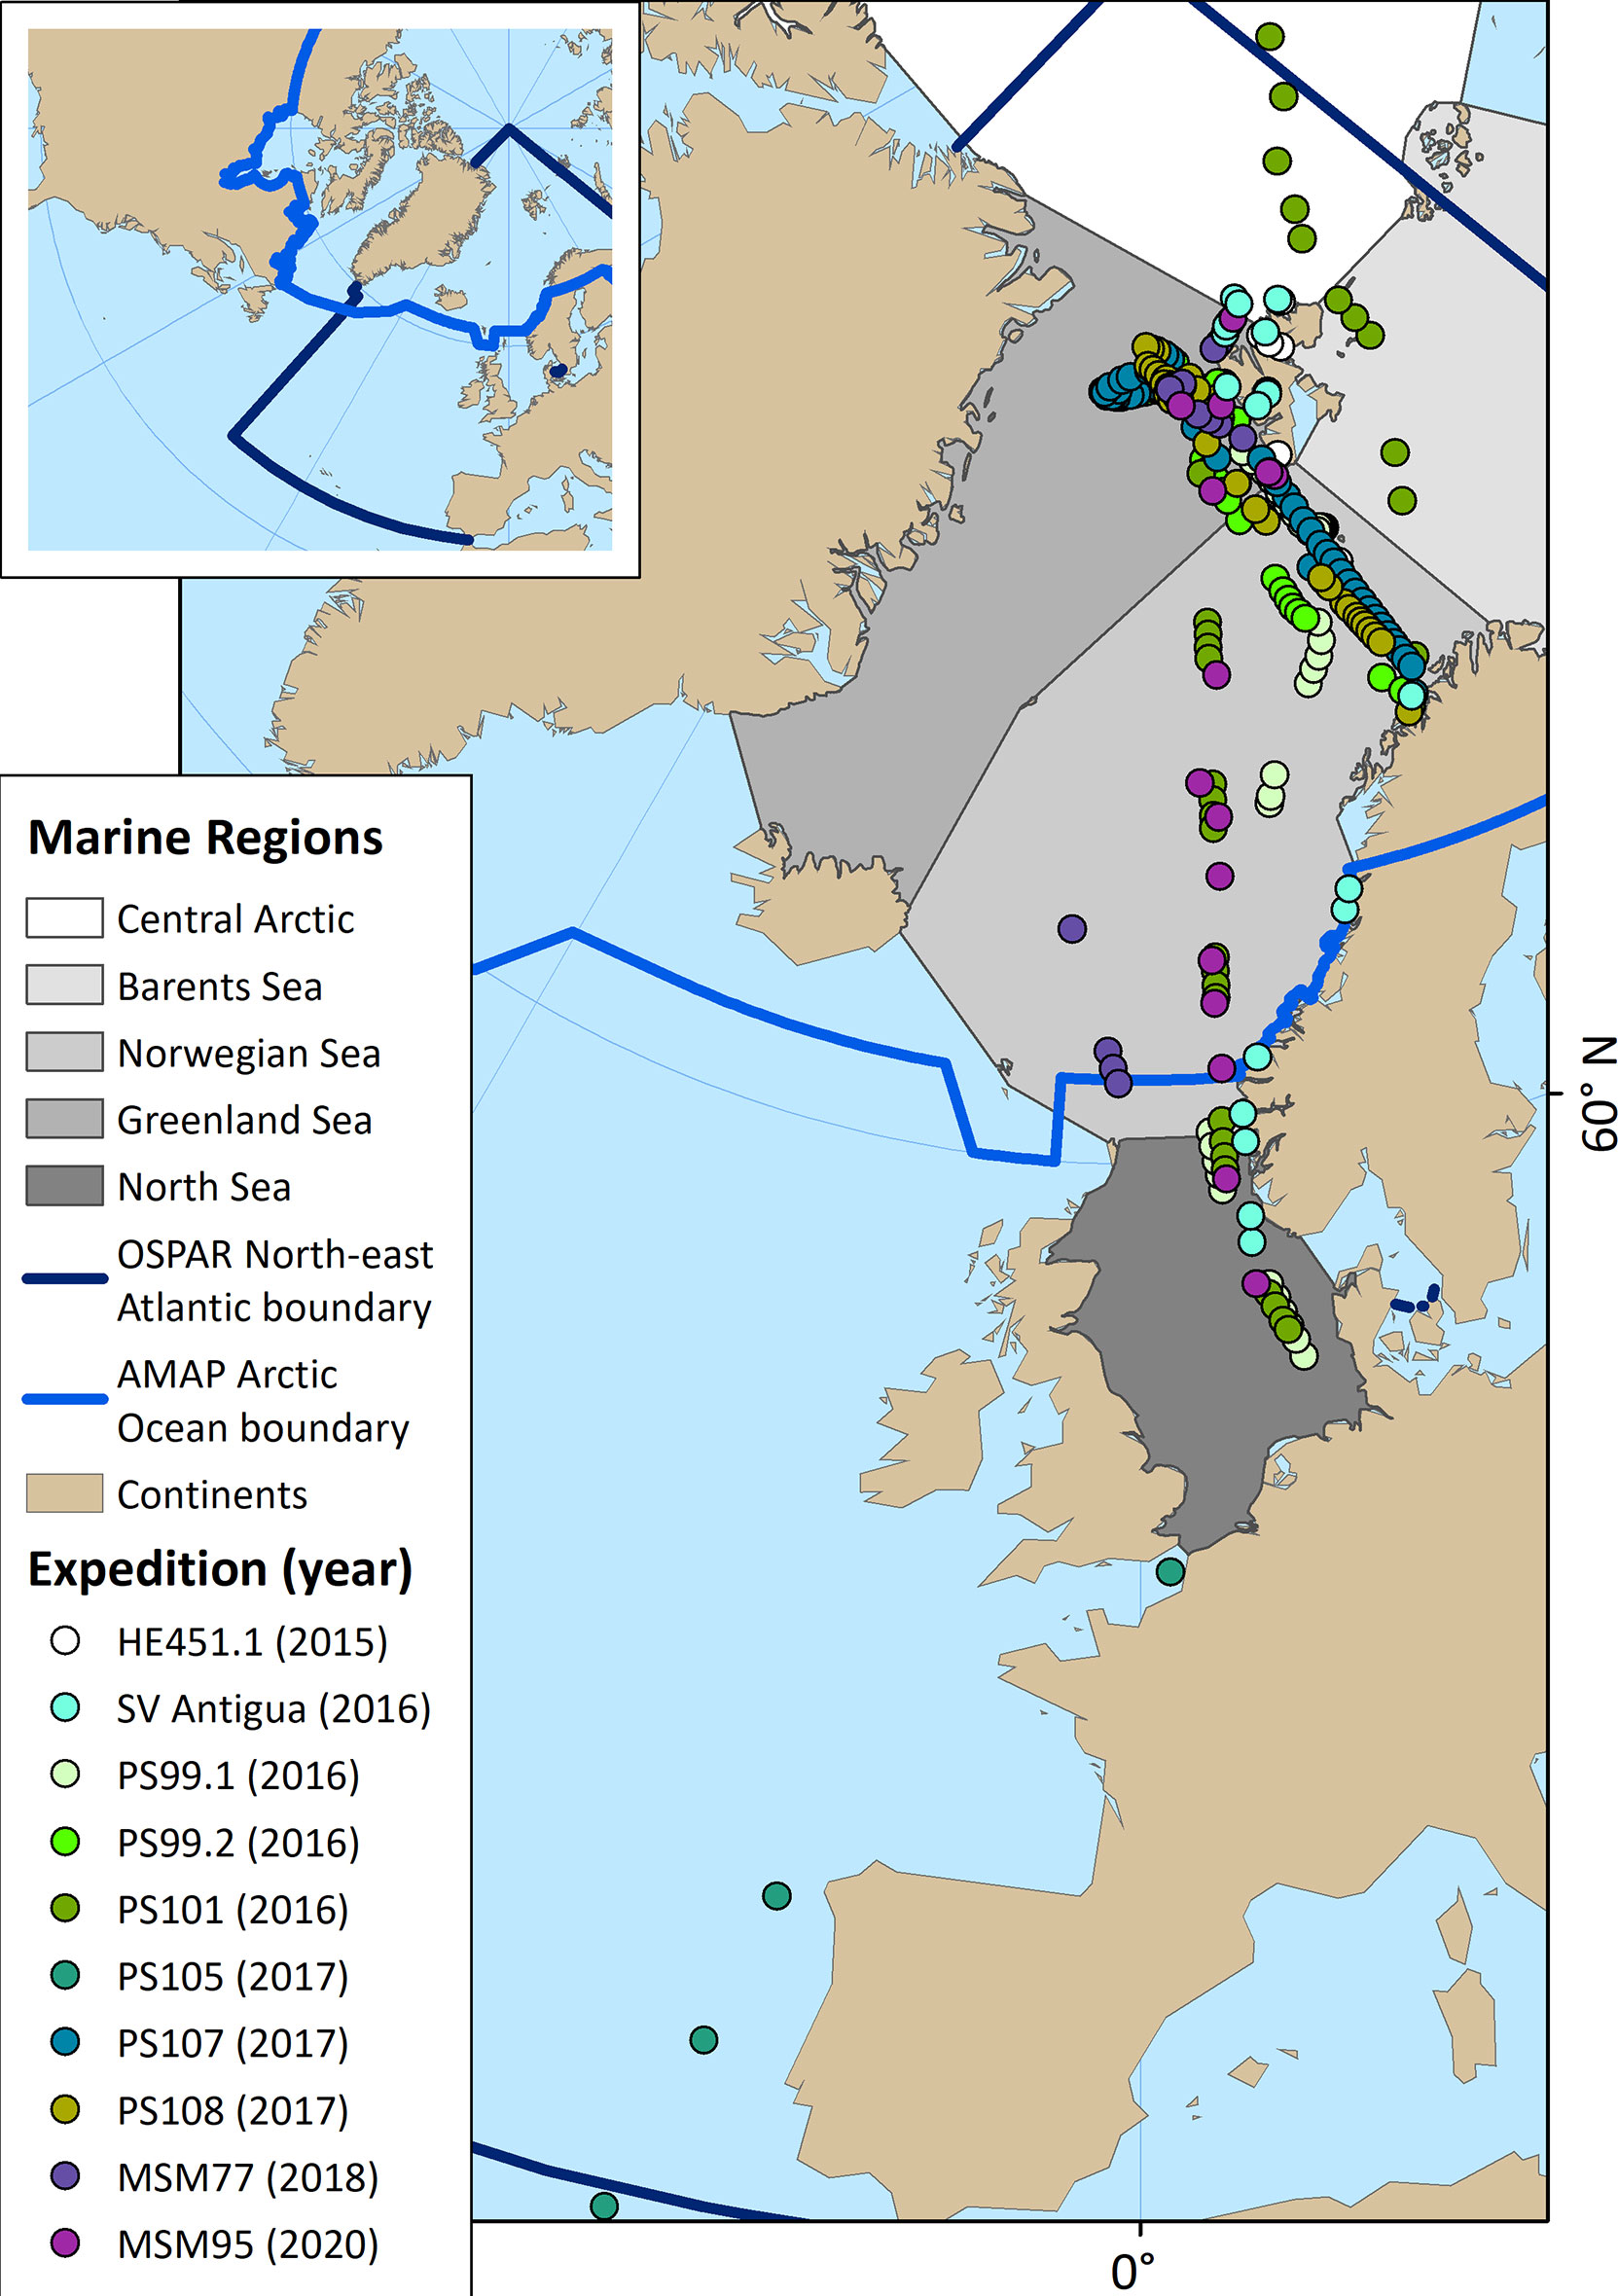
Figure 1 Location of visual surveys conducted in the study area between 2015 and 2020. Each circle corresponds to a visual survey. Marine regions are discerned by different colours. The Arctic Ocean boundary of the Arctic Monitoring & Assessment Programme (AMAP) divides the Arctic waters from the temperate Northeast Atlantic. The close-up map shows the AMAP Arctic Ocean boundary and the OSPAR Northeast Atlantic boundary within the study region.
During surveys, a strip width of 10 m next to the ship starting behind the bow wave of the research vessel was inspected for floating items. Since SV Antigua is a relatively small vessel, the bow wave was negligible and the strip width was recorded for each transect depending on weather, wind conditions and visibility. The position of the observers above the sea level varied between 3 m (SV Antigua), 5.5 m (RV Heincke), 7.2 m (RV Maria S Merian) and 7.5 m (RV Polarstern). Each floating item was noted in protocol forms (see Supplementary Material). Objects seen in the distance outside the observation corridor were recorded but omitted from the analysis. A handheld Global Positioning System (GPS) device was used to record the position of the observer and the time of each observation. Aggregations of debris were observed occasionally. For some of these aggregations the abundance of floating debris was estimated. For two aggregations, “several dozen” were recorded in the protocols and to be conservative, the number of anthropogenic items was considered as 12 for the analysis. For three aggregations, no quantitative information was given. They were thus treated as single items.
The survey tracks (transects) of research cruises were extracted from the ships’ position acquisition system (D-SHIP) at one-minute intervals. The coordinates were imported into ArcMap 10.6.1, converted into line features and the geodesic length of each transect was computed using the “Add Geometry” function. For the SV Antigua cruise, all available waypoints and observations were utilised to estimate the lengths of the transects. The area covered by each survey was calculated by multiplying the length of the transect with the strip width, and debris concentrations were expressed as (number of) items per km2. On cruises SV of Antigua, HE451.1 and PS99.2, the observers managed occasionally to take images of floating items.
Categorization of the Floating Items
Whenever possible, floating debris items were characterised in terms of material, plastic type or usage, size and colour. In case of uncertainty, or if the detail of the object was not recorded, the information was categorised as “not available” (N/A). The material was categorised as plastic, rope and nets, glass, metal, timber, organic or paper (including cardboard). Ropes and nets were considered in a separate material category although FTIR measurements of beached nets and ropes from Svalbard showed that all items were made of plastic (Meyer, 2022). Additionally, plastic items were recorded according to type or usage (e.g., fragment, film, box, bottle, packaging). Films, foils, sheets and bags were assigned to the same category. Identification of floating items from a moving ship is challenging, especially for non-experts, because the observers have only a few seconds to observe and record the items. Therefore, pre-defined categories of plastic items were not used and the observers were instructed to record as many details of the floating objects (material, type, usage, shape, size) as possible, which were then evaluated and grouped during the data analysis.
Items were categorised according to their estimated sizes as small (– <10cm), medium (10≤ x ≤ 50cm) or large (>50 cm) to allow for a comparison of the size distribution of debris items from the sea surface (this study) and the deep seafloor (Bergmann and Klages, 2012; Tekman et al., 2017; Parga Martínez et al., 2020). The minimum size of floating debris recorded by the observers was 1 cm. Objects partly or completely submerged were marked in the protocols except for expedition PS99.1. Occasionally, the observers noted the fouling status of plastics, especially for strongly bio-fouled items. Along with anthropogenic items, natural flotsam was recorded during 173 surveys.
Environmental Parameters
Together with the ship positions, environmental parameters were obtained from the D-SHIP data acquisition system at one-minute intervals. The average values of salinity, chlorophyll a, air and water temperature and wind speed were obtained for each transect in order to explore the relationships between the debris distribution and environmental variables. These parameters were not available for RV Maria S. Merian (MSM77 and MSM95 expeditions) and SV Antigua cruises. In total, the relationships with environmental variables were explored for 211 transects. Longitude, latitude, ship speed and distance to the nearest point at the European coastline (EEA, 2015) were also tested. The distances were calculated with the “Near” tool of ArcMap 10.6.1 by selecting the geodesic length.
Marine Regions
To evaluate regional variations in debris concentrations, the transects were assigned to regional seas as suggested for the world marine regions (NE, 2019) using ArcMap 10.6.1 (Figure 1). The analyses were performed for the Central Arctic, Barents Sea, Greenland Sea, Norwegian Sea, North Sea and North Atlantic sector. The four transects in waters off the Iberian Peninsula and English Channel were grouped within the North Atlantic sector for statistical analyses (Figure 1). Additionally, the transects were grouped according to their position relative to the Arctic Ocean boundary of AMAP (AMAP, 2013) and median concentrations were calculated for Arctic waters (OSPAR Region I) and for the temperate NE Atlantic (OSPAR Region II – IV) (OSPAR, 2016). All maps were produced using ArcMap 10.6.1.
Statistical Analysis
Univariate statistical analyses were performed using Sigmaplot 14.0. Normality tests revealed that concentrations of debris and natural objects were not normally distributed (Shapiro-Wilk: P < 0.050). Accordingly, these parameters were displayed as median values for the regional seas and for the oceanic regions (i.e., Arctic waters and the temperate NE Atlantic Ocean). Minimum and maximum values as well the first and third quartile were given as measures of variability. A Kruskal-Wallis One Way Analysis of Variance on Ranks was performed to explore overall differences in debris concentrations between regional seas, oceanic regions, years, seasons and different ships. A significant difference in the debris quantities recorded from different ships could indicate that its size and thus the distance between an observer and a floating item affects the results. In case of significant differences, Dunn’s post-hoc test was used to perform pairwise comparisons. The correlations between the concentrations of debris and natural objects as well as between debris concentrations and environmental variables were tested by a Spearman’s rank order correlation test. The proportions of the materials (combined with types/usages of plastic items), size groups and colours within the regional seas were calculated to check for possible patterns.
Multivariate statistical analyses were performed using PRIMER-e version 6.1.16 and PERMANOVA 1.0.6. Spatial and temporal differences in material, size and type compositions were investigated with permutational multivariate analysis of variance (PERMANOVA) using a two-way crossed design of fixed factors (‘regional sea’ × year and ‘oceanic region’ × year). PERMANOVA is robust against zero inflation and deviations from a normal distribution of the data (Anderson and Walsh, 2013). Bray-Curtis resemblance matrices were created from 4th-root transformed debris concentrations per km-2. Subsequently, a PERMANOVA routine with 999 permutations with sums of squares type of Type III was carried out to test for differences in the material and size compositions. For PERMANOVA analyses, plastic and ropes (including nets) were considered as separate categories. The PERMANOVA for comparison of the plastic type/usage compositions revealed inconsistent results when the N/A category was either included or excluded. Therefore, the plastic type/usage composition was not analysed statistically. Differences were explored between the regional seas (Central Arctic, Barents Sea, Greenland Sea, Norwegian Sea, North Sea, North Atlantic sector) and oceanic regions (Arctic waters and the temperate NE Atlantic) combined with sampling years (2015 – 2020) and seasons (spring, summer and autumn). Moreover, a PERMANOVA was performed to assess the effects of different ships on the material and size compositions by using the vessel as a fixed factor. In case of significant differences, pairwise comparisons were conducted to identify differences between individual factor levels. Additionally, similarity percentage (SIMPER) analyses were performed to quantify the contribution of each material or size group to the dissimilarity between factor levels.
Principal coordinates analysis (PCO) was applied using PRIMER-e to visualise the environmental variables of a priori defined regional seas. Multivariate multiple regressions between environmental variables and the material and size compositions and environmental parameters were explored using the distance-based linear model (DistLM) routine of PRIMER-e after checking autocorrelations between environmental parameters with a Draftsman plot to avoid multi-collinearity. The average values of environmental parameters were normalised and marginal tests were run with 999 permutations to identify correlations between resemblance matrices of environmental variables and materials and size classes. The “Best” selection procedure based on the “Akaike information criterion (AIC)” was selected to find the best fitting regression models. Relations were visualised with distance-based redundancy analysis (dbRDA).
Opportunistically Collected Physical Samples
During research cruise HE451.1 around Svalbard (Mark, 2015), debris items were retrieved from a fish lift that was connected to a juvenile fish trawl (Holst and McDonald, 2000) (Figure S1). A fish lift is an aquarium at the trawl cod end, aiming to capture the fish unharmed by minimising the turbulence inside. The fish lift was deployed for 15 minutes at depths, where fish schools had been detected by a Simrad EK60 hydro-acoustic system. Debris items were retrieved from the fish-lift samples taken in the south of Hinlopen Strait at 56 m depth, in Kongsfjorden at 30 m depth and in Billefjorden during four deployments at 150 – 160 m depth and from bottom trawls conducted in Billefjorden to assess fish stocks around Svalbard. The bottom trawl samples were not systematically screened for marine debris. Debris sorted from fish-lift and bottom trawl samples was photographed. In addition, during cruise PS99.2, floating plastic items were collected in Fram Strait (~79.07N, 4.34E, 12/07/2016) from an inflatable boat.
Results
Spatiotemporal Distribution of Floating Objects
A total of 276 visual surveys were conducted over 272.5 hours covering a total length of 4,793 km and an area of 47.35 km2 (Table 1 and Figure 2). A total of 1,149 anthropogenic items were observed on 191 transects while no debris was detected on 85 transects. This total amount includes aggregations of anthropogenic items observed on three transects, for which the number of items was estimated as 30, 30 and 50, while three aggregations observed during the SV Antigua cruise were counted as single items. Debris concentrations did not vary significantly between regional seas (Kruskal-Wallis: H = 2.9, P = 0.712), oceanic regions (H = 0.160, P = 0.689) and different ships (H = 2.8 P = 0.428) when the data were consolidated for years and seasons. The overall median concentration of all transects conducted in this study was 11 items km-2 and ranged from 0 to 356 items km-2, with the highest concentration recorded on a transect in the Greenland Sea off Longyearbyen, Svalbard (Table 1 and Figure 2). The highest annual median debris concentration of 38 items km-2 was recorded in the Barents Sea in 2016. For all sampling years combined, the North Sea showed the highest median debris concentration (19 items km-2) of any region, while a median value of zero was obtained for the Central Arctic transects. In Arctic waters and in the temperate NE Atlantic Ocean, the median concentrations across all years were 11 items km-2 each.
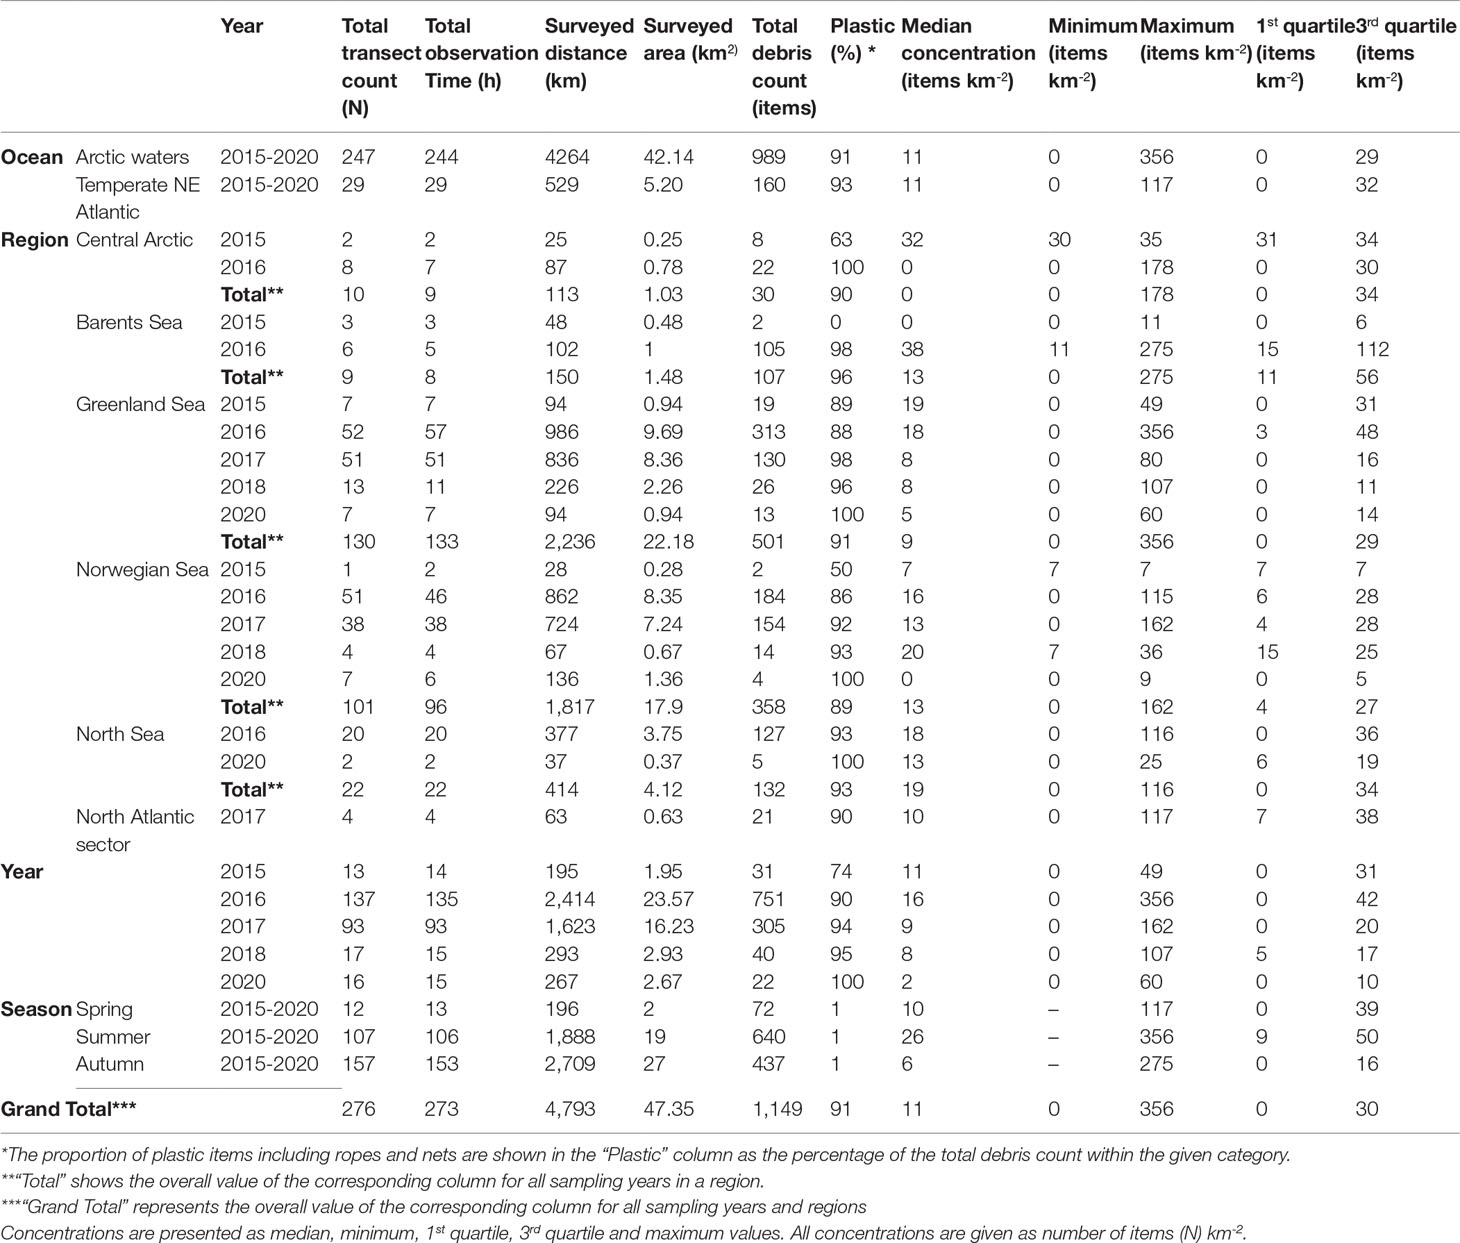
Table 1 Concentrations of floating marine debris in different regions, years and seasons.
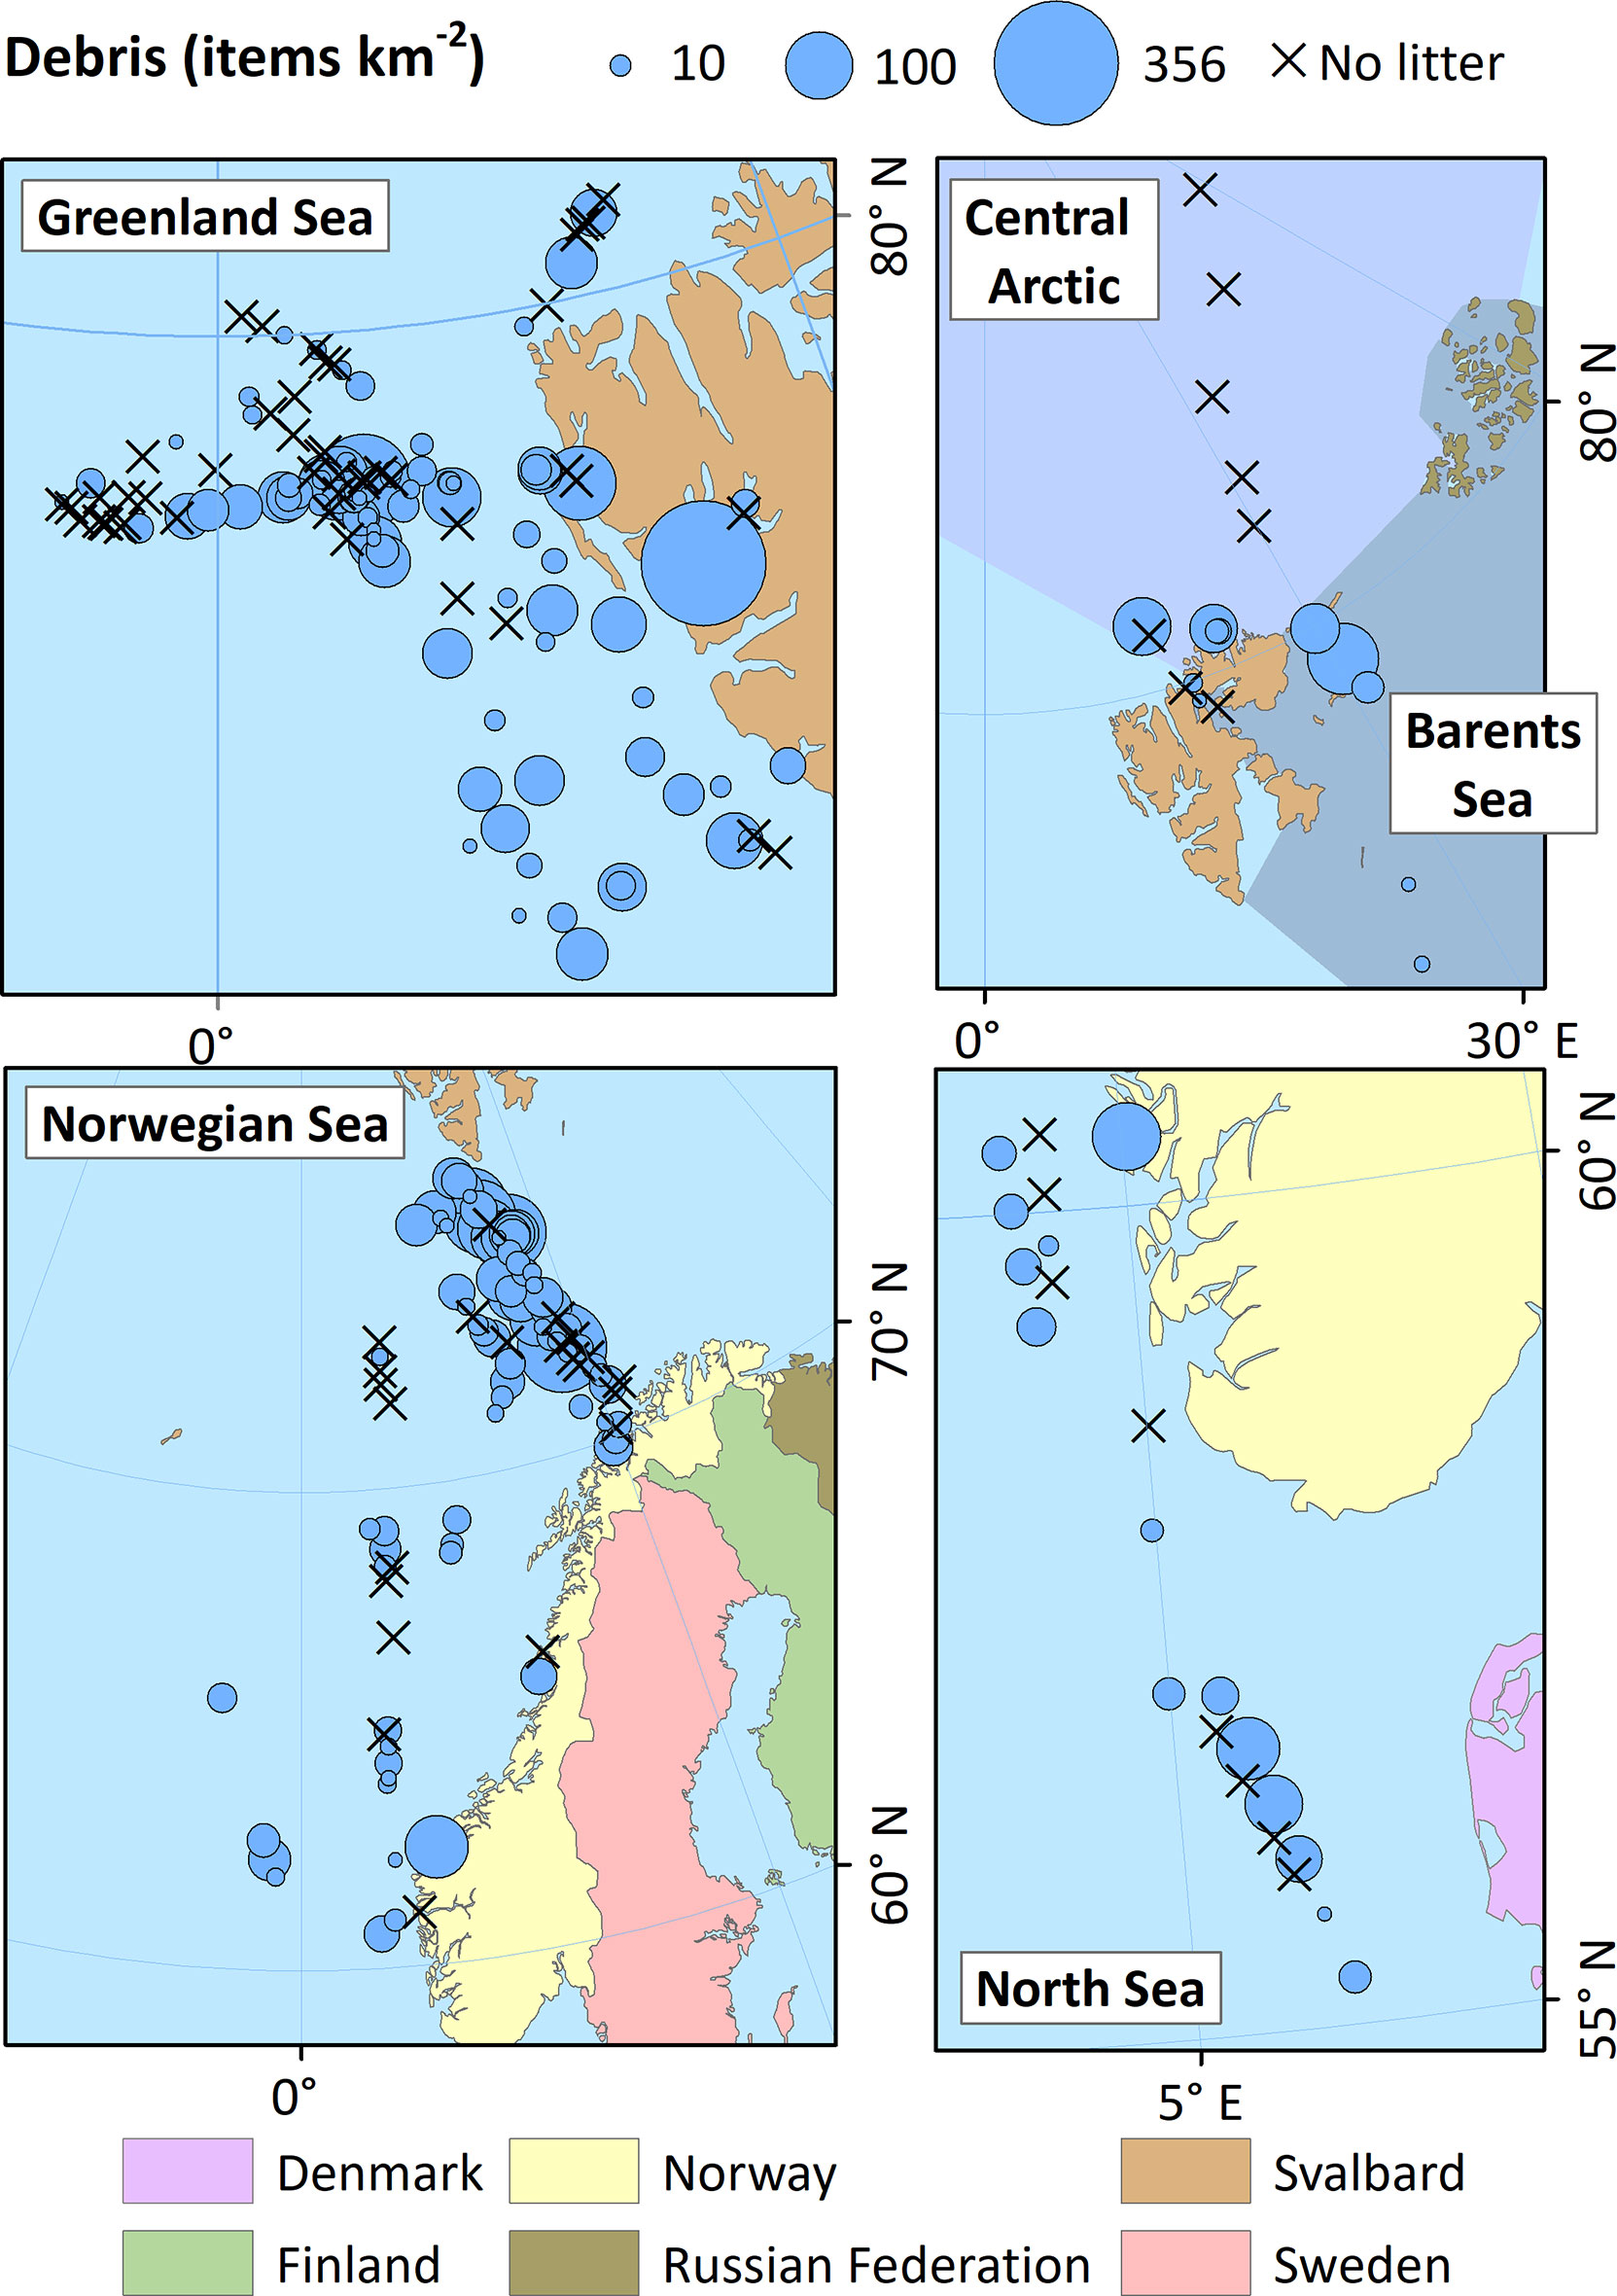
Figure 2 Concentrations of anthropogenic debris (number of items km-2) recorded in visual surveys in the Central Arctic, Barents Sea, Greenland Sea, Norwegian Sea and North Sea. The four southern transects in the North Atlantic region are not shown to improve the scaling of the maps. The sizes of the bubbles are proportional to the debris concentrations of the transects. Crosses denote transects with zero records.
The overall debris concentration decreased slightly over the study period (Figure S2, linear regression: r2 = 0.024; Analysis of Variance of the regression model: F = 6.81, P = 0.010). Accordingly, the debris concentrations varied significantly between years (H = 13.2, P = 0.010) with higher concentrations in 2016 than in 2020 (Table 1, Dunn’s post-hoc: Q = 2.825, P = 0.047). Moreover, the overall debris concentration varied seasonally (H = 42.8, P < 0.001) with higher concentrations in summer than in autumn (Q = 6.3, P < 0.001). Generally, debris concentrations in summer were about three to four times higher than in the other seasons (Table 1).2,645 natural floating objects from 173 transects comprised items such as bird feathers, seaweed, patches of the ice alga Melosira sp., natural wood, a bird carcass and leaves. The overall median concentration of natural flotsam was 31 items km-2 with a range of 0 – 817 items km-2. Seaweed was the most abundant natural flotsam with a median of 18 items km-2 (range: 0 – 462 items km-2). All other natural objects were rare (median of 0 items km-2). A weak positive but significant correlation was found between the concentrations of debris and natural items (Spearman: ρ = 0.29, P < 0.001) and between plastics and seaweed (ρ = 0.39, P < 0.001).
Composition of Floating Debris
A total of 1,046 plastic items, including ropes and nets accounted for 91% of all debris items recorded (Figure 3). Other types of anthropogenic items included glass, timber, metal, paper, organic waste (28 items, 3%). Six percent (73 items) of the debris could not be assigned to any material category (N/A). However, 33 of these unidentified items (i.e., 3% of all debris items) were noted as “potential plastic items”. Types or usages could be identified for 62% or 651 of the plastic items. The contribution of plastic to the total floating debris concentration was highest in the Barents Sea (96%) and lowest in the Norwegian Sea (89%). The most frequently observed plastic items were fragments, films, ropes and nets, packaging materials, expanded polystyrene and straps (Figure 4).
Figure 3 Proportions of debris items according to material, type or usage (A), size (B) and colour (C) groups. The values refer to proportions (%) within a region and the whole study area (TOTAL). The percentages in (A) above the bars represent the proportion of total plastic items. “N/A” refers to the proportion of the total observed debris within a region and/or category, for which the corresponding detail was not identified. Other plastic items included: bottle, cup, box, buoy/ball, cartridge, chip, cigarette bud, container, sanitary towel, disc, glove, grid, handle, helmet, hose, lid, paint container, photo, printed label, ribbon, ring, rubber, ship paint, sponge, stick, traw, syringe, tube, cotton bud.
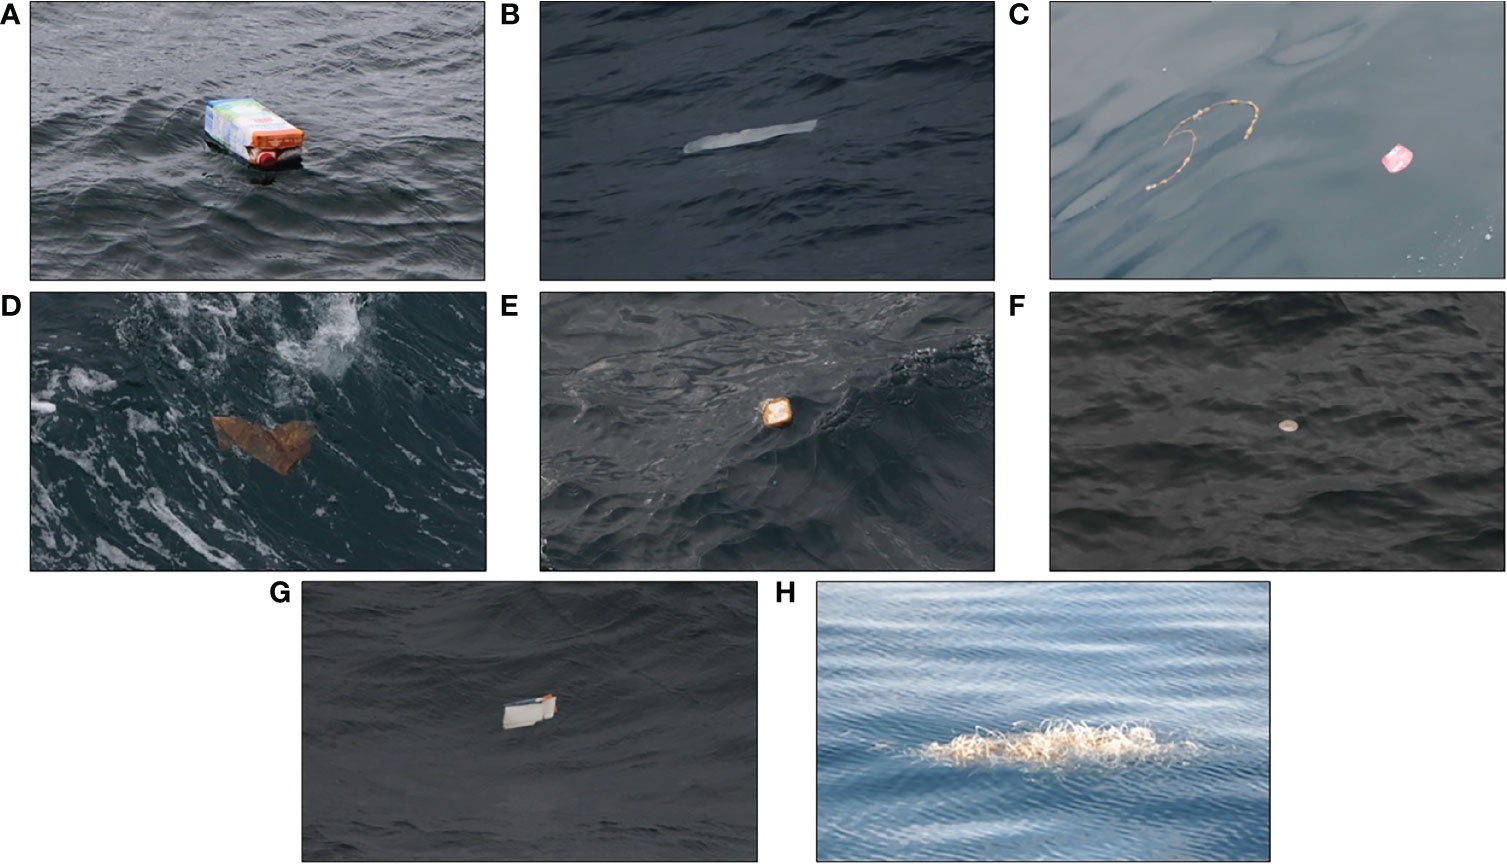
Figure 4 Photographs of floating plastic items observed during RV Polarstern cruise PS99.1 (A), PS99.2 (B–G) and SVAntigua(H). (A) Tetra Pak (credit: Christoph Le Gall). (B) White plastic sheet. (C) Red-coloured hard plastic item and fouled rope. (D) Heavily colonised plastic sheet. (E) Plastic lid. (F) Single-use container (G) Piece of cardboard packaging. (H) A bundle of tangled plastic straps (credit: Birgit Lutz). The original images can be found in the Supplementary Material.
Size was classified for 90% or 1,039 of the 1,149 debris items (Figure 3). Medium-sized items dominated in the study area (532 items, 46%), followed by small-sized (440 items, 38%) and large-sized (67 items, 6%) items. Small items constituted the largest fraction in the Barents Sea with 66% (71 out of 107 items) and in the North Sea with 49% (65 out of 132 items, 49%) whereas medium-sized items dominated in the Central Arctic, Greenland Sea, Norwegian Sea and on transects in the temperate Northeast (NE) Atlantic. Among these, the Central Arctic had the highest fraction of medium-sized items (25 out of 30 items, 83%).
The multivariate PERMANOVA identified a statistically significant interactive effect of regional seas and sampling year suggesting significant differences in the annual dynamics of the material and size composition among the regions (Table S2). In 2016, the Central Arctic differed from the Norwegian, Greenland and Barents Seas in the material and size composition of the floating debris (Table S2). The SIMPER analyses revealed that the higher abundances of plastics, ropes and nets in the Norwegian, Greenland and Barents Seas accounted for more than 60% of the dissimilarity in the material composition in the Central Arctic. Differences in the concentrations of small- and medium-sized items accounted for more than 80% of the dissimilarity between the Central Arctic and other regions and was primarily due to the low quantities in the Central Arctic. In 2017, the Norwegian and Greenland Seas differed in the material types of debris (Table S2). No annual or spatial variations could be found by the corresponding analysis for Arctic waters and the temperate NE Atlantic. The PERMANOVA for different ships did not show any significant effect on the material and size compositions (Table S2).
At both spatial scales of the regional seas and the oceanic regions, seasonal variations were evident (Table S2). The material and size composition in summer differed from the composition in autumn and spring (Table S2) due to higher abundances of plastics. However, a significant interaction with seasonality was only observed for the oceanic regions in material composition (Table S2) suggesting differences in the temporal dynamics in debris composition among the two oceanic basins but not among regional seas.
Colour information was recorded for 81% or 935 of all items. Almost half of the items were white (49% or 560 items), 46% (530 items) of which being plastics (Figure 3). Another 14% (164 items) were transparent, yellow or blue. Other colours accounted for 14% (161 items). Except for the submerged items within the aggregations, 105 single items (9%) floated partially or completely below the surface. In the aggregations, submerged items were noticed but not quantified. Forty-four items (4%) were recorded with obvious signs of bio-fouling.
Correlation With Environmental and Spatial Variables
The principal coordinates of the environmental parameters confirmed variations in several variables between the regional seas (Figure S3). The debris concentration had a weak significant positive correlation with salinity (Figure S4; ρ = 0.29, P < 0.001), and a weak significant negative correlation with wind speed (Figure S5; ρ = -0.26, P < 0.001) and distance to the nearest European coast (Figure S6; ρ = -0.25, P < 0.001).
According to distance-based linear model, material and size compositions of the floating debris correlated significantly with all tested environmental parameters and ship speed, latitude, and distance to the nearest European coast (Tables S3, S4, respectively). Air temperature was excluded because of a strong autocorrelation with water temperature (correlation coefficient > 0.9). For the material and size compositions, the multivariate regression models of salinity, water temperature, wind and ship speed and nearest distance to the European coastline were selected as distance-based linear models (Figure S7, r2 = 0.21, AIC = 1,420, and Figure S8, r2 = 0.23, AIC = 1,439, respectively), which explained 21% and 23% of the variation, respectively.
Characterization of Collected Debris Items
Nine plastic items were obtained from six fish-lift samples around Svalbard. One transparent plastic fragment was found inside a jellyfish captured in the south of Hinlopen Strait at a depth of 56 m (Figure 5A). A yellow fragment was collected in Kongsfjorden at 30 m depth. The remaining items were recovered from four fish-lift deployments made at ~160 m depth, 0 – 11 m above the Billefjorden seafloor (Figures 5B–H). The items from Billefjorden were strongly weathered except for the fisheries ropes (Figures 5G, H) and a transparent plastic fragment (Figure 5B). Moreover, a strongly fouled leather shoe was retrieved from a bottom trawl at Billefjorden (Figure 5I).
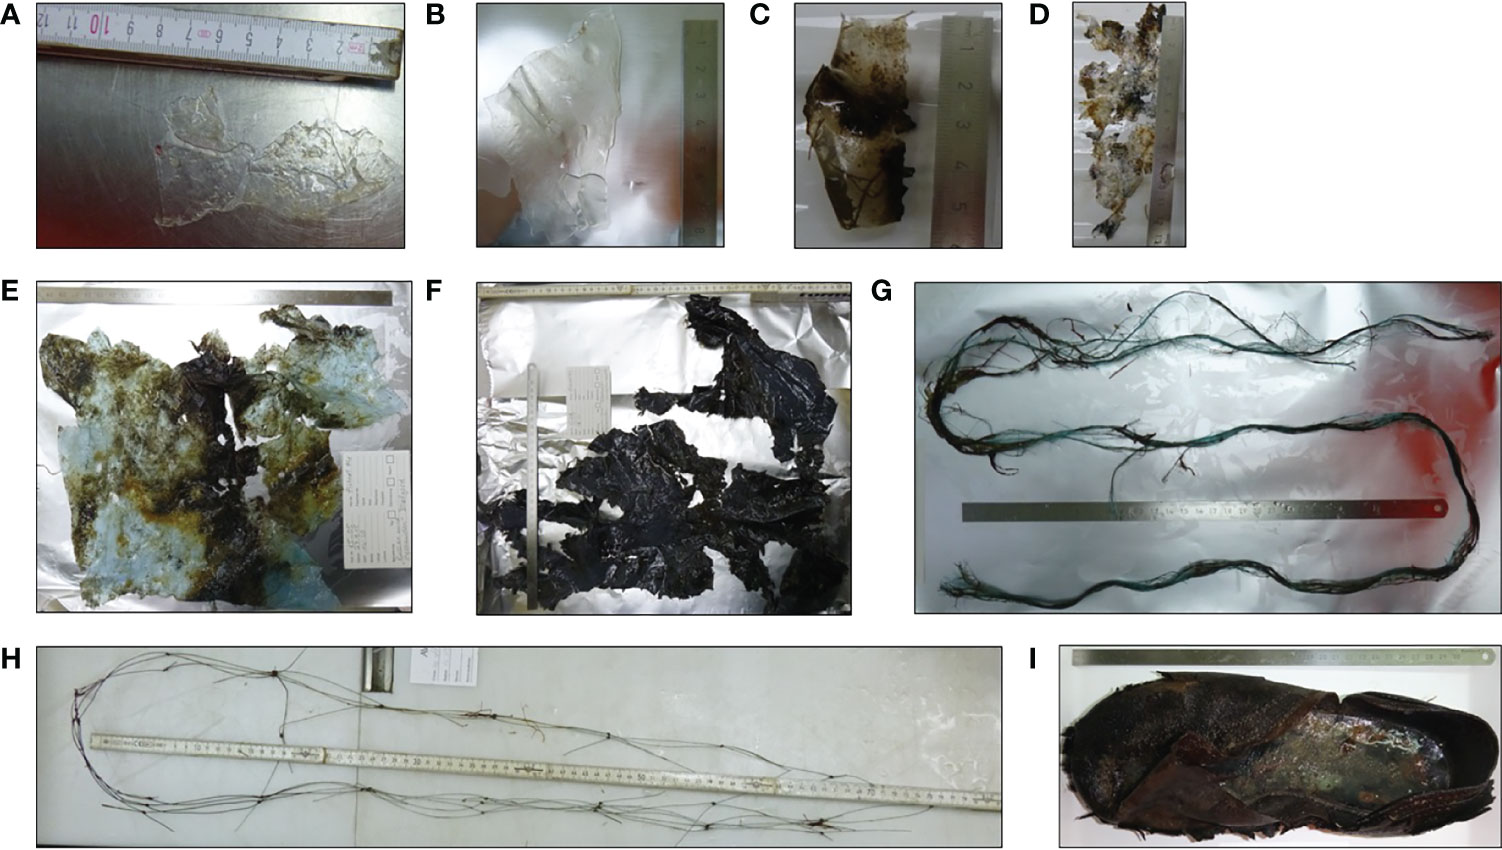
Figure 5 Photographs of debris items found in pelagic and bottom trawls during RV Heincke expedition around Svalbard in 2015. (A) Transparent plastic fragment secured from a jellyfish caught at 56 m depth in the Hinlopen Strait; (B–H) plastic debris collected from fish lift samples taken above the seafloor of Billefjorden; (I) weathered leather shoe collected by a bottom trawl in Billefjorden.
A fisheries glove, a kefir Tetra Pak manufactured in Latvia, two pieces of buckets and a bundle of ropes entangled with a transparent soft fragment (Figures 6A–F) were collected by hand in the Fram Strait. One box fragment was densely colonised by filamentous seaweeds and hydrozoans and hosted a rafting isopod of the genus Idotea and a cf. Dendronotus sp. nudibranch (Figures 6G, H).
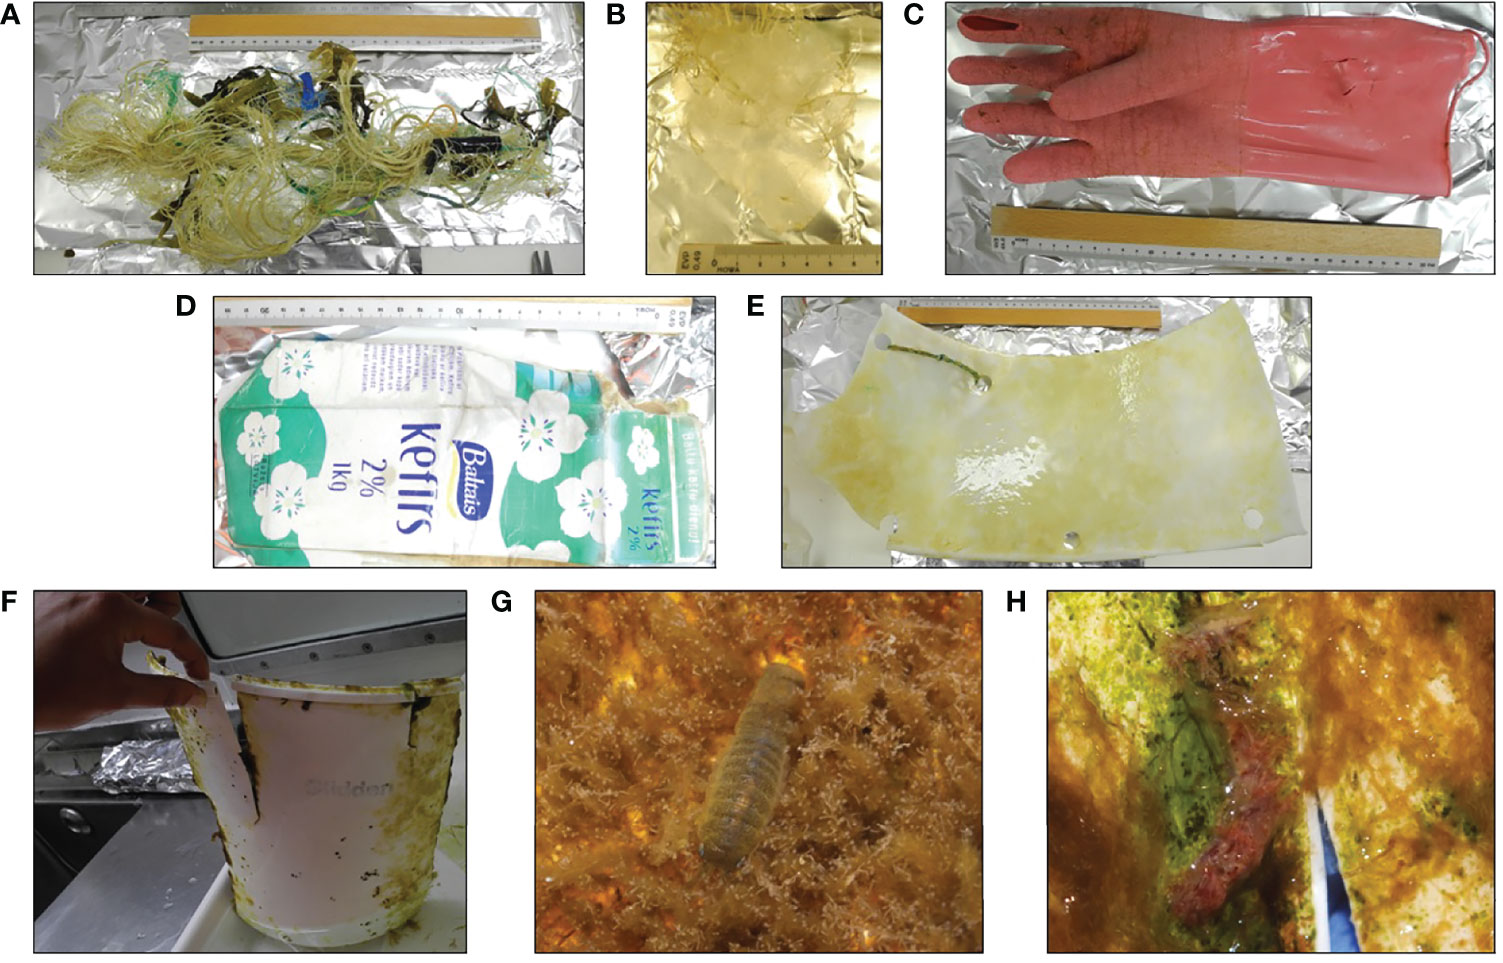
Figure 6 Photographs of plastic debris hand-picked from the sea surface in Fram Strait in 2016: (A) a bundle of tangled ropes, (B) a transparent soft fragment that had been entangled with the ropes, (C) fisheries glove, (D) a Kefir Tetra Pak manufactured in Latvia, (E) bucket fragment, (F) fragment of a more than 20-year-old bucket of the paint manufacturer Glidden, a piece of a plastic box that was densely colonised by hydrozoans and algae with (G) a rafting isopod Idotea sp. and (H) a nudibranch cf. Dendronotus sp. (credit: G, H by Andrey Vedenin).
Discussion
Spatial Distribution
The aim of this study was to quantify the pollution of floating macro-debris in Arctic and Northeast (NE) Atlantic waters. Our results highlight that floating marine debris, mainly plastics, is widespread in the North as it was observed on 69% of the transects. While the whole study area of 47.35 km-2 was covered to a considerable spatial extent by visual ship-based surveys, the availability of ship transit time and the fixed cruise program resulted in an unbalanced distribution of surveys among the regional seas. For example, most surveys in 2016 and 2017 were located in the Greenland and Norwegian Seas and overall, only 11% of the total surveyed area was located south of the Arctic Ocean boundary. The median debris concentration in the whole study area ranged from zero to 356 items km-2. The highest concentration in Arctic waters was 356 items km-2 and 117 items km-2 in the temperate NE Atlantic.
Most polar seas showed similar median concentrations of floating marine debris ranging from 9 to 13 items km-2, except for the Central Arctic. In 2016, when half of all visual surveys were conducted, no floating debris was observed on 75% of the transects in the Central Arctic, leading to a median concentration of zero for this region. While a total survey area of 0.8 km2 is hardly representative for the whole of the Central Arctic, it could still be argued that a low probability of encountering floating marine debris in this region can be assumed since no debris was observed during six out of eight transects beyond 80° N. The observers occasionally reported sea ice at a coverage of 50 – 100% of the sea surface during the surveys without any debris sighting. Similarly, Bergmann et al. (2016) did not record any flotsam on transects with sea ice. While the presence of sea ice clearly affects debris counts, we do not yet know the fate of floating macro-debris during ice formation or when encountering ice floes. Debris items could become either submerged, or pushed aside, crushed/fragmented or entrained in sea ice. As with driftwood (Murphy et al., 2021), plastic items could then be carried with the sea ice, which is known to transport microplastic entrapped from the water (Peeken et al., 2018; Hoffmann et al., 2020). Clearly, the interaction and fate of macroplastics encountering sea ice merits further investigation. Still, occasional records of floating marine debris (Aliani et al., 2020) and even a large aggregation
Previous visual surveys on the quantity of floating marine debris in the Arctic Ocean yielded densities of 0.006 items km−1 in the Greenland Sea and 0.004 items km−1 in the Barents Sea (Bergmann et al., 2016). Those concentrations are substantially lower than the 0.09 to 0.13 items km−1 (Table 2) counted in the same regional seas in our study, potentially because Bergmann et al. (2016) reported only floating items larger than 20 cm, which were recorded as a by-product of seabird and mammal surveys conducted at a greater distance from the forward-looking ship’s bridge or a helicopter, while we specifically targeted any item visible from the rail of the moving vessel. Pogojeva et al. (2021) detected no debris in Siberian waters but reported 0.92 items km-² in the Barents Sea. Again, we measured a 14 times higher median concentration of 13 items km-2 (Table 1) in the Barents Sea, suggesting substantial temporal and/or spatial variations in floating marine debris amounts.

Table 2 Floating marine debris concentrations reported in items km-2 by visual surveys after 2010.
Floating marine debris has been quantified visually in various regions of the world’s ocean (Table 2). Low concentrations of floating debris were recorded in the Southern Ocean (0.021 – 0.58 items km-2) (Ryan et al., 2014; Suaria et al., 2020). Ryan et al. (Ryan, 2014) reported an average concentration of floating marine debris of 6.2 items km−2 in the South Atlantic between Cape Town and Tristan da Cunha, suggesting that this area represented the southern edge of a large accumulation zone. Concentrations of 3 – 14 items km-2 were reported from the Southern Indian Ocean (Connan et al., 2021) and 9 items km-2 from the Bay of Bengal in the Northern Indian Ocean (Ryan, 2013). Floating marine debris concentrations in the Mediterranean Sea ranged from 15 to 251 items km-2 in different sectors (Suaria and Aliani, 2014; Di-Meglio and Campana, 2017; Campana et al., 2018; Zeri et al., 2018). The North Pacific subtropical gyre is a well-established accumulation area of floating marine debris (Law et al., 2014). Between 1,400 and 3,200 items km-2 were reported from the region located between 20–40°N and 120–155°W (Goldstein et al., 2013) while 40 – 2,440 items km-2 were reported in the sub-tropical East Pacific off Mexico (Diaz-Torres et al., 2017). Only few visual surveys on floating debris have been conducted in the North Atlantic Ocean (Thiel et al., 2011; Sa et al., 2016; Chambault et al., 2018; Gutow et al., 2018). Chambault et al. (Chambault et al., 2018) reported debris concentrations of 0.78 items km-2 in Portuguese waters off the Azores and Madeira, which were much lower than the median concentration of 11 items km-2 observed on our three transects off the Iberian Peninsula. An earlier study in the North Sea reported median floating marine debris concentration of 20 items km-2 for the period of 2006 to 2016 (Gutow et al., 2018). Consistently, a median of 19 items km-2 was recorded during our study between 2016 and 2020. In summary, floating debris concentrations in the Arctic Ocean are lower than in the heavily polluted regions of the Central and North Pacific and the Mediterranean Sea but in a similar range as in the North Sea and higher than in the Indian, Southern and South Atlantic Ocean.
Almost half of the sea surface observations in our study were from the Fram Strait in the Arctic Ocean. In that region, the seafloor happened to be photographically surveyed regularly for the HAUSGARTEN time series and analysed for marine debris since 2002 (Tekman et al., 2017; Parga Martínez et al., 2020; Bergmann et al., 2022). The mean concentration on the deep Arctic seafloor across years and stations (4,571 ± 1,628 items km-2) is about 500 times higher than the median concentration of floating marine debris in the Greenland Sea (9 items km-2). By contrast, in the North Sea, the mean concentration on the seafloor was only some 40 times higher than at the sea surface (Gutow et al., 2018). The much higher ratio of seafloor to surface concentrations in the Greenland Sea could be due to frequent resuspension of benthic debris in the much shallower and more dynamic North Sea whereas the deep sea seems to constitute a sink continuously accumulating marine debris (Pham et al., 2014). The composition of the debris material differs between the seafloor and sea surface. Plastic, rubber, Styrofoam, and fisheries-related plastic clearly dominated the composition at the surface by 91%, whereas these types accounted only for 56% on the seafloor (Parga Martínez et al., 2020). Glass pieces sink directly to the seafloor. Accordingly, only 0.2% of the floating items were glass, while it was the second most abundant debris type on the seafloor (21%). The overall composition of marine debris on the seafloor and at the sea surface depends strongly on material density. Several processes initiate the sinking process of positively buoyant plastics, which then become also subject to lateral advection processes during their passage to the seafloor (Li et al., 2020; Tekman et al., 2020). Bio-fouling can enhance the specific gravity of an item and cause it to sink. The relative surface area increases as the size of the item become smaller and therefore, small items lose their buoyancy faster than larger ones (Fazey and Ryan, 2016). Accordingly, small debris items dominated on the deep seafloor of the Fram Strait, whereas floating items in the Greenland Sea were mostly medium-sized. The large box fragment collected in the Fram Strait was still afloat although it was densely colonised by organisms (Figures 6F–H). Empirical observations off South Africa showed that large and thick fragments float for longer than thin items, such as plastic bags (Ryan, 2015). Marine organisms can also facilitate the transport of anthropogenic debris to the seafloor (Choy and Drazen, 2013; Choy et al., 2019). The plastic film fragment inside the jellyfish collected by the fish lift in the Hinlopen Strait demonstrates that ingested plastics can be transported by pelagic organisms through the water column. Grøsvik et al. (Grøsvik et al., 2018) also reported marine debris in pelagic trawls taken close to the Norwegian and Svalbard coasts.
Temporal Variability
Overall, there was a weak declining trend in floating debris concentrations from 2016 to 2020. However, longer-term investigations with sufficient annual counts are needed to confirm a continuous long-term decrease in marine debris pollution. A long-term study in the North Sea did not find persistent temporal changes between 2006 and 2016 (Gutow et al., 2018) but reported an order of magnitude increase between first assessments in 1983 (Dixon and Dixon, 1983) and later surveys in 2006 – 2008 (Thiel et al., 2011). Other studies from different marine compartments have suggested both decreasing and increasing trends. Citizen-science data from over 200 beach locations at the Lofoten archipelago, Norway, collected from 2011 to 2018 revealed a decrease in marine debris, potentially in response to regular beach clean-ups and a change in consumer behaviour (Haarr et al., 2020). However, a continuous 7-fold increase from 2004 to 2017 was documented for the deep Arctic seafloor (Bergmann and Klages, 2012; Tekman et al., 2017; Parga Martínez et al., 2020).
Seasonal differences in marine debris concentrations are unlikely where human activities constantly emit debris (Hinojosa et al., 2011). Still, we observed a much higher debris concentration in summer than in autumn, which could be due to increased touristic and maritime activities in the absence of sea ice in summer (Stocker et al., 2020). Seafloor debris concentrations in that region correlated positively with fishing and tourism in the Fram Strait (Parga Martínez et al., 2020). A similar pattern was reported for beach debris from the Mediterranean (Campana et al., 2018) and Baltic Seas (Rothäusler et al., 2019) and attributed to seasonally increased recreational activities and tourism.
Floating Objects
Plastics, including ropes and nets accounted for 91% of all floating debris. Small- and medium-sized fragments were the most common type of floating items. Similarly, plastic fragments were particularly abundant in offshore waters of the Indian Ocean whereas nearshore waters in that region had a higher proportion of consumer-related items (Ryan, 2013). A high fraction of undefined plastic fragments can be characteristic of remote regions off the centres of human activities, such as the Arctic Ocean due to extensive weathering processes during the long passage at sea.
The majority of plastic fragments were white or transparent concurring with studies from other regions (Ryan, 2014; Campana et al., 2018; Marti et al., 2020; Connan et al., 2021). Photooxidation causes discoloration or whitening, which shifts to yellow and then to brown upon extended exposure to solar radiation (Andrady, 2017; Marti et al., 2020), indicating progressive weathering. For densely colonised items, such as the box fragment collected in Fram Strait (Figures 6G, H), the determination of the colour can be challenging. The colour of an item can be important for interactions of species with floating debris (Ory et al., 2017; Marti et al., 2020).
Seaweeds were the dominant natural floating objects and were encountered in all regional seas, except for the Barents Sea. However, seaweeds were counted only on half of the transects in the Barents Sea, where no floating debris was detected either. Our analysis suggests a weak but significant correlation between the distribution of debris and natural items, which can be explained by common transport mechanisms for all types of flotsam (Campana et al., 2018; Pogojeva et al., 2021). However, natural and anthropogenic items likely have different source regions, which could explain the weakness of the correlation.
The Effect of Environmental Conditions and Spatial Variables
The debris concentration in our study area correlated positively with salinity but negatively with wind speed and nearest distance to the European coastline. Additionally, multivariate regression analysis revealed correlations with salinity, latitude, water temperature, wind speed and distance to the nearest European coast. As expected, both analyses confirm that environmental conditions as well as the latitude and distance to the coast (i.e. potential source regions) partly explain the variability in the distribution of floating marine debris, since there are other factors, which are not considered in this study (van Sebille et al., 2020).
The salinity gradient in the Nordic Seas is governed by the Norwegian Atlantic Current, which is a northward extension of the North Atlantic Current (the West Spitsbergen Current) with salinities exceeding 35 psu and the East Greenland Current with polar waters of lower salinities (< 34 psu). Waters of even lower salinities (32–34 psu) from the Skagerrak and the North Sea flowing along the Norwegian coast influence the eastern and northeastern sector of the Nordic Seas (Furevik et al., 2002; Strand et al., 2021). Backward drift simulations based on currents, wave action and wind forcing showed that floating debris from the North Sea and the temperate NE Atlantic is transported northwards towards Arctic waters within a year (Strand et al., 2021). However, a horizontal random spread of debris was also suggested (Strand et al., 2021). Our transects in the Barents Sea were mostly located around Svalbard, which is influenced by both, Atlantic and polar waters. Pogojeva et al. (2021) did not find floating debris in the eastern part of the Kara Sea, which is a source of polar waters (Wilson et al., 2021), suggesting that the high amounts of debris in the north and northeast of Svalbard in our study originated primarily from local sources and maritime activities in that region or from transport from Atlantic sources. The contribution of maritime activities as a source of marine debris pollution has been reported by an assessment of plastic drinking bottles on an inhabited island in the Tristan da Cunha archipelago, central South Atlantic (Ryan et al., 2019). European debris is known to be transported to the north (Cózar et al., 2017; Tekman et al., 2020; Pogojeva et al., 2021). Indeed, 43% of the debris beached on Svalbard with embossed writing consisted of objects manufactured in Europe (Björn et al., 2019). Debris on the beaches of western Svalbard, in the Greenland Sea, originate primarily from around Svalbard and the Barents Sea with additional minor contributions from Iceland and the Norwegian Sea (Strand et al., 2021). In our study, the proportion of small plastics was highest in the Barents Sea, followed by the North Sea. This distribution corroborates the drift trajectories projected for microplastic (Strand et al., 2021), and suggests the North Sea as a source region for microplastics in the Norwegian and Barents Seas. Moreover, the relatively high proportion of small plastic items in the Barents Sea can be explained by a continuous fragmentation of floating plastic items during extended residence times in the Barents Sea, supporting the projection of an accumulation area in the Barents Sea (van Sebille et al., 2012).
A decrease of marine debris concentrations with distance to land was also observed on the seafloor of the Norwegian and Barents Seas (Buhl-Mortensen and Buhl-Mortensen, 2017). High amounts of marine debris, especially plastic, have been reported at the coasts of Labrador, West Greenland (Mallory et al., 2021), Norway (Falk-Andersson et al., 2019; Haarr et al., 2020) and Svalbard beaches (Bergmann et al., 2017a). Higher concentrations in coastal waters than in offshore waters do not necessarily indicate land-based sources, especially in Arctic waters. Several studies highlighted fisheries, i.e. sea-based inputs, as a prime source of marine debris in the Arctic and the North Sea (Bergmann et al., 2017a; Buhl-Mortensen and Buhl-Mortensen, 2017; Gutow et al., 2018; Vesman et al., 2020; Benzik et al., 2021; Strand et al., 2021). Wind and currents can promote the transport and deposition of floating debris towards coasts (Ryan, 2013; van Sebille et al., 2020), resulting in a negative correlation of the debris concentration with nearest distance to the European coastline.
Wind-induced vertical mixing supports the vertical transport of floating marine debris through the water column down to hundreds of metres depth (Kukulka et al., 2012; Reisser et al., 2013; Suaria et al., 2016), which could explain the negative correlation between the debris concentrations and wind speed. Accordingly, 19% of the floating items in the South Atlantic were completely submerged by an estimated depth of 0.2 – 5 m (Ryan, 2014). In our study, we did not consistently record the position of floating items relative to the sea surface but at least 9% of the items were noted as being partly or completely submerged.
Conclusion
Floating marine debris was encountered on the great majority of transects suggesting a substantial pollution of Northeast Atlantic waters. The same median value of debris concentration was obtained for both sides of the Arctic Ocean boundary. Overall, the regional seas showed similar debris concentrations, except for the central Arctic, where despite occasional sightings, the majority of transects were free of floating debris. Clear seasonal trends were found, with higher pollution levels in summer than in other seasons, which could be attributed to seasonally elevated tourism and shipping activities in the region. Although the examination of environmental and spatial variables confirmed a distinction between the regional seas, their relation to the debris concentration partly explained the variability, possibly due to the complex hydrography in the area, the existence of other factors, and a random horizontal spread of floating items. A high proportion of unidentified fragments and films is characteristic for plastic pollution in remote open waters.
Visual surveys do not require the use of specific sampling gear and are, therefore, relatively easy to perform even for people without scientific training or specific expertise. The extensive dataset compiled in this study would not have been possible without non-experts and citizen scientists, highlighting that collaboration with citizen scientists can help us to fill important knowledge gaps. Moreover, observations of floating plastics can be used to validate and improve the modelled simulations and predictions regarding the distribution of flotsam, which are essential for ecological risk assessments (Compa et al., 2019) and assessments of the efficiency of new regulations such as a UN Plastic Treaty. Interactions comprising entanglement, ingestion and colonisation of debris have already been reported for species from the bottom of the food chain to top predators in Arctic waters (Parga Martínez et al., 2020; Collard and Ask, 2021; Bergmann et al., 2022; Botterell et al., 2022). While the effects of these interactions are largely unknown, Arctic ecosystems are already under threat from climate change (Thomas et al., 2022) and plastic pollution can only exacerbate its effects (Tekman et al., 2022). Action is thus urgently required to efficiently reduce plastic pollution from both local and distant sources.
Data Availability Statement
The raw data supporting the conclusions of this article will be made available by the authors via the data portal PANGAEA.de, without undue reservation.
Author Contributions
All authors conceived of the presented idea, contributed to the design and implementation of the research. MT processed the data, performed the analysis, drafted the manuscript with support from LG and MB. All authors discussed the results, commented on the manuscript, read and approved the submitted version.
Funding
This work contributes to the Pollution Observatory of the Helmholtz-funded infrastructure program FRAM (Frontiers in Arctic Marine Research). MT, MB and LG were funded by the Helmholtz-Gemeinschaft Deutscher Forschungszentren. The grant number of HE451.1 is AWI_HE451_01.
Conflict of Interest
The authors declare that the research was conducted in the absence of any commercial or financial relationships that could be construed as a potential conflict of interest.
Publisher’s Note
All claims expressed in this article are solely those of the authors and do not necessarily represent those of their affiliated organizations, or those of the publisher, the editors and the reviewers. Any product that may be evaluated in this article, or claim that may be made by its manufacturer, is not guaranteed or endorsed by the publisher.
Acknowledgments
The data for this study has been collected by dozens of helpers. We cannot provide all names but would like to sincerely thank the crew, (principal) scientists, and students of the cruises HE451.1, PS99.1, PS99.2, PS101, PS105, PS107, PS108, MSM77, MSM95 and crew and tourists of the SV Antigua cruise. The authors organized the data collection on HE451.1, PS99.1, PS99.2, PS108, MSM77. Jennifer Dannheim organized the data collection on PS101, Simon Dreutter on PS105, Melissa Käß on PS107 and Lilian Boehringer conducted the visual surveys during MSM95. We gratefully acknowledge the efforts of Birgit Lutz, who organized the data collection by citizen scientists during sailing cruises. Sandra Tippenhauer collected floating items in the Fram Strait. Andrey Vedenin provided photos of collected debris items. Corina Peter and Erik Dauer digitalized visual survey protocols. We also thank Simon Dreutter and Tilo Birnbaum for their help with ArcGIS analyses. This publication is Eprint ID 55885 of the Alfred-Wegener-Institut Helmholtz-Zentrum für Polar- und Meeresforschung.
Supplementary Material
The Supplementary Material for this article can be found online at: https://www.frontiersin.org/articles/10.3389/fmars.2022.933768/full#supplementary-material
References
Aliani S., Casagrande G., Catapano P., Catapano V. (2020). “Polarquest 2018 Expedition: Plastic Debris at 82°07’ North,” in Mare Plasticum - The Plastic Sea. Eds. Streit-Bianchi M., Cimadevila M., Trettnak W. (Cham: Springer International Publishing), 89–116.
AMAP (2013) AMAP Area / Boundary, Line and Polygon Shapefiles. Available at: https://www.amap.no/work-area/document/868.
Anderson M. J., Walsh D. C. I. (2013). PERMANOVA, ANOSIM, and the Mantel Test in the Face of Heterogeneous Dispersions: What Null Hypothesis are You Testing? Ecol. Monogr. 83 (4), 557–574. doi: 10.1890/12-2010.1
Andrady A. L. (2017). The Plastic in Microplastics: A Review. Mar. pollut. Bull. 119 (1), 12–22. doi: 10.1016/j.marpolbul.2017.01.082
Arcangeli A., Campana I., Angeletti D., Atzori F., Azzolin M., Carosso L., et al. (2018). Amount, Composition, and Spatial Distribution of Floating Macro Litter Along Fixed Trans-Border Transects in the Mediterranean Basin. Mar. Pollut. Bull. 129 (2), 545–554. doi: 10.1016/j.marpolbul.2017.10.028
Arcangeli A., David L., Aguilar A., Atzori F., Borrell A., Campana I., et al. (2020). Floating Marine Macro Litter: Density Reference Values and Monitoring Protocol Settings From Coast to Offshore. Results From the MEDSEALITTER Project. Mar. Pollut. Bull. 160, 111647. doi: 10.1016/j.marpolbul.2020.111647
Benzik A. N., Orlov A. M., Novikov M. A. (2021). Marine Seabed Litter in Siberian Arctic: A First Attempt to Assess. Mar. pollut. Bull. 172, 112836. doi: 10.1016/j.marpolbul.2021.112836
Bergmann M., Collard F., Fabres J., Gabrielsen G. W., Provencher J. F., Rochman C. M., et al. (2022). Plastic Pollution in the Arctic. Nat. Rev. Earth Environ. 3 (5), 323–337. doi: 10.1038/s43017-022-00279-8
Bergmann M., Klages M. (2012). Increase of Litter at the Arctic Deep-Sea Observatory HAUSGARTEN. Mar. pollut. Bull. 64 (12), 2734–2741. doi: 10.1016/j.marpolbul.2012.09.018
Bergmann M., Lutz B., Tekman M. B., Gutow L. (2017a). Citizen Scientists Reveal: Marine Litter Pollutes Arctic Beaches and Affects Wild Life. Mar. pollut. Bull. 125 (1-2), 535–540. doi: 10.1016/j.marpolbul.2017.09.055
Bergmann M., Mutzel S., Primpke S., Tekman M. B., Trachsel J., Gerdts G. (2019). White and Wonderful? Microplastics Prevail in Snow From the Alps to the Arctic. Sci. Adv. 5 (8), eaax1157. doi: 10.1126/sciadv.aax1157
Bergmann M., Sandhop N., Schewe I., D’Hert D. (2016). Observations of Floating Anthropogenic Litter in the Barents Sea and Fram Strait, Arctic. Polar Biol. 39, 553–560. doi: 10.1007/s00300-015-1795-8
Bergmann M., Tekman M. B., Gutow L. (2017b). Marine Litter: Sea Change for Plastic Pollution. Nature 544 (7650), 297. doi: 10.1038/544297a
Beszczynska-Möller A., Woodgate R. A., Lee C., Melling H., Karcher M. (2011). A Synthesis of Exchanges Through the Main Oceanic Gateways to the Arctic Ocean. Oceanogr. 24 (3), 82–99. doi: 10.5670/oceanog.2011.59
Biermann L., Clewley D., Martinez-Vicente V., Topouzelis K. (2020). Finding Plastic Patches in Coastal Waters Using Optical Satellite Data. Sci. Rep. 10 (1), 1–10. doi: 10.1038/s41598-020-62298-z
Björn A., Peter H., Tiina K., Tina S., Pame (2019). Desktop Study on Marine Litter Including Microplastics in the Arctic, Grid-Arendal. Retrieved from https://policycommons.net/artifacts/2390702/desktop-study-on-marine-litter-including-microplastics-in-the-arctic/3412124/ on 22 Jun 2022. CID: 20.500.12592/grg7dg.
Borrelle S. B., Ringma J., Law K. L., Monnahan C. C., Lebreton L., McGivern A., et al. (2020). Predicted Growth in Plastic Waste Exceeds Efforts to Mitigate Plastic Pollution. Science 369 (6510), 1515–1518. doi: 10.1126/science.aba3656
Botterell Z. L. R., Bergmann M., Hildebrandt N., Krumpen T., Steinke M., Thompson R. C., et al. (2022). Microplastic Ingestion in Zooplankton From the Fram Strait in the Arctic. Sci. Total Environ. 831, 154886. doi: 10.1016/j.scitotenv.2022.154886
Bourdages M. P. T., Provencher J. F., Sudlovenick E., Ferguson S. H., Young B. G., Pelletier N., et al. (2020). No Plastics Detected in Seal (Phocidae) Stomachs Harvested in the Eastern Canadian Arctic. Mar. pollut. Bull. 150, 110772. doi: 10.1016/j.marpolbul.2019.110772
Buhl-Mortensen L., Buhl-Mortensen P. (2017). Marine Litter in the Nordic Seas: Distribution Composition and Abundance. Mar. pollut. Bull. 125 (1-2), 260–270. doi: 10.1016/j.marpolbul.2017.08.048
Bundela A. K., Pandey K. K. (2022). The United Nations General Assembly Passes Historic Resolution to Beat Plastic Pollution. Anthr. Sci. doi: 10.1007/s44177-022-00021-5
Campana I., Angeletti D., Crosti R., Di Miccoli V., Arcangeli A. (2018). Seasonal Patterns of Floating Macro-Litter Across the Western Mediterranean Sea: A Potential Threat for Cetacean Species. Rend. Lincei Sci. Fis. Nat. 29 (2), 453–467. doi: 10.1007/s12210-018-0680-0
Chambault P., Vandeperre F., Machete M., Lagoa J. C., Pham C. K. (2018). Distribution and Composition of Floating Macro Litter Off the Azores Archipelago and Madeira (NE Atlantic) Using Opportunistic Surveys. Mar. Environ. Res. 141, 225–232. doi: 10.1016/j.marenvres.2018.09.015
Chiu C.-C., Liao C.-P., Kuo T.-C., Huang H.-W. (2020). Using Citizen Science to Investigate the Spatial-Temporal Distribution of Floating Marine Litter in the Waters Around Taiwan. Mar. pollut. Bull. 157, 111301. doi: 10.1016/j.marpolbul.2020.111301
Choy C. A., Drazen J. C. (2013). Plastic for Dinner? Observations of Frequent Debris Ingestion by Pelagic Predatory Fishes From the Central North Pacific. Mar. Ecol. Prog. Ser. 485(Marine Ecol. Prog. Ser. 485, 155–163. doi: 10.3354/meps10342
Choy C. A., Robison B. H., Gagne T. O., Erwin B., Firl E., Halden R. U., et al. (2019). The Vertical Distribution and Biological Transport of Marine Microplastics Across the Epipelagic and Mesopelagic Water Column. Sci. Rep. 9 (1), 7843. doi: 10.1038/s41598-019-44117-2
Collard F., Ask A. (2021). Plastic Ingestion by Arctic Fauna: A Review. Sci. Total Environ. 786, 147462. doi: 10.1016/j.scitotenv.2021.147462
Compa M., Alomar C., Wilcox C., van Sebille E., Lebreton L., Hardesty B. D., et al. (2019). Risk Assessment of Plastic Pollution on Marine Diversity in the Mediterranean Sea. Sci. Total Environ. 678, 188–196. doi: 10.1016/j.scitotenv.2019.04.355
Connan M., Perold V., Dilley B. J., Barbraud C., Cherel Y., Ryan P. G. (2021). The Indian Ocean ‘Garbage Patch’: Empirical Evidence From Floating Macro-Litter. Mar. pollut. Bull. 169, 112559. doi: 10.1016/j.marpolbul.2021.112559
Cózar A., Marti E., Duarte C. M., Garcia-de-Lomas J., van Sebille E., Ballatore T. J., et al. (2017). The Arctic Ocean as a Dead End for Floating Plastics in the North Atlantic Branch of the Thermohaline Circulation. Sci. Adv. 3 (4), e1600582. doi: 10.1126/sciadv.1600582
Diaz-Torres E. R., Ortega-Ortiz C. D., Silva-Iniguez L., Nene-Preciado A., Orozco E. T. (2017). Floating Marine Debris in Waters of the Mexican Central Pacific. Mar. pollut. Bull. 115 (1-2), 225–232. doi: 10.1016/j.marpolbul.2016.11.065
Di-Meglio N., Campana I. (2017). Floating Macro-Litter Along the Mediterranean French Coast: Composition, Density, Distribution and Overlap With Cetacean Range. Mar. pollut. Bull. 118 (1-2), 155–166. doi: 10.1016/j.marpolbul.2017.02.026
Dixon T. J., Dixon T. R. (1983). Marine Litter Distribution and Composition in the North Sea. Mar. pollut. Bull. 14 (4), 145–148. doi: 10.1016/0025-326x(83)90068-1
EEA (2015) Europe Coastline Shapefile. Available at: https://www.eea.europa.eu/data-and-maps/data/eea-coastline-for-analysis-1/gis-data/europe-coastline-shapefile.
Eriksen M., Lebreton L. C., Carson H. S., Thiel M., Moore C. J., Borerro J. C., et al. (2014). Plastic Pollution in the World’s Oceans: More Than 5 Trillion Plastic Pieces Weighing Over 250,000 Tons Afloat at Sea. PloS One 9 (12), e111913. doi: 10.1371/journal.pone.0111913
Ershova A., Makeeva I., Malgina E., Sobolev N., Smolokurov A. (2021). Combining Citizen and Conventional Science for Microplastics Monitoring in the White Sea Basin (Russian Arctic). Mar. pollut. Bull. 173 (Pt A), 112955. doi: 10.1016/j.marpolbul.2021.112955
Everaert G., De Rijcke M., Lonneville B., Janssen C. R., Backhaus T., Mees J., et al. (2020). Risks of Floating Microplastic in the Global Ocean. Environ. pollut. 267, 115499. doi: 10.1016/j.envpol.2020.115499
Falk-Andersson J., Berkhout B. W., Abate T. G. (2019). Citizen Science for Better Management: Lessons Learned From Three Norwegian Beach Litter Data Sets. Mar. pollut. Bull. 138, 364–375. doi: 10.1016/j.marpolbul.2018.11.021
Fazey F. M., Ryan P. G. (2016). Biofouling on Buoyant Marine Plastics: An Experimental Study Into the Effect of Size on Surface Longevity. Environ. pollut. 210, 354–360. doi: 10.1016/j.envpol.2016.01.026
Furevik T., Bentsen M., Drange H., Johannessen J. A., Korablev A. (2002). Temporal and Spatial Variability of the Sea Surface Salinity in the Nordic Seas. J. Geophys. Res. Oceans 107 (C12), SRF 10–11-SRF 10-16. doi: 10.1029/2001jc001118
Gacutan J., Johnston E. L., Tait H., Smith W., Clark G. F. (2022). Continental Patterns in Marine Debris Revealed by a Decade of Citizen Science. Sci. Total. Environ. 807 (Pt 2), 150742. doi: 10.1016/j.scitotenv.2021.150742
Goldstein M. C., Titmus A. J., Ford M. (2013). Scales of Spatial Heterogeneity of Plastic Marine Debris in the Northeast Pacific Ocean. PloS One 8 (11), e80020. doi: 10.1371/journal.pone.0080020
Grøsvik B. E., Prokhorova T., Eriksen E., Krivosheya P., Horneland P. A., Prozorkevich D. (2018). Assessment of Marine Litter in the Barents Sea, a Part of the Joint Norwegian–Russian Ecosystem Survey. Front. Mar. Sci. 5. doi: 10.3389/fmars.2018.00072
Gutow L., Ricker M., Holstein J. M., Dannheim J., Stanev E. V., Wolff J. O. (2018). Distribution and Trajectories of Floating and Benthic Marine Macrolitter in the South-Eastern North Sea. Mar. pollut. Bull. 131 (Pt A), 763–772. doi: 10.1016/j.marpolbul.2018.05.003
Haarr M. L., Pantalos M., Hartviksen M. K., Gressetvold M. (2020). Citizen Science Data Indicate a Reduction in Beach Litter in the Lofoten Archipelago in the Norwegian Sea. Mar. pollut. Bull. 153, 111000. doi: 10.1016/j.marpolbul.2020.111000
Hidalgo-Ruz V., Thiel M. (2015). “The Contribution of Citizen Scientists to the Monitoring of Marine Litter,” in Marine Anthropogenic Litter. Eds. Bergmann M., Gutow L., Klages M. (Cham: Springer Open), 429–447.
Hinojosa I. A., Rivadeneira M. M., Thiel M. (2011). Temporal and Spatial Distribution of Floating Objects in Coastal Waters of Central–Southern Chile and Patagonian Fjords. Cont. Shelf Res. 31 (3-4), 172–186. doi: 10.1016/j.csr.2010.04.013
Hoffmann L., Eggers S. L., Allhusen E., Katlein C., Peeken I. (2020). Interactions Between the Ice Algae Fragillariopsis cylindrus and Microplastics in Sea Ice. Environ. Int. 139, 105697. doi: 10.1016/j.envint.2020.105697
Holst J. C., McDonald A. (2000). FISH-LIFT: A Device for Sampling Live Fish With Trawls. Fish. Res. 48 (1), 87–91. doi: 10.1016/S0165-7836(00)00116-8
Koelmans A. A., Redondo-Hasselerharm P. E., Nor N. H. M., de Ruijter V. N., Mintenig S. M., Kooi M. (2022). Risk Assessment of Microplastic Particles. Nat. Rev. Mater. 7 (2), 138–152. doi: 10.1038/s41578-021-00411-y
Kühn S., van Franeker J. A. (2020). Quantitative Overview of Marine Debris Ingested by Marine Megafauna. Mar. pollut. Bull. 151, 110858. doi: 10.1016/j.marpolbul.2019.110858
Kukulka T., Proskurowski G., Morét-Ferguson S., Meyer D. W., Law K. L. (2012). The Effect of Wind Mixing on the Vertical Distribution of Buoyant Plastic Debris. Geophys. Res. Lett. 39 (7). doi: 10.1029/2012gl051116
Law K. L., Moret-Ferguson S. E., Goodwin D. S., Zettler E. R., Deforce E., Kukulka T., et al. (2014). Distribution of Surface Plastic Debris in the Eastern Pacific Ocean From an 11-Year Data Set. Environ. Sci. Technol. 48 (9), 4732–4738. doi: 10.1021/es4053076
Lebreton L., Slat B., Ferrari F., Sainte-Rose B., Aitken J., Marthouse R., et al. (2018). Evidence That the Great Pacific Garbage Patch is Rapidly Accumulating Plastic. Sci. Rep. 8 (1), 4666. doi: 10.1038/s41598-018-22939-w
Li D., Liu K., Li C., Peng G., Andrady A. L., Wu T., et al. (2020). Profiling the Vertical Transport of Microplastics in the West Pacific Ocean and the East Indian Ocean With a Novel in Situ Filtration Technique. Environ. Sci. Technol. 54 (20), 12979–12988. doi: 10.1021/acs.est.0c02374
MacLeod M., Arp H. P. H., Tekman M. B., Jahnke A. (2021). The Global Threat From Plastic Pollution. Science 373 (6550), 61–65. doi: 10.1126/science.abg5433
Mallory M. L., Baak J., Gjerdrum C., Mallory O. E., Manley B., Swan C., et al. (2021). Anthropogenic Litter in Marine Waters and Coastlines of Arctic Canada and West Greenland. Sci. Total Environ. 783, 146971. doi: 10.1016/j.scitotenv.2021.146971
Marti E., Martin C., Galli M., Echevarria F., Duarte C. M., Cózar A. (2020). The Colors of the Ocean Plastics. Environ. Sci. Technol. 54 (11), 6594–6601. doi: 10.1021/acs.est.9b06400
Meyer A. N. (2022) Deep Dives Into Arctic Beach Debris. Analysing Its Composition and Origin.Bachelor’s thesis. Kiel: Christian-Albrechts Universität zu Kiel.
Murphy E., Nistor I., Cornett A., Wilson J., Pilechi A. (2021). Fate and Transport of Coastal Driftwood: A Critical Review. Mar. pollut. Bull. 170, 112649. doi: 10.1016/j.marpolbul.2021.112649
NE (2019) World Marine Regions. Available at: https://www.naturalearthdata.com/downloads/10m-physical-vectors/10m-physical-labels/.
Nelms S. E., Coombes C., Foster L. C., Galloway T. S., Godley B. J., Lindeque P. K., et al. (2017). Marine Anthropogenic Litter on British Beaches: A 10-Year Nationwide Assessment Using Citizen Science Data. Sci. Total. Environ. 579, 1399–1409. doi: 10.1016/j.scitotenv.2016.11.137
Olivelli A., Hardesty B. D., Wilcox C. (2020). Coastal Margins and Backshores Represent a Major Sink for Marine Debris: Insights From a Continental-Scale Analysis. Environ. Res. Lett. 15 (7), 074037. doi: 10.1088/1748-9326/ab7836
Ory N. C., Sobral P., Ferreira J. L., Thiel M. (2017). Amberstripe Scad Decapterus Muroadsi (Carangidae) Fish Ingest Blue Microplastics Resembling Their Copepod Prey Along the Coast of Rapa Nui (Easter Island) in the South Pacific Subtropical Gyre. Sci. Total Environ. 586, 430–437. doi: 10.1016/j.scitotenv.2017.01.175
OSPAR (2016) OSPAR Maritime Area and its Regions. Available at: https://odims.ospar.org/en/maps/map-maritime-area-and-its-regions/.
Palatinus A., Kovac Virsek M., Robic U., Grego M., Bajt O., Siljic J., et al. (2019). Marine Litter in the Croatian Part of the Middle Adriatic Sea: Simultaneous Assessment of Floating and Seabed Macro and Micro Litter Abundance and Composition. Mar. pollut. Bull. 139, 427–439. doi: 10.1016/j.marpolbul.2018.12.038
Parga Martínez K. B., Tekman M. B., Bergmann M. (2020). Temporal Trends in Marine Litter at Three Stations of the HAUSGARTEN Observatory in the Arctic Deep Sea. Front. Mar. Sci. 7, 321. doi: 10.3389/fmars.2020.00321
Peeken I., Primpke S., Beyer B., Gütermann J., Katlein C., Krumpen T., et al. (2018). Arctic Sea Ice is an Important Temporal Sink and Means of Transport for Microplastic. Nat. Commun. 9 (1), 1–12. doi: 10.1038/s41467-018-03825-5
Persson L., Carney Almroth B. M., Collins C. D., Cornell S., de Wit C. A., Diamond M. L., et al. (2022). Outside the Safe Operating Space of the Planetary Boundary for Novel Entities. Environ. Sci. Technol. 56 (3), 1510–1521. doi: 10.1021/acs.est.1c04158
Pham C. K., Ramirez-Llodra E., Alt C. H., Amaro T., Bergmann M., Canals M., et al. (2014). Marine Litter Distribution and Density in European Seas, From the Shelves to Deep Basins. PloS One 9 (4), e95839. doi: 10.1371/journal.pone.0095839
Pichel W. G., Churnside J. H., Veenstra T. S., Foley D. G., Friedman K. S., Brainard R. E., et al. (2007). Marine Debris Collects Within the North Pacific Subtropical Convergence Zone. Mar. pollut. Bull. 54 (8), 1207–1211. doi: 10.1016/j.marpolbul.2007.04.010
Pogojeva M., Zhdanov I., Berezina A., Lapenkov A., Kosmach D., Osadchiev A., et al. (2021). Distribution of Floating Marine Macro-Litter in Relation to Oceanographic Characteristics in the Russian Arctic Seas. Mar. pollut. Bull. 166, 112201. doi: 10.1016/j.marpolbul.2021.112201
Reisser J., Shaw J., Wilcox C., Hardesty B. D., Proietti M., Thums M., et al. (2013). Marine Plastic Pollution in Waters Around Australia: Characteristics, Concentrations, and Pathways. PloS One 8 (11), e80466. doi: 10.1371/journal.pone.0080466
Rothäusler E., Jormalainen V., Gutow L., Thiel M. (2019). Low Abundance of Floating Marine Debris in the Northern Baltic Sea. Mar. pollut. Bull. 149, 110522. doi: 10.1016/j.marpolbul.2019.110522
Ryan P. G. (2013). A Simple Technique for Counting Marine Debris at Sea Reveals Steep Litter Gradients Between the Straits of Malacca and the Bay of Bengal. Mar. Pollut. Bull. 69 (1-2), 128–136. doi: 10.1016/j.marpolbul.2013.01.016
Ryan P. G. (2014). Litter Survey Detects the South Atlantic ‘Garbage Patch’. Mar. pollut. Bull. 79 (1-2), 220–224. doi: 10.1016/j.marpolbul.2013.12.010
Ryan P. G. (2015). Does Size and Buoyancy Affect the Long-Distance Transport of Floating Debris? Environ. Res. Lett. 10 (8), 84019. doi: 10.1088/1748-9326/10/8/084019
Ryan P. G., Dilley B. J., Ronconi R. A., Connan M. (2019). Rapid Increase in Asian Bottles in the South Atlantic Ocean Indicates Major Debris Inputs From Ships. Proc. Natl. Acad. Sci. U. S. A. 116 (42), 20892–20897. doi: 10.1073/pnas.1909816116
Ryan P. G., Musker S., Rink A. (2014). Low Densities of Drifting Litter in the African Sector of the Southern Ocean. Mar. pollut. Bull. 89 (1-2), 16–19. doi: 10.1016/j.marpolbul.2014.10.043
Ryan P. G., Pichegru L., Perolod V., Moloney C. L. (2020). Monitoring Marine Plastics - Will We Know If We are Making a Difference? S. Afr. J. Sci. 116, 1–9. doi: 10.17159/sajs.2020/7678
Sa S., Bastos-Santos J., Araujo H., Ferreira M., Duro V., Alves F., et al. (2016). Spatial Distribution of Floating Marine Debris in Offshore Continental Portuguese Waters. Mar. pollut. Bull. 104 (1-2), 269–278. doi: 10.1016/j.marpolbul.2016.01.011
Stocker A. N., Renner A. H. H., Knol-Kauffman M. (2020). Sea Ice Variability and Maritime Activity Around Svalbard in the Period 2012-2019. Sci. Rep. 10 (1), 17043. doi: 10.1038/s41598-020-74064-2
Strand K. O., Huserbråten M., Dagestad K. F., Mauritzen C., Grøsvik B. E., Nogueira L. A., et al. (2021). Potential Sources of Marine Plastic From Survey Beaches in the Arctic and Northeast Atlantic. Sci. Total Environ. 790, 148009. doi: 10.1016/j.scitotenv.2021.148009
Suaria G., Aliani S. (2014). Floating Debris in the Mediterranean Sea. Mar. pollut. Bull. 86 (1-2), 494–504. doi: 10.1016/j.marpolbul.2014.06.025
Suaria G., Avio C. G., Mineo A., Lattin G. L., Magaldi M. G., Belmonte G., et al. (2016). The Mediterranean Plastic Soup: Synthetic Polymers in Mediterranean Surface Waters. Sci. Rep. 6, 37551. doi: 10.1038/srep37551
Suaria G., Melinte-Dobrinescu M. C., Ion G., Aliani S. (2015). First Observations on the Abundance and Composition of Floating Debris in the North-Western Black Sea. Mar. Environ. Res. 107, 45–49. doi: 10.1016/j.marenvres.2015.03.011
Suaria G., Perold V., Lee J. R., Lebouard F., Aliani S., Ryan P. G. (2020). Floating Macro- and Microplastics Around the Southern Ocean: Results From the Antarctic Circumnavigation Expedition. Environ. Int. 136, 105494. doi: 10.1016/j.envint.2020.105494
Tekman M. B., Krumpen T., Bergmann M. (2017). Marine Litter on Deep Arctic Seafloor Continues to Increase and Spreads to the North at the HAUSGARTEN Observatory. Deep-Sea Res. I: Oceanogr. Res. Pap. 120, 88–99. doi: 10.1016/j.dsr.2016.12.011
Tekman M. B., Walther B. A., Peter C., Gutow L., Bergmann M. (2022). Impacts of Plastic Pollution in the Oceans on Marine Species, Biodiversity and Ecosystems. (Berlin: WWF Germany, Berlin), 1–221.
Tekman M. B., Wekerle C., Lorenz C., Primpke S., Hasemann C., Gerdts G., et al. (2020). Tying Up Loose Ends of Microplastic Pollution in the Arctic: Distribution From the Sea Surface Through the Water Column to Deep-Sea Sediments at the HAUSGARTEN Observatory. Environ. Sci. Technol. 54 (7), 4079–4090. doi: 10.1021/acs.est.9b06981
Thiel M., Hinojosa I. A., Joschko T., Gutow L. (2011). Spatio-Temporal Distribution of Floating Objects in the German Bight (North Sea). J. Sea Res. 65 (3), 368–379. doi: 10.1016/j.seares.2011.03.002
Thomas D. N., Arevalo-Martinez D. L., Crocket K. C., Grosse F., Grosse J., Schulz K., et al. (2022). A Changing Arctic Ocean. Ambio 51 (2), 293–297. doi: 10.1007/s13280-021-01677-w
Thompson R. C., Olsen Y., Mitchell R. P., Davis A., Rowland S. J., John A. W. G., et al. (2004). Lost at Sea: Where Is All the Plastic? Science 304, 838. doi: 10.1016/j.scitotenv.2022.154886
UNEP (2005). Marine Litter: An Analytical Overview (Nairobi, Kenya: United Nations Environment Programme).
Unger B., Herr H., Viquerat S., Gilles A., Burkhardt-Holm P., Siebert U. (2021). Opportunistically Collected Data From Aerial Surveys Reveal Spatio-Temporal Distribution Patterns of Marine Debris in German Waters. Environ. Sci. Pollut. Res. 28 (3), 2893–2903. doi: 10.1007/s11356-020-10610-9
van Sebille E., Aliani S., Law K. L., Maximenko N., Alsina J. M., Bagaev A., et al. (2020). The Physical Oceanography of the Transport of Floating Marine Debris. Environ. Res. Lett. 15 (2), 32. doi: 10.1088/1748-9326/ab6d7d
van Sebille E., England M. H., Froyland G. (2012). Origin, Dynamics and Evolution of Ocean Garbage Patches From Observed Surface Drifters. Environ. Res. Lett. 7, 044040. doi: 10.1088/1748-9326/7/4/044040
van Sebille E., Wilcox C., Lebreton L., Maximenko N., Hardesty B. D., van Franeker J. A., et al. (2015). A Global Inventory of Small Floating Plastic Debris. Environ. Res. Lett. 10 (2), 124006. doi: 10.1088/1748-9326/10/12/124006
Vesman A., Moulin E., Egorova A., Zaikov K. (2020). Marine Litter Pollution on the Northern Island of the Novaya Zemlya Archipelago. Mar. Pollut. Bull. 150, 110671. doi: 10.1016/j.marpolbul.2019.110671
Węsławski J., Kotwicki L. (2018). Macro-Plastic Litter, a New Vector for Boreal Species Dispersal on Svalbard. Pol. Polar Res. 39, 165–174. doi: 10.24425/118743
Wilson C., Aksenov Y., Rynders S., Kelly S. J., Krumpen T., Coward A. C. (2021). Significant Variability of Structure and Predictability of Arctic Ocean Surface Pathways Affects Basin-Wide Connectivity. Commun. Earth Environ. 2 (1), 164. doi: 10.1038/s43247-021-00237-0
Keywords: marine debris, plastic, litter, Arctic, pollution, citizen science, Atlantic (north-east), floating
Citation: Tekman MB, Gutow L and Bergmann M (2022) Marine Debris Floating in Arctic and Temperate Northeast Atlantic Waters. Front. Mar. Sci. 9:933768. doi: 10.3389/fmars.2022.933768
Received: 01 May 2022; Accepted: 13 June 2022;
Published: 14 July 2022.
Edited by:
Britta Denise Hardesty, Commonwealth Scientific and Industrial Research Organisation (CSIRO), AustraliaReviewed by:
Sarah Nelms, University of Exeter, United KingdomGiuseppe Suaria, Institute of Marine Science, National Research Council (CNR), Italy
Copyright © 2022 Tekman, Gutow and Bergmann. This is an open-access article distributed under the terms of the Creative Commons Attribution License (CC BY). The use, distribution or reproduction in other forums is permitted, provided the original author(s) and the copyright owner(s) are credited and that the original publication in this journal is cited, in accordance with accepted academic practice. No use, distribution or reproduction is permitted which does not comply with these terms.
*Correspondence: Mine B. Tekman, mine.banu.tekman@awi.de