Metabolite Profiling of the Social Spider Stegodyphus dumicola Along a Climate Gradient
 Tobias Sandfeld1,2
  Kirsten Gade Malmos3†
  Camilla Bak Nielsen4
  Marie Braad Lund1
  Anne Aagaard2
  Jesper Bechsgaard2
  Martina Wurster5
  Michael Lalk5
  Mogens Johannsen4
  Thomas Vosegaard3,6
  Trine Bilde2*
  Andreas Schramm1
- 1Section for Microbiology, Department of Biology, Aarhus University, Aarhus, Denmark
- 2Section for Genetics, Ecology, and Evolution, Department of Biology, Aarhus University, Aarhus, Denmark
- 3Interdisciplinary Nanoscience Center (iNANO), Aarhus University, Aarhus, Denmark
- 4Department of Forensic Medicine, Aarhus University, Aarhus, Denmark
- 5Cellular Biochemistry and Metabolomics, Institut für Biochemie, University of Greifswald, Greifswald, Germany
- 6Department of Chemistry, Aarhus University, Aarhus, Denmark
Animals experience climatic variation in their natural habitats, which may lead to variation in phenotypic responses among populations through local adaptation or phenotypic plasticity. In ectotherm arthropods, the expression of thermoprotective metabolites such as free amino acids, sugars, and polyols, in response to temperature stress, may facilitate temperature tolerance by regulating cellular homeostasis. If populations experience differences in temperatures, individuals may exhibit population-specific metabolite profiles through differential accumulation of metabolites that facilitate thermal tolerance. Such thermoprotective metabolites may originate from the animals themselves or from their associated microbiome, and hence microbial symbionts may contribute to shape the thermal niche of their host. The social spider Stegodyphus dumicola has extremely low genetic diversity, yet it occupies a relatively broad temperature range occurring across multiple climate zones in Southern Africa. We investigated whether the metabolome, including thermoprotective metabolites, differs between populations, and whether population genetic structure or the spider microbiome may explain potential differences. To address these questions, we assessed metabolite profiles, phylogenetic relationships, and microbiomes in three natural populations along a temperature gradient. The spider microbiomes in three genetically distinct populations of S. dumicola showed no significant population-specific pattern, and none of its dominating genera (Borrelia, Diplorickettsia, and Mycoplasma) are known to facilitate thermal tolerance in hosts. These results do not support a role of the microbiome in shaping the thermal niche of S. dumicola. Metabolite profiles of the three spider populations were significantly different. The variation was driven by multiple metabolites that can be linked to temperature stress (e.g., lactate, succinate, or xanthine) and thermal tolerance (e.g., polyols, trehalose, or glycerol): these metabolites had higher relative abundance in spiders from the hottest geographic region. These distinct metabolite profiles are consistent with a potential role of the metabolome in temperature response.
Introduction
Animal populations are subject to different local environments within their distribution range, and this environmental variation may lead to different phenotypic responses across populations, through local adaptation or phenotypic plasticity (Hoffmann and Sgró, 2011). Temperature is considered a particularly important driver of phenotypic divergence (Bicego et al., 2007; Deutsch et al., 2008), and temperature stress imposes challenges on maintaining cellular homeostasis, which may select for a range of behavioral, morphological and physiological temperature adaptations (Cloudsley-Thompson, 1975; Sømme, 1982; Sinclair et al., 2003; Colinet et al., 2015; Malmos et al., 2021). Exposure to temperature stress can lead to metabolic changes conveying thermal tolerance by an accumulation of metabolites that regulate the animal’s cellular homeostasis and hereby protect against temperature stress (Michaud et al., 2008; Colinet et al., 2016). The role of metabolites in maintaining cellular homeostasis may be particularly important in ectotherms in extreme temperature environments, as their body temperature fluctuates with the surrounding thermal environment.
Sugars and polyols play important roles in arthropod cold tolerance, as indicated by the accumulation of these compounds in response to temperature decrease (Block, 1981; Zachariassen, 1985; Sinclair et al., 2003; Doucet et al., 2009). Furthermore, an increase in glucose and trehalose levels after cold shock is related to improved cold tolerance in drosophilid flies (Overgaard et al., 2007; Vesala et al., 2012). In addition, inositol, sorbitol, and glycogen can fluctuate seasonally as a response to fluctuating temperatures, and accumulations of these metabolites were correlated with enhanced cold tolerance in the house spider Parasteatoda tepidariorum (Tanaka, 1993, 1995). In contrast, the functional role of metabolites in responses to heat stress in arthropods is less clear, but several metabolites have been found to accumulate including free amino acids and citric acid cycle (CAC) intermediates (Malmendal et al., 2006; Colinet et al., 2007; Chou et al., 2017; Zhu et al., 2019). For example, glutamine has been found to enhance expression and turnover of heat shock proteins to facilitate temperature stress tolerance in various animal species [reviewed by Wischmeyer (2002)]. Also, polyols accumulate in response to heat stress and can stabilize proteins and protect cell membrane integrity at high temperatures (Salvucci, 2000). Sorbitol is present at elevated levels in heat-stressed whiteflies (Bemisia argentifolii), and individuals reared on sorbitol-enriched diets showed improved survival when exposed to heat stress. This indicates the adaptive significance of sorbitol in enhancing heat tolerance (Wolfe et al., 1998; Salvucci, 2000). Hence, thermal cross-tolerance known from small heat shock proteins (Sejerkilde et al., 2003; Bubliy and Loeschcke, 2005) is also possible with low-molecular-weight metabolites, and therefore polyols are good candidate metabolites for facilitating both cold and heat tolerance in arthropods.
Thermoprotective metabolites can be produced by the animals themselves or by their associated microbiome, which can affect host metabolomes directly via microbially produced metabolites and/or by the stimulation of host metabolite production (Douglas, 2018). Moreover, microbial symbionts can lyse at high temperatures, which releases and thereby increases the abundance of thermoprotective metabolites such as sorbitol, sugars, and amino acids (Dunbar et al., 2007; Burke et al., 2010). Thus, microbial symbionts can contribute to arthropod protection during thermal stress. However, it is unknown how widespread this function of the microbiome is in arthropods.
Social spiders of the genus Stegodyphus (Eresidae) live in communal nests with up to hundreds of individuals (Avilés, 1997; Lubin and Bilde, 2007). As individuals within nests originate from the same family and reproduce with each other, populations are highly inbred and harbor extremely low genetic diversity, which is hypothesized to limit evolutionary potential (Settepani et al., 2017). Nevertheless, social spiders such as Stegodyphus dumicola Pocock 1898 are widely distributed in (sub)tropical arid regions that encompass multiple climate zones (Kraus and Kraus, 1988; Majer et al., 2013). Temperature and humidity can fluctuate substantially temporally and spatially across the spiders’ thick silk-woven nests, which are located in trees and bushes (Lubin and Bilde, 2007). Temperature inside the nest can reach extreme levels that exceed the thermal limits of most arthropods (Hoffmann et al., 2013) and potentially expose the spiders to heat stress. Recently, variation in behavioral and physiological responses to high temperature among geographical locations was demonstrated in S. dumicola; their temperature preference was dependent on the populations the spiders came from (consistent with local adaptation in temperature preference), and on the acclimation temperature they had experienced in the lab (consistent with a plastic response in temperature preference), indicating that populations exhibit adapted as well as plastic responses to cope with different temperature regimes (Malmos et al., 2021). The extent to which specific thermoprotective metabolites are involved in facilitating temperature tolerance or temperature responses, and whether such responses are population specific is yet to be determined. If populations experience differences in variables such as temperature in different environments, this could lead to differences in the metabolite profiles between populations, for example by the presence of more thermoprotective metabolites in populations that experience higher temperatures. Another question relates to the role of the microbiome in shaping the metabolite profiles of the host. Studies of the S. dumicola microbiome showed that social spider individuals within a nest share a similar microbiome, that the microbiome has relatively low diversity, and that it varies between populations and even between nests within populations (Busck et al., 2020); no spider population-specific microbiome patterns have been detected so far. A few bacterial endosymbionts classified as Borrelia, Diplorickettsia, and Mycoplasma dominate the microbiome of individual spiders, but they are not obligate, and a potential role of symbionts in temperature responses of the host remains unknown (Busck et al., 2020).
As a first step toward understanding the metabolome in relation to temperature responses, we determined metabolite profiles, phylogenetic relationships, and microbiomes in three geographically separate S. dumicola populations from locations on a climatic gradient with contrasting temperature and precipitation regimes in Namibia (Southern Africa). The goal of our study was to assess if there is variation in S. dumicola metabolite profiles among locations. If there is variation in metabolites involved in temperature response (such as polyols) caused by local adaptation or phenotypic plasticity, we would expect to find population-specific metabolite profiles matching the relevant climatic gradient. Alternatively, if there is an association between genetic and metabolite profiles, population-specific patterns could result from genetic drift, and hence more related populations would have more similar metabolite profiles. In addition, if specific members of the microbiome contribute to the adaptive variation in metabolites, we would expect to find a population-specific pattern in the microbiome that matches the pattern in the metabolome.
Materials and Methods
Sampling
Stegodyphus dumicola spiders were collected from three populations along a climate gradient in Namibia during February 2019. The three locations were from North to South: Otavi, Windhoek, and Stampriet (Figure 1). Three to four nests were sampled from each population (for metadata see Supplementary Table 1), and only adult females were collected to minimize the effect of age and sex on microbiome composition and metabolite profiles. The nests from the three populations were collected in the late afternoon, the ambient temperature at the time of sampling was measured with a handheld thermometer next to the nest, and nests were immediately brought back to our field lab where the spiders were sorted, and all adult females from each nest (12 – 69 individuals per nest, on average 46 individuals per nest) were placed in Falcon tubes and subsequently frozen at −20°C. All adult females from one nest comprised one sample, thus the total number of samples was 10. The samples were packed on ice and shipped from Namibia to Aarhus University, Denmark. Upon arrival at the laboratory, the samples were immediately placed at −80°C until further processing.
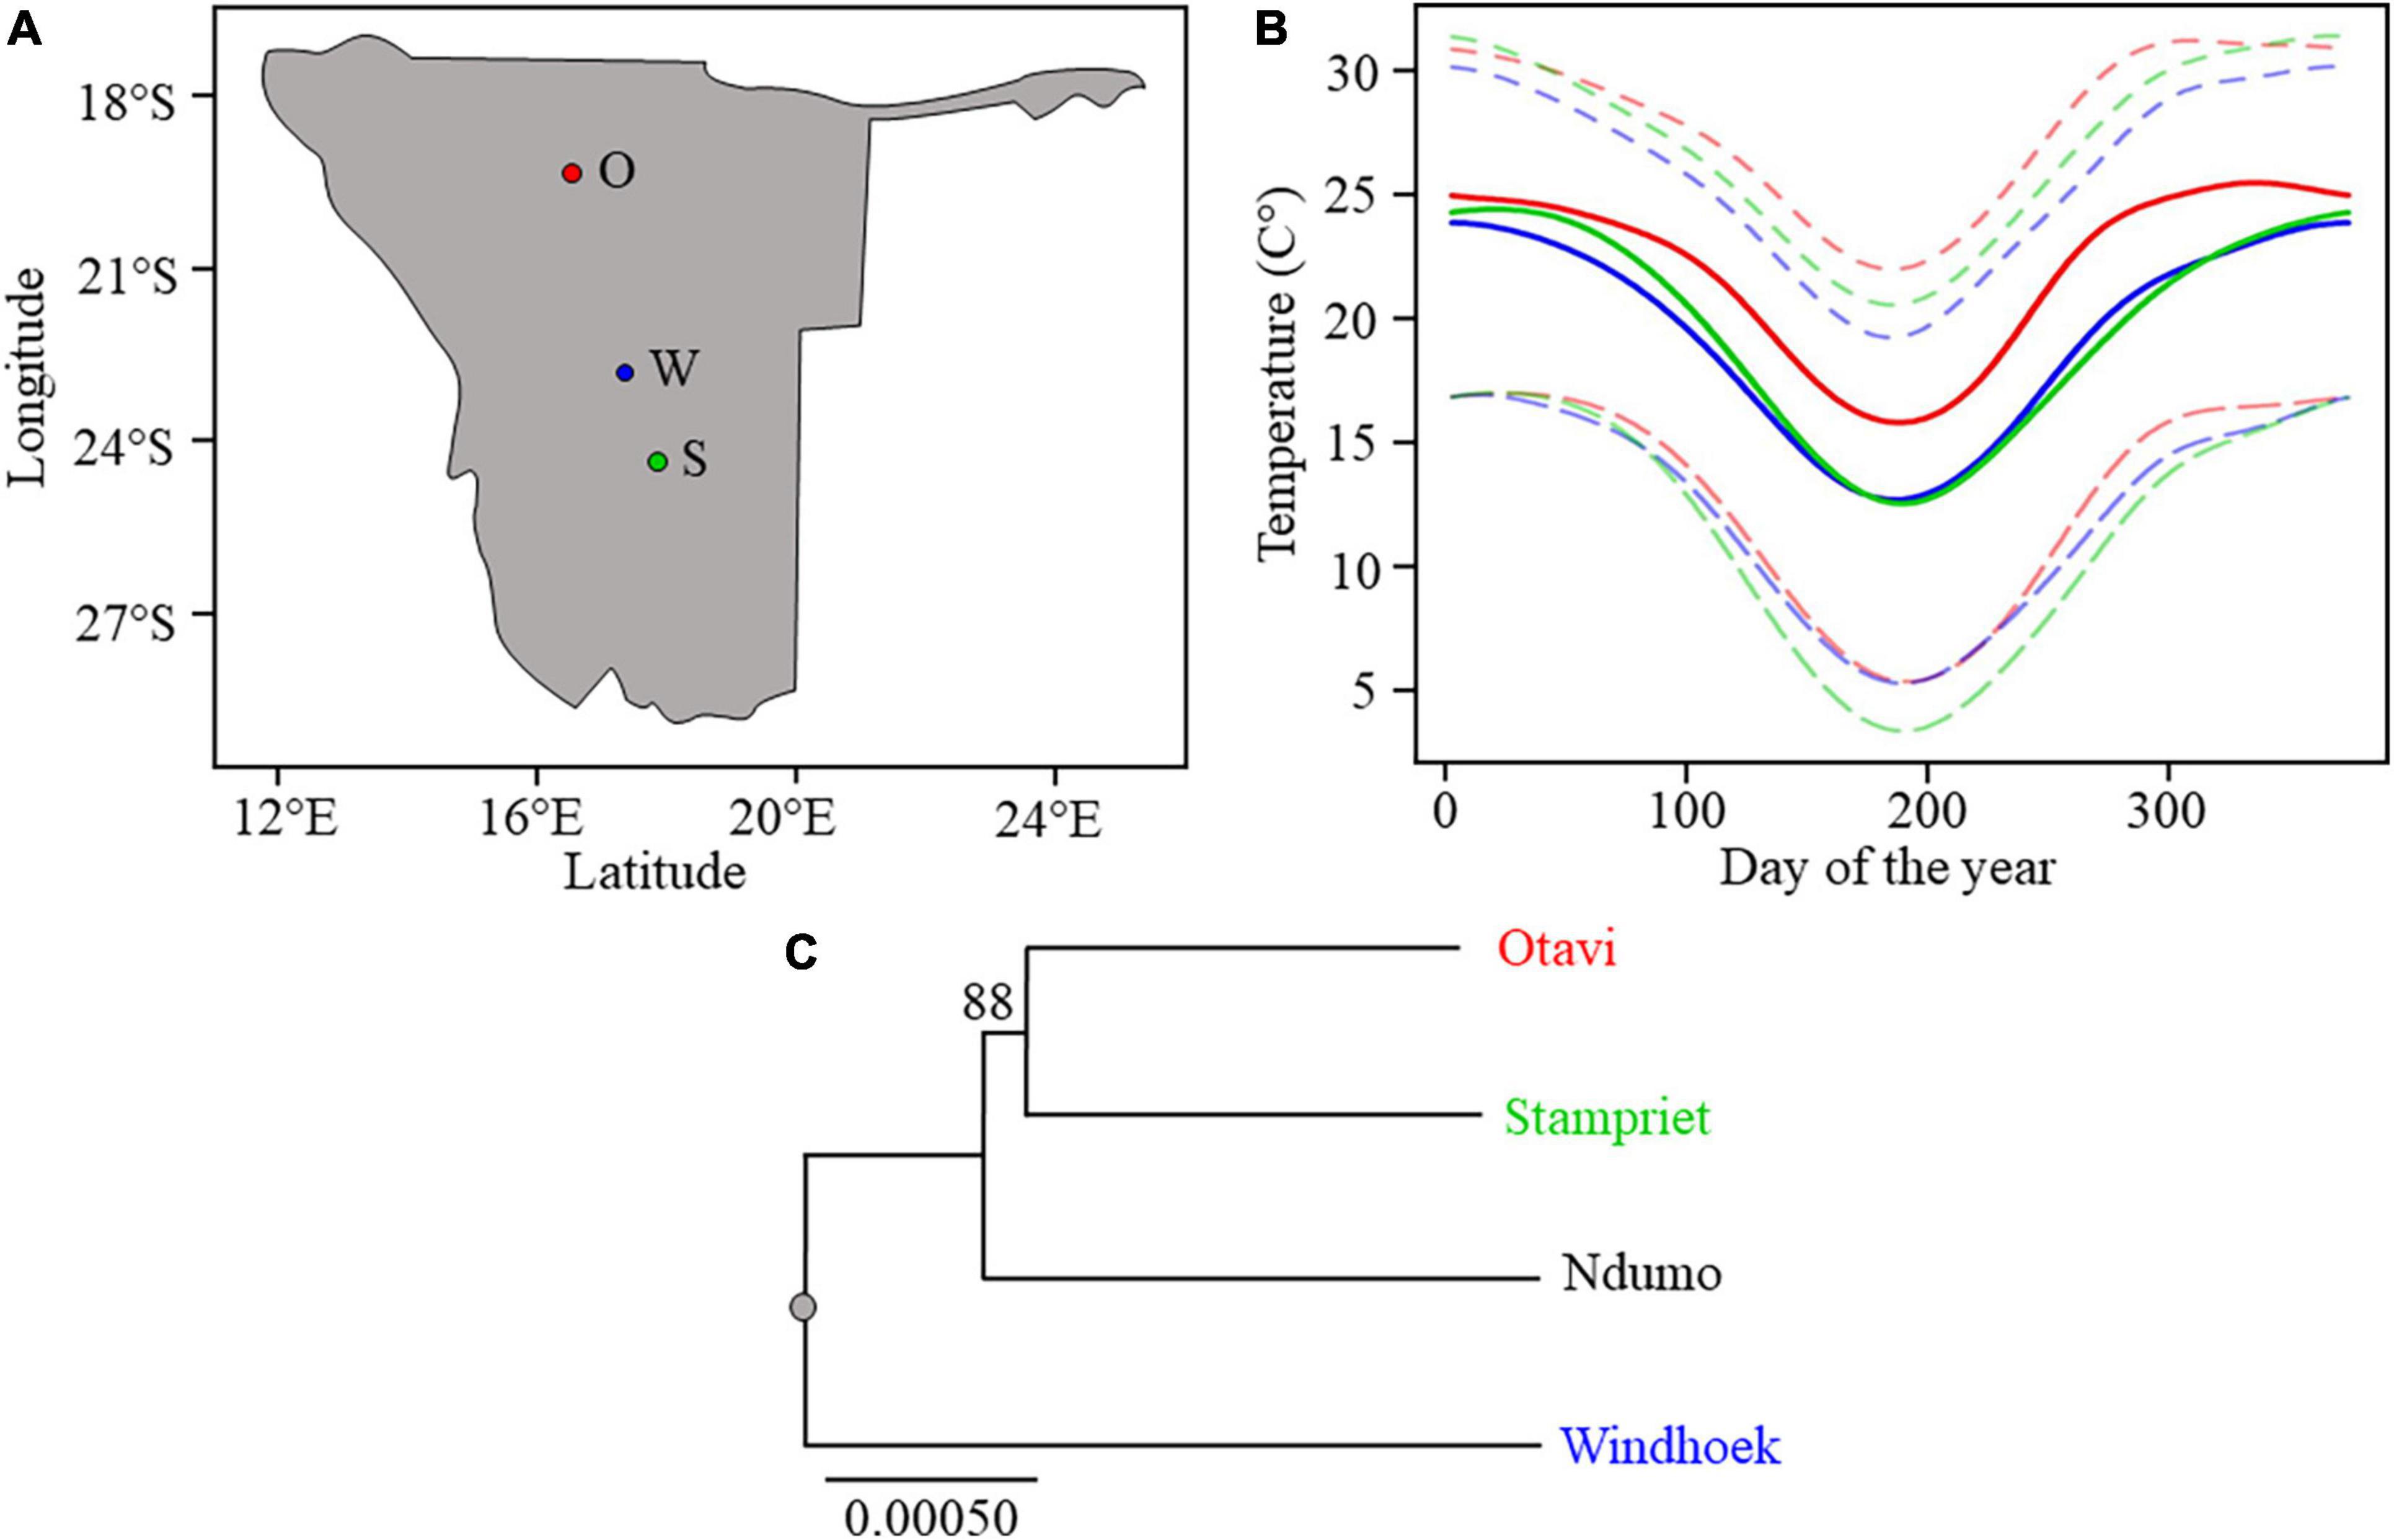
Figure 1. (A) Map of Namibia with sampling sites depicted with circles. From North to South: Otavi (O), Windhoek (W), and Stampriet (S). (B) Average maximum, mean, and minimum temperatures for the three sampled sites along the temperature gradient: Otavi (in red) is the hottest site, then Stampriet (in green) and Windhoek (in blue). The temperature plots are based on daily mean temperature from 30 years (1961–1990) climate data (Grieser et al., 2006). (C) Phylogenetic tree based on a subset of coding positions showing S. dumicola population phylogeny of sampled populations. Bootstrap values above 60% are shown. The scale bar indicates the proportion of sites changing along the branches.
Temperature Gradient: Average Maximum, Mean, and Minimum Plots
Temperature data were downloaded using the application New_LocClim_1.10 (Grieser et al., 2006) that interpolates climate station measurements (FAOCLIM database) to the input GPS positions from the three populations and outputs daily climate estimations of selected variables. Nest GPS points (Supplementary Table 1) were used to represent each population and to create temperature estimates for the sampled populations. Shepard’s Interpolation method was used to estimate average maximum and minimum temperatures.
Stegodyphus dumicola Population Phylogeny
To obtain a deeper understanding of the phylogenetic relationship between the sampled S. dumicola populations a phylogenic tree was determined on spiders from Otavi, Windhoek, and Stampriet, as well as a South African population from Ndumo (Figure 1). Shotgun sequence data (paired-end, BGISEQ) from resequencing of four individuals from each location were mapped to the S. dumicola genome (Liu et al., 2019) using BWA (v0.7.15) “aln” (Li and Durbin, 2009) allowing a maximum of 2 mismatches and converted to bam files using samtools (v1.2) (Li et al., 2009). Vcf files were created using bcftools (“mpileup” without indel calling (−I) and “call”) (Li, 2011). Coding positions were extracted using samtools “faidx” (Li et al., 2009), and consensus sequences were called using bcftools “consensus” (Danecek and McCarthy, 2017). Consensus sequences were joined into a single concatenated sequence per location and aligned. Every 50th exon was extracted, resulting in an alignment of about 1,500,000 bp. A neighbor-joining phylogeny was reconstructed using Mega (Kumar et al., 2018). 1000 bootstraps were used to add support to the topology.
Microbiome Analysis
Stegodyphus dumicola microbiomes were analyzed following Busck et al. (2020). In brief, one adult female spider from each of the 10 nests within the three investigated populations was sampled (Figure 1 and Supplementary Table 1), as a previous study had shown that spiders from the same nest had very similar microbiomes (Busck et al., 2020). DNA was extracted from whole spiders and used for amplicon sequencing of the V3-V4 region of the 16S rRNA gene using standard methods (Busck et al., 2020). All analyses and visualizations of community data were done in R1 with custom scripts (see Busck et al., 2020).
Extraction for Metabolite Profiling
A total of 10 adult S. dumicola females from each nest were pooled, homogenized, and sequentially extracted with cold methanol (80%) and afterward cold HPLC-grade water in TeenPrep™ Lysing Matrix E (15 mL tubes) using a FastPrep-24™ 5G Homogenizer (MP Biomedicals, United States). The resulting extraction fractions were mixed and diluted to 8% methanol with HPLC-grade water to enable flash freezing in liquid nitrogen and lyophilization. The frozen extracts were lyophilized on a MicroModulyo Freeze Dryer (Thermo Fisher Scientific, United States) coupled to a Chemistry-HYBRID RC 6 vacuum pump (Vacuubrand GmbH, Germany) till dry and stored at −80°C until further processing. From each dried sample (10 in total), three subsamples (technical replicates) of approx. 1 mg were made and subsequently analyzed with gas chromatography coupled to mass spectrometry (GC-MS) and UHPLC-MS.
Gas Chromatography Coupled to Mass Spectrometry Analysis
GC-MS analysis was done on an Agilent 7890B gas chromatograph (Agilent, United States) coupled to a mass selective detector (Agilent 5977B Inert Plus Turbo MSD). Prior to injection, approx. 1 mg extract was derivatized with 40 μl methoxyamine hydrochloride at 37°C for 90 min and 80 μl N-methyl-N-(trimethylsilyl)trifluoracetamide at 37°C for 30 min in accordance with Liebeke et al. (2008). Samples were injected with an Agilent SSL-injector (Split 25:1 at 230°C, 2.0 μL; carrier gas: Helium 1.0 mL min–1 (60 kPa) at 110°C; pressure rise: 6 kPa min–1). Chromatography was performed using a 30-m HP-5ms column (J&W Scientific, United States) with 0.25 mm i.d. and 0.25 μm film thickness. The oven program started with 1 min at 70°C, the oven temperature was increased at 1.5°C min–1 to 76°C; 5°C min–1 to 220°C; 20°C min–1 to 325°C with an 8 min hold. The MS was operated in electron impact mode with an ionization energy of 70 eV. Full scan mass spectra were acquired from 50 to 500 m/z at a rate of 2.74 scans s–1 and with a 6.00 min solvent delay. The detected compounds were identified by processing the raw GC-MS data with MassHunter version B 8.00 software (Agilent, United States) and comparing retention times and mass spectra of detected metabolites with those of standard compounds, which were measured for an in-house database. Unknown peaks were analyzed with Fiehn library (Kind et al., 2009) and NIST 2017 mass spectral database 2.0 d (National Institute of Standards and Technology, United States) and were listed with the database score.
Ultra-High-Performance Liquid Chromatography Coupled to Quadrupole Time-of-Flight Mass Spectrometry Analysis
UHPLC-MS analysis was obtained with Acquity UPLC I-Class system (Waters Corporation, United States) coupled to a Q-TOF maXis Impact mass spectrometer (Bruker Daltonics GmbH, Germany) operated in positive (ESI +) or negative (ESI−) ionization mode. Before injection, extracts of pooled spider homogenates (1 mg mL–1) were suspended in 0.1% formic acid in water and quality control (QC) samples were prepared by pooling equal volumes of each sample. Samples were injected with an auto sampler: 2 μL was injected in ESI+ mode and 10 μL in ESI– mode, and the sample temperature was 6°C. Liquid chromatographic (LC) separation was performed on an Acquity UPLC HSS T3 Column (2.1 mm × 100 mm, 1.8 μm) (Waters Corporation). The column temperature was 50°C. Mobile phase A consisted of 0.1% formic acid in MilliQ water, and mobile phase B consisted of 0.1% formic acid in 50:50 acetonitrile/methanol (LCMS Hypergrade, Sigma-Aldrich). The mobile phase started at 100% A for 2 min, linear increase from 0 to 40% B at 2 to 6 min, from 40 to 60% B at 6 to 6.5 min, from 60 to 88% B at 6.5 to 11 min, from 88 to 100% B at 11 to 11.5 min, 100% B at 11.5 to 17 min. This was followed by a linear decrease from 100 to 0% B at 17 to 18.1 min and afterward 100% A for column equilibration at 18.1 to 21.0 min. The MS was operated with a mass range of m/z 50–1000, a sampling rate of 4 Hz, and the capillary voltage was 4000 V (ESI+) and 2500 V (ESI−). The nebulizing gas pressure was 4 bars, drying gas flow was 11 L min–1 and temperature was 220°C. Instrument calibration was done with sodium formate for both ESI + mode and ESI- mode and repeated for the first 20 s (30 scans) of each analysis. In addition, all samples were auto-calibrated in DataAnalysis (Bruker Daltonics, Germany) before peak identification, to improve mass accuracy further. To validate the performance of the instrument, control samples with 15 known metabolites were analyzed at the beginning and end of each UHPLC-MS run, and a quality control (QC) sample (a pool of all samples) was injected in the beginning and following approx. every five samples.
Data were examined in DataAnalysis (Bruker Daltonics, Germany) and converted to the file mzML format by CompassXport (Bruker Daltonics, Germany). Features, described by an m/z value, a retention time, and an area under the peak curve, were extracted with XCMS (Smith et al., 2006) using R project, version 3.2.0 (see text footnote 1). Removal of calibration scans (30 scans) was performed prior to peak detection. CAMERA was used for grouping features and annotations of isotopes and adducts (Kuhl et al., 2012). Peak detection was performed using the CentWave algorithm (Tautenhahn et al., 2008) with 12 ppm resolution and with a signal-to-noise threshold of six. Retention time correction was performed with the Obiwarp algorithm (Prince and Marcotte, 2006). For identification, an in-house database, Metlin2, The Human Metabolome Database3, and Metfrag4 were used. The identity of the metabolites was confirmed by comparison of m/z values, retention time, and fragments of available authentic standards with those obtained in the samples. The level of identification was designated according to the guidelines of the Metabolomics Standard Initiative (Sumner et al., 2007).
Statistical Analysis of GC-MS and UHPLC-MS Data
For all statistics average relative abundance of metabolites per nest, e.g., average of metabolite x in nest y, were calculated and used as input data. The data set was analyzed using multivariate analysis with the online statistics tool in MetaboAnalyst5, see Xia and Wishart, 2011). Data were normalized by sum (in Excel) and Pareto-scaled before principal component analysis (PCA) and partial least squares-discriminant analysis (PLS-DA). PCA was used for exploratory visualization of the data, whereas PLS-DA was used to locate differences between the three populations. Metabolites with variable importance parameters (VIP score) > 1 were considered largely important for separation of populations. To evaluate significant differences, a post hoc ANOVA test based on an F-test was employed and to correct for multiple testing issues false discovery rate (FDR) q-values were calculated. Metabolites with a q-value < 0.05 were considered significant, but all identified metabolites are reported. Analysis of similarities (ANOSIM) (Clarke, 1993; Warton et al., 2012) and a pairwise t-test based on a Bray-Curtis dissimilarity matrix, calculated on average relative abundance, was performed to test if metabolite profiles were significantly different within and between populations. This analysis was conducted in R with custom scripts originally designed for microbiome data (see Busck et al., 2020).
Data Availability
The V3–V4 16S rRNA gene amplicon sequences were submitted to NCBI Sequence Read Archive (SRA) with the BioProject number PRJNA766841.
Results
Climate Data and Spider Populations
According to long-term daily temperature data, the three sampling sites represent a temperature gradient were Otavi is the hottest of the three locations, Stampriet is intermediate and Windhoek is the coldest (Figure 1B). The average maximum and minimum temperatures mirror this gradient although Stampriet has the lowest average minimum temperature over a year. In addition, Otavi shows the largest and Windhoek shows the smallest difference between maximum and minimum temperatures (Figure 1B). The temperatures at the time of sampling reflected this gradient as Otavi (43.3°C ± 0.5) was hotter than Stampriet (40.2°C ± 0.9) and Windhoek (37.5°C ± 0.1) (Supplementary Table 1). This ranked temperature difference between the sampling sites was significant (p < 0.05, ANOVA Supplementary Table 1). These data indicate that the thermal niche of the three spider populations is indeed different. The three S. dumicola populations were genetically distinct, with spiders from the Otavi and Stampriet populations clustering together in the phylogeny, suggesting that these populations separated from the Windhoek population before splitting into separate populations (Figure 1B). Note that their geographical distribution cannot predict their phylogenetic relationship, as Otavi spiders are closer related to Stampriet, while geographically closest to Windhoek.
The Stegodyphus dumicola Microbiome
The microbiome of the sampled populations had low diversity and one specific member of the microbiome dominated the microbial community in individual spiders (Supplementary Figure 1): spiders from Otavi had all very similar microbiomes according to their tight grouping in the NMDS ordination (Figure 2), with a single Mycoplasma (ASV1) strongly dominating each individual spider (Supplementary Figure 1). In contrast, spiders from Stampriet and Windhoek had more dissimilar (Figure 2) and relatively more diverse microbiomes (Supplementary Figure 1), dominated by either Mycoplasma (ASV2) and Diplorickettsia (ASV4) (Stampriet), or by Weeksellaceae (ASVs 3 & 5) and Borrelia (ASV8) in combination with other bacteria (Windhoek) (Supplementary Figure 1). Despite these apparent differences, the population-specific pattern emerging from the NMDS ordination was not statistically significant according to ANOSIM (Figure 2).
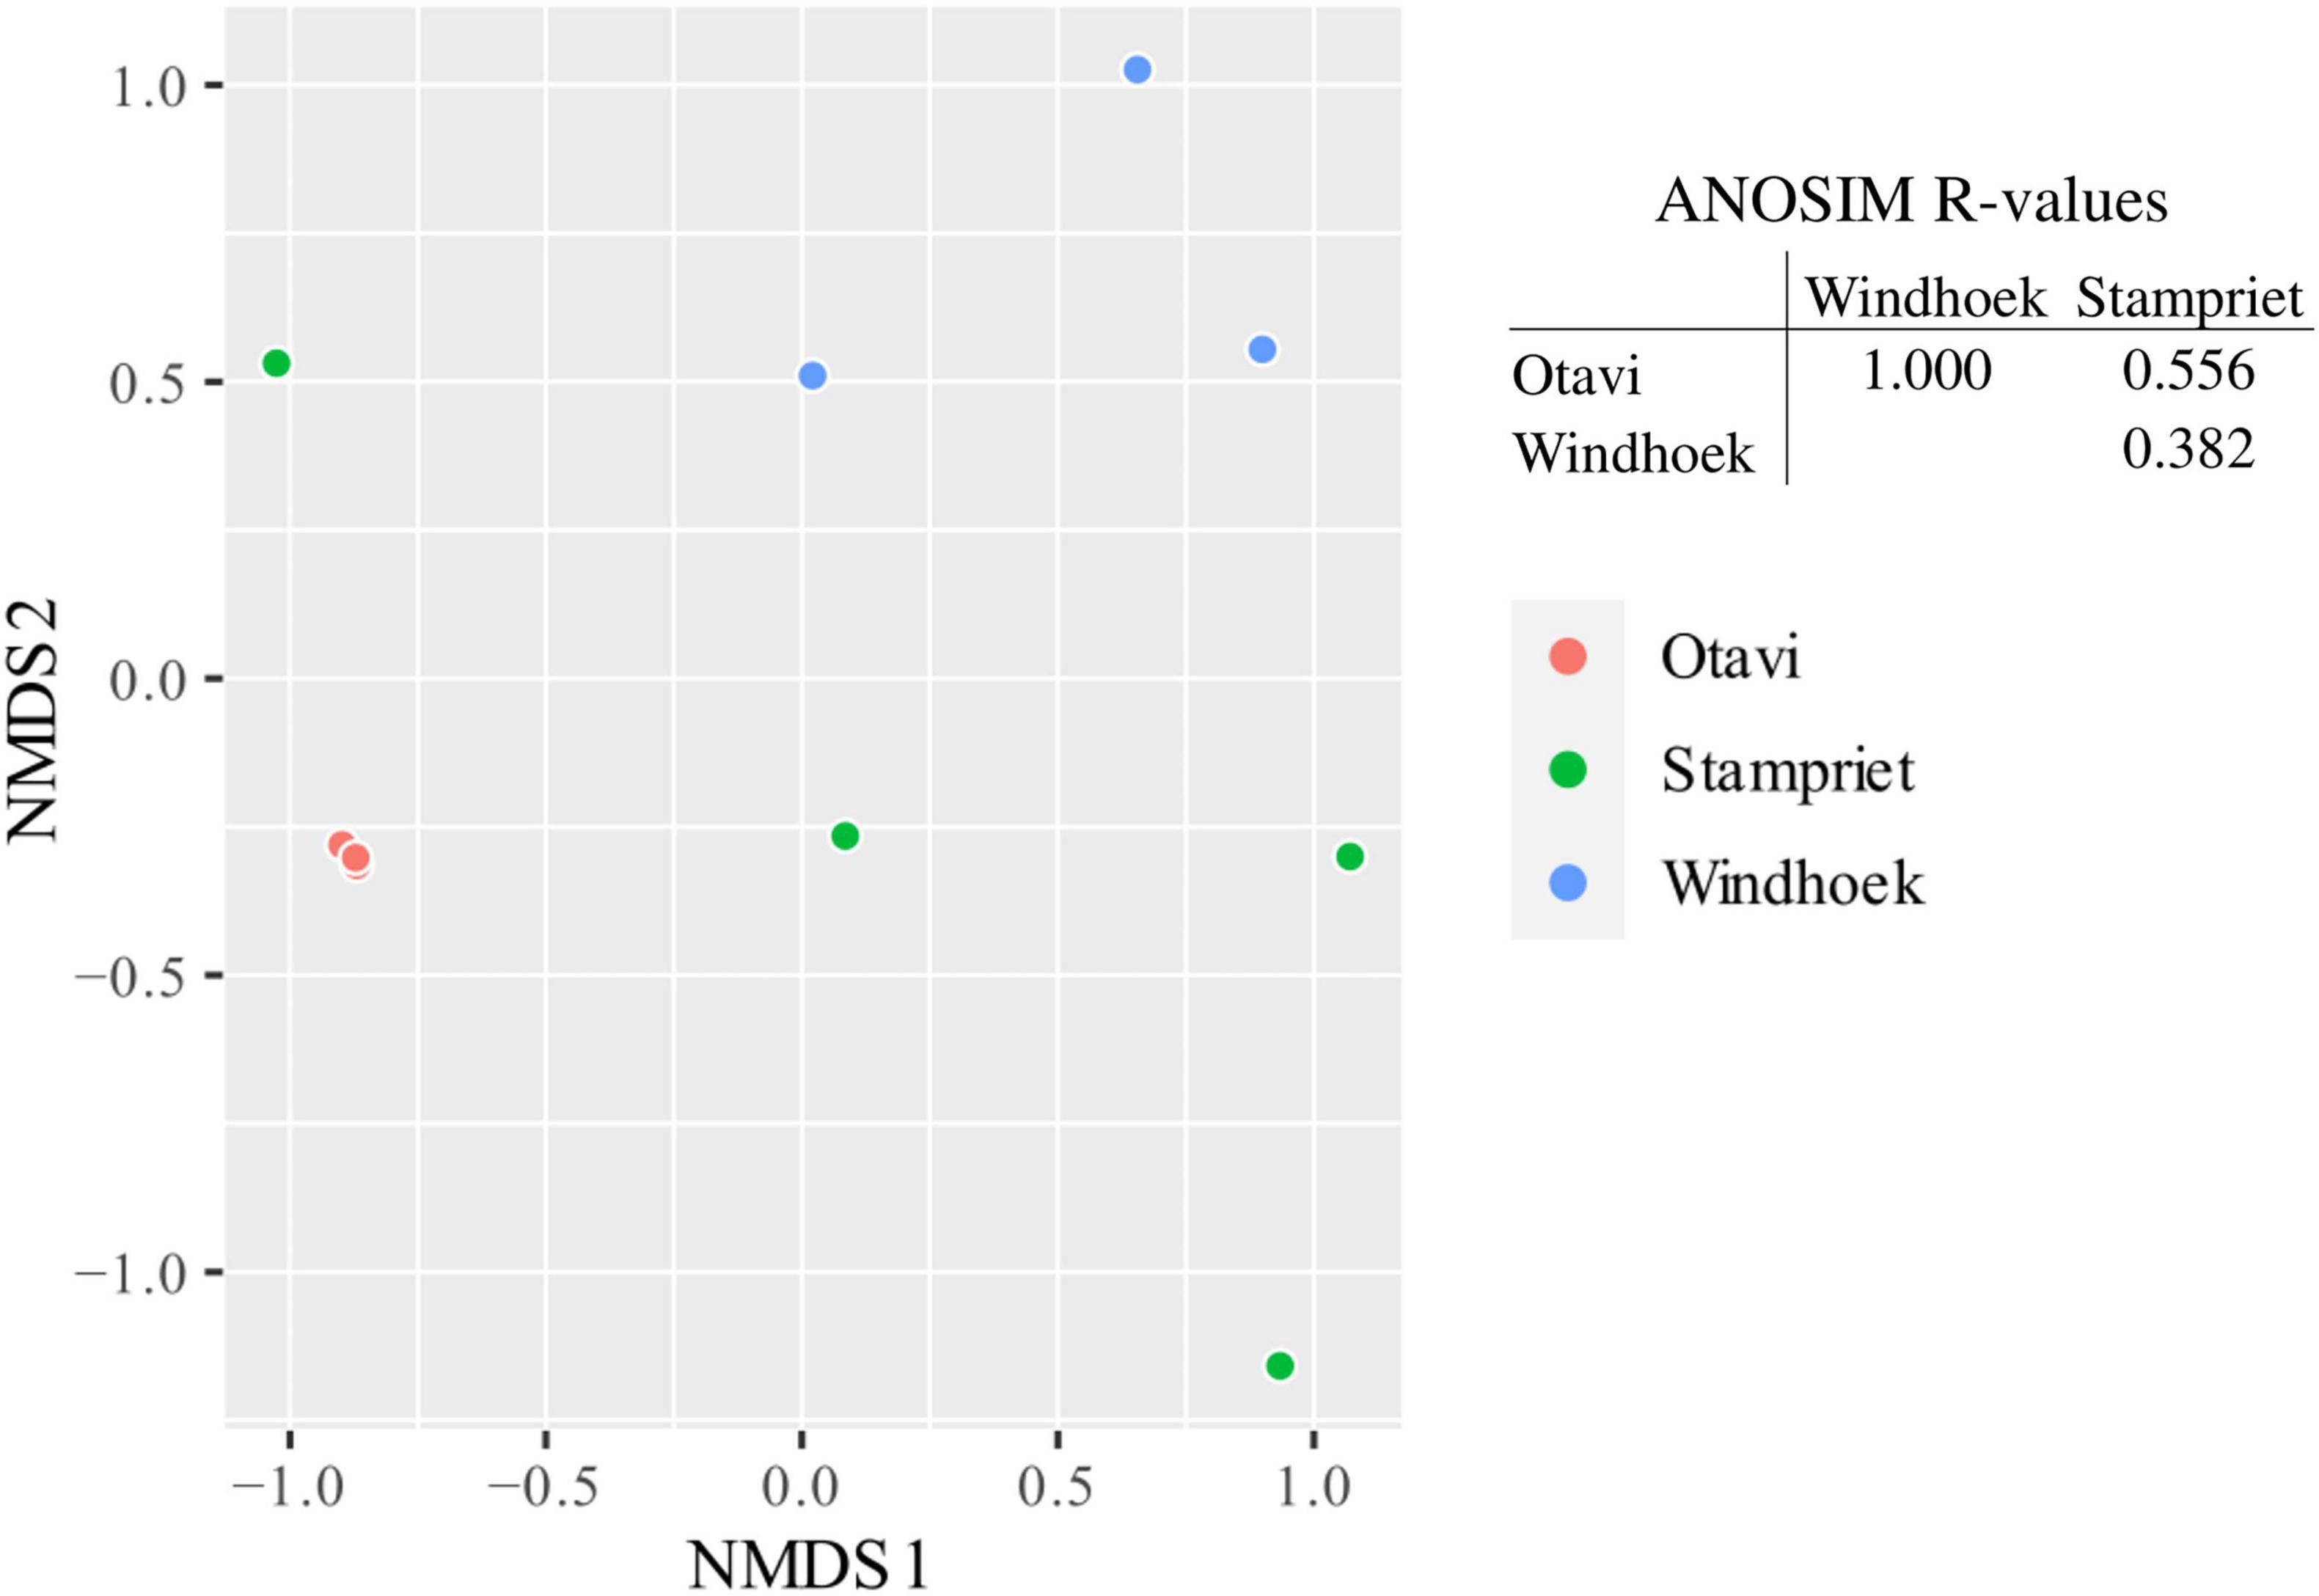
Figure 2. Non-metric multidimensional scaling (NMDS) ordination of sampled S. dumicola microbiomes and analysis of similarities (ANOSIM) of microbiome data. For microbiome composition, see Supplementary Figure 1. NMDS ordination is based on Bray-Curtis dissimilarities. Each point is an individual spider’s microbiome representing a nest of the respective populations (Otavi in red, Stampriet in green and Windhoek in blue). The ANOSIM analysis is based on Bray-Curtis dissimilarities and indicates the degree of difference between populations; R = 0 indicates no difference in microbiome composition between populations and R = 1 indicates a high degree of difference in microbiome composition between populations. Between populations, there was no significant difference (p > 0.05) in microbiome composition.
Metabolite Profiles and Population Patterns
Metabolite profiles from the three populations yielded in total 128 identified metabolites, with 19 identified by both GC-MS and LC-MS. Of the 59 metabolites identified by GC-MS, one metabolite had a significantly different relative abundance between populations (q < 0.05, FDR) (Supplementary Table 2). LC-MS identified 68 metabolites, with 7 metabolites having significantly different relative abundances between populations (q < 0.05, FDR) (Supplementary Table 3).
Principal component analysis (PCA) grouped all quality controls (pooled spider extracts; QC) together showing that the workflow was robust and reproducible (Figures 3B,C). The PCA analysis also showed that spiders from nests within a population had more similar metabolite profiles and grouped together in a population-specific pattern (Figure 3), and that metabolite profiles from the Otavi population had a larger variation compared to Stampriet and Windhoek populations (Figures 3A–C). Furthermore, ANOSIM showed significant differences in metabolite profiles between the Stampriet and Otavi populations, and between the Stampriet and Windhoek populations (Figure 3D). In contrast, metabolite profiles were not significantly different between the Otavi and Windhoek populations as indicated by their lower R-values (Figure 3D). Finally, ANOVA test and pairwise t-test on Bray-Curtis dissimilarity data based on metabolite data showed that the metabolite profiles of spiders from the same population were significantly more similar than those of spiders from different populations (Figure 4). This further supports a population pattern in metabolite profiles. Thus, the combined analyses indicated that S. dumicola metabolite profiles were population-specific, and that spiders from the Otavi population contained higher metabolic variation than spiders from the two other populations.
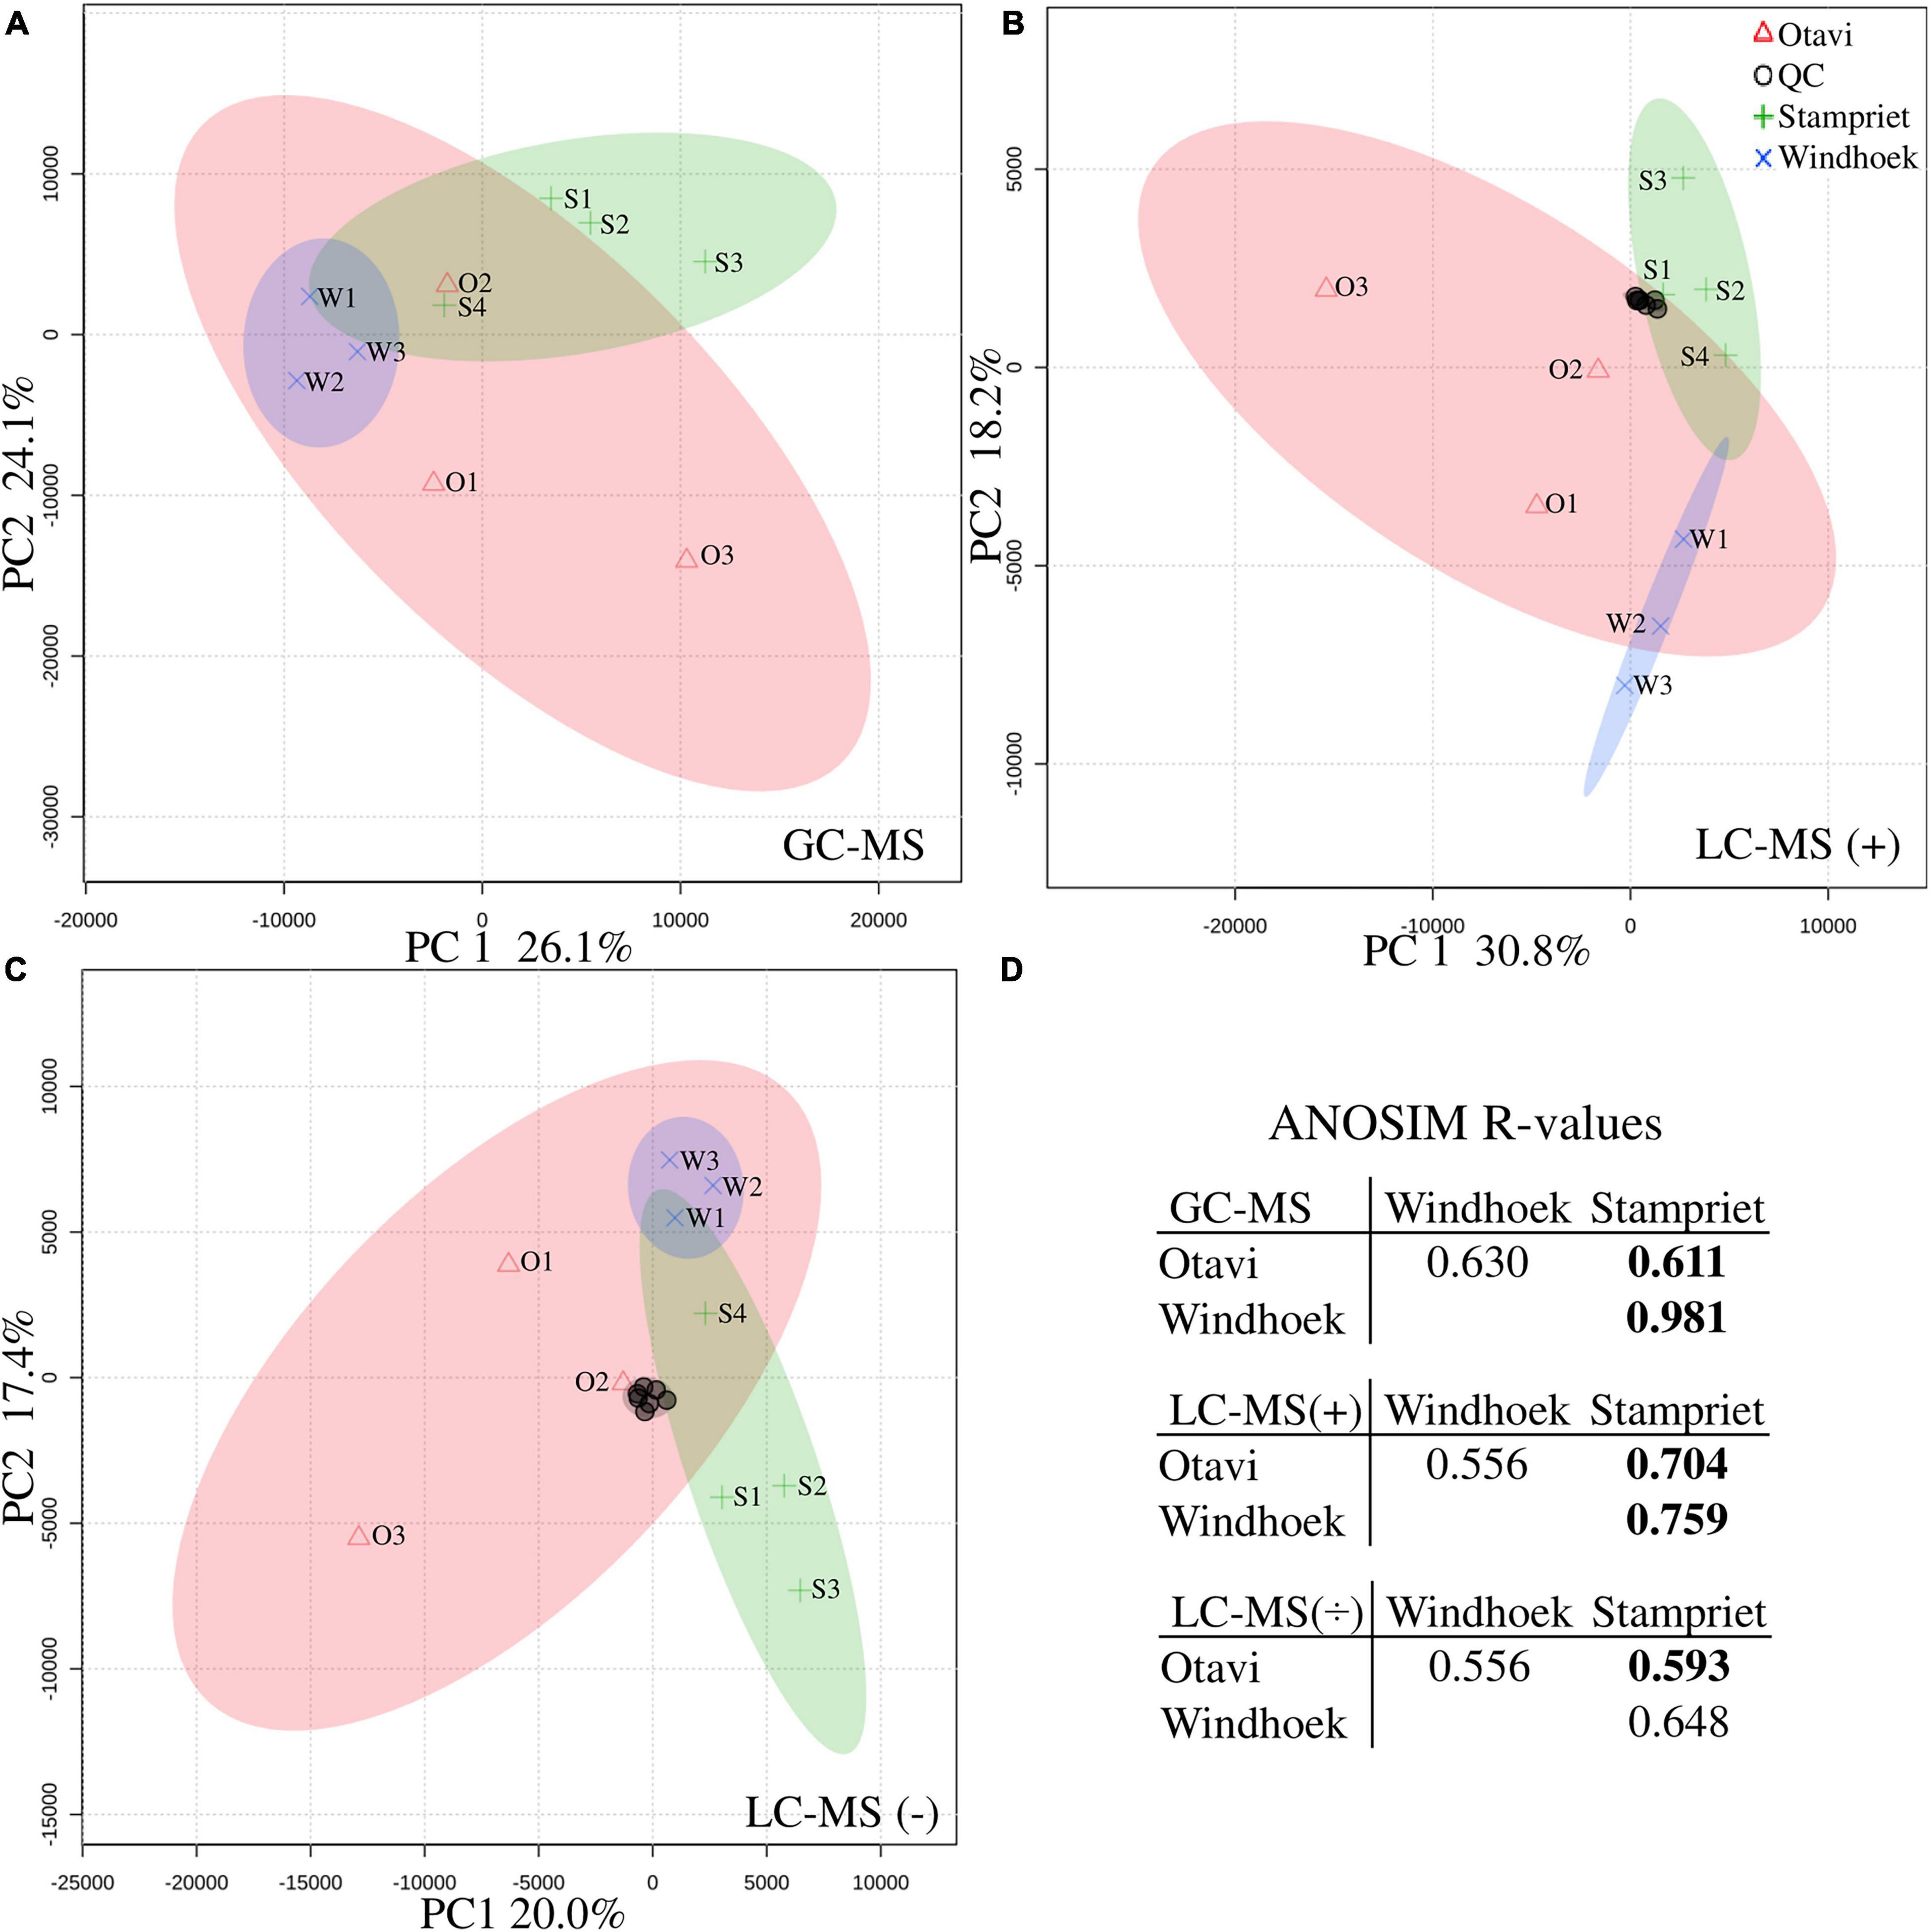
Figure 3. Principle component analysis (PCA) (A–C) and analysis of similarities (ANOSIM) (D) of metabolite profiling data. PCAs are based on normalized metabolite data (average relative abundance): (A) GC-MS data, (B) LC-MS positive mode, and (C) LC-MS negative mode. Populations are depicted with symbols and colors (Otavi, red triangles; Stampriet, green pluses; Windhoek, blue crosses) and 95%-confidence-intervals are indicated by the colored areas of the respective population. Individual samples are named according to population and nest number (see Supplementary Table 1). Quality control samples (QC) for LC-MS are depicted with black circles. (D) ANOSIM R-values are based on Bray-Curtis dissimilarities calculated on average relative abundance metabolite data (from top to bottom: GC-MS data, LC-MS positive mode, and LC-MS negative mode). R = 0 indicates no difference in metabolite composition between populations, and R = 1 indicates a high degree of difference. Bold numbers indicate significant difference between populations (p < 0.05).
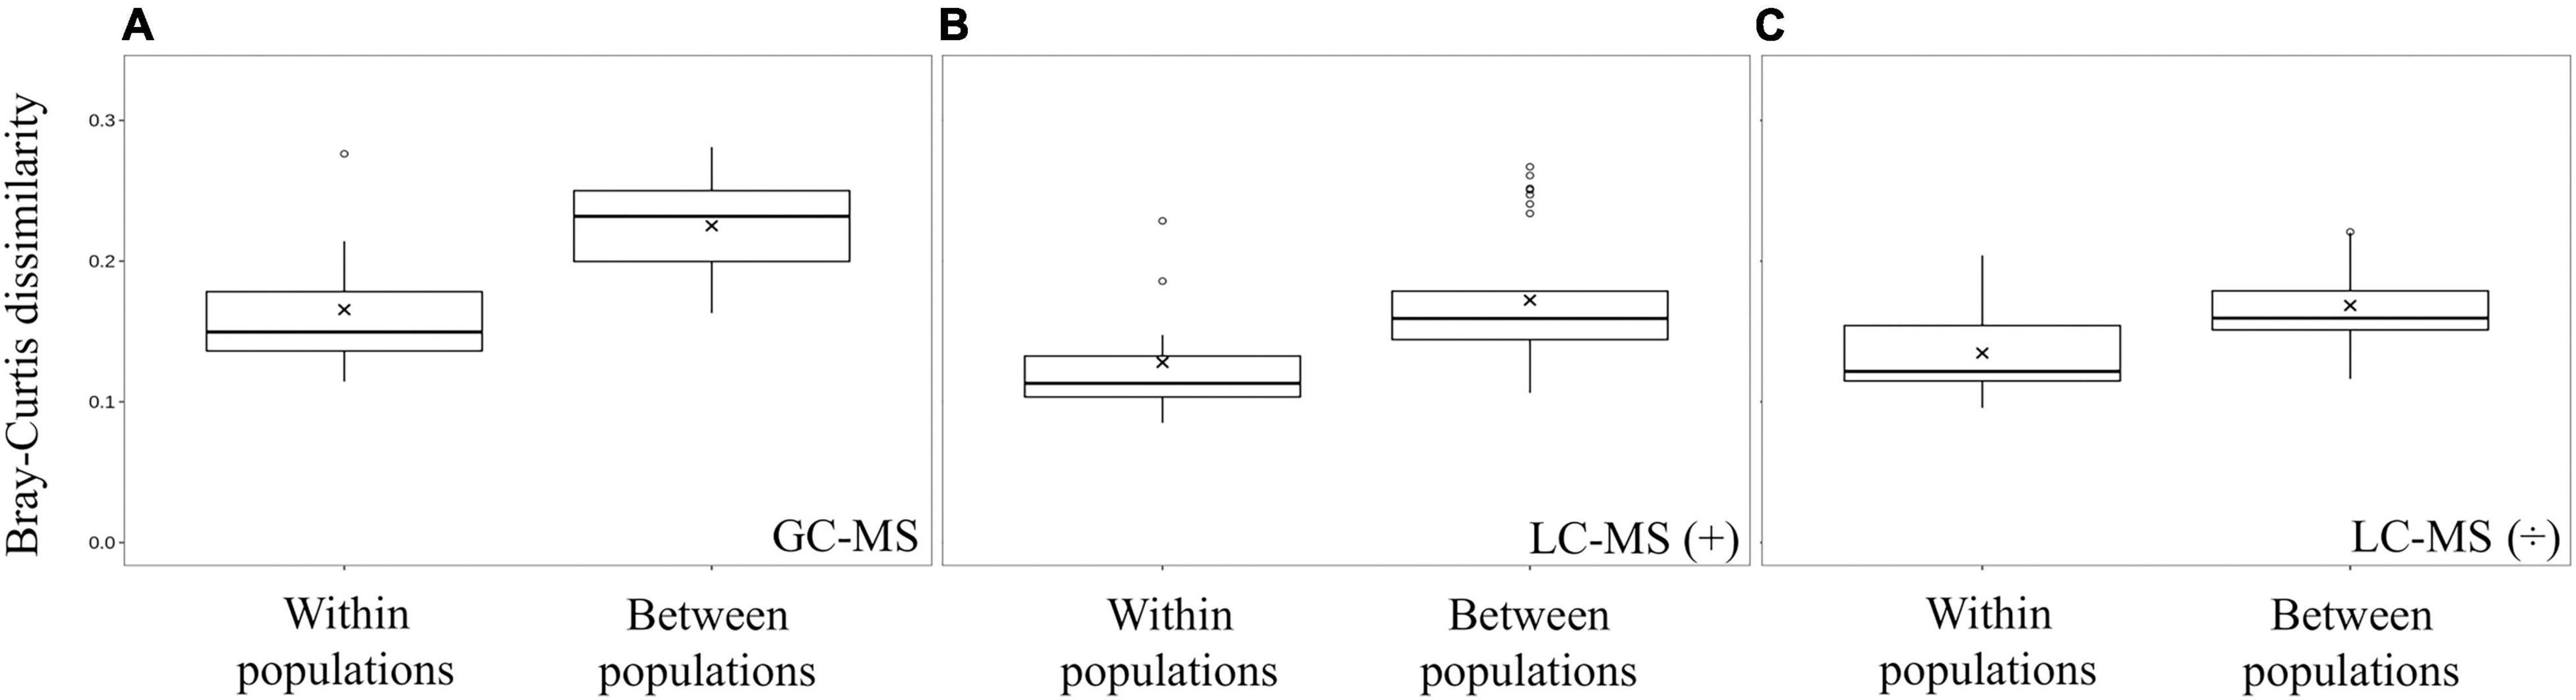
Figure 4. Beta diversity in metabolite profiles within populations and between populations. Boxplots were made from Bray-Curtis dissimilarities calculated on average relative abundance metabolite data from GC-MS (A), LC-MS positive mode (B), and LC-MS negative mode (C) data. In all three methods, metabolite profiles within a population were significantly less different (t-test; p < 0.05) than between populations (GC-MS p = 2.50 × 10⁻⁵, LC-MS positive mode p = 4.40 × 10⁻³, and LC-MS negative mode p = 1.13 × 10⁻³).
Due to separation in the PCA (Figure 3) and the significant Bray-Curtis dissimilarities of the metabolite profiles (Figure 4), a partial least squares-discriminant analysis (PLS-DA) was conducted to focus on population-specific differences between the metabolite profiles (data not shown). PLS-DA is a guided analysis where the classes are defined in advance, and based on the PCA we defined the populations (Otavi, Stampriet, and Windhoek) as classes. The PLS-DA model produced variable importance parameters (VIP score), which showed that a broad suite of compounds separated the populations (Supplementary Tables 2,3), with various metabolites differing in relative abundance between the population. Different compounds drove this separation depending on the analysis method used, which suggests a slight method bias between GC-MS and LC-MS. Spiders from the Otavi population accumulated lactate, citric acid, and succinate, but also xanthine and hypoxanthine (Supplementary Tables 2,3). Furthermore, spiders from Otavi also had higher relative abundance of the polyols myo-inositol and myo-inositol-phosphate. In addition, Otavi and Stampriet spiders shared accumulations of multiple metabolites including free amino acids (such as tryptophan and glutamate), trehalose, and proline-betaine (Supplementary Tables 2,3), whereas spiders from Otavi and Windhoek shared accumulation of citric acid (Supplementary Tables 2,3).
Discussion
In this study, we explored metabolite profiles of three S. dumicola populations along a climatic gradient, characterized by differences in temperatures (Figure 1). We found that the three populations had significantly different metabolite profiles, driven by a broad suite of metabolites involved in energy formation and thermal tolerance in other arthropod species (Verberk et al., 2013; Chou et al., 2017; Zhu et al., 2019). These data suggest that the population-specific pattern in the S. dumicola metabolome might be influenced by environmental factors such as temperature. Besides its genotype, and potentially its microbiome, numerous factors can influence an arthropod’s metabolome, including age, sex, health and feeding status, and the response to environmental factors like heat (Snart et al., 2015). Although it is impossible in such a field study to control for all factors, we minimized the effect of age and sex by analyzing adult females only, and we averaged potential variation in individual condition by pooling all individuals from a sampled nest. In addition, we account for differences in genotype and microbiome between the three populations.
We found that the sampled spiders formed three genetically separated populations, but note that this is based on relatively few genetic variants. A previous study demonstrated very low species-level genetic diversity in S. dumicola (Settepani et al., 2017). The different populations had distinct metabolite profiles, but the topology of the phylogenetic tree was not reflected in the metabolite profiles, i.e., the closest related populations, Otavi and Stampriet, had the least similar metabolite profiles. If the spiders themselves produce the observed metabolites rather than their symbionts, population variation in metabolite profiles could result from both genetic adaptation and phenotypic plasticity. Further analyses would be needed to assess whether the population-specific metabolite profiles have a genetic basis, and whether it is shaped by local adaptation or phenotypic plasticity.
Our results provide no evidence for a role of specific symbionts in shaping the observed metabolite profile pattern. The microbiomes of the S. dumicola spiders sampled along the climatic gradient showed no significant population-specific pattern (Figure 2), which is consistent with previous studies of S. dumicola spiders collected over even larger geographic distances (Busck et al., 2020, 2022). The bacterial genera that dominated S. dumicola’s microbiome in this study are identical to those previously found (Borrelia, Diplorickettsia, and Mycoplasma), and are so far not known to provide or enhance thermal tolerance in hosts. However, the spiders investigated in this study had elevated levels of metabolites associated with thermal tolerance, such as free amino acids, sugars, and polyols. The accumulation of these thermoprotective metabolites may originate from heat-stressed members of the microbiome that lyse at high temperatures. This has been reported from aphids, where the microbial symbiont, Serratia symbiotica, lyses when exposed to heat stress (39°C for 4 h), which is correlated with increased levels of thermoprotective metabolites, for example sorbitol, in the aphid host (Burke et al., 2010). Comparably, bacterial symbionts in the Asian citrus psyllid (Diaphorina citri) degrade during heat stress due to increased lysosomal activity, which provides nutrients to the surviving symbionts and host (Dossi et al., 2018). Busck et al. (2022) estimated that for every host cell there are 1–2 bacterial cells in S. dumicola, and such a bacterial load could potentially influence the host metabolome upon cell lysis and supply the spider host with metabolites aiding its temperature response. Thus, S. dumicola with its microbiome may represent a parallel system to aphids and D. citri, where the microbial symbionts contribute to the host temperature response via cell lysis.
Alternatively, the accumulation of primary metabolites like free amino acids and sugars may simply be a consequence of higher prey availability: predators, such as S. dumicola, exclusively obtain their nutrients from their prey and these nutrients ultimately end up as metabolites in the predator. Otavi in Northern Namibia has higher vegetation productivity resulting in higher insect biomass and thus prey availability compared to central Namibia, where the Windhoek and Stampriet populations are situated (Majer et al., 2013). This could help explain the accumulation of the common insect storage compounds glucose and trehalose (Wyatt and Kalf, 1957; Becker et al., 1996) in the Otavi spiders (Supplementary Tables 2,3). Higher average body weight of Otavi spiders substantiates this possibility (Supplementary Table 1).
Though we cannot trace the origin of the metabolites that drive the observed population-specific pattern along the climatic gradient with confidence, many of the metabolites can be linked to elevated temperatures or thermal tolerance and thus to the temperature regime the spiders were exposed to in their habitat. Spiders are ectotherms and hence in situ temperatures prior to sampling will affect the spiders metabolic homeostasis (Bicego et al., 2007; Colinet et al., 2015) and possibly activate molecular mechanisms that maintain cellular homeostasis, which leave chemical signatures in the metabolite profiles (Malmendal et al., 2006; Colinet et al., 2015). In particular, metabolome regulation due to thermal stress can remain for hours after exposure (Michaud et al., 2008; Noer et al., 2020).
We observed higher relative abundances of succinate, citric acid, and lactate in spiders from Otavi, the hottest site, compared to Stampriet and Windhoek spiders (Supplementary Tables 2,3). High temperatures can lead to oxygen stress in ectotherms as increasing temperatures will increase the metabolic rate and increase the energy demand, which can result in insufficient oxygen supply (Pörtner, 2002; Verberk et al., 2016). This oxygen deficit disrupts the aerobic metabolism, specifically the CAC, seen as accumulations of CAC metabolite intermediates, like succinate and citric acid, as they cannot be oxidized by the mitochondrial respiratory chain without oxygen as final electron acceptor (Frederich and Pörtner, 2000). Hereby, animals are forced to shift to anaerobic metabolism that is less effective and leads to accumulation of lactate in animal tissues (Verberk et al., 2013; Chou et al., 2017; Zhu et al., 2019). Furthermore, we observed elevated levels of hypoxanthine and xanthine in Otavi spiders compared to Stampriet and Windhoek spiders. These compounds are ATP degradation products and elevated levels of hypoxanthine and xanthine can indicate a metabolic imbalance in animals as ATP and ADP are lost and converted into xanthine and hypoxanthine during oxygen stress (Bickler and Buck, 2007). Collectively, these findings point toward a shift from aerobic metabolism to anaerobic metabolism in Otavi spiders compared to spiders from Stampriet and Windhoek. This shift could be a result of disrupted aerobic metabolism due to heat stress. Results from Malmos et al. (2021) indicate that S. dumicola avoid temperatures above 40°C in controlled laboratory settings, although the threshold temperature varies with spider population and temperature acclimation. Furthermore, data from Malmos et al. (2021) suggest that S. dumicola has a population-specific heat tolerance with a critical thermal maximum (CTmax) between 48 and 49°C. A study by Seibt and Wickler (1990) concluded that S. dumicola’s preferred temperature appears to be approximately 37°C. This indicates that S. dumicola’s temperature optimum is below 40°C, which suggests that spiders in this study sampled from Otavi and possibly Stampriet may have been challenged by high temperatures, although likely not critically, at the time of sampling.
We detected free amino acids, sugars, and polyols in all three populations (Supplementary Tables 2,3), which are metabolites associated with thermal protection in other arthropods (Wolfe et al., 1998; Salvucci, 2000; Michaud et al., 2008; Vesala et al., 2012). These compounds can stabilize cell homeostasis and secure cell membrane integrity during temperature stress, and hence provide temperature tolerance. Free amino acids are commonly accumulated in response to heat stress in arthropods, where these accumulations likely result from protein breakdown rather than from de novo synthesis for thermal protection (Malmendal et al., 2006; Colinet et al., 2007). Moreover, lower relative abundance of glutamine, as detected in the Otavi and Stampriet spiders, can be linked to the up-regulation of heat shock proteins, for stabilizing cell membranes (Wischmeyer, 2002). Proline-betaine accumulated 27-fold in Stampriet spiders and to a lesser degree in Otavi spiders. Proline-betaine is an ammonium salt know from animals, plants and bacteria (Sethi and Carew, 1974; Blunden et al., 1982; Pierce et al., 1984; Amin et al., 1995). Its role in animals is unclear and not determined in spiders, but it is a known osmoprotectant in bacteria (Pierce et al., 1984; Amin et al., 1995; Haardt et al., 1995; Bayles and Wilkinson, 2000). Furthermore, spiders from Otavi also had higher relative abundances of the polyols myo-inositol and myo-inositol-phosphate, which are linked to thermal tolerance in the house spider Parasteatoda tepidariorum (Tanaka, 1993, 1995).
Conclusion
We detected significantly different metabolite profiles in three genetically distinct populations of the social spider S. dumicola. We found no evidence for the role of the spider microbiome in shaping the observed metabolite profile pattern. While the origin of the metabolites driving this population-specific pattern remains unresolved, many of them can be linked to either thermal stress (e.g., lactate, succinate, or xanthine), thermal protection (e.g., polyols, trehalose, or glycerol) or both (e.g., free amino acids and sugars); these metabolites were most abundant in spiders from the hottest geographic location. These results are consistent with a role of the S. dumicola metabolome in temperature response.
Data Availability Statement
The original contributions presented in the study are publicly available. The microbiome data can be accessed in NCBI (accession: PRJNA766841) and the metabolite data can be accessed in Dryad (doi: 10.5061/dryad.fn2z34tws).
Author Contributions
TS, MB, JB, TB, and AS designed the research. TS, KM, CB, MB, AA, JB, and MW performed research and analyzed the data. ML, MJ, and TV contributed new reagents/analytic tools. TS, MB, JB, MJ, TB, and AS wrote the manuscript. All authors contributed to the article and approved the submitted version.
Funding
The study was supported by the Novo Nordisk Foundation Interdisciplinary Synergy Grant number NNF16OC0021110. The funder was not involved in the study design, collection, analysis, interpretation of data, the writing of this article or the decision to submit it for publication. We would also like to thank the issued permissions to perform field work permit no. 1362/2017 granted from the Ministry of Environment and Tourism in Windhoek, Namibia.
Conflict of Interest
The authors declare that the research was conducted in the absence of any commercial or financial relationships that could be construed as a potential conflict of interest. The authors declare that this study received funding from the Novo Nordisk Foundation. The funder was not involved in the study design, collection, analysis, interpretation of data, the writing of this article or the decision to submit it for publication.
Publisher’s Note
All claims expressed in this article are solely those of the authors and do not necessarily represent those of their affiliated organizations, or those of the publisher, the editors and the reviewers. Any product that may be evaluated in this article, or claim that may be made by its manufacturer, is not guaranteed or endorsed by the publisher.
Acknowledgments
We wish to thank John Irish, Tharina Bird, Chris Bird, Alex Lammers, and Mette Marie Busck for valuable field assistance, and Marie Rosenstand Hansen, Susanne Nielsen, Britta Poulsen, and Lykke Beinta Bjaerge Bamdali for spider care and technical assistance in the laboratory.
Supplementary Material
The Supplementary Material for this article can be found online at: https://www.frontiersin.org/articles/10.3389/fevo.2022.841490/full#supplementary-material
Footnotes
- ^ https://www.r-project.org/
- ^ https://metlin.scripps.edu/landing_page.php?pgcontent=mainPage
- ^ www.hmdb.ca
- ^ https://ipb-halle.github.io/MetFrag/
- ^ https://www.metaboanalyst.ca/
References
Amin, S. U., Lash, T. D., and Wilkinson, B. J. (1995). Proline Betaine Is a Highly Effective Osmoprotectant for Staphylococcus aureus. Arch. Microbiol. 163, 138–142. doi: 10.1007/bf00381788
Avilés, L. (1997). “Causes and Consequences of Cooperation and Permanent-Sociality in Spiders,” in The Evolution of Social Behavior in Insects and Arachnids, eds J. C. Choe and B. J. Crespi (Cambridge: Cambridge University Press), 476–498. doi: 10.1186/1471-2148-9-257
Bayles, D. O., and Wilkinson, B. J. (2000). Osmoprotectants and Cryoprotectants for Listeria monocytogenes. Lett. Appl. Microbiol. 30, 23–27. doi: 10.1046/j.1472-765x.2000.00646.x
Becker, A., Schlöder, P., Steele, J. E., and Wegener, G. (1996). The Regulation of Trehalose Metabolism in Insects. Experientia 52, 433–439. doi: 10.1007/BF01919312
Bicego, K. C., Barros, R. C. H., and Branco, L. G. S. (2007). Physiology of Temperature Regulation: Comparative Aspects. Comp. Biochem. Physiol. 147, 616–639. doi: 10.1016/j.cbpa.2006.06.032
Bickler, P. E., and Buck, L. T. (2007). Hypoxia Tolerance in Reptiles, Amphibians, and Fishes: Life with Variable Oxygen Availability. Annu. Rev. Physiol. 69, 145–170. doi: 10.1146/annurev.physiol.69.031905.162529
Block, W. (1981). Terrestrial Arthropods and Low Temperature. Cryobiology 18, 436–444. doi: 10.1016/0011-2240(81)90119-X
Blunden, G., Gordon, S. M., McLean, W. F. H., and Guiry, M. D. (1982). The Distribution and Possible Taxonomic Significance of Quaternary Ammonium and Other Dragendorff-Positive Compounds in Some Genera of Marine Algae. Botanica Marina 25, 563–568. doi: 10.1515/botm.1982.25.12.563
Bubliy, O. A., and Loeschcke, V. (2005). Correlated Responses to Selection for Stress Resistance and Longevity in a Laboratory Population of Drosophila melanogaster. J. Evol. Biol. 18, 789–803. doi: 10.1111/j.1420-9101.2005.00928.x
Burke, G., Fiehn, O., and Moran, N. A. (2010). Effects of Facultative Symbionts and Heat Stress on the Metabolome of Pea Aphids. ISME J. 4, 242–252. doi: 10.1038/ismej.2009.114
Busck, M. M., Lund, M. B., Bird, T., Bechsgaard, J., Bilde, T., and Schramm, A. (2022). Temporal and spatial microbiome dynamics across natural populations of the social spider Stegodyphus dumicola. FEMS Microbiol. Ecol. 98:fiac015. doi: 10.1093/femsec/fiac015
Busck, M. M., Settepani, V., Bechsgaard, J., Lund, M. B., Bilde, T., and Schramm, A. (2020). Microbiomes and Specific Symbionts of Social Spiders: Compositional Patterns in Host Species, Populations, and Nests. Front. Microbiol. 11:1845. doi: 10.3389/fmicb.2020.01845
Chou, H., Pathmasirib, W., Deese-Spruill, J., Sumner, S., and Buchwalter, D. B. (2017). Metabolomics Reveal Physiological Changes in Mayfly Larvae (Neocloeon triangulifer) at Ecological Upper Thermal Limits.”. J. Insect Physiol. 101, 107–112.
Clarke, K. R. (1993). Non-parametric Multivariate Analyses of Changes in Community Structure. Aus. J. Ecol. 18, 117–143. doi: 10.1111/j.1442-9993.1993.tb00438.x
Cloudsley-Thompson, J. L. (1975). Adaptations of Arthropoda to Arid Environments. Annu. Rev. Entomol. 20, 261–283. doi: 10.1146/annurev.en.20.010175.001401
Colinet, H., Hance, T., Vernon, P., Bouchereau, A., and Renault, D. (2007). Does Fluctuating Thermal Regime Trigger Free Amino Acid Production in the Parasitic Wasp Aphidius colemani (Hymenoptera: Aphidiinae)? Comp. Biochem. Physiol. A Mol. Integr. Physiol.. 147, 484–492. doi: 10.1016/j.cbpa.2007.01.030
Colinet, H., Renault, D., Javal, M., Berková, P., Šimek, P., and Koštál, V. (2016). Uncovering the Benefits of Fluctuating Thermal Regimes on Cold Tolerance of Drosophila Flies by Combined Metabolomic and Lipidomic Approach. Biochim Biophys. Acta 1861, 1736–1745. doi: 10.1016/j.bbalip.2016.08.008
Colinet, H., Sinclair, B. J., Vernon, P., and Renault, D. (2015). Insects in Fluctuating Thermal Environments. Annu. Rev. Entomol. 60, 123–140. doi: 10.1146/annurev-ento-010814-021017
Danecek, P., and McCarthy, S. A. (2017). BCFtools/Csq: Haplotype-Aware Variant Consequences. Bioinformatics 33, 2037–2039. doi: 10.1093/bioinformatics/btx100
Deutsch, C. A., Tewksbury, J. J., Huey, R. B., Sheldon, K. S., Ghalambor, C. K., Haak, D. C., et al. (2008). Impacts of Climate Warming on Terrestrial Ectotherms across Latitude Thermal Safety Margin. Proc.Natl. Acad. Sci. 105, 6668–6672. doi: 10.1073/pnas.0709472105
Dossi, F. C. A., Da Silva, E. P., and Cônsoli, F. L. (2018). Shifting the Balance: Heat Stress Challenges the Symbiotic Interactions of the Asian Citrus Psyllid. Diaphorina citri (Hemiptera, Liviidae). Biol. Bull. 235, 195–203. doi: 10.1086/699755
Doucet, D., Walker, V. K., and Qin, W. (2009). The Bugs That Came in from the Cold: Molecular Adaptations to Low Temperatures in Insects. Cell. Mol. Life Sci. 66, 1404–1418. doi: 10.1007/s00018-009-8320-6
Douglas, A. E. (2018). Omics and the Metabolic Function of Insect–Microbial Symbioses. Curr. Opin. Insect Sci. 29, 1–6. doi: 10.1016/j.cois.2018.05.012
Dunbar, H. E., Wilson, A. C. C., Ferguson, N. R., and Moran, N. A. (2007). Aphid Thermal Tolerance Is Governed by a Point Mutation in Bacterial Symbionts. PLoS Biol. 5:e96. doi: 10.1371/journal.pbio.0050096
Frederich, M., and Pörtner, H. O. (2000). Oxygen Limitation of Thermal Tolerance Defined by Cardiac and Ventilatory Performance in Spider Crab, Maja squinado. Am. J. Physiol. Regul. Integr. Comp. Physiol. 279, R1531–R1538. doi: 10.1152/ajpregu.2000.279.5.r1531
Grieser, J., Gommes, R., and Bernardi, M. (2006). New LocClim - the Local Climate Estimator of FAO. Geophys. Res. Abst. 8:08305.
Haardt, M., Kempf, B., Faatz, E., and Bremer, E. (1995). The Osmoprotectant Proline Betaine Is a Major Substrate for the Binding-Protein-Dependent Transport System ProU of Escherichia coli K-12. Mol. Gen. Genet. MGG 246, 783–796. doi: 10.1007/BF00290728
Hoffmann, A., Chown, S., and Clusella-Trullas, S. (2013). Upper thermal limits in terrestrial ectotherms: How constrained are they? Funct. Ecol. 27, 934–949. doi: 10.1111/j.1365-2435.2012.02036.x
Hoffmann, A. A., and Sgró, C. M. (2011). Climate Change and Evolutionary Adaptation. Nat. 470, 479–485. doi: 10.1038/nature09670
Kind, T., Wohlgemuth, G., Lee, D. Y., Lu, Y., Palazoglu, M., Shahbaz, S., et al. (2009). FiehnLib: Mass Spectral and Retention Index Libraries for Metabolomics Based on Quadrupole and Time-of-Flight Gas Chromatography/Mass Spectrometry. Anal. Chem. 81, 10038–10048. doi: 10.1021/ac9019522
Kraus, O., and Kraus, M. (1988). “The genus Stegodyphus (Arachnida, Ara-neae). The Genus Stegodyphus (Arachnida, Araneae). Sibling Species, Species Groups, and Parallel Origin of Social Living,” in Verhandlungen des Naturwissenschaftlichen Vereins in Hamburg (NF), Vol. 30, ed. O. Kraus (Berlin: Verlag Paul Parey), 151–254.
Kuhl, C., Tautenhahn, R., Bottcher, C., Larson, T., and Neumann, S. (2012). CAMERA: An Integrated Strategy for Compound Spectra Extraction and Annotation of LC/MS Data Sets. Anal. Chem. 84, 283–289. doi: 10.1021/ac202450g
Kumar, S., Stecher, G., Li, M., Knyaz, C., and Tamura, K. (2018). MEGA X: Molecular Evolutionary Genetics Analysis across Computing Platforms. Mol. Biol. Evol. 35, 1547–1549. doi: 10.1093/molbev/msy096
Li, H. (2011). A Statistical Framework for SNP Calling, Mutation Discovery, Association Mapping and Population Genetical Parameter Estimation from Sequencing Data. Bioinformatics 27, 2987–2993. doi: 10.1093/bioinformatics/btr509
Li, H., and Durbin, R. (2009). Fast and Accurate Short Read Alignment with Burrows-Wheeler Transform. Bioinformatics 25, 1754–1760. doi: 10.1093/bioinformatics/btp324
Li, H., Handsaker, B., Wysoker, A., Fennell, T., Ruan, J., and Homer, N. (2009). The Sequence Alignment/Map format and SAMtools. Bioinformatics 25, 2078–2079. doi: 10.1093/bioinformatics/btp352
Liebeke, M., Pöther, D. C., Van Duy, N., Albrecht, D., Becher, D., Hochgräfe, F., et al. (2008). Depletion of Thiol-Containing Proteins in Response to Quinones in Bacillus subtilis. Mol. Microbiol. 69, 1513–1529. doi: 10.1111/j.1365-2958.2008.06382.x
Liu, S., Aagaard, A., Bechsgaard, J., and Bilde, T. (2019). DNA methylation patterns in the social spider, Stegodyphus dumicola. Genes 10:137. doi: 10.3390/genes10020137
Lubin, Y., and Bilde, T. (2007). The Evolution of Sociality in Spiders. Adv. Study Behav. 37, 83–145. doi: 10.1016/S0065-3454(07)37003-4
Majer, M., Svenning, J.-C., and Bilde, T. (2013). Habitat Productivity Constrains the Distribution of Social Spiders across Continents – Case Study of the Genus Stegodyphus. Front. Zool. 10:9. doi: 10.1186/1742-9994-10-9
Malmendal, A., Overgaard, J., Bundy, J. G., Sørensen, J. G., Nielsen, N. C., Loeschcke, V., et al. (2006). Metabolomic Profiling of Heat Stress: Hardening and Recovery of Homeostasis in Drosophila. Am. J. Physiol.Regul., Integ. Comp. Physiol.. 291, 205–212. doi: 10.1152/ajpregu.00867.2005
Malmos, K. G., Lüdeking, A. H., Vosegaard, T., Aagaard, A., Bechsgaard, J., Sørensen, J. G., et al. (2021). Behavioural and Physiological Responses to Thermal Stress in a Social Spider. Funct. Ecol. 35, 2728–2742. doi: 10.1111/1365-2435.13921
Michaud, R. M., Benoit, J. B., Lopez-Martinez, G., Elnitsky, M. A., Lee, R. E. Jr., and Denlinger, D. L. (2008). Metabolomics Reveals Unique and Shared Metabolic Changes in Response to Heat Shock, Freezing and Desiccation in the Antarctic Midge, Belgica Antarctica. J. Insect Physiol. 54, 645–655. doi: 10.1016/j.jinsphys.2008.01.003
Noer, N. K., Pagter, M., Bahrndorff, S., Malmendal, A., and Kristensen, T. N. (2020). Impacts of Thermal Fluctuations on Heat Tolerance and Its Metabolomic Basis across Plant and Animal Species. PLoS One 15:e0237201. doi: 10.1371/journal.pone.0237201
Overgaard, J., Malmendal, A., Sørensen, J. G., Bundy, J. G., Loeschcke, V., Nielsen, N. C., et al. (2007). Metabolomic Profiling of Rapid Cold Hardening and Cold Shock in Drosophila melanogaster. J. Insect Physiol. 53, 1218–1232. doi: 10.1016/j.jinsphys.2007.06.012
Pierce, S. K., Edwards, S. C., Mazzocchi, P. H., Klingler, L. J., and Warren, M. K. (1984). Proline Betaine: A Unique Osmolyte in an Extremely Euryhaline Osmoconformer. Biol. Bull. 167, 495–500. doi: 10.2307/1541294
Pörtner, H. O. (2002). Climate Variations and the Physiological Basis of Temperature Dependent Biogeography: Systemic to Molecular Hierarchy of Thermal Tolerance in Animals. Comp. Biochem. Physiol.A 132, 739–761. doi: 10.1016/S1095-6433(02)00045-4
Prince, J. T., and Marcotte, E. M. (2006). Chromatographic Alignment of ESI-LC-MS Proteomics Data Sets by Ordered Bijective Interpolated Warping. Anal. Chem. 78, 6140–6152. doi: 10.1021/ac0605344
Salvucci, M. E. (2000). Sorbitol Accumulation in Whiteflies: Evidence for a Role in Protecting Proteins during Heat Stress. J. Therm. Biol. 25, 353–361. doi: 10.1016/S0306-4565(99)00107-2
Seibt, U., and Wickler, W. (1990). The Protective Function of the Compact Silk Nest of Social Stegodyphus Spiders (Araneae, Eresidae). Oecologia 82, 317–321. doi: 10.1007/BF00317477
Sejerkilde, M., Sørensen, J. G., and Loeschcke, V. (2003). Effects of Cold- and Heat Hardening on Thermal Resistance in Drosophila melanogaster. J. Insect Physiol. 49, 719–726. doi: 10.1016/S0022-1910(03)00095-7
Sethi, J. K., and Carew, D. P. (1974). Growth and Betaine Formation in Medicago sativa Tissue Cultures. Phytochemistry 13, 321–324. doi: 10.1016/S0031-9422(00)91211-1
Settepani, V., Schou, M. F., Greve, M., Grinsted, L., Bechsgaard, J., and Bilde, T. (2017). Evolution of Sociality in Spiders Leads to Depleted Genomic Diversity at Both Population and Species Levels. Mol. Ecol. 26, 4197–4210. doi: 10.1111/mec.14196
Sinclair, B., Vernon, J. P., Klok, C. J., and Chown, S. L. (2003). Insects at Low Temperatures: An Ecological Perspective. Trends Ecol. Evol. 18, 257–262. doi: 10.1016/S0169-5347(03)00014-4
Smith, C. A., Want, E. J., O’Maille, G., Abagyan, R., and Siuzdak, G. (2006). XCMS: Processing Mass Spectrometry Data for Metabolite Profiling Using Nonlinear Peak Alignment. Matching, and Identification. Anal. Chem. 78, 779–787. doi: 10.1021/ac051437y
Snart, C. J. P., Hardy, I. C. W., and Barrett, D. A. (2015). Entometabolomics: Applications of Modern Analytical Techniques to Insect Studies. Entomol. Exp. Appl. 155, 1–17. doi: 10.1111/eea.12281
Sømme, L. (1982). Supercooling and Winter Survival in Terrestrial Arthropods. Comp. Biochem. Physiol. A 73, 519–543. doi: 10.1016/0300-9629(82)90260-2
Sumner, L. W., Amberg, A., Barrett, D., Beale, M. H., Beger, R., Daykin, C. A., et al. (2007). Proposed Minimum Reporting Standards for Chemical Analysis: Chemical Analysis Working Group (CAWG) Metabolomics Standards Initiative (MSI). Metabolomics 3, 211–221. doi: 10.1007/s11306-007-0082-2
Tanaka, K. (1993). Seasonal Change in Cold Tolerance of the House Spider. Achaearanea tepidariorum (Araneae: Theridiidae). Acta Arachnologica 42, 151–158. doi: 10.2476/asjaa.42.151
Tanaka, K. (1995). Seasonal Change in Glycogen and Inositol/Sorbitol Contents of the House Spider, Achaearanea tepidariorum (Araneae: Theridiidae). Comp. Biochem. Physiol. B 110, 539–545. doi: 10.1016/0305-0491(94)00183-U
Tautenhahn, R., Böttcher, C., and Neumann, S. (2008). Highly Sensitive Feature Detection for High Resolution LC/MS. BMC Bioinformatics 9:504. doi: 10.1186/1471-2105-9-504
Verberk, W. C. E. P., Overgaard, J., Ern, R., Bayley, M., Wang, T., Boardman, L., et al. (2016). Does Oxygen Limit Thermal Tolerance in Arthropods? Critical Review of Current Evidence. Comp. Biochem. Physiol A 192, 64–78. doi: 10.1016/j.cbpa.2015.10.020
Verberk, W. C. E. P., Sommer, U., Davidson, R. L., and Viant, M. R. (2013). Anaerobic Metabolism at Thermal Extremes: A Metabolomic Test of the Oxygen Limitation Hypothesis in an Aquatic Insect. Integ. Comp. Biol. 53, 609–619. doi: 10.1093/icb/ict015
Vesala, L., Salminen, T. S., Koštál, V., Zahradníčková, H., and Hoikkala, A. (2012). Myo-Inositol as a Main Metabolite in Overwintering Flies: Seasonal Metabolomic Profiles and Cold Stress Tolerance in a Northern Drosophilid Fly. J. Exp. Biol. 215, 2891–2897. doi: 10.1242/jeb.069948
Warton, D. I., Wright, S. T., and Wang, Y. (2012). Distance-Based Multivariate Analyses Confound Location and Dispersion Effects. Methods Ecol. Evol. 3, 89–101. doi: 10.1111/j.2041-210X.2011.00127.x
Wischmeyer, P. E. (2002). Glutamine and Heat Shock Protein Expression. Nutrition 18, 225–228. doi: 10.1016/S0899-9007(01)00796-1
Wolfe, G. R., Hendrix, D. L., and Salvucci, M. E. (1998). A Thermoprotective Role for Sorbitol in the Silverleaf Whitefly, Bemisia argentifolii. J. Insect Physiol. 44, 597–603. doi: 10.1016/S0022-1910(98)00035-3
Wyatt, G. R., and Kalf, G. F. (1957). The Chemistry of Insect Hemolymph. J. Gen. Physiol. 40, 833–847. doi: 10.1085/jgp.40.6.833
Xia, J., and Wishart, D. S. (2011). Web-Based Inference of Biological Patterns, Functions and Pathways from Metabolomic Data Using MetaboAnalyst. Nat. Protoc. 6, 743–760. doi: 10.1038/nprot.2011.319
Zachariassen, K. E. (1985). Physiology of Cold Tolerance in Insects. Physiol. Rev 65, 799–832. doi: 10.1152/physrev.1985.65.4.799
Keywords: spider populations, temperature, microbiome, metabolome, LC-MS, GC-MS
Citation: Sandfeld T, Malmos KG, Nielsen CB, Lund MB, Aagaard A, Bechsgaard J, Wurster M, Lalk M, Johannsen M, Vosegaard T, Bilde T and Schramm A (2022) Metabolite Profiling of the Social Spider Stegodyphus dumicola Along a Climate Gradient. Front. Ecol. Evol. 10:841490. doi: 10.3389/fevo.2022.841490
Received: 22 December 2021; Accepted: 31 January 2022;
Published: 24 March 2022.
Edited by:
Folco Giomi, Independent Researcher, Padova, ItalyReviewed by:
Andrés Taucare-Ríos, Arturo Prat University, ChileStano Pekar, Masaryk University, Czechia
Copyright © 2022 Sandfeld, Malmos, Nielsen, Lund, Aagaard, Bechsgaard, Wurster, Lalk, Johannsen, Vosegaard, Bilde and Schramm. This is an open-access article distributed under the terms of the Creative Commons Attribution License (CC BY). The use, distribution or reproduction in other forums is permitted, provided the original author(s) and the copyright owner(s) are credited and that the original publication in this journal is cited, in accordance with accepted academic practice. No use, distribution or reproduction is permitted which does not comply with these terms.
*Correspondence: Trine Bilde, trine.bilde@bio.au.dk
†Present address: Kirsten Gade Malmos, Arla Foods a.m.b.a, Agro Food Park, 19, Aarhus, Denmark