Analysis of spatio-temporal changes and driving forces of cultivated land in China from 1996 to 2019
 Jianfeng Li1,2,3
  Jichang Han1,2,3* Yang Zhang1,2,3 Yingying Sun1,2,3 Biao Peng1,2,3 Xiao Xie1,2,3 Chao Guo1,2,3 Huping Ye4
- 1Institute of Land Engineering and Technology, Shaanxi Provincial Land Engineering Construction Group Co., Ltd., Xi’an, China
- 2Technology Innovation Center for Land Engineering and Human Settlements, Shaanxi Land Engineering Construction Group Co., Ltd., Xi’an Jiaotong University, Xi’an, China
- 3Shaanxi Provincial Land Engineering Construction Group Co., Ltd., Xi’an, China
- 4State Key Laboratory of Resources and Environmental Information System, Institute of Geographic Sciences and Natural Resources Research, Chinese Academy of Sciences, Beijing, China
Cultivated land is an important prerequisite and guarantee for food production and security, and the change of cultivated land resources in China has always been concerned. National land survey is an effective way to accurately grasp the area and distribution of cultivated land resources. However, due to the differences in technical means and statistical standards at different stages, there are obvious breakpoints among the cultivated land area data of the three land surveys in China, which hinders the in-depth study of the spatio-temporal distribution of cultivated land resources in long-time series. The Autoregressive Integrated Moving Average model is used to reconstruct and mine the cultivated land area data from 1996 to 2019 based on the data of the third land survey in China. The spatio-temporal variation characteristics of cultivated land area are explored by using Geographic Information System spatial analysis, and the driving factors of cultivated land change are analyzed based on Geographical Detector (GeoDetector) from the perspective of social, economic, agricultural and natural. The results show that the area of cultivated land in China decreased continuously from 1996 to 2019, with a sharp decrease from 1996 to 2004 and a slow decrease from 2005 to 2019. From 1996 to 2019, there were obvious spatial differences in the change of cultivated land area in 31 provincial units. From 1996 to 2008, the cultivated land area in 29 provinces showed a downward trend, especially in the central and northern regions such as Shaanxi, Sichuan and Inner Mongolia. From 2008 to 2019, the cultivated land area in the underdeveloped areas of Heilongjiang, Jilin, Liaoning, Xinjiang, Gansu and Tibet increased significantly, while the rest showed a downward trend. Factor detection found that the q values of population, regional gross domestic product grain output, the proportion of the added value of the primary industry and average slope were all more than 0.5, which had an important impact on the change of cultivated land area. The explanatory power of the interaction between factors on the change of cultivated land area is enhanced in different degrees compared with the single factor effect, which is manifested in the enhancement of bilinear or nonlinear enhancement, and the interaction of different factors promotes the change of cultivated land area. The change of cultivated land area is the result of complex interaction between factors, and is closely related to the land policy in the same period.
Introduction
Cultivated land is an important prerequisite and guarantee for food production, and food security is an important part of national security (Liu et al., 2018; Wang et al., 2020; Yang et al., 2021). Cultivated land provides the main living guarantee for the rural population and is the main source of living materials for urban residents (Zou et al., 2020). China is a large agricultural country, and cultivated land is the main carrier to maintain population growth (Xu et al., 2021). However, China only has about 0.2 acres of cultivated land per citizen, accounting for less than 40% of cultivated land per citizen in the world (Cui and Shoemaker, 2018). With the development of social economy, the process of urbanization and industrialization in China is constantly advancing, the construction land is expanding rapidly, the cultivated land resources are constantly changing, and the protection of cultivated land is facing great challenges (Zhao et al., 2006; Kong, 2014; Wang et al., 2020). Therefore, much attention has been paid to the change of cultivated land resources in China (Anderson and Strutt, 2014; Liu et al., 2017; Tan et al., 2017). The change of cultivated land is the result of the comprehensive action of multiple factors, which is closely related to economic, social, ecological, political and other factors (Lin and Ho, 2003; Song et al., 2012; Cao Y. et al., 2013). Studying the spatio-temporal change law and influencing factors of cultivated land resources is conducive to comprehensively grasping the current situation of cultivated land use, revealing the driving mechanism of cultivated land change, and providing a scientific basis for rational use of land resources, policy formulation and trend prediction.
Since the 1990s, scholars have begun to study and discuss the changes of cultivated land resources from different perspectives (Deng et al., 2006; Ge et al., 2018; Ramankutty et al., 2018). Relevant research involves cultivated land change (Valbuena et al., 2010), influencing factor (Chen and Wang, 2021), influencing factor model and driving mechanism (He et al., 2005), etc. There are two main sources of cultivated land resources data: the data obtained by remote sensing image interpretation or model classification and the official land survey data. The rapid development of remote sensing technology provides long-time dynamic data for the study of cultivated land change. Currently, the widely used remote sensing land use datasets include Global Land Cover Characterization Database (GLCC) (Loveland et al., 2000)、Global Land Cover 2000 project data (GLC 2000) (Bartholome and Belward, 2005)、University of Maryland land cover product (UMd) (Hansen et al., 2000)、Global Land Cover Product (GlobCover) (Arino et al., 2007) and GlobeLand30 (Jun et al., 2014). Scholars have studied the spatio-temporal change of cultivated land in China by using remote sensing data (Liu et al., 2003; Xu et al., 2017; Wang et al., 2020). Xu et al. found that from 1990 to 2010, the net increase of cultivated land in China was 1.30 × 10⁶ ha (Xu et al., 2017). The research results of Wang et al. show that from 1990 to 2000, the area of cultivated land increased by 1.62%, and then continuously decreased during 2000–2015, resulting in a national total growth rate of 0.80% from 1990 to 2015 (Wang et al., 2020). Due to the influence of the spatial-temporal resolution of remote sensing images, the phenomenon of different spectrum of the same object and the same spectrum of foreign objects, as well as the limitations of the algorithm, the accuracy of remote sensing classification in large-scale is generally not high, and there is still a certain gap with the accuracy of the official land survey data (Liu and Xia, 2010; Shao and Lunetta, 2012; Gómez-Chova et al., 2015; Cheng et al., 2020). Since 1996, China has completed three national land surveys. Based on the land survey data, the natural resources bureaus of each province will organize the land change survey every year, and the final summary will be released by the National Bureau of Statistics (NBS). In August 2021, the NBS of China released the data of the third national land survey, which is mainly based on remote sensing images or Unmanned Aerial Vehicle (UAV) images with a resolution better than 1m, combined with professional manual interpretation and field sampling verification to obtain high-precision land use data (Jiang et al., 2022). After statistical analysis, the difference between the cultivated land area of China in the commonly used remote sensing datasets and the data published in the third land survey is more than 10%. Therefore, the official land survey data can more accurately and truly reflect the status of cultivated land resources. However, there are obvious breakpoints in China’s cultivated land area data in 2008 and 2018 due to differences in technical means and statistical standards adopted in different stages of the national land survey. Most scholars avoid the transition years with obvious changes in data, and focus on the changes of cultivated land area from 1996 to 2008 and 2009–2018 (Jin, 2014; Tan et al., 2017). At present, there are few studies on the spatio-temporal changes and driving forces of cultivated land area in the whole cycle of three land surveys. The ARIMA model does not depend on external variables and can effectively overcome the problem of insufficient model accuracy caused by external parameters. The performance of the model has been better than that of the complex structure model in short-term prediction, and has been widely used in the prediction of crop yield, climate change, economic trend and so on (Fattah et al., 2018; Singh and Mohapatra, 2019; Zheng et al., 2020).
Based on the data of the third land survey in China, the ARIMA model is used in this study to reconstruct and mine the cultivated land area data from 1996 to 2019 in order to scientifically grasp the current situation of cultivated land use in different periods. The spatio-temporal change characteristics of cultivated land in China are studied by using GIS spatial analysis. The driving factors of cultivated land change are explored from the social, economic, agricultural and natural dimensions based on GeoDetector to provide scientific support for the intelligent management and precise protection of cultivated land.
Materials and methods
Study area
China (Figure 1) is located in eastern Asia, on the west coast of the Pacific Ocean. It starts from the center of the Heilongjiang River near Mohe River in the north and the Zengmu Reef in the Nansha Islands in the south. The land area is 9.6 million km2, and the land boundary is more than 20,000 km (Wang et al., 2021). In this study, 31 provinces, cities and autonomous regions except Taiwan Province, Hong Kong and Macao Special Administrative region were selected as the study area.
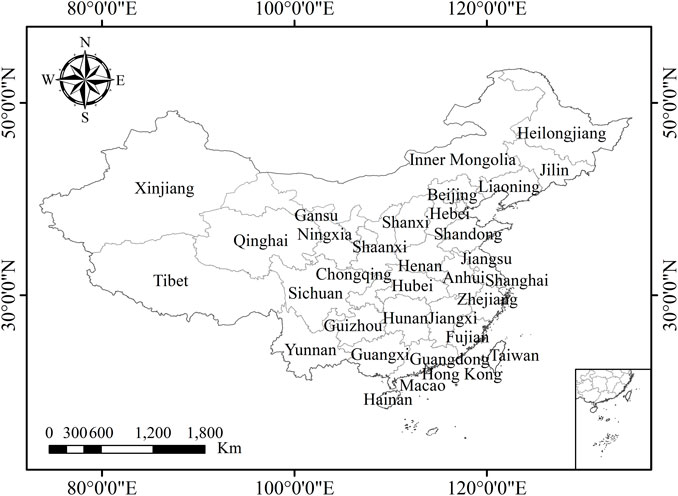
FIGURE 1. Location of study area.
Data
Comprehensively considering the development status of China and the availability of data, and referring to previous literature (Wang et al., 2015; Arowolo and Deng, 2018), 12 indicators related to the change of cultivated land area are selected: 1) social factors: population (Ⅰ1, unit: ×104 people); 2) Economic factors: regional GDP (Ⅱ1, unit: ×108 yuan), per capita GDP (Ⅱ2, unit: yuan/person), proportion of added value of primary industry (Ⅱ3, unit: %), proportion of added value of secondary industry (Ⅱ4, unit: %), proportion of added value of tertiary industry (Ⅱ5, unit: %), added value of agriculture, forestry, animal husbandry and fishery (Ⅱ6, unit: ×108 yuan); 3) Agricultural factors: grain output (Ⅲ1, unit: ×104 tons), total power of agricultural machinery (Ⅲ2, unit: ×104 kW); 4) Natural factors: average altitude (Ⅳ1, unit: m), terrain relief (Ⅳ2, unit: m); average slope (Ⅳ3, unit: degrees). The cultivated land resources data come from the website of the Ministry of Natural Resources (http://www.mnr.gov.cn)), and the data related to population and socio-economic development come from the website of the NBS of China (http://www.stats.gov.cn). Table 1 shows the official statistics of China’s cultivated land area from 1996 to 2019. Table 2 shows the descriptive statistical characteristics of social, economic and agricultural factors from 1996 to 2019. Based on the 30-m resolution SRTM DEM data (http://gdex.cr.usgs.gov/gdex), the average elevation, terrain relief and average slope of each province are calculated by Google Earth Engine cloud computing platform (Gorelick et al., 2017).
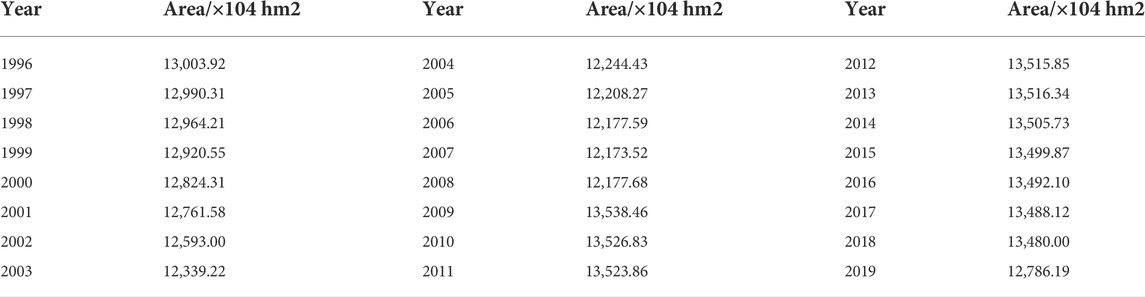
TABLE 1. Official statistics of cultivated land area in China from 1996 to 2019.
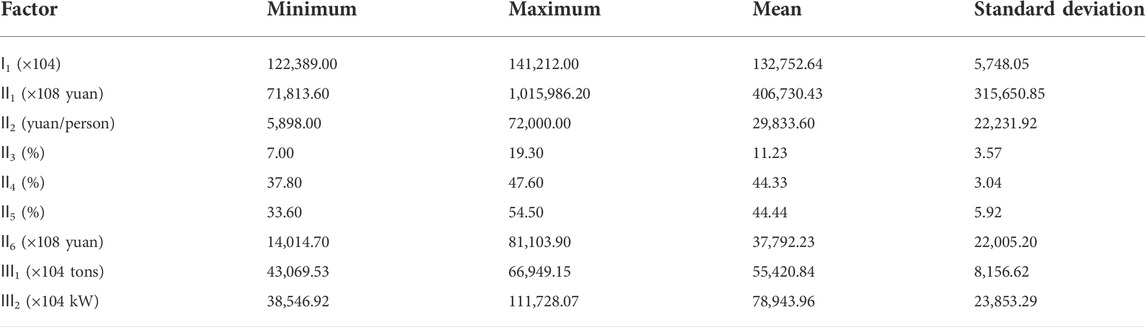
TABLE 2. Descriptive statistical characteristics of social, economic and agricultural factors from 1996 to 2019.
ARIMA model
ARIMA is a time series data analysis and prediction model proposed by Box and Jenkins (Gilbert, 2005). Its main principle is to establish a corresponding model to describe or simulate its past behavior from the time series itself, so as to predict and infer the future value. The model can combine the dynamic and persistent characteristics of time series to reveal the relationship between past and present, future and present of time series (Lai and Dzombak, 2020).
The ARIMA(p, d, q) model consists of three parts: AR(p) represents the autoregressive process, that is, the current value of a time series can be expressed as a linear combination of delayed p-period observations; I(d) represents the difference, d is the number of differences required when the time series becomes stationary; MA(q) represents the moving average process, that is, the model value can be expressed as a linear function of the q-order residual term. The expression of the model is as follows:
Where,
Figure 2 shows the modeling process of ARIMA model. Firstly, the stationarity of the time series data is tested. If it is a non-stationary time series, the d-order difference operation is required to convert it into a stationary time series. Then, white noise test is carried out on the data. If it is non-white noise, the best level p and order q are determined by autocorrelation function (ACF) and partial autocorrelation function (PACF) analysis. Finally, the white noise test is performed on the residual. Through the test, the modeling can be established to predict the future trend.
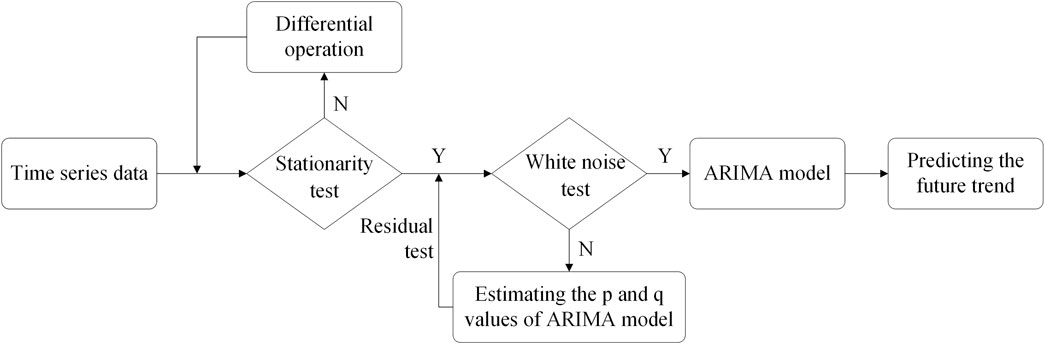
FIGURE 2. Modeling process of ARIMA.
GeoDetector
GeoDetector is a group of statistical methods to detect spatial differentiation and explain its driving force, including the factor detector, the interaction detector, the risk detector and the ecological detector (Wang et al., 2010). The main principle of the GeoDetector is to assume that the study is divided into several sub-regions. If the sum of the variance of the sub-region is less than the total variance of the region, there is a spatial difference; if the spatial distribution of the two variables tends to be consistent, there is a statistical correlation between the two variables. Geographic detector can evaluate spatial differentiation, detect explanatory factors and analyze the interaction between variables, and have been widely used in nature, environmental science, human health and other fields (Wang et al., 2010; Cao F. et al., 2013; Liu et al., 2020).
The factor detector is used to detect the spatial differentiation of the dependent variable
Where:
The interaction detector is used to evaluate the interaction between factors
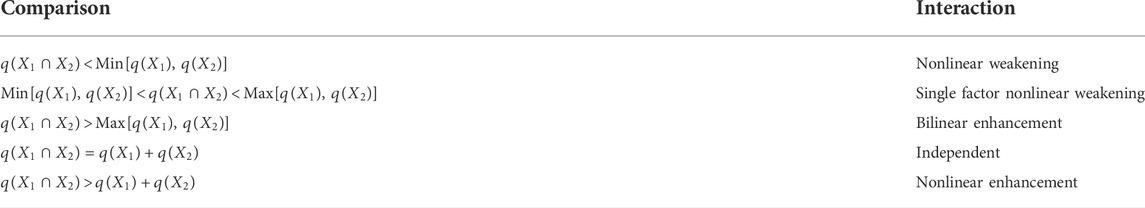
TABLE 3. Judgment basis of the interaction detector.
Results
Reconstruction of cultivated land data based on ARIMA model
Figure 3A shows the change trend of cultivated land area in China according to official data. It can be seen from the figure that there are obvious breakpoints in China’s cultivated land area data in 2008 and 2018, which is mainly due to the differences in the technical means adopted in different stages of the national land survey. 2008 is the dividing point between the first national land survey and the second national land survey, and 2018 is the dividing point between the second national land survey and the third national land survey. The technical means adopted in the first survey are backward, rely on manual operation, and the result data are stored in paper form, which is not conducive to land change investigation. However, the second survey is completed based on 3S (GIS, RS, GPS) technology, which greatly improves the accuracy and efficiency of land survey, and replenishes the previously uncounted cultivated land area due to underreporting or omission. Therefore, there was a sharp increase in the area of cultivated land in 2009. Compared with the second survey, the third survey is based on satellite images or UAV images with a resolution better than 1m, combined with professional manual interpretation and machine learning, big data and cloud computing technology to further improve the accuracy of the data. The sharp decline in the area of cultivated land in 2019 is mainly due to the elimination of the false positives in the second survey. The two obvious breakpoints make the original cultivated land data lack of coherence and accuracy.
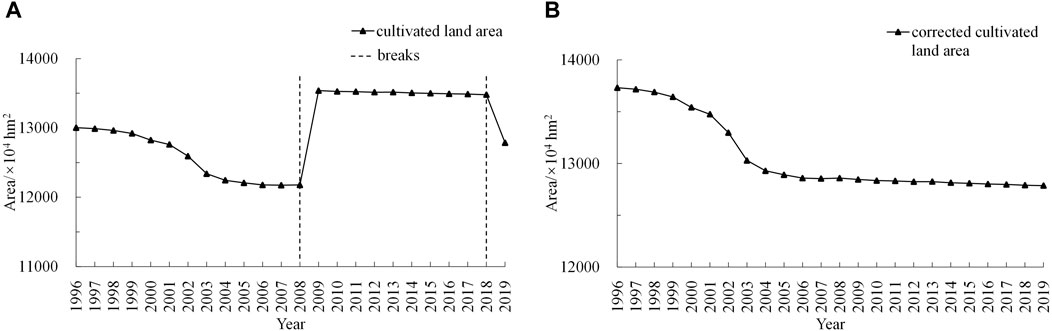
FIGURE 3. (A) is the change trend of the original cultivated land area. (B) is the change trend of cultivated land area after correction by ARIMA model.
To study the dynamic characteristics of cultivated land area in China from 1996 to 2019, it is necessary to correct the data to improve the rationality and comparability. The cultivated land area data published in the third survey in 2019 were used as the basis for sectional correction based on the ARIMA model. Firstly, the 2009–2018 data were used to predict the 2019 data. After the augmented Dickey–Fuller (ADF) test, it is determined that the data remains stable after the second-order difference. The model was determined to be ARIMA (1,2,0) (R2 = 0.922) after ACF and PACF analysis. The ratio of predicted data to actual data was determined to be 0.9488, and then the data from 2009 to 2018 were corrected. Secondly, the 1996–2008 data were used to predict the 2009 data. After analysis, ARIMA (1, 2, 0) (R2 = 0.908) was selected as the model, and the ratio between the predicted data and the corrected data was determined to be 1.0543, and then the data from 1996 to 2008 were corrected. Figure 3B shows the change trend of cultivated land area after correction. It can be seen from the figure that the corrected cultivated land data has stronger continuity and integrity, which is conducive to the dynamic analysis of long-time series.
Characteristics of spatio-temporal variation of cultivated land area in long-time series
As can be seen from Figure 3B, China’s cultivated land area showed a continuous decrease from 1996 to 2019. From 1996 to 2004, the cultivated land area showed a sharp decrease trend, with a total decrease of 8.01 × 10⁶ hm2 and a reduction rate of 5.84%. From 2005 to 2019, the cultivated land area decreased slowly by 8.50 × 10⁵ hm2, with a reduction rate of 0.66%.
To further analyze the spatial distribution differences of cultivated land from the perspective of provincial units, the ARIMA model was used to reconstruct the cultivated land data of 31 provinces, cities and autonomous regions. Figure 4 shows the amount and rate of change in cultivated land in China from 1996 to 2008 and 2008 to 2019. The change rate is the ratio of the difference between the cultivated land area at the end of the study and the initial stage of the study to the cultivated land area at the initial stage of the study. It can be seen from the figure that there are obvious spatial differences in the change of cultivated land area in 31 provincial units from 1996 to 2019. From 1996 to 2008, the cultivated land area of 29 provincial units showed a downward trend, accounting for more than 90%, especially in Shaanxi, Sichuan, Inner Mongolia and other central and northern regions, with a reduction of more than 1 × 10⁷ hm2, with a reduction rate of more than 10%. The change rate of Beijing is the highest, reaching -33%, and the change rate in most areas is maintained at -10–0%. Only Heilongjiang and Xinjiang have seen a small increase in cultivated land area. It can be seen that the rapid progress of industrialization and urbanization has undoubtedly led to the occupation of a large amount of cultivated land. From 2008 to 2019, there are significant differences in cultivated land area changes in different regions. The cultivated land area in underdeveloped areas such as Heilongjiang, Jilin, Liaoning, Inner Mongolia, Xinjiang, Gansu and Tibet has increased significantly, especially in Xinjiang and Inner Mongolia, where the growth rate has exceeded 50%. The other regions showed a downward trend, and the decrease in central and southern provinces exceeded 1 × 10⁷ hm2. In developed regions such as Beijing, Shanghai, Guangdong and Zhejiang, the decline rate exceeded 30%. During this period, China began to implement the cultivated land occupation-compensation balance and cultivated land protection system. Although the decline rate of cultivated land area slowed down compared with 1996–2008, some provinces still face a severe situation of cultivated land reduction.
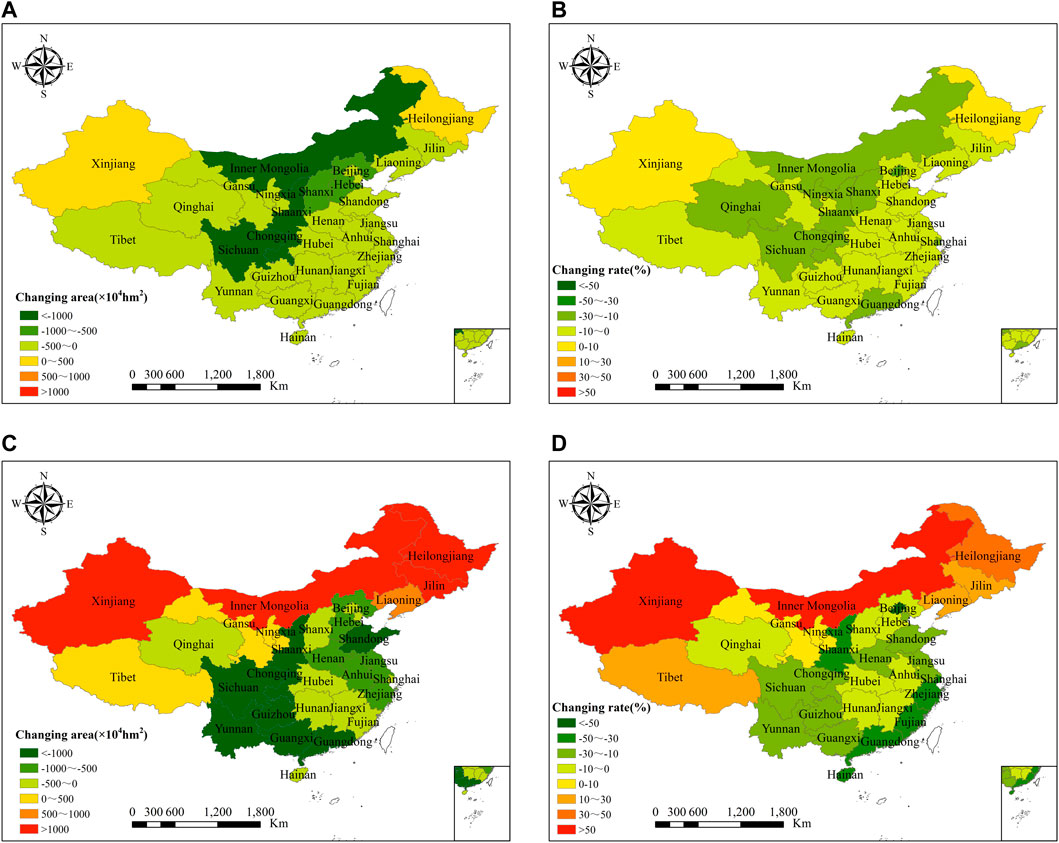
FIGURE 4. (A) and (C) are the amount of changes of cultivated land area in 1996–2008 and 2008–2019, respectively. (B) and (D) are the change rates of cultivated land area in 1996–2008 and 2008–2019, respectively.
Driving force analysis of cultivated land area change
The factor detector results reflect the explanatory power of each factor on the change of cultivated land area in China, and the results are shown in Figure 5A According to the analysis, the order of explanatory power of each factor on the change of cultivated land area in China is as follows: population (Ⅰ1) > regional GDP (Ⅱ1) > grain output (Ⅲ1) > proportion of added value of the primary industry (Ⅱ3) > average slope (Ⅳ3) > added value of agriculture, forestry, animal husbandry and fishery (Ⅱ6) > per capita GDP (Ⅱ2) > proportion of added value of the tertiary industry (Ⅱ5) > proportion of added value of the secondary industry (Ⅱ4) > average altitude (Ⅳ1) > total power of agricultural machinery (Ⅲ2) > terrain relief (Ⅳ2). The q values of the five factors, namely population, regional GDP, grain output, the proportion of the added value of the primary industry and average slope, exceeded 0.5, which had an important impact on the change of cultivated land area. With the continuous increase of population and the rapid rise of urbanization rate in China since 1996, the demand for residential land, living land and other construction land has increased sharply, resulting in the pressure of cultivated land being occupied to a certain extent. The regional GDP reflects the level of economic development of the region, and the increase in demand for construction land brought about by economic development is an important reason for the non-agriculturalization of cultivated land. Cultivated land is the most basic material condition of agricultural production, and the change of its quantity and quality will directly affect the grain yield. The qualitative and quantitative changes in the process of economic development are both characterized by the evolution and advancement of the industrial structure, which are mainly manifested in the continuous decline of the proportion of the primary industry and the increase in the proportion of the secondary and tertiary industries. The primary industry generally includes agriculture, forestry, fishing, animal husbandry and gathering. When the economic development enters the industrialization stage, the dominant factors of land use change are the market supply and demand of land products or services and the comparative benefits of land use. The land flows to the more efficient secondary and tertiary industries, and the agricultural land is rapidly non-agricultural. Slope is an important factor affecting the quality of cultivated land and the safety of cultivation. There is a positive correlation between slope and soil and water loss. With the increase of the slope, the runoff and scouring amount will increase accordingly. In order to control soil erosion and improve the ecological environment, China has implemented the conversion of cultivated land with large slopes to forests. Therefore, the slope has strong explanatory power to the change of cultivated land area.
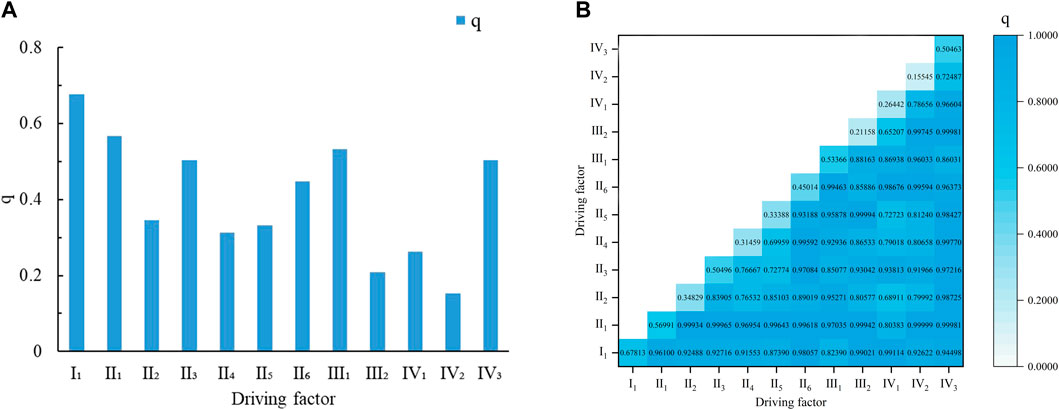
FIGURE 5. (A) is the result of factor detector. (B) is the result of the interaction detector.
The interaction detector can reflect the interaction between different types of factors, which is helpful to further study the driving mechanism of cultivated land area change. Figure 5B shows the results of the interaction detector. It can be seen from the figure that the interaction detecor results between factors are both bilinear enhancement or nonlinear enhancement, and there is no independence or weakening. The q value of interaction between different types of factors are significantly larger than that of single factor. The q values of most of the interactions between factors are more than 0.8, accounting for more than 84%. The interaction q value of the average altitude and the total power of agricultural machinery is the smallest, which is close to the maximum value of the single factor q value. The interaction between regional GDP and other factors has a strong explanatory power to the change of cultivated land area, with an average value of more than 0.97. The experimental results show that the explanatory power of the interaction between factors on the change of cultivated land area is enhanced to varying degrees compared with the single factor effect, and the interaction between different factors will have varying degrees of impact on the change of cultivated land area. At the same time, it confirms that the change of cultivated land area is the result of complex interaction between factors.
Discussion
Analysis of driving forces in different geographical regions
China is generally divided into seven geographical regions: North China (Beijing, Tianjin, Hebei, Shanxi, Inner Mongolia), Northeast China (Liaoning, Jilin, Heilongjiang), East China (Shanghai, Jiangsu, Zhejiang, Anhui, Fujian, Jiangxi, Shandong), South China (Guangdong, Guangxi, Hainan), Central China (Henan, Hubei, Hunan), Southwest China (Chongqing, Sichuan, Guizhou, Yunnan, Tibet) and Northwest China (Shaanxi, Gansu, Qinghai, Ningxia, Xinjiang) (He et al., 2008). Figure 6 shows the amount and rate of change in cultivated land in seven geographical regions of China from 1996 to 2019. As can be seen from the figure, the area of cultivated land decreased in all areas except Northeast and North China from 1996 to 2009. The area of cultivated land in East China and Southwest China decreased greatly, both exceeding 5×10⁷ hm2. The decline rate of cultivated land area in South China is the largest, exceeding 30%. On the other hand, there has been a substantial increase in the Northeast China, with an increase rate of more than 30%.
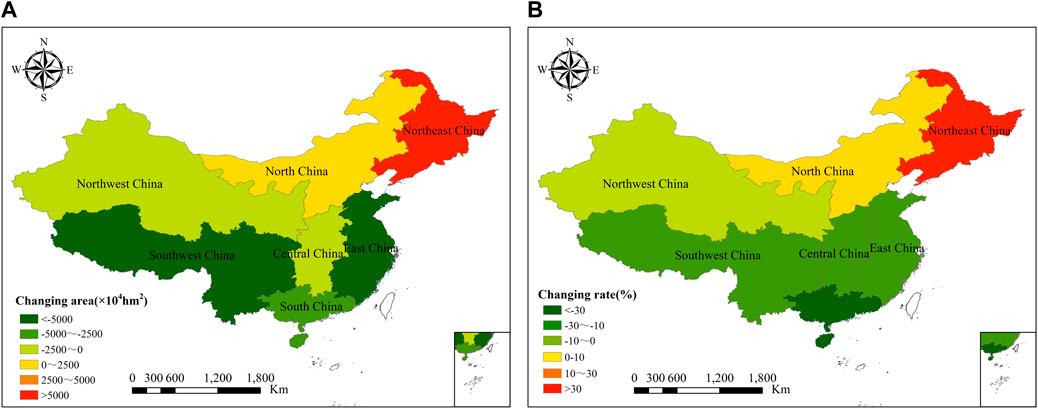
FIGURE 6. (A) is the amount of changes of cultivated land area in seven geographical regions of China from 1996 to 2019. (B) is the change rates of cultivated land area in seven geographical regions of China from 1996 to 2019.
Figure 7A shows the factor detector results of cultivated land area change in seven geographical regions of China. It can be seen from the figure that the order of the explanatory power of each factor on the change of cultivated land area in the seven geographical regions of China is: proportion of added value of the primary industry (Ⅱ3) > population (Ⅰ1) > regional GDP (Ⅱ1) > per capita GDP (Ⅱ2) > grain output (Ⅲ1) > average slope (Ⅳ3) > proportion of added value of the secondary industry (Ⅱ4) > added value of agriculture, forestry, animal husbandry and fishery (Ⅱ6) > terrain relief (Ⅳ2) > average altitude (Ⅳ1) > proportion of added value of the tertiary industry (Ⅱ5) > total power of agricultural machinery (Ⅲ2). Except for terrain relief, average altitude, the proportion of added value of the tertiary industry and the total power of agricultural machinery, the q value of other factors exceeded 0.7, which have an important impact on the change of cultivated land area in seven geographical regions of China. The q value of the proportion of added value of the primary industry and the population are both more than 0.9, which has a strong explanatory power to the change of cultivated land area in the seven geographical areas. The q value of the total power of agricultural machinery is the lowest, only 0.289. The total power of agricultural machinery reflects the level of agricultural modernization. The progress of agricultural science and technology has improved the total power of agricultural machinery, promoted the increase of grain yield per unit area and the output rate of cultivated land, thus alleviating the pressure of cultivated land production and food security, but did not directly affect the change of cultivated land area.
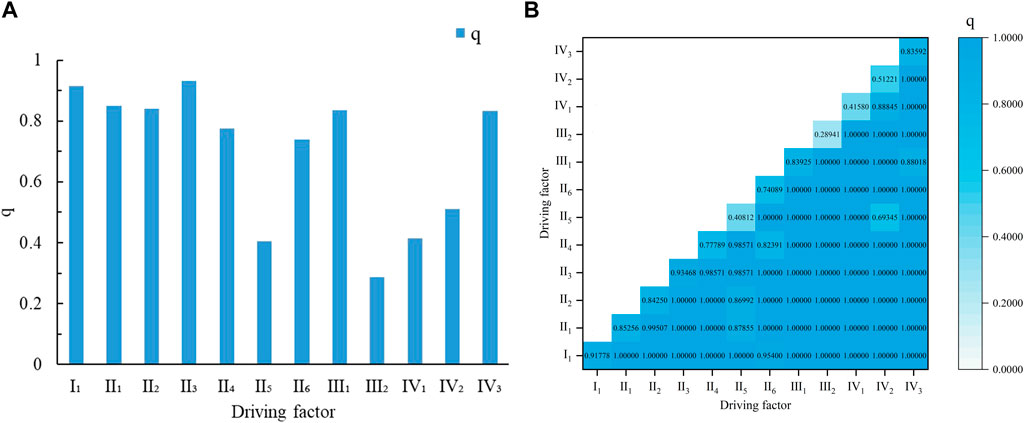
FIGURE 7. (A) is the factor detector results of cultivated land area change in seven geographical regions of China. (B) is the interaction detector results of cultivated land area change in seven geographical regions of China.
Figure 7B shows the interaction detector results of cultivated land area change in seven geographical regions of China. It can be seen from the figure that the interaction detecor results between factors are both bilinear enhancement or nonlinear enhancement, and there is no independence or weakening, which is consistent with the results of provincial cultivated land area. The q values of most of the interactions between factors are 1, accounting for more than 85%. The interaction q value between the proportion of added value of the tertiary industry and the terrain relief is the smallest, which is 0.6935. The average q value of interactive detection of all factors is 0.9839. The results show that the interaction between different factors has a strong explanatory power for the change of cultivated land area in seven geographical regions of China.
Policy factors of cultivated land area change
Land not only has natural attribute, but also has social-economic attribute (Verburg et al., 2015). For a long time, due to the influence of social, economic, policy and technical means, it is difficult to carry out long-time series analysis of cultivated land resource changes from the perspective of land survey statistics. The existing studies on cultivated land change based on land survey statistics are mainly concentrated in the two periods of 1996–2008 and 2009–2018 (Jin, 2014; Tan et al., 2017). However, there is an obvious gap in accuracy between large-scale cultivated land area data obtained by remote sensing data and land survey data (Manandhar et al., 2009; Liu et al., 2015). In this study, the ARIMA model is used to reconstruct and mine the cultivated land area data from 1996 to 2019, which eliminates the problem of time series data fracture caused by differences in technical means, and improves the rationality and integrity of the data. GIS spatial analysis is used to explore the spatio-temporal change characteristics of cultivated land area based on the corrected data, and the GeoDetector is used to analyze the driving mechanism of cultivated land change from the perspective of single factor and factor interaction. GeoDetector has obvious advantages in explaining the spatial heterogeneity of geographical phenomena, and can make up for the weakness that conventional methods cannot explain the interaction mechanism (Hu et al., 2020; Li et al., 2021; Xiang et al., 2021).
The cultivated land area is not only affected by social, economic, agricultural and natural factors, but also closely related to national policies in the same period (Wang et al., 2012; Wang et al., 2018). Since the 1990s, China has entered a stage of rapid urbanization and industrialization (Liu et al., 2010). Driven by the national macro policy, the demand for construction land increases sharply, which leads to the occupation of a large number of cultivated land resources. Since 1999, in order to control soil erosion and improve the ecological environment, China has implemented the policy of returning farmland to forests, grasslands and lakes, resulting in a further rapid reduction in the area of cultivated land (Bi et al., 2021). In 2004, the government revised the land management law, emphasizing the need to strengthen the protection of cultivated land and implement the balance policy of occupation and compensation, which has played a positive role in the change of cultivated land area (Liu et al., 2014). Under the condition that the balance between occupation and compensation has been strictly implemented for the cultivated land occupied by non-agricultural construction, the main reasons for the reduction of cultivated land area are the adjustment of agricultural structure and land greening. In 2008, China promoted rural reform, improved the strict and standardized rural land management system, and adhered to the strictest cultivated land protection system (Liu et al., 2017). In the new urbanization and Rural Revitalization stage after 2014, China implemented the strictest cultivated land protection system and intensive and economical land use system to optimize the land use structure and improve the land use efficiency (Liu et al., 2017). The implementation of these policies has effectively slowed down the decline of cultivated land.
At present, China is in the “three peaks” period of population, industrialization and urbanization. Social development is faced with major problems, such as maintaining high-quality green economic development, ensuring ecological construction, protecting cultivated land resources and food security, and achieving the goal of carbon peak and carbon neutralization. At the same time, the international situation is complex and changeable, the epidemic situation of COVID-19 is intertwined with the war, and the food crisis in many countries has intensified. Therefore, the protection of cultivated land resources is facing unprecedented pressure. Looking forward to the future, the protection of cultivated land resources in China should turn to quantity, quality and ecology. On the basis of ensuring the red line of 0.3 billion acres of cultivated land, we should ensure the safety of China’s cultivated land resources and food production by increasing land use control and balanced management of cultivated land, improving the incentive mechanism for cultivated land use, adjusting agricultural production methods, increasing investment in agricultural production, optimizing agricultural policies according to local conditions, changing land use patterns and reserving flexible cultivated land.
Conclusion
Based on the data of three land surveys in China, this study deeply analyzes the reasons for the obvious fracture of cultivated land area data in 2008 and 2018, and uses ARIMA model to reconstruct the cultivated land area data from 1996 to 2019. Combined with GIS spatial analysis and GeoDetector, the spatio-temporal change characteristics and driving factors of cultivated land area are analyzed. The results show that the area of cultivated land in China decreased continuously from 1996 to 2019, with a sharp decrease from 1996 to 2004 and a slow decrease from 2005 to 2019. From 1996 to 2019, there were obvious spatial differences in the change of cultivated land area of 31 provincial units. From 1996 to 2008, the cultivated land area of 29 provincial units showed a downward trend, accounting for more than 90%, especially in the central and northern regions such as Shaanxi, Sichuan and Inner Mongolia. From 2008 to 2019, the cultivated land area in the underdeveloped areas of Heilongjiang, Jilin, Liaoning, Xinjiang, Gansu and Tibet increased significantly, while the rest showed a downward trend. The factor detector found that the q value of the five factors, namely population, regional GDP, grain output, the proportion of the added value of the primary industry and average slope, exceeded 0.5, which had an important impact on the change of cultivated land area. The explanatory power of the interaction between factors to the change of cultivated land area is enhanced in varying degrees compared with that of single factor, which is characterized by bilinear enhancement or nonlinear enhancement. The proportion of interaction q greater than 0.8 is more than 84%, and the interaction of various factors promotes the change of cultivated land area. It can be inferred from the results that the change of cultivated land area is the result of complex interaction between factors, and is closely related to the land policy in the same period.
Data availability statement
The cultivated land resources data can be downloaded through the website of the Ministry of Natural Resources (http://www.mnr.gov.cn), and population and socio-economic development data can be downloaded free of charge through the website of the National Bureau of Statistics of China (http://www.stats.gov.cn).
Author contributions
JL contributed by processing the data and wrote the main part of the manuscript. HY contributed to the research design, and gave constructive comments and suggestions. JH, YZ, YS and BP put forward detailed suggestions for the revision of the article, and assisted JL to complete all the experiments. XX and CG contributed to writing and collecting data.
Funding
This research was supported by the Technology Innovation Center for Land Engineering and Human Settlements, Shaanxi Land Engineering Construction Group Co.,Ltd. and Xi’an Jiaotong University (No. 2021WHZ0090), the Scientific Research Item of Shaanxi Provincial Land Engineering Construction Group (DJTD2022–4), the National Key Research and Development Program of China (No. 2019YFE0126500), the National Science and Technology Major Project of China’s High Resolution Earth Observation System (No. 21-Y20B01-9001-19/22) and the Scientific Instrument Developing Project of the Chinese Academy of Sciences (No. YJKYYQ20200010).
Acknowledgments
We are very grateful for the free data provided by China’s Natural Resources Bureau and the National Bureau of Statistics.
Conflict of interest
JL, JH, YZ, YS, BP, XX and CG are employed by Shaanxi Provincial Land Engineering Construction Group Co., Ltd.
The remaining authors declare that the research was conducted in the absence of any commercial or financial relationships that could be construed as a potential conflict of interest.
The authors declare that this study received funding from Technology Innovation Center for Land Engineering and Human Settlements, Shaanxi Land Engineering Construction Group Co., Ltd., and Xi’an Jiaotong University. The company had the following involvement in the study: design, data collection and analysis.
Publisher’s note
All claims expressed in this article are solely those of the authors and do not necessarily represent those of their affiliated organizations, or those of the publisher, the editors and the reviewers. Any product that may be evaluated in this article, or claim that may be made by its manufacturer, is not guaranteed or endorsed by the publisher.
References
Anderson, K., and Strutt, A. (2014). Food security policy options for China: Lessons from other countries. Food Policy 49, 50–58. doi:10.1016/j.foodpol.2014.06.008
Arino, O., Gross, D., Ranera, F., Leroy, M., Bicheron, P., Brockman, C., et al. (2007). “GlobCover: ESA service for global land cover from MERIS,” in 2007 IEEE international geoscience and remote sensing symposium, Spain, July 23-27, 2007, 2412–2415.
Arowolo, A. O., and Deng, X. (2018). Land use/land cover change and statistical modelling of cultivated land change drivers in Nigeria. Reg. Environ. Change 18 (1), 247–259. doi:10.1007/s10113-017-1186-5
Bartholome, E., and Belward, A. S. (2005). GLC2000: A new approach to global land cover mapping from earth observation data. Int. J. Remote Sens. 26 (9), 1959–1977. doi:10.1080/01431160412331291297
Bi, W., Wang, K., Weng, B., Yan, D., and Liu, S. (2021). Does the Returning Farmland to Forest Program improve the ecosystem stability of rhizosphere in winter in alpine regions? Appl. Soil Ecol. 165, 104011. doi:10.1016/j.apsoil.2021.104011
Cao, F., Ge, Y., and Wang, J.-F. (2013a). Optimal discretization for geographical detectors-based risk assessment. GIScience Remote Sens. 50 (1), 78–92. doi:10.1080/15481603.2013.778562
Cao, Y., Bai, Z., Zhou, W., and Wang, J. (2013b). Forces driving changes in cultivated land and management countermeasures in the three gorges reservoir area, China. J. Mt. Sci. 10 (01), 149–162. doi:10.1007/s11629-013-2240-5
Chen, L., and Wang, Q. (2021). Spatio-temporal evolution and influencing factors of land use in Tibetan region: 1995–2025. Earth Sci. Inf. 14 (4), 1821–1832. doi:10.1007/s12145-021-00627-0
Cheng, G., Xie, X., Han, J., Guo, L., and Xia, G.-S. (2020). Remote sensing image scene classification meets deep learning: Challenges, methods, benchmarks, and opportunities. IEEE J. Sel. Top. Appl. Earth Obs. Remote Sens. 13, 3735–3756. doi:10.1109/jstars.2020.3005403
Cui, K., and Shoemaker, S. P. (2018). A look at food security in China. Berlin, Germany: Nature Publishing Group.
Deng, X., Huang, J., Rozelle, S., and Uchida, E. (2006). Cultivated land conversion and potential agricultural productivity in China. Land use policy 23 (4), 372–384. doi:10.1016/j.landusepol.2005.07.003
Fattah, J., Ezzine, L., Aman, Z., El Moussami, H., and Lachhab, A. (2018). Forecasting of demand using ARIMA model. Int. J. Eng. Bus. Manag. 10. doi:10.1177/1847979018808673
Ge, D., Long, H., Zhang, Y., Ma, L., and Li, T. (2018). Farmland transition and its influences on grain production in China. Land Use Policy 70, 94–105. doi:10.1016/j.landusepol.2017.10.010
Gilbert, K. (2005). An ARIMA supply chain model. Manag. Sci. 51 (2), 305–310. doi:10.1287/mnsc.1040.0308
Gómez-Chova, L., Tuia, D., Moser, G., and Camps-Valls, G. (2015). Multimodal classification of remote sensing images: A review and future directions. Proc. IEEE 103 (9), 1560–1584. doi:10.1109/jproc.2015.2449668
Gorelick, N., Hancher, M., Dixon, M., Ilyushchenko, S., Thau, D., and Moore, R. (2017). Google earth engine: Planetary-scale geospatial analysis for everyone. Remote Sens. Environ. 202, 18–27. doi:10.1016/j.rse.2017.06.031
Hansen, M. C., DeFries, R. S., Townshend, J. R., and Sohlberg, R. (2000). Global land cover classification at 1 km spatial resolution using a classification tree approach. Int. J. remote Sens. 21 (6-7), 1331–1364. doi:10.1080/014311600210209
He, C., Li, J., Wang, Y., Shi, P., Chen, J., and Pan, Y. (2005). Understanding cultivated land dynamics and its driving forces in northern China during 1983-2001. J. Geogr. Sci. 15 (04), 387–395. doi:10.1360/gs050401
He, F., Ge, Q., Dai, J., and Rao, Y. (2008). Forest change of China in recent 300 years. J. Geogr. Sci. 18 (1), 59–72. doi:10.1007/s11442-008-0059-8
Hu, D., Meng, Q., Zhang, L., and Zhang, Y. (2020). Spatial quantitative analysis of the potential driving factors of land surface temperature in different “centers” of polycentric cities: A case study in Tianjin, China. Sci. Total Environ. 706, 135244. doi:10.1016/j.scitotenv.2019.135244
Jiang, Y., Tang, Y.-T., Long, H., and Deng, W. (2022). Land consolidation: A comparative research between europe and China. Land Use Policy 112, 105790. doi:10.1016/j.landusepol.2021.105790
Jin, T. (2014). Effects of cultivated land use on temporal-spatial variation of grain production in China. J. Nat. Resour. 29 (6), 911–919. doi:10.11849/zrzyxb.2014.06.001
Jun, C., Ban, Y., and Li, S. (2014). Open access to Earth land-cover map. Nature 514 (7523), 434. doi:10.1038/514434c
Kong, X. (2014). China must protect high-quality arable land. Nature 506 (7486), 7. doi:10.1038/506007a
Lai, Y., and Dzombak, D. A. (2020). Use of the autoregressive integrated moving average (ARIMA) model to forecast near-term regional temperature and precipitation. Weather Forecast. 35 (3), 959–976. doi:10.1175/waf-d-19-0158.1
Li, D., Yang, Y., Du, G., and Huang, S. (2021). Understanding the contradiction between rural poverty and rich cultivated land resources: A case study of Heilongjiang province in Northeast China. Land Use Policy 108, 105673. doi:10.1016/j.landusepol.2021.105673
Lin, G. C., and Ho, S. P. (2003). China's land resources and land-use change: Insights from the 1996 land survey. Land Use Policy 20 (20), 87–107. doi:10.1016/s0264-8377(03)00007-3
Liu, C., Li, W., Zhu, G., Zhou, H., Yan, H., and Xue, P. (2020). Land use/land cover changes and their driving factors in the northeastern Tibetan plateau based on geographical detectors and Google earth engine: A case study in gannan prefecture. Remote Sens. 12 (19), 3139. doi:10.3390/rs12193139
Liu, D., Gong, Q., and Yang, W. (2018). The evolution of farmland protection policy and optimization path from 1978 to 2018. Chin. Rural. Econ. 12, 37–51.
Liu, D., and Xia, F. (2010). Assessing object-based classification: Advantages and limitations. Remote Sens. Lett. 1 (4), 187–194. doi:10.1080/01431161003743173
Liu, J., Liu, M., Zhuang, D., Zhang, Z., and Deng, X. (2003). Study on spatial pattern of land-use change in China during 1995–2000. Sci. China Ser. D Earth Sci. 46 (4), 373–384.
Liu, T., Liu, H., and Qi, Y. (2015). Construction land expansion and cultivated land protection in urbanizing China: Insights from national land surveys, 1996–2006. Habitat Int. 46, 13–22. doi:10.1016/j.habitatint.2014.10.019
Liu, X., Zhao, C., and Song, W. (2017). Review of the evolution of cultivated land protection policies in the period following China’s reform and liberalization. Land Use Policy 67, 660–669. doi:10.1016/j.landusepol.2017.07.012
Liu, Y., Fang, F., and Li, Y. (2014). Key issues of land use in China and implications for policy making. Land Use Policy 40, 6–12. doi:10.1016/j.landusepol.2013.03.013
Liu, Y., Liu, Y., Chen, Y., and Long, H. (2010). The process and driving forces of rural hollowing in China under rapid urbanization. J. Geogr. Sci. 20 (6), 876–888. doi:10.1007/s11442-010-0817-2
Loveland, T. R., Reed, B. C., Brown, J. F., Ohlen, D. O., Zhu, Z., Yang, L., et al. (2000). Development of a global land cover characteristics database and IGBP DISCover from 1 km AVHRR data. Int. J. remote Sens. 21 (6-7), 1303–1330. doi:10.1080/014311600210191
Manandhar, R., Odeh, I. O., and Ancev, T. (2009). Improving the accuracy of land use and land cover classification of Landsat data using post-classification enhancement. Remote Sens. 1 (3), 330–344. doi:10.3390/rs1030330
Ramankutty, N., Mehrabi, Z., Waha, K., Jarvis, L., Kremen, C., Herrero, M., et al. (2018). Trends in global agricultural land use: Implications for environmental health and food security. Annu. Rev. Plant Biol. 69, 789–815. doi:10.1146/annurev-arplant-042817-040256
Shao, Y., and Lunetta, R. S. (2012). Comparison of support vector machine, neural network, and CART algorithms for the land-cover classification using limited training data points. ISPRS J. Photogrammetry Remote Sens. 70, 78–87. doi:10.1016/j.isprsjprs.2012.04.001
Singh, S., and Mohapatra, A. (2019). Repeated wavelet transform based ARIMA model for very short-term wind speed forecasting. Renew. Energy 136, 758–768. doi:10.1016/j.renene.2019.01.031
Song, X., Ouyang, Z., Li, Y., and Li, F. (2012). Cultivated land use change in China, 1999–2007: Policy development perspectives. J. Geogr. Sci. 22 (06), 1061–1078. doi:10.1007/s11442-012-0983-5
Tan, Y., He, J., Yue, W., Zhang, L., and Wang, Q. (2017). Spatial pattern change of the cultivated land before and after the second national land survey in China. J. Nat. Resour. 32 (02), 186–197. doi:10.11849/zrzyxb.20160263
Valbuena, D., Verburg, P. H., Bregt, A. K., and Ligtenberg, A. (2010). An agent-based approach to model land-use change at a regional scale. Landsc. Ecol. 25 (2), 185–199. doi:10.1007/s10980-009-9380-6
Verburg, P. H., Crossman, N., Ellis, E. C., Heinimann, A., Hostert, P., Mertz, O., et al. (2015). Land system science and sustainable development of the Earth system: A global land project perspective. Anthropocene 12, 29–41. doi:10.1016/j.ancene.2015.09.004
Wang, G., Liu, Y., Li, Y., and Chen, Y. (2015). Dynamic trends and driving forces of land use intensification of cultivated land in China. J. Geogr. Sci. 25 (1), 45–57. doi:10.1007/s11442-015-1152-4
Wang, J., Chen, Y., Shao, X., Zhang, Y., and Cao, Y. (2012). Land-use changes and policy dimension driving forces in China: Present, trend and future. Land use policy 29 (4), 737–749. doi:10.1016/j.landusepol.2011.11.010
Wang, J. F., Li, X. H., Christakos, G., Liao, Y. L., Zhang, T., Gu, X., et al. (2010). Geographical detectors‐based health risk assessment and its application in the neural tube defects study of the Heshun Region, China. Int. J. Geogr. Inf. Sci. 24 (1), 107–127. doi:10.1080/13658810802443457
Wang, J., Lin, Y., Glendinning, A., and Xu, Y. (2018). Land-use changes and land policies evolution in China’s urbanization processes. Land use policy 75, 375–387. doi:10.1016/j.landusepol.2018.04.011
Wang, S., Xu, L., Zhuang, Q., and He, N. (2021). Investigating the spatio-temporal variability of soil organic carbon stocks in different ecosystems of China. Sci. Total Environ. 758, 143644. doi:10.1016/j.scitotenv.2020.143644
Wang, X., Xin, L., Tan, M., Li, X., and Wang, J. (2020). Impact of spatiotemporal change of cultivated land on food-water relations in China during 1990–2015. Sci. Total Environ. 716, 137119. doi:10.1016/j.scitotenv.2020.137119
Xiang, Y., Huang, C., Huang, X., Zhou, Z., and Wang, X. (2021). Seasonal variations of the dominant factors for spatial heterogeneity and time inconsistency of land surface temperature in an urban agglomeration of central China. Sustain. Cities Soc. 75, 103285. doi:10.1016/j.scs.2021.103285
Xu, W., Jin, X., Liu, J., and Zhou, Y. (2021). Analysis of influencing factors of cultivated land fragmentation based on hierarchical linear model: A case study of Jiangsu province, China. Land Use Policy 101, 105119. doi:10.1016/j.landusepol.2020.105119
Xu, X., Wang, L., Cai, H., Wang, L., Liu, L., and Wang, H. (2017). The influences of spatiotemporal change of cultivated land on food crop production potential in China. Food Secur. 9 (3), 485–495. doi:10.1007/s12571-017-0683-1
Yang, Z., Xunhuan, L., and Yansui, L. (2021). Cultivated land protection and rational use in China. Land Use Policy 106, 105454. doi:10.1016/j.landusepol.2021.105454
Zheng, A., Fang, Q., Zhu, Y., Jiang, C., Jin, F., and Wang, X. (2020). An application of ARIMA model for predicting total health expenditure in China from 1978–2022. J. Glob. Health 10 (1). doi:10.7189/jogh.10.010803
Zhao, Q., Zhou, S., Wu, S., and Ren, K. (2006). Cultivated land resources and strategies for its sustainable utilization and protection in China. Acta Pedol. Sin. 43 (04), 662–672. doi:10.11766/200511020420
Keywords: cultivated land, spatio-temporal change, driving force, ARIMA model, geodetector
Citation: Li J, Han J, Zhang Y, Sun Y, Peng B, Xie X, Guo C and Ye H (2022) Analysis of spatio-temporal changes and driving forces of cultivated land in China from 1996 to 2019. Front. Environ. Sci. 10:983289. doi: 10.3389/fenvs.2022.983289
Received: 30 June 2022; Accepted: 12 October 2022;
Published: 28 October 2022.
Edited by:
Jianzhou Gong, Guangzhou University, ChinaReviewed by:
Yulong Guo, Henan Agricultural University, ChinaShi Qiu, Xian Institute of Optics and Precision Mechanics (CAS), China
Copyright © 2022 Li, Han, Zhang, Sun, Peng, Xie, Guo and Ye. This is an open-access article distributed under the terms of the Creative Commons Attribution License (CC BY). The use, distribution or reproduction in other forums is permitted, provided the original author(s) and the copyright owner(s) are credited and that the original publication in this journal is cited, in accordance with accepted academic practice. No use, distribution or reproduction is permitted which does not comply with these terms.
*Correspondence: Jichang Han, hanjc_sxdj@126.com