Abstract
A limiting factor for solid oxide fuel cell (SOFC) performance is the oxygen reduction reaction (ORR) that occurs at the cathode surface. This study examines changes in the surface composition of (La0.8Sr0.2)0.95MnO3 (LSM-20), a well-known SOFC cathode material. Heteroepitaxial thin films of LSM-20 were grown on lattice matched single crystal LaAlO3 and NdGaO3 substrates. Total Reflection X-ray Fluorescence (TXRF) measurements showed surface manganese enrichment on annealing at 800°C in air. X-ray absorption near edge spectroscopy (XANES) showed that this leads to a redistribution of manganese 3+, 4+, and 2+ valence states at the surface. This was confirmed by defect modeling, which showed that surface Mn segregation leads to an increase in the surface concentration of oxygen vacancies and the Mn+4 species, both of which are expected to be beneficial for ORR.
Export citation and abstract BibTeX RIS

This is an open access article distributed under the terms of the Creative Commons Attribution Non-Commercial No Derivatives 4.0 License (CC BY-NC-ND, http://creativecommons.org/licenses/by-nc-nd/4.0/), which permits non-commercial reuse, distribution, and reproduction in any medium, provided the original work is not changed in any way and is properly cited. For permission for commercial reuse, please email: oa@electrochem.org.
Solid oxide fuel cells (SOFCs) are chemical to electrical energy conversion devices that have several advantages, including potential efficiency over 70%, fuel flexibility, low emissions, and low degradation over long time scales.1 Commonly, SOFCs are operated at high temperatures (∼ 800°C). Incorporation of oxygen into the cell at the cathode surface, known as the oxygen reduction reaction (ORR) is identified as a rate-limiting step in an SOFC.2 The overall ORR can be expressed as:
![Equation ([1])](https://content.cld.iop.org/journals/1945-7111/164/10/F3091/revision1/d0001.gif)
Equation 1 actually consists of several sub-steps including oxygen adsorption on the surface of the cathode, electron transfer to form oxygen ions, and incorporation of oxygen ions into oxygen vacancies, among others. For an electronic conducting cathode material like strontium-doped lanthanum manganite (LSM), the charge transfer occurs at the triple phase boundary (TPB),2 requiring the adsorbed oxygen to be transported to the TPBs.
Recent research examines how changes in cation dopant concentration impacts surface phase formation.3,4 Cations in these materials segregate to grain surfaces and create phases that can both enhance (as small, nanoscale adsorption sites) oxygen incorporation and block (large insulating phases) incorporation sites.
Total reflection X-ray fluorescence (TXRF) studies on LSM films with 30 at% Sr A-site doping have suggested that strontium segregates to the surface and form strontium enriched nanoparticles.5 Yildiz et al. examined Mn K-edge XANES of LSM and saw no dependence on polarization at high temperature. Yildiz and coworkers also looked at La  -edge XANES for LSM and LCM and suggested that there is an increase in the number of electronic La 5d-band vacancies in the near surface region of these materials.6
Strontium segregation has also been observed in the widely used cathode material La0.6Sr0.4Co0.2Fe0.8O3 (LSCF).7–14 Oh et al. showed that precipitates form on grain surfaces upon annealing after 50 hours.11 Segregation has been found for other ABO3 perovskites including La0.8Sr0.2CoO3±δ. (LSC).15,16 Studies have attributed the surface strontium-rich phases to oxide, hydroxide, and carbonate phases.9,16–18 Strontium oxide is an insulator,19 implying that high surface coverage will reduce activity by blocking incorporation sites.15,20,21 In contrast, Shao-Horn and co-workers have shown that a low concentration of surface phases may in fact be beneficial to overall cell performance by promoting surface exchange.22 Understanding how the surface chemistry changes during initial heating may reveal a way to exploit the self-decorating nature of these materials. Thus, understanding surface segregation/phase formation at the cathode surface and their effects on the ORR reaction is vital to designing more efficient SOFCs.
In this research, idealized thin films of LSM with 20 at% Sr A-site doping were grown on single crystal substrates. Thin films allow for a well-defined surface/gas interface with surfaces amiable to surface X-ray studies. A variety of X-ray fluorescence experiments were carried with the aim of measuring bulk and surface structure, local atomic environments and charge states of cation species at high temperatures. Changes in surface chemistry were incorporated into a defect model to predict the effect of surface segregation on the ORR reaction.
Experimental
Thin film deposition and characterization
Heteroepitaxial thin films deposited by pulsed laser deposition (PLD) on lattice-matched substrates allow for single crystal thin films with atomically smooth film surfaces, amenable to glancing incidence angle X-ray experiments. Lanthanum aluminate (LAO) and neodymium gallate (NGO) (CrysTec GmbH Kristalltechnologie, Berlin, Germanye) were chosen as good lattice matched candidates.
Thin films of (La0.8Sr0.2)0.95MnO3±δ, (LSM-20) were deposited by PLD on single crystal (100)-LAO, and (011)-NGO substrates at the Environmental Molecular Sciences Laboratory (EMSL) at Pacific Northwest National Laboratory (PNNL). A 248 nm krypton fluoride laser was used for the deposition, with the substrates heated to 550°C in 10 millitorr of oxygen. Both the target and substrates were rotated to ensure even deposition. The films on LAO substrates were ∼25 nm in thickness, while those on NGO substrates were ∼250 nm in thickness.
At room temperature, LSM can be indexed using a pseudo-cubic lattice constant of ac = 0.389 nm,23 while LAO can be indexed using a pseudo-cubic constant of ac = 0.379 nm at room temperature.24 At room temperature, NGO is orthorhombic with a = 0.543 nm, b = 0.550 nm, c = 0.771 nm.25 θ–2θ X-ray diffraction (XRD) scans of LSM-20 thin films on LAO and NGO are shown in Figure 1. The films show excellent hetero-epitaxial relationship due to the close lattice match between the thin film and substrate. The hetero-epitaxial relationships were found to be (100)-LSM-20 || (100)-LAO, and [010]-LSM || [010]-LAO (cube-on-cube) for the LSM-20/LAO system, and (100)-LSM || (011)-NGO and [001]-LSM || [001]-NGO for the LSM-20/NGO system. Figure 2 shows a cross-sectional high-resolution transmission electron microscope (HRTEM) micrograph of a LSM-20 thin film on LAO, with the selected area diffraction (SAD) pattern highlighting the cube-on-cube hetero-epitaxial relationship between the film and substrate. Figure 3 shows the LSM-20/NGO interfacial match.26
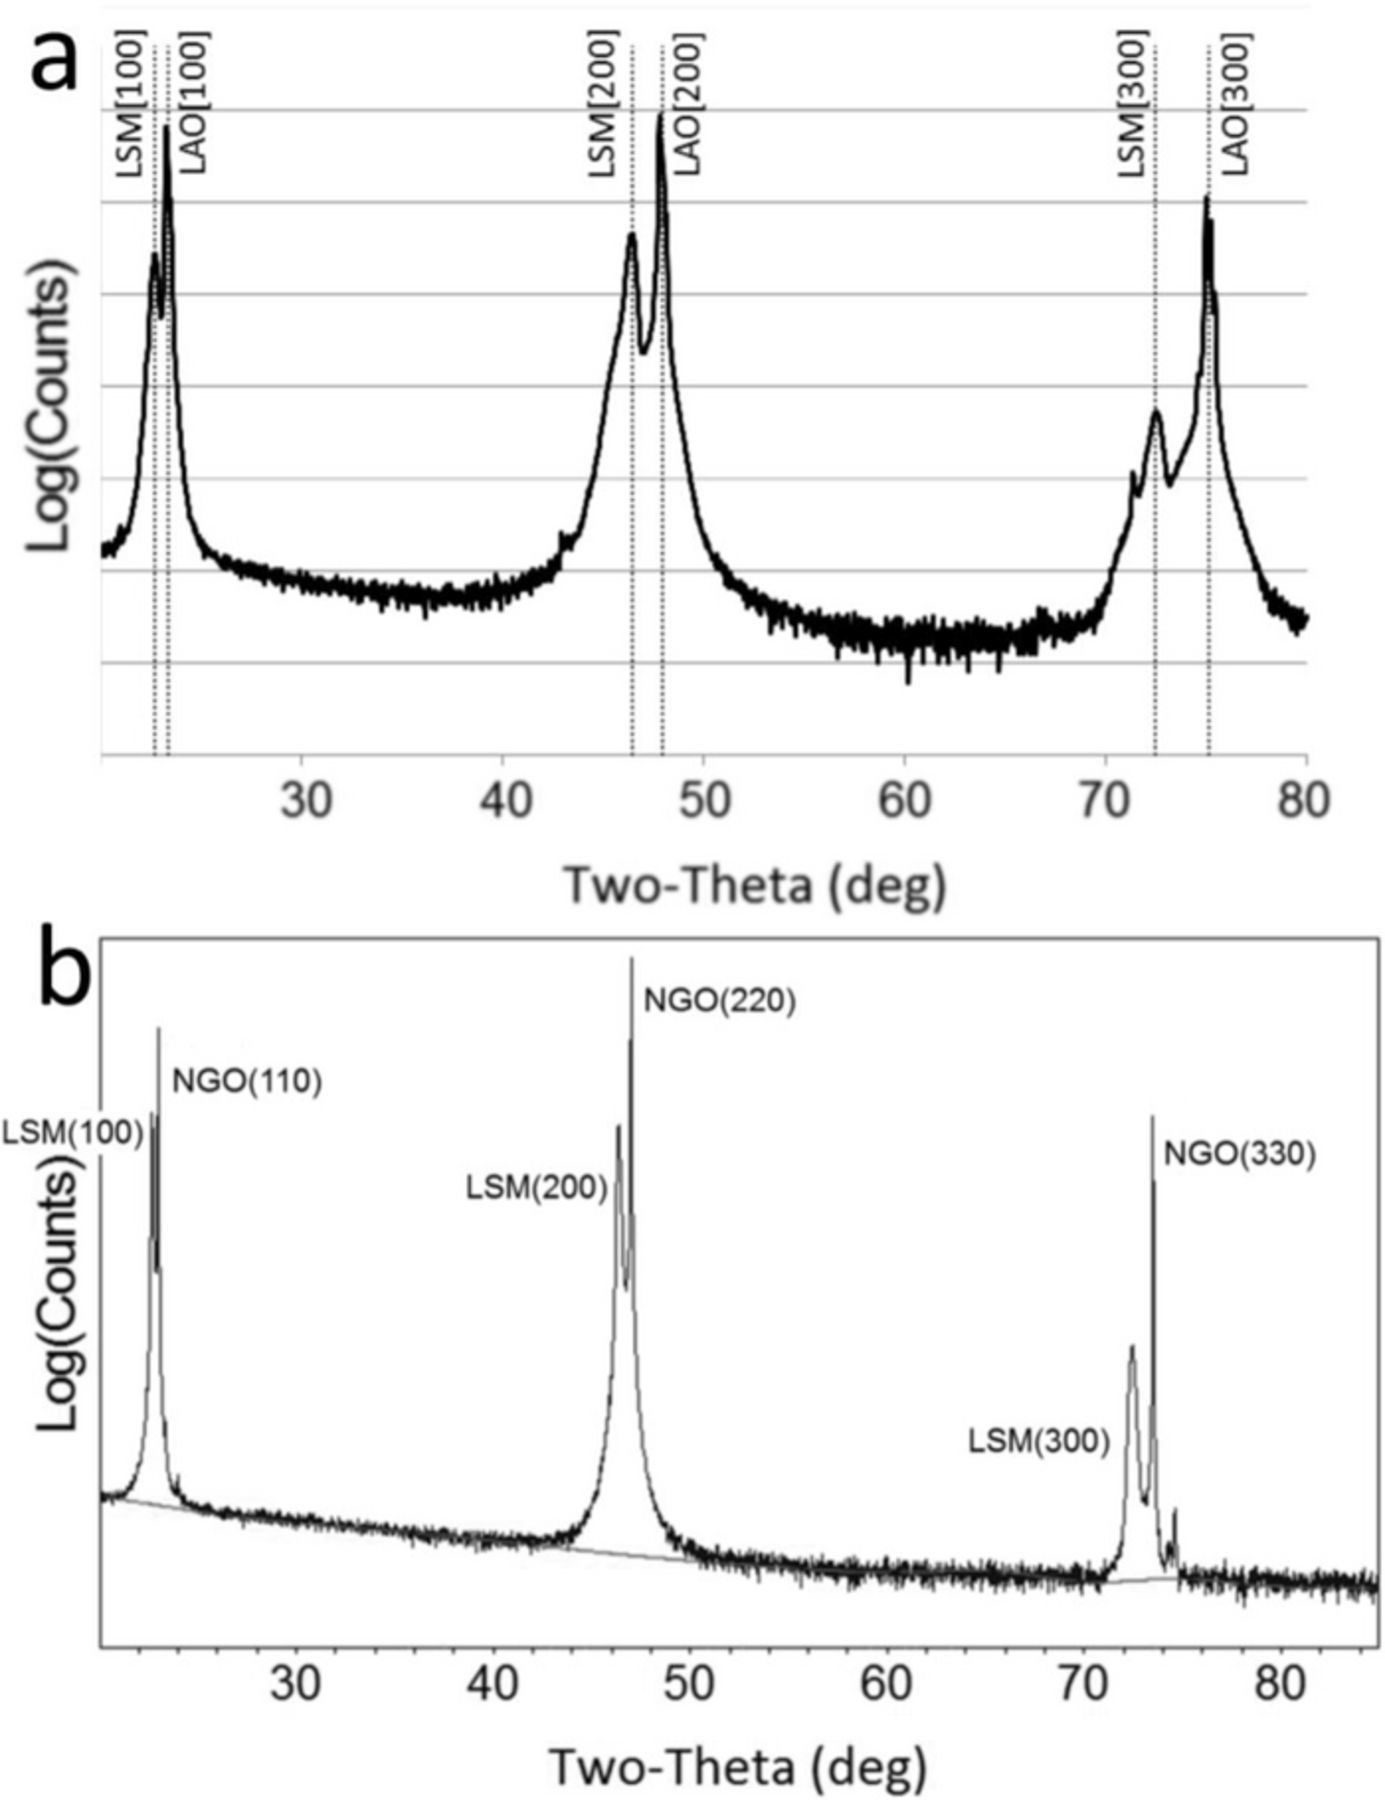
Figure 1. θ–2θ XRD scans of a) LSM-20 on (100)-LAO and b) (110) NGO.
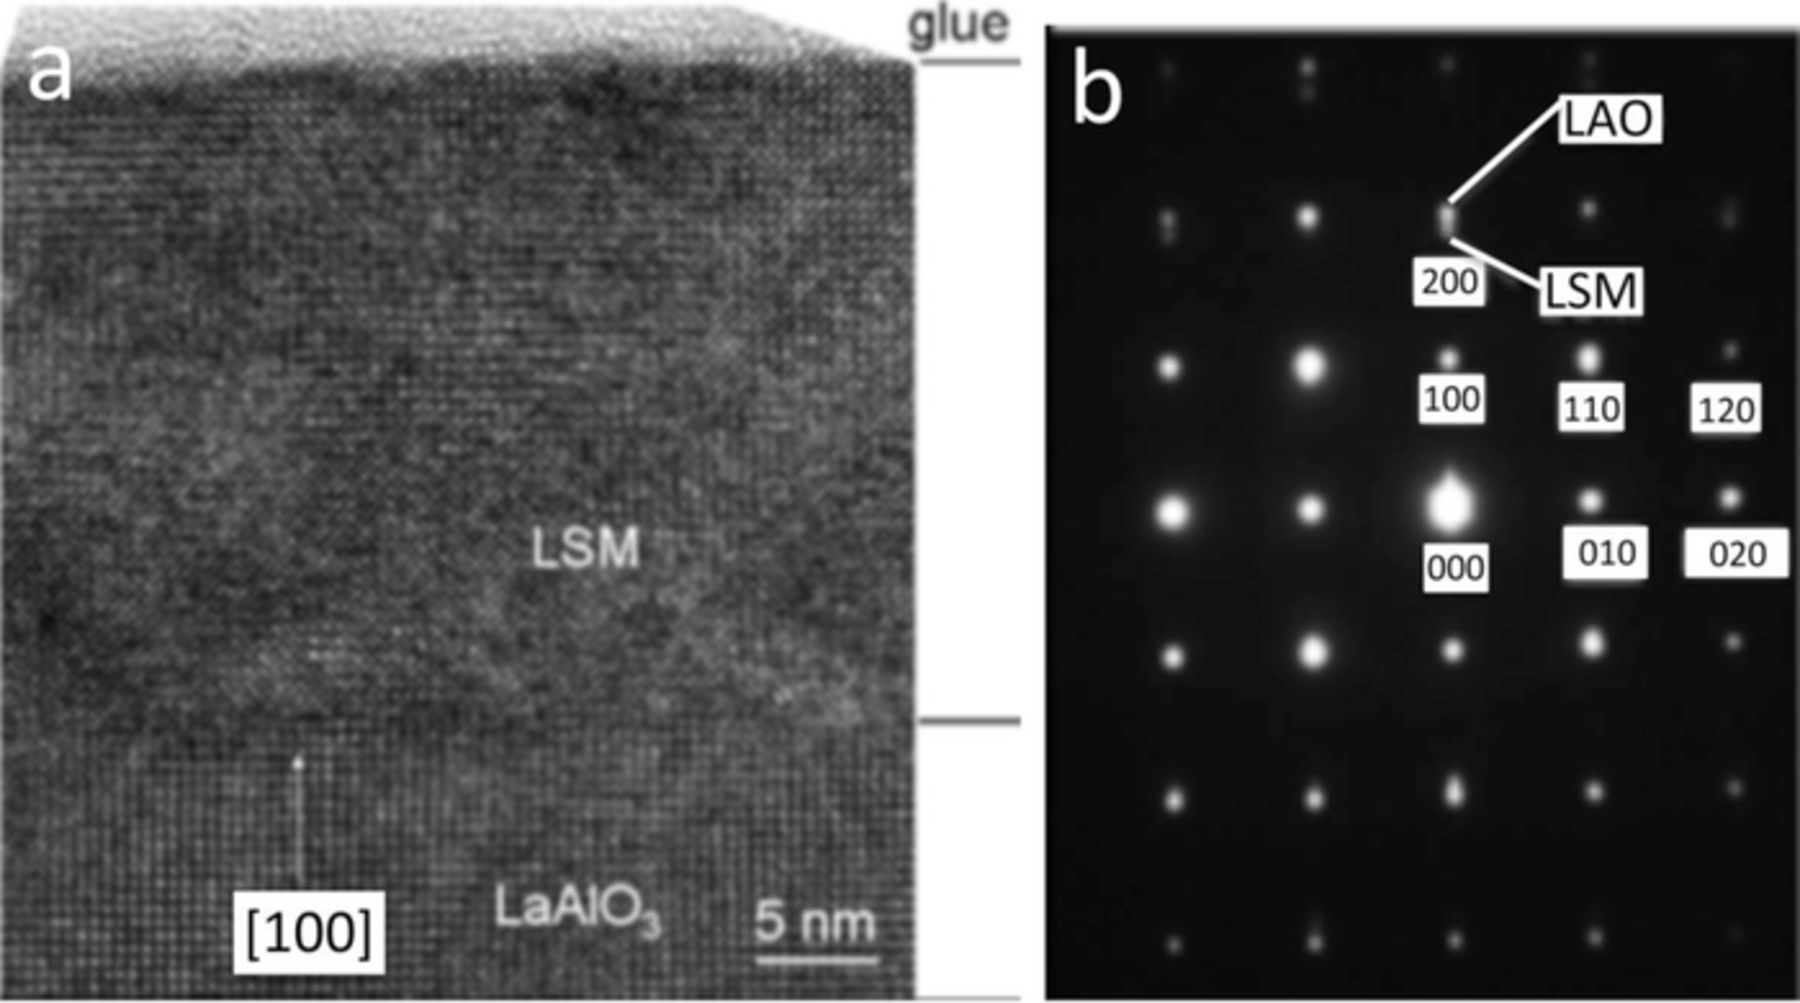
Figure 2. a) HRTEM image of the cross-section of LSM-20 thin film on (100)-LAO. b) SAD pattern of the interface showing the cube-on-cube heteroepitaxy.

Figure 3. Schematic of the lattice match leading to (100)-LSM || (110)-NGO heteroepitaxy (this figure is based on Figure 27 in Ref. 26).
Both as-deposited films exhibited smooth surfaces, with a root mean squared (RMS) surface roughness than 0.3 nm. Both thin films showed no change in surface roughness after a 12 hour anneal in air at 800°C.
Surface analysis
In order to carry out the synchrotron-based surface analysis, a chamber that allows large solid angle access to incoming and outgoing X-rays was designed and assembled. This chamber was capable of heating a sample to 1000°C and operated at pressures from 10−6 torr to atmospheric pressure. Experiments were carried out at beamline X23A2 at Brookhaven National Laboratory using a Vortex four-element silicon drift detector* that has a resolution of approximately 220 eV at 6 keV.27
TXRF is a non-destructive technique that can be used for in-situ measurements of the evolution of the surface composition of the material at temperature. During a TXRF measurement, the incoming photon energy is set to be above the absorption edge energy of any lines that are to be measured. The incident angle of the photon source to the sample surface is then varied from grazing angles to higher values, thereby sampling to increasing depths. The detector collects the fluorescence signals as a function of the incidence angle. At any given incident angle, the energy spectra exhibits peaks corresponding to electronic transitions in the atoms of the sample. The intensity of relevant peaks corresponding to specific elements being profiled is measured using a single channel analyzer (SCA). The ratio of peak intensities as a function of incidence angle allows for composition depth profiling.28–30
Total external reflection of occurs below the critical angle αc, given as:
![Equation ([2])](https://content.cld.iop.org/journals/1945-7111/164/10/F3091/revision1/d0002.gif)
where λ is the wavelength of light, ρ is the electron density and ro is the classical electron radius. Below the critical angle, the X-rays decay as an evanescent wave and will only penetrate the top few nanometers. A typical raw data for a TXRF scan is shown in Figure 4a, where the signal intensity of Sr and La peaks are shown with increasing incidence angles. The critical angle is marked by a dashed line in the figure. The measured intensity I(θ) is proportional to the number of scaterers, N(θ) in the material:
![Equation ([3])](https://content.cld.iop.org/journals/1945-7111/164/10/F3091/revision1/d0003.gif)
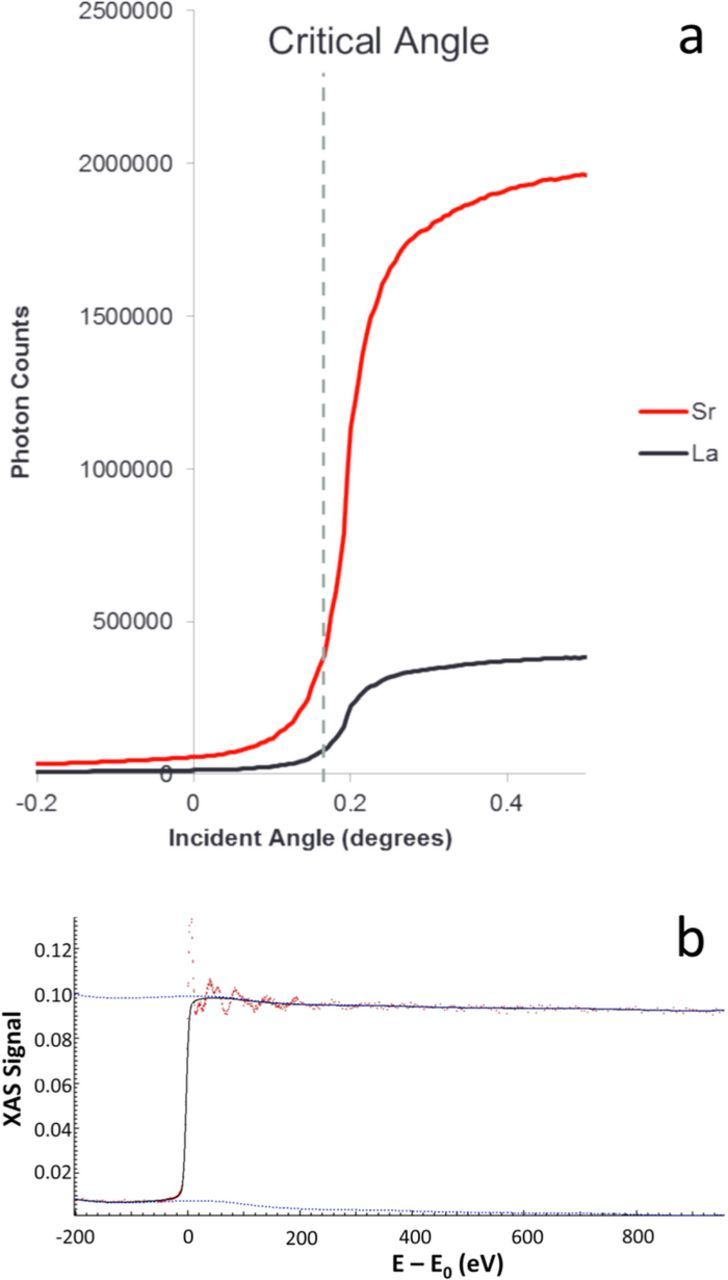
Figure 4. a) Typical TXRF raw data. Below the critical angle only the topmost nanometers are measured. b) Strontium k-edge XAFS spectrum of as-deposited LSM on LAO taken at room temperature.
For strontium and lanthanum:
![Equation ([4])](https://content.cld.iop.org/journals/1945-7111/164/10/F3091/revision1/d0004.gif)
where α and β are not know a-priori. The A-site ratio is:
![Equation ([5])](https://content.cld.iop.org/journals/1945-7111/164/10/F3091/revision1/d0005.gif)
where,  , is a constant which is not known a priori but can be found by the noting that above the critical angle the bulk of the film is probed. The bulk A-site ratio is fixed by the thin film composition and measured directly by RBS. The coefficient CA can then be calculated from:
![Equation ([6])](https://content.cld.iop.org/journals/1945-7111/164/10/F3091/revision1/d0006.gif)
Knowing CA, the A site ratio, RA, can be plotted for all incidence angles.
X-ray absorption fine structure (XAFS) experiments use the tunable energy of the synchrotron source. In an X-ray absorption experiment, Beer's law describes how the photons are absorbed in the sample, and can be expressed as:
![Equation ([7])](https://content.cld.iop.org/journals/1945-7111/164/10/F3091/revision1/d0007.gif)
I0 is the incident intensity, t is the sample thickness, μ is the absorption coefficient, and I is the intensity transmitted through the sample. As the photon energy is increased to be equal to the binding energy of a core-level electron, the absorption is discontinuous. At incident energy above an absorption edge of an element, core electrons can be excited. The empty core electron level is filled with electrons from higher energy levels, and a fluorescent photon exits the atom. By monitoring the fluorescent photons while scanning through the incident energy (Figure 4b shows a typical raw data), the absorption coefficient can be measured as a function of energy as:
![Equation ([8])](https://content.cld.iop.org/journals/1945-7111/164/10/F3091/revision1/d0008.gif)
The exiting photon is sensitive to the local electronic environment of the element.31 The oscillatory structure of the fluorescence signal just above the absorption edge (Fig. 4b) is called the X-ray absorption near edge structure (XANES), and these oscillations have information on the valence states of the element.32 XANES spectra are difficult to analyze fully, and typically involve density functional theory calculations.28 More often, as in this study, qualitative changes in XANES spectra are used to identify changes in valence.
A plot of μ(E) is obtained from the raw data (Fig. 4b) using Equation 8, and is converted into a fine structure, χ(E), defined as:
![Equation ([9])](https://content.cld.iop.org/journals/1945-7111/164/10/F3091/revision1/d0009.gif)
where, μ(E) is the measured absorption coefficient, μ0(E) is a smooth background, and Δμ0(E) is the jump at the threshold energy. Bruce Ravel's software suite based on IFEFFIT programming library33 was used for this analysis. Subtle changes in the fine structure are highlighted by plotting the first derivative of χ(E). XANES studies can be carried out in surface-sensitive or bulk-sensitive mode by choosing the incidence angle to be below and above the critical angle, respectively.
Results and Discussion
Surface segregation
Figure 5 shows the results of the in-situ TXRF experiment on a LSM-20 thin film on LAO, annealed at 800°C in air. The figure shows that scans of samples nominally annealed from 1 to 8 hours (the actual annealing times at the start of the scans are listed in the plot, with each scan lasting for ∼10 minutes) all roughly converge. It is best to read the plots from right to left, with the angles below the critical angle approaching the surface from the bulk. All plots show that the A/B site ratio ((Sr+La)/Mn) decreases toward the surface. It is important to note that this observation of Mn segregation to the surface is in contrast to more widely reported Sr segregation to the surface of LSM with the formation of Sr-rich secondary phases,5,34 which would lead to an increase in the A/B site ratio. Yildiz and coworkers have examined epitaxial thin films if the same composition ((La0.8Sr0.2)0.95MnO3) on yttria stabilized zirconia (YSZ) single crystal substrates and reported Sr segregation with Sr-rich phase formation at the surface.34 It is unclear at this time why our observation of Mn segregation differs from the literature reports. Since stresses play a role in surface segregation in these perovskites,13 it can be speculated that this may be due to a larger tensile stresses in the thin films grown epitaxially on YSZ compared to LAO and NGO, due to the significantly larger lattice mismatch of LSM-20 with YSZ. One explanation could be that since the Sr ion is larger than the Mn ion, it is favored under larger tensile stresses. It is evident that the segregation happens quickly at temperature (within the first hour), and then the segregated composition profile is stable at temperature. It should be mentioned that at very low angles, this A/B site ratios appears to increase again. This is an experimental artifact, since at very low angles, the beam hits the side of the substrate, picking up additional La signal from the LAO.
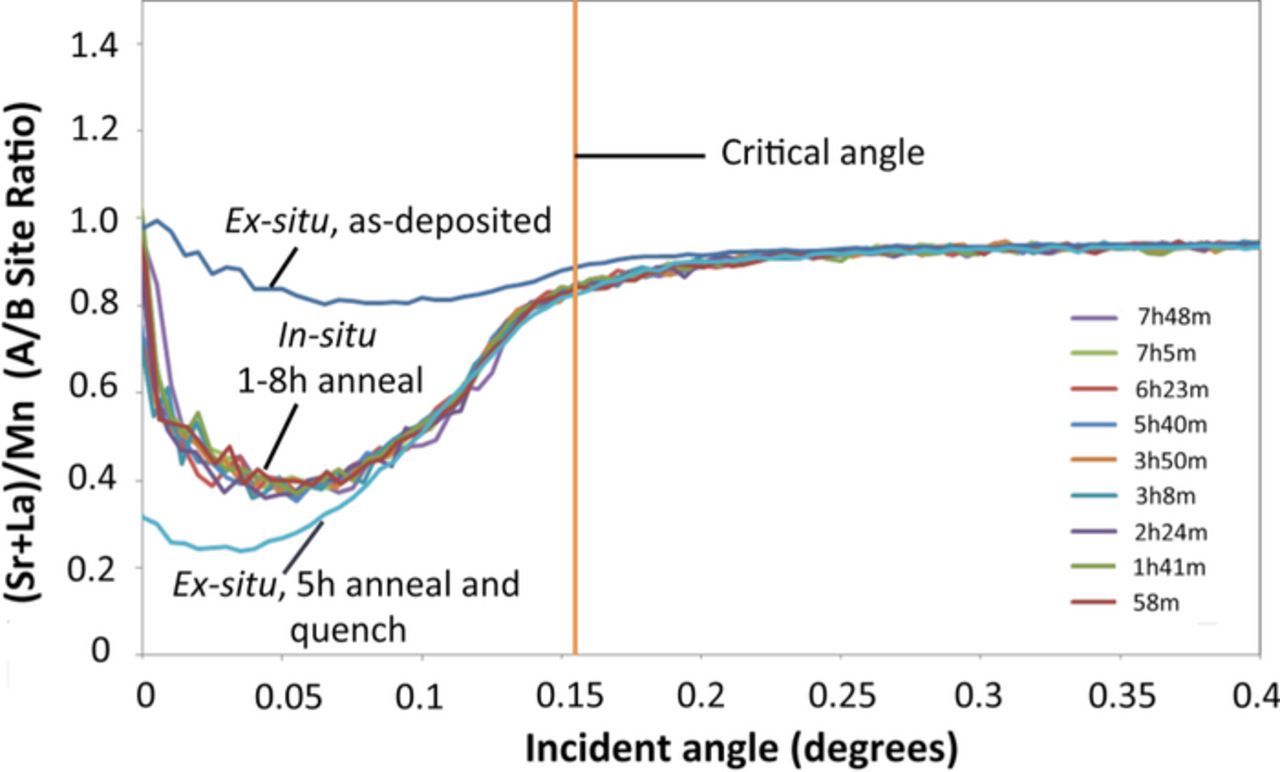
Figure 5. TXRF results for LSM-20 on LAO. In-situ data from samples nominally annealed between 1–8 hours at 800°C in air cluster together. Also shown are two room-temperature (ex-situ) scans of an as-deposited sample, and one that was heated for 5 hours at 800°C in air, and quenched to room temperature. The critical angle is also marked on the plot.
When making in-situ measurements at high temperature, repeating a measurement means the surface can evolve during the scan time. However, repeating a scan is desired for repeatability, and to sum multiple scan together for better counting statistics. This problem is solved if quenching preserves the high temperature state. Then, measurements at room temperature can be made with longer counting statistics. Figure 5 also shows two room temperature (ex-situ) scans. The as-deposited thin film showed minimal surface segregation. In contrast, a sample annealed in a laboratory furnace for 5 hours at 800°C in air, and quenched to room temperature by rapid removal from the furnace showed significant surface reduction in the A/B ratio, consistent with the in-situ measurements. It should be noted that there is good agreement between the in-situ and ex-situ measurements of annealed samples at incidence angles just below the critical angle, which is the most important part of the data. Figure 5 confirms that in LSM-20, annealing at 800°C in air leads to a stable enhancement in the A/B ratio at the surface within an hour, and that quenching the sample to room temperature preserves the surface composition.
To remove interference from the substrate, LSM-20 films on La-free NGO substrates were examined by TXRF. These studies were limited to ex-situ measurements of samples annealed at 800°C in air and cooled to room temperature. Apart from a sample quenched to room temperature by air cooling, another sample was slowly furnace cooled (∼5°C/min) to room temperature to see if the changes at temperature are reversible when the sample reaches back to room temperature. The results are shown in Figure 6. Figure 6a shows a surface enhancement of the A/B ratio in LSM-20 on annealing compared to the as-deposited sample, indicating that this phenomenon is substrate independent. Furthermore, the scans from the quenched and slow cooled samples were mostly identical, indicating that the high temperature changes were irreversible when the sample is cooled. Figure 6b shows plots of Sr/La ratio in these films. The figure shows that this ratio remains at the bulk value all the way to the surface for all three samples. This shows that the increase in the A/B ratio observed is due to Mn segregation to the surface.
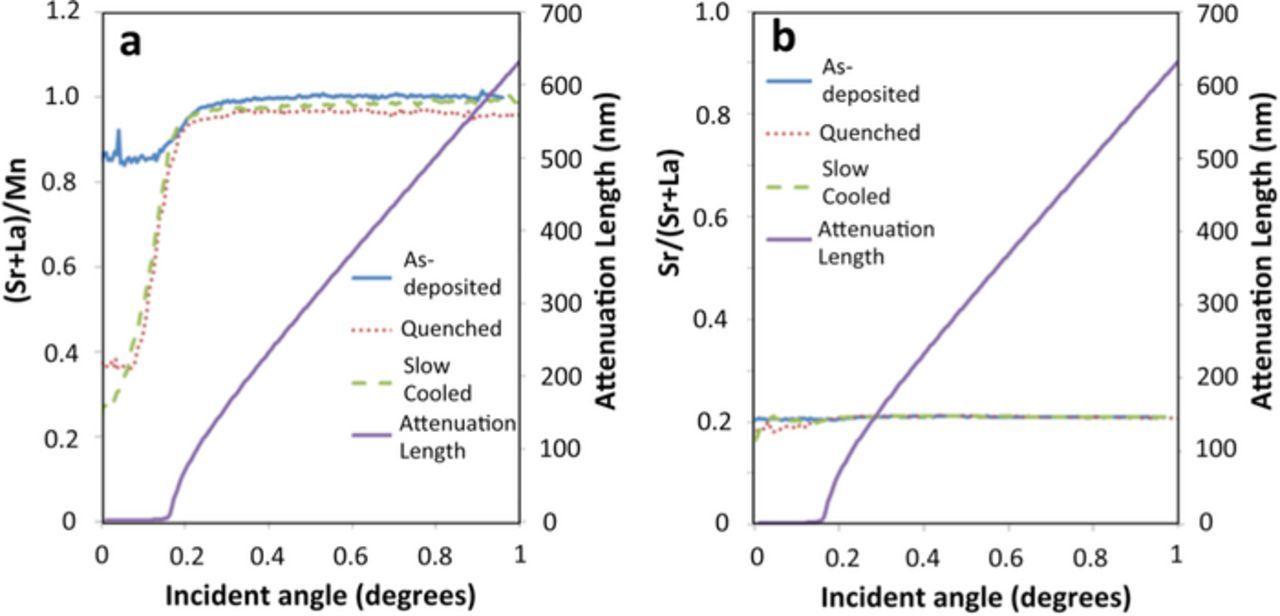
Figure 6. a) TXRF results showing the depth profile of a) the (Sr+La)/Mn (A/B site) ratio and b) the Sr/(Sr+La) (Sr content in A-site) ratio in an as-deposited sample of a LSM-20 thin film on NGO, as well as two other samples that were annealed at 800°C in air for 8 hours and one was quenched and the other was slow cooled to room temperature. Also marked is the attenuation length as a function of incidence angle, which shows a rapid increase in penetration depth above the critical angle.
XANES studies were carried out on LSM-20 thin films on NGO. These included room temperature (ex-situ) studies on as-deposited and quenched (after 8 h anneal at 800°C in air) samples, as well as an in-situ study of a sample heated at 800°C. Since Mn was found to segregate at the surface, data was taken around the Mn K-edge in both surface and bulk sensitive modes, to qualitatively examine the changes in the Mn bonding environment (valence). Figure 7 shows plots of the smoothed first derivative of XANES spectra versus photon energy, allowing easier comparison between samples without washing out the large absorption edge,35 which now shows up as a large peak at around 6550 eV. The figure shows that the shape of this main absorption peak in the surface and bulk signals of the as-deposited samples are very similar, implying that the mixture of oxidation states of Mn (i.e., Mn2+, Mn3+and Mn4+) are similar in the bulk and surface. However, the main absorption peak broadens out in the surface signal at temperature, indicating the mixture of manganese oxidation states have changed on segregation. This broadening remains after cooling back to room temperature, indicating that this redistribution of Mn valence states on Mn surface segregation is irreversible. In contrast, strontium K-edge XANES revealed there were no chemical differences between the bulk and surface strontium and no changes occurred upon annealing and cooling back to room temperature.

Figure 7. Plots of the derivative of surface and bulk Mn K-edge XANES spectra versus photon energy for LSM-20 on NGO.
Defect model
To understand the consequences of surface Mn segregation, the defect model by Poulsen et al. has been used.36 The model assumes that the Mn ions stay on the B-site, no interstitial oxygen exists, and there is no association between defects. The model assumes nine species, which are (in Kröger-Vink notation37): LaxA, Sr'A, and V‴A on the A-site; Mn'B, MnxB,  , (corresponding to Mn ions in the 2+, 3+ and 4+ states, respectively) and V‴B on the B-site; and Ox0, and V..0 on the anion site. The concentration of these nine species can be determined at a given temperature and oxygen partial pressure by nine independent equations listed in Table I. The composition constants x, and y, and the mass action coefficients, KS, Kr, Ki, need to be known quantities. The nominal (bulk) values of x and y are known, while KS, Kr, and Ki were obtained from reported values of mass action coefficients for LSM by Nowotny and Rekas38 and from tracer diffusivity measurements in (La0.8Sr0.2)0.95MnO3, as described elsewhere.39 The values of the mass action coefficients used in these calculations are listed in Table II.
Table I. List of equations relating defects in the model by Poulsen et al.36
| Definition | Defect Equation |
|---|---|
| Electroneutrality |  |
| A-site balance | [LaxA] + [SrA'] + [V‴A] = 1 |
| B-site balance: |  |
| O-site balance | [Ox0] + [V0..] = 3 |
| Cation ratios |  , and , and  |
| Schottky equilibrium | KS = [V..0]3 · [V‴A] · [VB‴] |
| Redox reaction |  |
| Charge disproportionation |  |
Table II. Table of mass action coefficients used in defect model.
| Ks | Kr | Ki |
|---|---|---|
| 2.97 × 10⁻²⁵ | 1.91 × 10⁻⁷ | 2.72 × 10⁻² |
The changes in x and y values due to surface segregation has been measured by TXRF in this study. Figure 6 shows that the A site Sr concentration (x) did not change on annealing, while the A/B site ratio (y) decreases toward the surface. The model has been used to predict the changes in the concentration of point defects as a result of this measured concentration change. Of course, defect models are based on bulk materials, and that the measured equilibrium constants may not be accurate at the surface. Nevertheless, the authors contend that although the values may not be accurate, the trends are, and thus the general conclusions about the trends predicted by the model on the effects of surface Mn segregation on the ORR still hold. Also, the model assumes that the LSM perovskite structure remains as such Mn-deficient values. As mentioned previously, AFM scans showed no changes in the surface morphology after the high temperature anneal. This is in contrast with clear evidence of surface precipitate formation observed during Sr-segregation and Sr-rich phase formation in LSM34 and LSCF thin films.13
Figure 8 shows that the model predicts a change in the distribution of Mn'B (Mn2+), MnxB (Mn3+), and  (Mn4+), as a result of Mn segregation (decrease in y), which is qualitatively consistent with the changes in the XANES data (Fig. 7). As y decreases, the concentration of Mn+4 increases at the expense of Mn3+ Mn2+. Surface Mn4+ sites are more energetically favorable binding sites for oxygen than Mn3+ and Mn2+,40 implying that surface manganese enrichment is beneficial to the surface exchange process. Figure 8 shows that the oxygen vacancy (V..0) concentration also increases significantly with decreasing y. This implies that the near surface bulk diffusivity of oxygen would be significantly enhanced, thereby providing a parallel path of oxygen diffusion to the TPBs. Thus, the defect model predicts that surface segregation of Mn enhances the ORR process by enhancing both the surface exchange process and the oxygen diffusion to the TPBs.
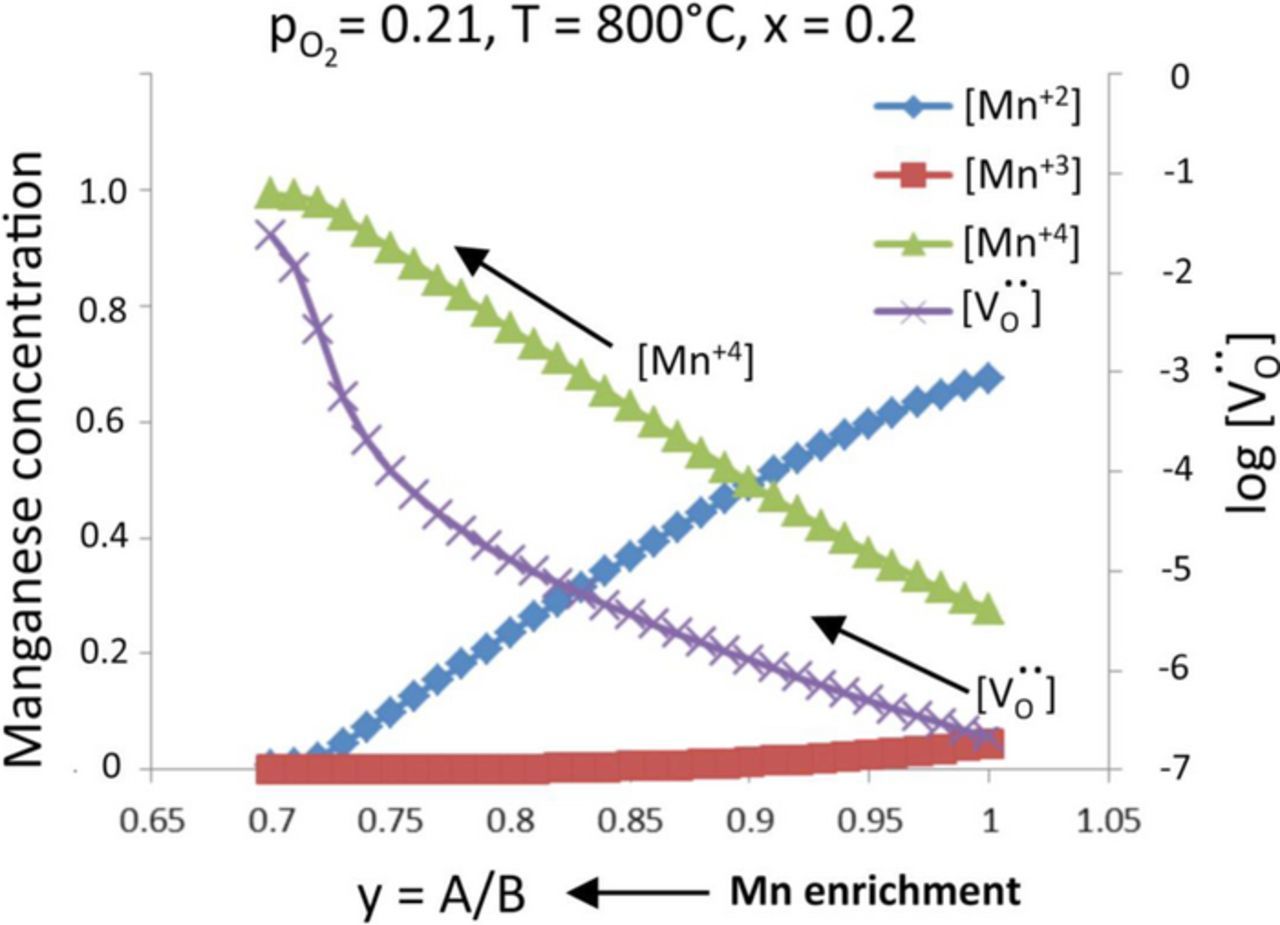
Figure 8. Changes in Mn2+, Mn3+, Mn4+, and oxygen vacancy concentration as a function of A/B site ratio for LSM-20 exposed to air at 800°C, based on a defect model by Poulsen et al.36 Mn enrichment leads to a decrease in the A/B site ratio.
Conclusions
The surface of LSM-20 thin films undergoes changes when they are exposed to conditions relevant to SOFC operation. TXRF studies showed that at 800°C in air, LSM-20 exhibits manganese enrichment at the surface without new phase formation. This segregation occurs at temperature within an hour and the surface composition does not change significantly thereafter. This effect is irreversible, and slow cooling the sample to room temperature does not lead to any further changes. XANES studies qualitatively revealed that the Mn surface enrichment is accompanied by a change in the oxidation state of the Mn at the surface. This was reinforced by a defect model, which suggests that the surface manganese enrichment increases the Mn4+ valence states at the cathode material surface. In addition, the surface Mn enrichment increases the oxygen vacancy concentration at the surface and near surface regions. It is conjectured that Mn surface segregation enhances the ORR process by enhancing both the surface exchange process and the oxygen diffusion to the TPBs.
Acknowledgments
This work has been supported in part through the DOE SECA program under Contract Number DE-NT0004104. Research of one of the authors (KES) was supported in part by the U. S. National Science Foundation under grant no. CHE-1213381. A portion of the research was performed at EMSL, a DOE Office of Science User Facility sponsored by the Office of Biological and Environmental Research and located at Pacific Northwest National Laboratory under Proposal 46707. Use of the National Synchrotron Light Source, Brookhaven National Laboratory, was supported by the U. S. Department of Energy, Office of Science, Office of Basic Energy Sciences. The authors acknowledge the contributions of Barry Karlin at NIST and Dr. Tiffany Casper and Dr. Laxmikant Saraf at PNNL.
Footnotes
- e
The inclusion of company names is for completeness and does not represent an endorsement by the National Institute of Standards and Technology.