Long-standing food and nutrition insecurity in sub-Saharan Africa (SSA) has caused a high burden of communicable, maternal, neonatal and nutritional (CMNN) diseases( Reference Forouzanfar, Alexander and Anderson 1 , Reference Forouzanfar, Afshin and Alexander 2 ) and economic loss( Reference Taniguchi and Wang 3 ). In recent years, however, the unprecedented rising burden of non-communicable diseases (NCD)( Reference Vos, Barber and Bell 4 ) associated with increased metabolic( Reference Kengne, Echouffo-Tcheugui and Sobngwi 5 ) and behavioural risks( Reference Ezzati and Riboli 6 , Reference Negin, Cumming and de Ramirez 7 ) is a major public health concern. Particularly, dietary risk factors and overweight/obesity are the major contributors to the rising burden of NCD in the region( Reference Ezzati and Riboli 6 , Reference Vorster, Kruger and Margetts 8 ). Available data suggest that the consumption of processed foods in SSA( Reference Chan 9 ) and the prevalence of obesity( Reference Prentice 10 ) in the region have increased significantly over the past two decades. Obesity rates( Reference Afshin, Forouzanfar and Reitsma 11 ) have increased while rates of undernutrition, especially stunting among children, have stagnated( Reference Wamani, Åstrøm and Peterson 12 ), hence translating into the double burden of malnutrition, a phenomenon characterized by the coexistence of undernutrition, overweight/obesity and diet-related NCD( 13 ). The majority of intervention efforts in SSA still focus on addressing child and maternal undernutrition (CMU). Investigating the impact of the double burden is imperative to design appropriate interventions.
As part of the Global Burden of Disease (GBD) studies, a recent analysis demonstrated the increasing prevalence of overweight/obesity and related burden of disease at the global level. The study reported that 4 million deaths were attributable to excess body weight worldwide in 2015( Reference Afshin, Forouzanfar and Reitsma 11 ). Another study also found different levels (prevalence and rate) of nutrition-related disorders and diseases (such as low birth weight, stunting, underweight, infant mortality rate, overweight/obesity and NCD mortality) in forty SSA countries( Reference Abrahams, Mchiza and Steyn 14 ). However, these studies did not comprehensively look at the impact of the double burden because they did not include important risk factors and/or did not focus on SSA. In addition, although studies have shown the presence of the double burden of malnutrition (high rates of undernutrition, increasing prevalence of overweight/obesity and diet-related NCD) in SSA( Reference Kosaka and Umezaki 15 – Reference Jones, Acharya and Galway 17 ), the proportion and trend of mortality attributable to this phenomenon have not been investigated at different levels (SSA, SSA sub-regions and countries). One of the challenges in SSA, where the health infrastructure is poor, is the limited epidemiological data that are readily or reliably available( Reference Byass, de Savigny and Lopez 18 ), particularly on overweight/obesity and dietary risk factors of NCD. In the current paper, using the GBD 2015 data( 19 ), we aimed to assess the impact of the double burden of malnutrition, specifically by reporting and comparing estimates and mortality trends associated with CMU, overweight/obesity and dietary risk factors of NCD in SSA between 1990 and 2015. We examined the patterns of attributable mortality by year, sex and age across the SSA sub-regions and countries.
Methods
Study overview
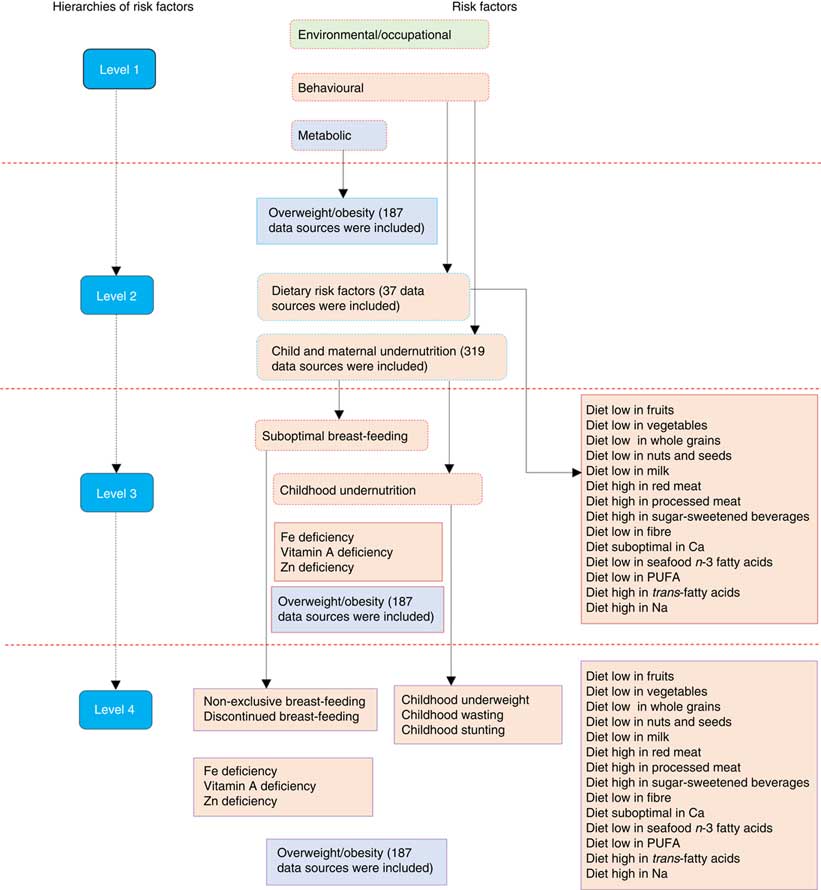
GBD is a large epidemiological study that measures and evaluates health status and its determinants across the global population. It includes assessments of diseases, injuries, sequelae and risk factors. In particular, the 2015 GBD risk factors study covers seventy-nine risk factors of health across seven regions, twenty-one sub-regions and 195 countries( Reference Forouzanfar, Afshin and Alexander 2 ). The study uses a comparative risk assessment approach, which is a causal web and hierarchy of risk factors that enables the quantification of risk factors and their impact on health at different levels( Reference Murray and Lopez 20 ). In the framework, risk factors are organized in four hierarchies. The first hierarchy includes three categories of risk factor clusters: behavioural (including CMU and dietary risks of NCD), environmental/occupational and metabolic (including overweight/obesity). The second (seventeen risk factors) and third (forty-four risk factors) levels contain both granular and cluster risks from within the first level. At the last level (seventy-nine risk factors), granular risk factors are included( Reference Forouzanfar, Afshin and Alexander 2 ). A detailed description of the GBD 2015 risk factors study methods has been published elsewhere( Reference Forouzanfar, Afshin and Alexander 2 , Reference Wang, Naghavi and Allen 21 ).
A summary framework of the risk factors that were included in the current study by each of the hierarchies is depicted in Fig. 1. In the current study, we used the GBD databases( 19 ) to specifically examine the mortality burden attributable to twenty-three behavioural and metabolic risk factors (level 4), which were under CMU and the dietary risks of NCD, including overweight/obesity. The current study focused on SSA which covers five sub-regions (Northern, Eastern, Western, Southern and Central SSA) and fifty-four countries. Assignment of countries in the sub-regions was based on the GBD geographical classifications. We highlight methods specific to the current study in the following sections.

Fig. 1 (colour online) Hierarchies of included risk factors (adapted from the Global Burden of Disease (GBD) 2015 risk factors study( Reference Forouzanfar, Afshin and Alexander 2 )). The figure depicts a summary of child and maternal undernutrition, dietary risk factors of non-communicable diseases and overweight/obesity as risk factors of mortality; more detailed methods can be accessed elsewhere( Reference Forouzanfar, Afshin and Alexander 2 )
Selection of risk factors
Using the World Cancer Research Fund grading system, risk–disease pairs with convincing or probable evidence were included in the GBD 2015 risk factors study( Reference Forouzanfar, Afshin and Alexander 2 , 22 ). CMU included suboptimal breast-feeding (non-exclusive (receiving predominant, partial or no breast-feeding in children younger than 6 months) and discontinued breast-feeding (not able to receive breast milk in children aged 6–23 months)), child undernutrition (childhood stunting, underweight and wasting), and Fe, Zn and vitamin A deficiencies. Dietary risks of NCD comprised fourteen factors, including eight diets (diets low in fruits, vegetables, milk, nuts and seeds, and whole grains; diets high in processed meat, red meat and sugar-sweetened beverages), five nutrients (diets low in seafood n-3 fatty acids, Ca and PUFA; diets high in Na and SFA) and fibre intake (Fig. 1). A BMI of 25·0 kg/m2 or more was considered the cut-off for being at risk of different diseases including cancer, CVD and musculoskeletal disorders( Reference Forouzanfar, Afshin and Alexander 2 ). Specific methods of incidence, prevalence and burden of disease associated with overweight/obesity estimates have been published elsewhere( Reference Afshin, Forouzanfar and Reitsma 11 ). The list, definition and global data representativeness index (calculated by dividing the number of countries with risk factors data by the total number of countries in the world and multiplying by 100) of the risk factors are provided in the online supplementary material, Supplemental Table 1.
Data sources and exposure levels
For each risk factor, the literature was systematically searched to identify studies that could potentially provide exposure levels. In the GBD 2015 risk factors study, a total of 543 data sources were included to determine the exposure levels of CMU (n 319), overweight/obesity (n 187) and dietary risk factors of NCD (n 37) in SSA (Fig. 1). In the online supplementary material, Supplemental Tables 2, 3 and 4, we provide the lists of these data sources. Data sources by sub-regions and countries can also be accessed on the Global Health Data Exchange (http://ghdx.healthdata.org/gbd-2015/data-input-sources).
For CMU, data were mainly obtained from demographic and health surveys, microdata of surveys, reproductive and health surveys, multiple indicator cluster surveys and living standards measurement surveys, scientific literature, FAO food balance sheets, and UNICEF and WHO databases. Data from the National Center for Health Statistics/WHO (the NCHS reference) were also used( Reference Forouzanfar, Afshin and Alexander 2 ).
Multiple data sources, including FAO food balance sheets, household budget surveys, FFQ, and single as well as multiple diet recall surveys were used to estimate exposure levels of dietary risks for NCD. For trans-fatty acids, availability of packaged foods containing partially hydrogenated vegetable oil was used. Data of urinary Na and sugar-sweetened beverages were not adjusted to 8368 kJ/d (2000 kcal/d), unlike other dietary risk factors. For overweight/obesity, data were collated from surveys, longitudinal studies, published literature which provided both measured or self-reported height and weight, and national or sub-national estimates of BMI, overweight and obesity( Reference Forouzanfar, Afshin and Alexander 2 ).
Two modelling strategies were used to estimate the exposure levels for the risk factors: a spatiotemporal Gaussian process regression model (ST-GPR) and a Bayesian meta-regression model (DisMod-MR 2.1). These are mixed-effect models that borrow information across geographic location, age, sex and time. These approaches allow for the pooling of data from different sources and for adjustment of bias. Informative covariates are also able to be incorporated to assist in the predictions for locations in time where there was an absence of data. Adjustments were made including age–sex splitting, adding study-level covariates and bias correction for all risk factors( Reference Forouzanfar, Afshin and Alexander 2 , Reference Vos, Allen and Arora 23 , Reference Ng, Fleming and Robinson 24 ).
ST-GPR is a modelling strategy that helps to estimate magnitude of health problems while using multiple and noisy data and helps to interpolate non-linear trends across time and geography without an assumption that the feature of data follows a definitive functional form. ST-GPR assumes a Gaussian process defined by mean and covariance functions( Reference Ng, Fleming and Robinson 24 , Reference Rasmussen and Williams 25 ). DisMod-MR 2.1 is a computational engine designed to combine data using Bayesian statistical methods. It has a capacity to organize data at each geographic and analytical level. The analysis was performed at five hierarchies: global, super-region, region, country and sub-national (where applicable)( Reference Vos, Allen and Arora 23 , Reference Flaxman, Vos and Murray 26 , Reference Barendregt, van Oortmarssen and Vos 27 ).
For the dietary risks for NCD, first, ST-GPR was applied using the FAO data to model the availability of nutrients and foods. Then, DisMod-MR 2.1 was used to model the intake of each food group and nutrient and to account for study-level covariates (see online supplementary material, Supplemental Table 5). DisMod’s ODE solver was utilized to generate a global age trend based on the diet recall data. This age trend was then applied to the FAO results to produce age-specific estimates of food and nutrient availability. Detailed methods are published elsewhere( Reference Forouzanfar, Afshin and Alexander 2 , Reference Melaku, Temesgen and Deribew 28 ).
Relative risks
Relative risks of risk–disease pairs were obtained from meta-analyses of prospective observational studies or randomized controlled trials. For non-exclusive breast-feeding, a relative risk was determined using the associations with lower respiratory tract infection and diarrhoea. Discontinued breast-feeding was paired with diarrhoea only. The relative risks of wasting, stunting and underweight were adjusted using an algorithm that accounts for covariance between the three undernutrition indicators. Relative risks for Zn deficiency were estimated based on the results of clinical trials. The data sources for the relative risks have been described elsewhere( Reference Forouzanfar, Afshin and Alexander 2 ).
For dietary data, relative risks were obtained from most recent meta-analyses of prospective observational studies, and if available, from randomized controlled trials. Metabolic mediators (BMI, total serum cholesterol, fasting plasma glucose and systolic blood pressure) were considered in the calculation (see online supplementary material, Supplemental Table 5). Due to scarce (inconclusive) evidence, for sugar-sweetened beverages and Na, relative risks were estimated using BMI and systolic blood pressure, respectively. The relative risk of change in BMI for each disease endpoint was obtained from meta-analyses, and if available, pooled analyses of prospective observational studies( Reference Forouzanfar, Afshin and Alexander 2 ).
Attributable mortality and uncertainties
The proportion of mortality that could have been prevented if the exposure level of a risk factor had been sustained at the level associated with the lowest risk was calculated. The level of exposure that is associated with the lowest risk is called the theoretical minimum risk exposure level (TMREL). A 20 % uncertainty range below and above the TMREL was considered as an interval associated with the lowest risk and used in determining the burden of disease attributable to the risk factors (see online supplementary material, Supplemental Table 1).
To determine the mortality attributable to risk factors, first, the population attributable fraction (PAF) was determined using the following inputs: the exposure level for each dietary risk factor (P); the effect size (RR); the TMREL; and the total number of deaths from the specific disease. Joint PAF were calculated for wasting, underweight and stunting assuming independency. Additional details on methods of estimation can be found elsewhere( Reference Forouzanfar, Afshin and Alexander 2 ).
The PAF was given as( Reference Forouzanfar, Afshin and Alexander 2 )
 $$PAF_{{joasgt}} {\equals}{{\int _{x{\equals}l}^u RR_{{joast}} \left( x \right)P_{{jasgt}} (x)\rm{d}\it{x}{\minus}RR_{{joasg}} (TMREL_{{jas}} )} \over {\int _{x{\equals}l}^u RR_{{joasg}} \left( x \right)P_{{jasgt}} (x)\rm{d}\it{x}}}$$
for continuous risk factors, or as
 $$PAF_{{joasgt}} {\equals}{{{\rm }\sum_{x{\equals}l}^u RR_{{joast}} \left( x \right)P_{{jasgt}} (x){\minus}RR_{{joasg}} (TMREL_{{jas}} )} \over {\sum_{x{\equals}l}^u RR_{{joas}} \left( x \right)P_{{jasgt}} (x)}}$$
for dichotomous or polychotomous risk factors, where:
PAF joasgt is a population attributable fraction for a risk factor j, attributed to cause o for age group a, sex s, geography g and year t;
RR joasg (x) is the relative risk as a function of exposure level x for a risk factor j, attributed to cause o, age group a, sex s and geography g, with the lowest level of observed exposure being l and the highest being u;
P jasgt (x) is the distribution of exposure at x for age group a, sex s, geography g and year t; and
TMREL jas is the TMREL for risk factor j, age group a and sex s.
Then, the total attributable mortality was determined using the number of deaths and PAF( Reference Forouzanfar, Afshin and Alexander 2 ), with the GBD 2015 mortality study used to obtain the number of deaths( Reference Forouzanfar, Afshin and Alexander 2 , Reference Wang, Naghavi and Allen 21 ):
 $$Total \ {\rm }attributable \ {\rm }burden_{{jasgt}} {\equals}\mathop \sum\limits_{o{\equals}1}^w Burden_{{joasgt}} \ PAF_{{joasgt}} $$
The overall proportion of disease burden attributable to aggregated dietary risk factors and CMU was computed using the following formula( Reference Forouzanfar, Afshin and Alexander 2 ):
 $$PAF_{{joasgt}} {\equals}1{\minus}\mathop \prod\limits_{k{\equals}1}^K \left[ {1{\minus}PAF_{{joasgt}} \mathop \prod\limits_{k{\equals}1}^K (1{\minus}MF_{{jio}} )} \right]$$
where:
K is a set of risk factors for the aggregation;
PAF joasgt is PAF for risk j for age group a, sex s, geography g and year t; and
MF jio is the mediation factor for risk j mediated through i for cause o.
Using the Monte Carlo approach( Reference Rubinstein and Kroese 29 ), the uncertainty of parameters for exposure, relative risk and attributable mortality was calculated with 1000 repeated draws. Uncertainty intervals (95 % UI) for the estimates were reported( Reference Forouzanfar, Afshin and Alexander 2 ).
Results
Mortality related to child and maternal undernutrition, dietary risk factors and overweight/obesity in 2015
Table 1 provides the estimated number, crude rates and proportions of mortality accounted for by CMU, diet and overweight/obesity in SSA and its sub-regions in 2015. Deaths attributable to CMU totalled 826204 (95 % UI 737346, 923789) or 10·3 % (95 % UI 9·1, 11·6 %) of all deaths in SSA. The proportion of mortality caused by CMNN diseases attributable to CMU was 17·7 % (95 % UI 15·7, 19·9 %). Except for Southern SSA where dietary factors of NCD contributed the highest number of deaths, in all other sub-regions CMU was responsible for the highest number of deaths. Overweight/obesity and dietary risk factors accounted for 266768 (95 % UI 189051, 353096) or 3·3 % (95 % UI 2·4, 4·4 %) and 558578 (95 % UI 453433, 680197) or 7·0 % (95 % UI 5·8, 8·3 %) of all-cause mortality, respectively. The relative contribution to NCD mortality attributable to overweight/obesity and dietary risk factors was 9·8 % (95 % UI 7·0, 12·8 %) and 20·5 % (95 % UI 17·3, 24·3 %), respectively. The age-standardized proportion of all-cause mortality attributable to CMU was higher in Western SSA compared with other sub-regions.
Table 1 The mortality associated with child and maternal undernutrition (CMU), overweight/obesity and dietary risks of non-communicable diseases (NCD) in sub-Saharan Africa by sex and sub-region, 2015
UI, uncertainty interval; CMNND, communicable, maternal, neonatal and nutritional diseases.
† Proportions are for all causes of death.
‡ Proportions are for specific categories of diseases (i.e. CMNND accounting for CMU; NCD accounting for dietary risks and overweight/obesity).
In 2015, the age-standardized proportion of all-cause mortality was significantly higher for dietary risks of NCD compared with overweight/obesity and CMU. Overall, the age-standardized proportion of deaths attributable to CMU, overweight/obesity and dietary risks was 12·2 % (95 % UI 10·2, 14·7 %), 3·8 % (95 % UI 3·4, 4·3 %) and 5·3 % (95 % UI 3·8, 7·0 %), respectively (Table 2). The highest age-standardized proportion of deaths attributable to CMU was found in Chad (7·8 %; 95 % UI 4·8, 11·8 %). On the other hand, the highest age-standardized proportion of deaths attributable to overweight/obesity and dietary risks of NCD was found in South Africa (11·6 %; 95 % UI 9·4, 13·7 %) and Cameroon (17·8 %; 95 % UI 15·0, 21·2 %), respectively. Botswana (0·7 %; 95 % UI 0·3, 1·4 %), Burundi (1·5 %; 95 % UI 0·6, 2·7 %) and Guinea-Bissau (6·7 %; 95 % UI 5·6, 7·9 %) had the lowest age-standardized proportion of mortality attributable to CMU, overweight/obesity and dietary risks of NCD, respectively (see online supplementary material, Supplemental Tables 6, 7 and 8).
Table 2 The burden of mortality associated with child and maternal undernutrition (CMU), overweight/obesity and dietary risks of non-communicable diseases (NCD) in sub-Saharan Africa between 1990 and 2015

UI, uncertainty interval; CMNND, communicable, maternal, neonatal and nutritional diseases.
* Significantly increased or decreased based on 95 % UI.
† Proportions are for all causes of death.
‡ Proportions are for specific category of diseases (i.e. CMNND accounting for CMU; NCD accounting for dietary risks and high- overweight/obesity).
The number, rate and proportion of deaths attributable to CMU, overweight/obesity and dietary risks of NCD by age are shown in Fig. 2 and the online supplementary material, Supplemental Fig. 1.
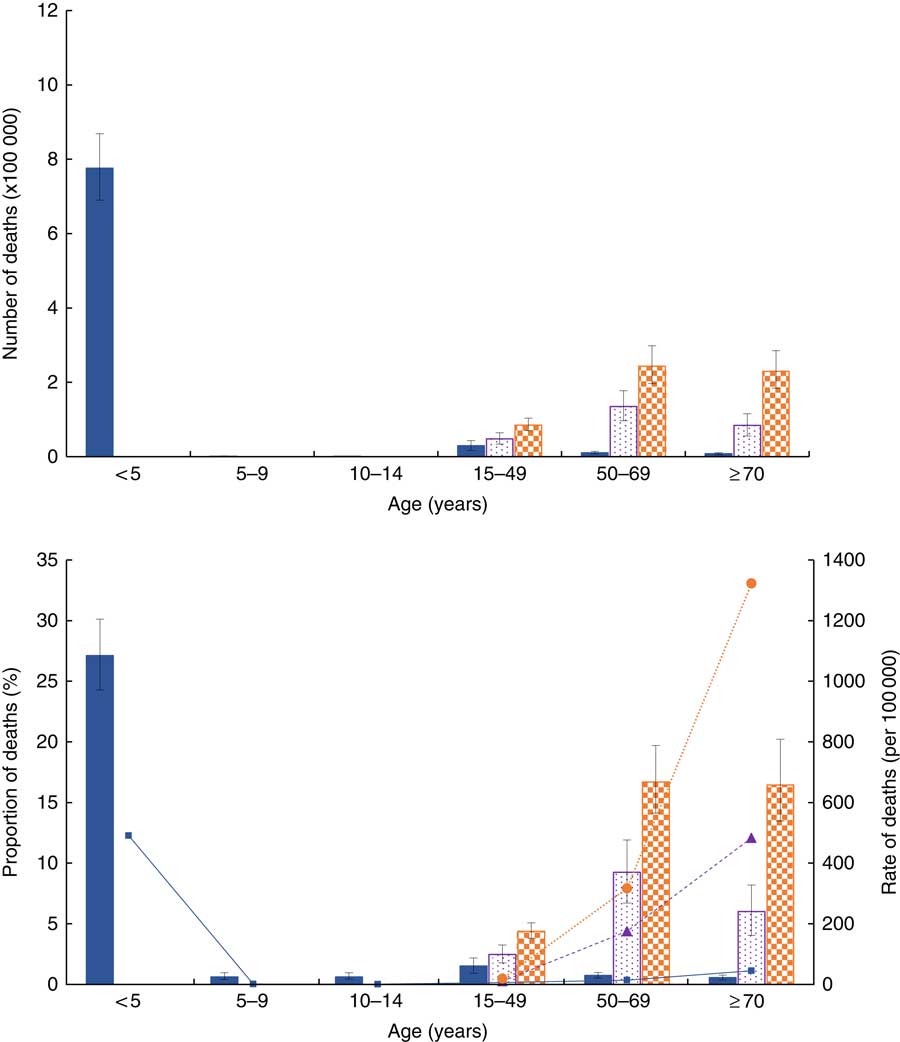
Fig. 2 (colour online) Number, proportion (of all-cause) and rate of deaths associated with child and maternal undernutrition (CMU), overweight/obesity and dietary risks of non-communicable diseases (NCD) in sub-Saharan Africa by age in 2015:
![]() , CMU number/proportion;
, CMU number/proportion;
![]() , CMU rate;
, CMU rate;
![]() , overweight/obesity number/proportion;
, overweight/obesity number/proportion;
![]() , overweight/obesity rate;
, overweight/obesity rate;
![]() , dietary risks of NCD number/proportion;
, dietary risks of NCD number/proportion;
![]() , dietary risks of NCD rate. Numbers and proportions are mean values with their 95 % uncertainty intervals represented by vertical bars
, dietary risks of NCD rate. Numbers and proportions are mean values with their 95 % uncertainty intervals represented by vertical bars
Childhood wasting and underweight were the most common CMU risks, accounting for 8·5 and 3·0 % of all deaths, respectively. Diets low in fruits (2·2 %), whole grains (1·7 %), vegetables (1·5 %), nuts and seeds (1·3 %) and high in Na (1·3 %) were found to be the most common dietary risk factors (Table 3).
Table 3 The number, rate, proportion and percentage change of deaths associated with child and maternal undernutrition (CMU), dietary risks of non-communicable diseases (NCD)and overweight/obesity in sub-Saharan Africa between 1990 and 2015

UI, uncertainty interval; CMNND, communicable, maternal, neonatal and nutritional diseases.
The sum of numbers, rates and percentages in rows exceeds the total because of overlap between various risk factors. 0 % represents very low proportion.
Bold font indicates level 2 or level 3 categories of the risk factors.
* Significantly increased or decreased based on 95 % UI.
† Proportions are for all causes of death.
‡ Proportions are for specific category of diseases (i.e. CMNND accounting for CMU; NCD accounting for dietary risks and overweight/obesity).
Trend of mortality attributable to child and maternal undernutrition, dietary risk factors and overweight/obesity between 1990 and 2015
Table 3 depicts the trends of mortality attributable to CMU, overweight/obesity and dietary risks of NCD in SSA and sub-regions. The number of deaths attributable to CMU decreased substantially by 44·6 % in the past 25 years, falling from 1·49 million (1490671; 95 % UI 1305548, 1667532) in 1990 to 0·83 million (826204; 95 % UI 737346, 923789) in 2015. In contrast, deaths attributable to overweight/obesity and dietary risks of NCD increased by 143·8 and 73·0 %, rising from 109407 (95 % UI 71767, 152893) in 1990 to 266768 (95 % UI 189051, 353096) in 2015 and from 322932 (95 % UI 271234, 387047) to 558578 (95 % UI 453433, 680197), respectively. Similar patterns were identified at sub-regional level. The age-standardized proportion of deaths related to by CMU decreased by 55·3 %, falling from 8·5 % (95 % UI 7·4, 9·5 %) in 1990 to 3·8 % (95 % UI 3·4, 4·3 %) in 2015. On the other hand, the age-standardized proportion of deaths attributable to overweight/obesity and dietary risks of NCD rose by 63·3 and 17·2 %, rising from 3·2 % (95 % UI 2·1, 4·6 %) and 10·4 % (95 % UI 8·7, 12·6 %) in 1990 to 5·3 % (95 % UI 3·8, 7·0 %) and 12·2 % (95 % UI 10·2, 14·7 %) in 2015, respectively. However, in the Southern SSA sub-region, the proportion of deaths attributable to overweight/obesity decreased by 10·3 %, falling from 14·9 % (95 % UI 12·6, 17·9 %) to 13·4 % (95 % UI 11·3, 15·9 %). The attributable mortality trend across the past 25 years is shown in Fig. 3 and the online supplementary material, Supplemental Fig. 2.
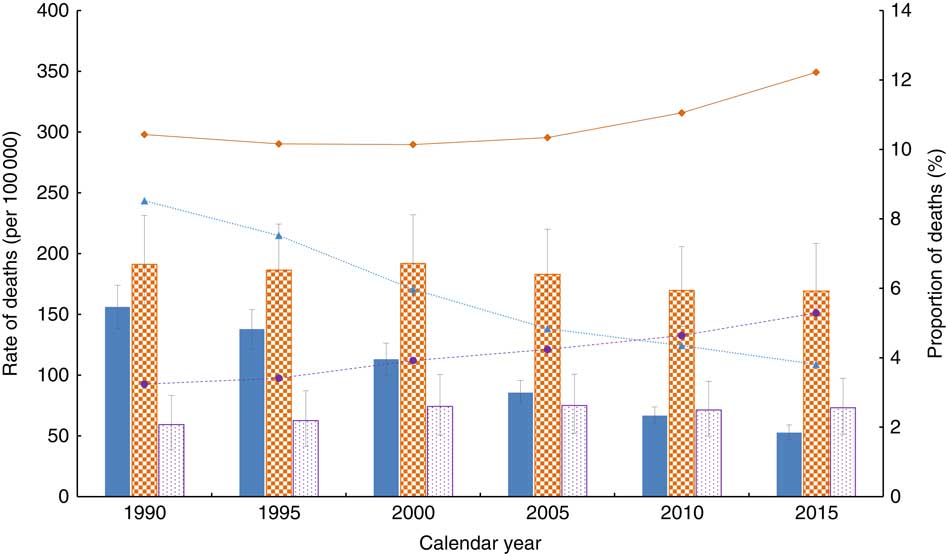
Fig. 3 (colour online) Age-standardized rate and proportion of deaths (all-cause) associated with child and maternal undernutrition (CMU), overweight/obesity and dietary risks of non-communicable diseases (NCD) in sub-Saharan countries between 1990 and 2015:
![]() , CMU rate;
, CMU rate;
![]() , CMU proportion;
, CMU proportion;
![]() , overweight/obesity rate;
, overweight/obesity rate;
![]() , overweight/obesity proportion;
, overweight/obesity proportion;
![]() , dietary risks of NCD rate;
, dietary risks of NCD rate;
![]() , dietary risks of NCD proportion. Rates are mean values with their 95 % uncertainty intervals represented by vertical bars
, dietary risks of NCD proportion. Rates are mean values with their 95 % uncertainty intervals represented by vertical bars
Countries and sub-regions show different levels of increase or decrease in mortality attributable to each of the risk factors. The age-standardized proportion of deaths attributable to CMU fell by more than half in most of the countries. The highest reduction (~80 % or above) was found in Botswana, South Africa and Cape Verde. The age-standardized proportion of deaths attributable to overweight/obesity rose in all SSA sub-regions. The highest increase (140·7 %) was recorded in Western SSA, rising from 2·1 % (95 % UI 1·1, 3·3 %) in 1990 to 5·0 % (95 % UI 3·5, 6·7 %) in 2015. Countries like Burkina Faso (377·2 %), Liberia (270·8 %) and Chad (254·4 %) recorded the highest increases in the age-standardized proportion of deaths attributable to overweight/obesity in the last 25 years. Except for all the Southern SSA countries, Burundi and Comoros (Eastern SSA counties), all other nations recorded increases in diet-related deaths. Burkina Faso (64·7 %) and Liberia (48·7 %) had the highest increase in the age-standardized proportion of deaths attributable to dietary risks of NCD (Table 2 and online supplementary material, Supplemental Tables 6, 7 and 8).
SSA achieved a significant reduction in the age-standardized proportion of deaths related to childhood undernutrition, discontinued breast-feeding and vitamin A deficiency. On the other hand, an increase of the proportion of deaths related to all components of dietary risks of NCD was recorded (Table 3).
The age-standardized proportion of deaths caused by CMNN diseases related to CMU fell significantly in all sub-regions of SSA. On the other hand, the proportion of NCD deaths attributable to dietary risk factors and overweight/obesity either increased or remained relatively stable (Table 2).
Discussion
In the present study we found that the mortality burden attributable to CMU, overweight/obesity and dietary risks of NCD in SSA is high, indicating that the burden of diseases in the region is related to complex behavioural and metabolic risk factors. The relative contribution of dietary risks of NCD to all-cause deaths was significantly higher compared with overweight/obesity and CMU. Deaths attributable to CMU have decreased significantly in the past 25 years and similar patterns were found at sub-regional level. Each of the SSA countries has shown different levels of increase or decrease in mortality attributable to the CMU, overweight/obesity and dietary risk factors of NCD. To the best our knowledge, our study is the first of its kind to investigate the number (proportion) and trend of mortality attributable to a double burden of malnutrition (i.e. mortality attributable to CMU (eight risk factors), overweight/obesity and dietary risks of NCD (fourteen risk factors)) in the SSA, SSA sub-regions and countries. In addition, our results provide additional insights by strengthening the body of evidence on the existence of a double burden of nutrition-related diseases, which has not been given full attention by stakeholders. The findings could inform and highlight to governments and stakeholders in SSA countries the need to design and implement appropriate interventions to tackle this unprecedented phenomenon.
The paradox
Our findings show the coexistence of a significant burden of mortality attributable to CMU, overweight/obesity and dietary risk factors in SSA. In 2015, CMU and dietary risks of NCD were the second (behind unsafe sex) and third most important behavioural risk factors for mortality( 30 ). Overweight/obesity was also the second most important metabolic risk of mortality in SSA (behind systolic blood pressure)( Reference Forouzanfar, Afshin and Alexander 2 , 30 ). In line with our findings, studies highlighted that the burden of NCD attributable to dietary risks is substantially high in addition to the already existing burden of undernutrition( Reference Vorster, Kruger and Margetts 8 ). Furthermore, evidence also shows that the prevalence of obesity in Africa is high and increasing( Reference Kengne, Echouffo-Tcheugui and Sobngwi 5 , Reference Afshin, Forouzanfar and Reitsma 11 ). The coexistence of a high burden of both under- and overnutrition in SSA is also reflected at country level. For instance, in rural Nigeria, the prevalence of overweight (BMI=0–29·9 kg/m2)/obesity (BMI≥30·0 kg/m2) in adults and elderly people and of underweight (weight-for-age Z-score<−2) in school-aged children was found to be 30·0( Reference Ejim, Okafor and Emehel 31 ) and 70·5 %( Reference Oninla, Owa and Onayade 32 ), respectively. Zeba et al.( Reference Zeba, Delisle and Renier 33 ) reported that 23·5 % of adults in Burkina Faso had at least one CVD risk factor and one nutritional deficiency. In addition to socio-economic and technological developments, urbanization( Reference Delisle, Ntandou-Bouzitou and Agueh 34 ) and an increase in per capita income( Reference Popkin 35 ), the minimal policy responses to the growing burden of NCD could explain the high burden of diet-related diseases in SSA( Reference Lachat, Otchere and Roberfroid 36 ). Increases in agricultural production and changes in trade policies (by increasing the availability and accessibility of processed foods) were also found to be drivers of the problem( Reference Hawkes 37 ). Given the multifaceted factors of nutrition-related burden of diseases in SSA, multisectoral collaboration at the macro and micro levels is a key to addressing the problem effectively.
Another important finding of the present study is the paradoxical trend in mortality attributable to CMU, overweight/obesity and dietary risks of NCD over the past 25 years. The mortality related to overweight/obesity and dietary risks of NCD has increased significantly, despite the deaths attributable to CMU still remaining substantially high. This finding mirrors studies that have shown the substantial contribution of both infectious diseases and NCD to the current burden in SSA – highlighting the non-classical epidemiological transition( Reference Agyei-Mensah and de-Graft Aikins 38 ). The burden of CMNN diseases has also persisted despite the emerging burden of NCD( Reference Murray, Barber and Foreman 39 ). In line with other studies( Reference Vorster, Kruger and Margetts 8 ), our findings suggest that SSA is undergoing a nutrition transition. However, the coexistence of a significant burden of disease associated with both over- and undernutrition shows that the transition is atypical( Reference Vorster, Kruger and Margetts 8 ). Many hypotheses have been postulated to explain this pattern. A study by Popkin and Gordon-Larsen( Reference Popkin and Gordon-Larsen 40 ) explained that such a change is associated with a faster increase of diet- and obesity-related NCD compared with the socio-economic developments that SSA countries have achieved.
From the epigenetic point of view, studies also indicate that those who have exposure to diets with low energy and poor micronutrient contents in their early life are more likely to develop chronic diseases when they are challenged with high-energy foods and a sedentary life( Reference Schwarz, Towers and van der Merwe 41 – Reference Victora, Adair and Fall 43 ), resulting in an ‘NCD epidemic’. Evidence shows that this could happen as a result of genetic susceptibility to NCD via fetal programming( Reference Canani, Di Costanzo and Leone 44 , Reference Waterland and Jirtle 45 ) and thrifty growth( Reference Lelijveld, Seal and Wells 46 , Reference Dulloo, Jacquet and Seydoux 47 ).
Global development agendas and initiatives have also impacted the current trend. For instance, the World Food Summit and the Millennium Development Goals largely ignored NCD and their risk factors. However, NCD were identified as a major health challenge for the Sustainable Development Goals, which have the objective of reducing premature mortality due to NCD by one-third( 48 ). As a result, countries should identify effective policy options and responses to prevent and control the increasing burden of NCD and the risk factors in SSA( Reference Renzaho 49 ). In this regard, despite the fact that a number of SSA countries have already formulated NCD policy frameworks, existing challenges, including limited implementation capacity, competing public health problems and the lack of effective and feasible means to integrate policies into the existing health-care system, have precluded the translation of these frameworks into practice( Reference Temu, Leonhardt and Carter 50 ). The governments of SSA countries should recognize the importance of reorienting public health strategies and health-care services to provide the ability to address both child and maternal health problems and NCD.
Dietary risks of non-communicable diseases
Mortality either increased or remained the same for specific components of dietary risks of NCD over the past 25 years. Diets low in fruit, vegetables, whole grains, seeds and nuts, and high in Na were the most important dietary risk factors. In SSA and low-income countries, consumption of fruits and vegetables is very low( 51 , Reference Miller, Yusuf and Chow 52 ). In Ethiopia, Mozambique and South Africa, for instance, consumption of the recommended level of fruit and vegetables was reported to be very minimal( Reference Demissie, Ali and Zerfu 53 – Reference Padrão, Laszczyńska and Silva-Matos 55 ). It is also found that 3·2 % of total deaths in South Africa are associated with low intake of fruits and vegetables( Reference Schneider, Norman and Steyn 56 ). In low-income countries, low consumption of fruits and vegetables is highly correlated with affordability( Reference Miller, Yusuf and Chow 52 ). In addition, a recent analysis of the Global Dietary Database showed that consumption of whole grains, nuts and seeds in SSA has decreased in the past two decades( 51 ). Na intake was also found to be high in some of the SSA countries. For instance, 81·0 % of the adult population in SSA consumes more than the WHO recommendation level (2 g/d)( Reference Oyebode, Oti and Chen 57 ).
Recognizing malnutrition as a major global health, economic and sustainable development challenge, the UN aims to improve overall nutrition through the Decade of Action on Nutrition (2016–2025)( 58 ). This programme addresses all forms of malnutrition, from stunting, wasting and micronutrient deficiencies to overweight, obesity and nutrition-related NCD. The programme gives a unique opportunity for SSA countries and stakeholders to scale up their interventions against the double burden of malnutrition. As part of these interventions, actions to increase knowledge and awareness of communities on diet and nutrition should be supported. Effective strategies to promote healthy dietary habits should be designed using the experiences of other countries( Reference Millett, Laverty and Stylianou 59 ). Promoting nutrition-sensitive agriculture and value chain supply should be part of the strategies. Improving access to and use of appropriate information and communication technologies could also help in disseminating messages related to dietary behaviour and body weight, as well as in monitoring the effectiveness of interventions( Reference Afshin, Babalola and McLean 60 , Reference Kerr, Harray and Pollard 61 ). Evidence also shows that electronic and mobile health (e- & mHealth) interventions are effective in promoting healthy diet-related behaviours in developing countries( Reference Müller, Alley and Schoeppe 62 ).
Regional variation
The burden levels of CMU, overweight/obesity and dietary risk factors vary across sub-regions and countries. The highest age-standardized proportion of deaths attributable to CMU was found in Chad. In 2012, UNICEF reported that the proportion of children with acute malnutrition (wasting) in Chad was significantly higher than the WHO’s emergency threshold (15 %)( 63 ). On the other hand, the highest age-standardized proportion of deaths attributable to overweight/obesity and dietary risks of NCD was found in South Africa (11·6 %) and Cameroon (17·8 %), respectively. In line with this, studies in these countries reported a high prevalence of overweight, obesity and NCD in the adult population, showing that the countries are at latter stages of nutritional transition( Reference Steyn, Nel and Parker 64 , Reference Echouffo-Tcheugui and Kengne 65 ). International trade institutions such as an increasing number of processed food companies, and urbanization and consequent increase in the consumption of poor-quality diet, play a significant role in the burden of NCD( Reference Steyn, Nel and Parker 64 , Reference Powles, Fahimi and Micha 66 , Reference Bosu 67 ). SSA countries should develop and implement a strong and sustainable health information system to tackle the growing burden of NCD and their risk factors. Countries should also devise multisectoral interventions, including tailored and integrated agricultural, nutrition and public health policies, to overcome the nutrition-related burden of diseases. Countries and international organizations should recognize the effect of globalization on diet-related NCD burden( Reference Hawkes 37 ) and develop strategies to prevent and mitigate the impact.
Limitations
Although the GBD 2015 study used robust methods to estimate the burden of disease related to risk factors, limitations are inevitable. These limitations are discussed in detail elsewhere( Reference Forouzanfar, Alexander and Anderson 1 , Reference Forouzanfar, Afshin and Alexander 2 , Reference Melaku, Temesgen and Deribew 28 ); however, some of the most important limitations specific to the present study are discussed as follows. First, the relative risks were obtained from meta-regression analysis and used across the countries. Despite this, different risk factors could have different levels of effects across population subgroups. Second, availability of limited data in the region, particularly on dietary risk factors, could affect the estimates by over- or underestimating the burden. Third, because the urban and rural settings are substantially different environments in SSA countries, the estimates might not be applicable to these population subgroups separately. Fourth, nutritional risk factors were measured using different approaches. For instance, Zn deficiency was measured using a proxy exposure. Exposure to Zn deficiency (as an average total absorbed Zn) was determined based on the ratio of Zn to phytate in foods. Lastly, publication bias could affect the results, compromising the comparability of burden of diseases related to risk factors. For instance, more published data are available on childhood undernutrition than diet-related NCD in SSA( Reference Forouzanfar, Afshin and Alexander 2 ).
Conclusion
In summary, whereas mortality attributable to undernutrition is declining significantly, the burden related to overnutrition is increasing. We found that the burden of mortality attributable to both under- and overnutrition in SSA is high, which highlights the presence of a double burden of malnutrition. SSA countries are in an important time of challenges and opportunities to overcome nutrition-related (both under- and overnutrition) burden of disease before the impact worsens. Evidence-based interventions and programmes should be designed to tackle this phenomenon in SSA. Tailored public health and nutritional policies should be designed to address the paradox. Multisectoral collaboration at different levels of the region is a key to further reduce the burden of diseases associated with undernutrition and to tackle the oncoming burden of overnutrition. Further prospective investigations, including biomarker and genetic studies, should be conducted to understand the specific factors of the complex feature of this unprecedented nutrition transition in the SSA countries.
Acknowledgements
Acknowledgements: The analyses in this article used available data from the GBD study 2015. The authors are grateful to the GBD team in the Institute for Health Metrics and Evaluation (IHME) at the University of Washington for availing the data. Y.A.M. is grateful for the support provided by an Australian Government Research Training Programme Scholarship. Financial support: The GBD study 2015 was supported by the Bill & Melinda Gates Foundation. The current analysis received no specific grant from any funding agency in the public, commercial or not-for-profit sectors. Conflict of interest: All authors declare that they have no competing interests. The authors are solely responsible for the views expressed in this article, and they do not necessarily represent the views, decisions or policies of their institutions. Authorship: Y.A.M. conceived the study. Y.A.M. extracted and compiled the data and wrote all drafts of the manuscript. All authors provided data, assisted the data interpretation, critically reviewed the manuscript for intellectual input, and approved the final version submitted for publication. Ethics of human subject participation: Not applicable.
Supplementary material
To view supplementary material for this article, please visit https://doi.org/10.1017/S1368980018002975