Influence of Sediment Resuspension on the Biological Pump of the Southwestern East Sea (Japan Sea)
 Minkyoung Kim1†
  Young-Il Kim2*
  Jeomshik Hwang1* Ki Young Choi3 Chang Joon Kim3
  Yeongjin Ryu1 Ji-Eun Park4
  Kyung-Ae Park4 Jae-Hyoung Park1
  SungHyun Nam1 Negar Haghipour5,6
  Timothy I. Eglinton5
- 1School of Earth and Environmental Sciences/Research Institute of Oceanography, Seoul National University, Seoul, South Korea
- 2East Sea Research Institute, Korea Institute of Ocean Science and Technology, Ansan-si, South Korea
- 3Korea Institute of Ocean Science and Technology, Busan, South Korea
- 4Department of Earth Science Education, Seoul National University, Seoul, South Korea
- 5Geological Institute, Swiss Federal Institute of Technology in Zürich (ETHZ), Zurich, Switzerland
- 6Laboratory of Ion Beam Physics, ETH Zürich, Zurich, Switzerland
The biological carbon pump in the southwestern East Sea (Japan Sea, EJS hereafter) was investigated based on examination of sinking particulate matter samples intercepted by bottom-tethered sediment traps deployed on a mooring at three depths (500, 1000, and 2000 m) between 2011 and 2017. The total particle flux increased as the sampling depth increased, while particulate organic carbon (POC) flux was greatest at 500 m. The lithogenic material content was high at all depths, and accounted for an average of ∼42% of the particulate matter. The total particle flux at all sampling depths consistently shifted toward much higher values in 2014–2016. During this period, the POC flux at 500 m increased by 32% while net primary production (NPP) increased only slightly. Consequently, the POC flux/NPP ratio increased significantly, indicating greater biological pump efficiency than in earlier years of the study. The flux of lithogenic material derived primarily from sediment resuspension was much greater at 500 m in 2014−2016 compared with previous years, implying its potential role as a ballast mineral in enhancing particle export and transfer to the deep sea interior. The radiocarbon isotope ratio of POC was higher, and the excess Mn content values were lower at 500 m in 2014–2016, suggesting that the resuspended sediment at 500 m likely originated from a shallow region during this period, and differed in provenance from the lithogenic material intercepted at 2000 m. The period of enhanced particle flux coincided with the 2015/16 El Niño and a mesoscale warm (anticyclonic) eddy that persisted for 2 years in the study region. The East Korean Warm Current and the eddy may have facilitated the transport of resuspended particles entrained in the Korea Strait and/or the western shelf and upper slope of the basin to the study site.
Introduction
The East Sea (also known as the Japan Sea, the EJS hereafter) is a marginal sea that is connected to the northwest Pacific Ocean through straits shallower than 150 m (Figure 1). The Tsushima Warm Current (TWC), which is a branch of the Kuroshio Current, flows into the EJS through the Korea Strait. The East Korea Warm Current (EKWC), a branch of the TWC, flows north along the east coast of the Korean Peninsula. Upon detachment from the coast, the EKWC forms a subpolar front at 38–40°N joining with the North Korea Cold Current (NKCC). In the southwestern part of the subpolar front lies the Ulleung Basin, where net primary production (NPP) is reportedly the highest in the entire EJS (Yamada et al., 2005; Kwak et al., 2013).
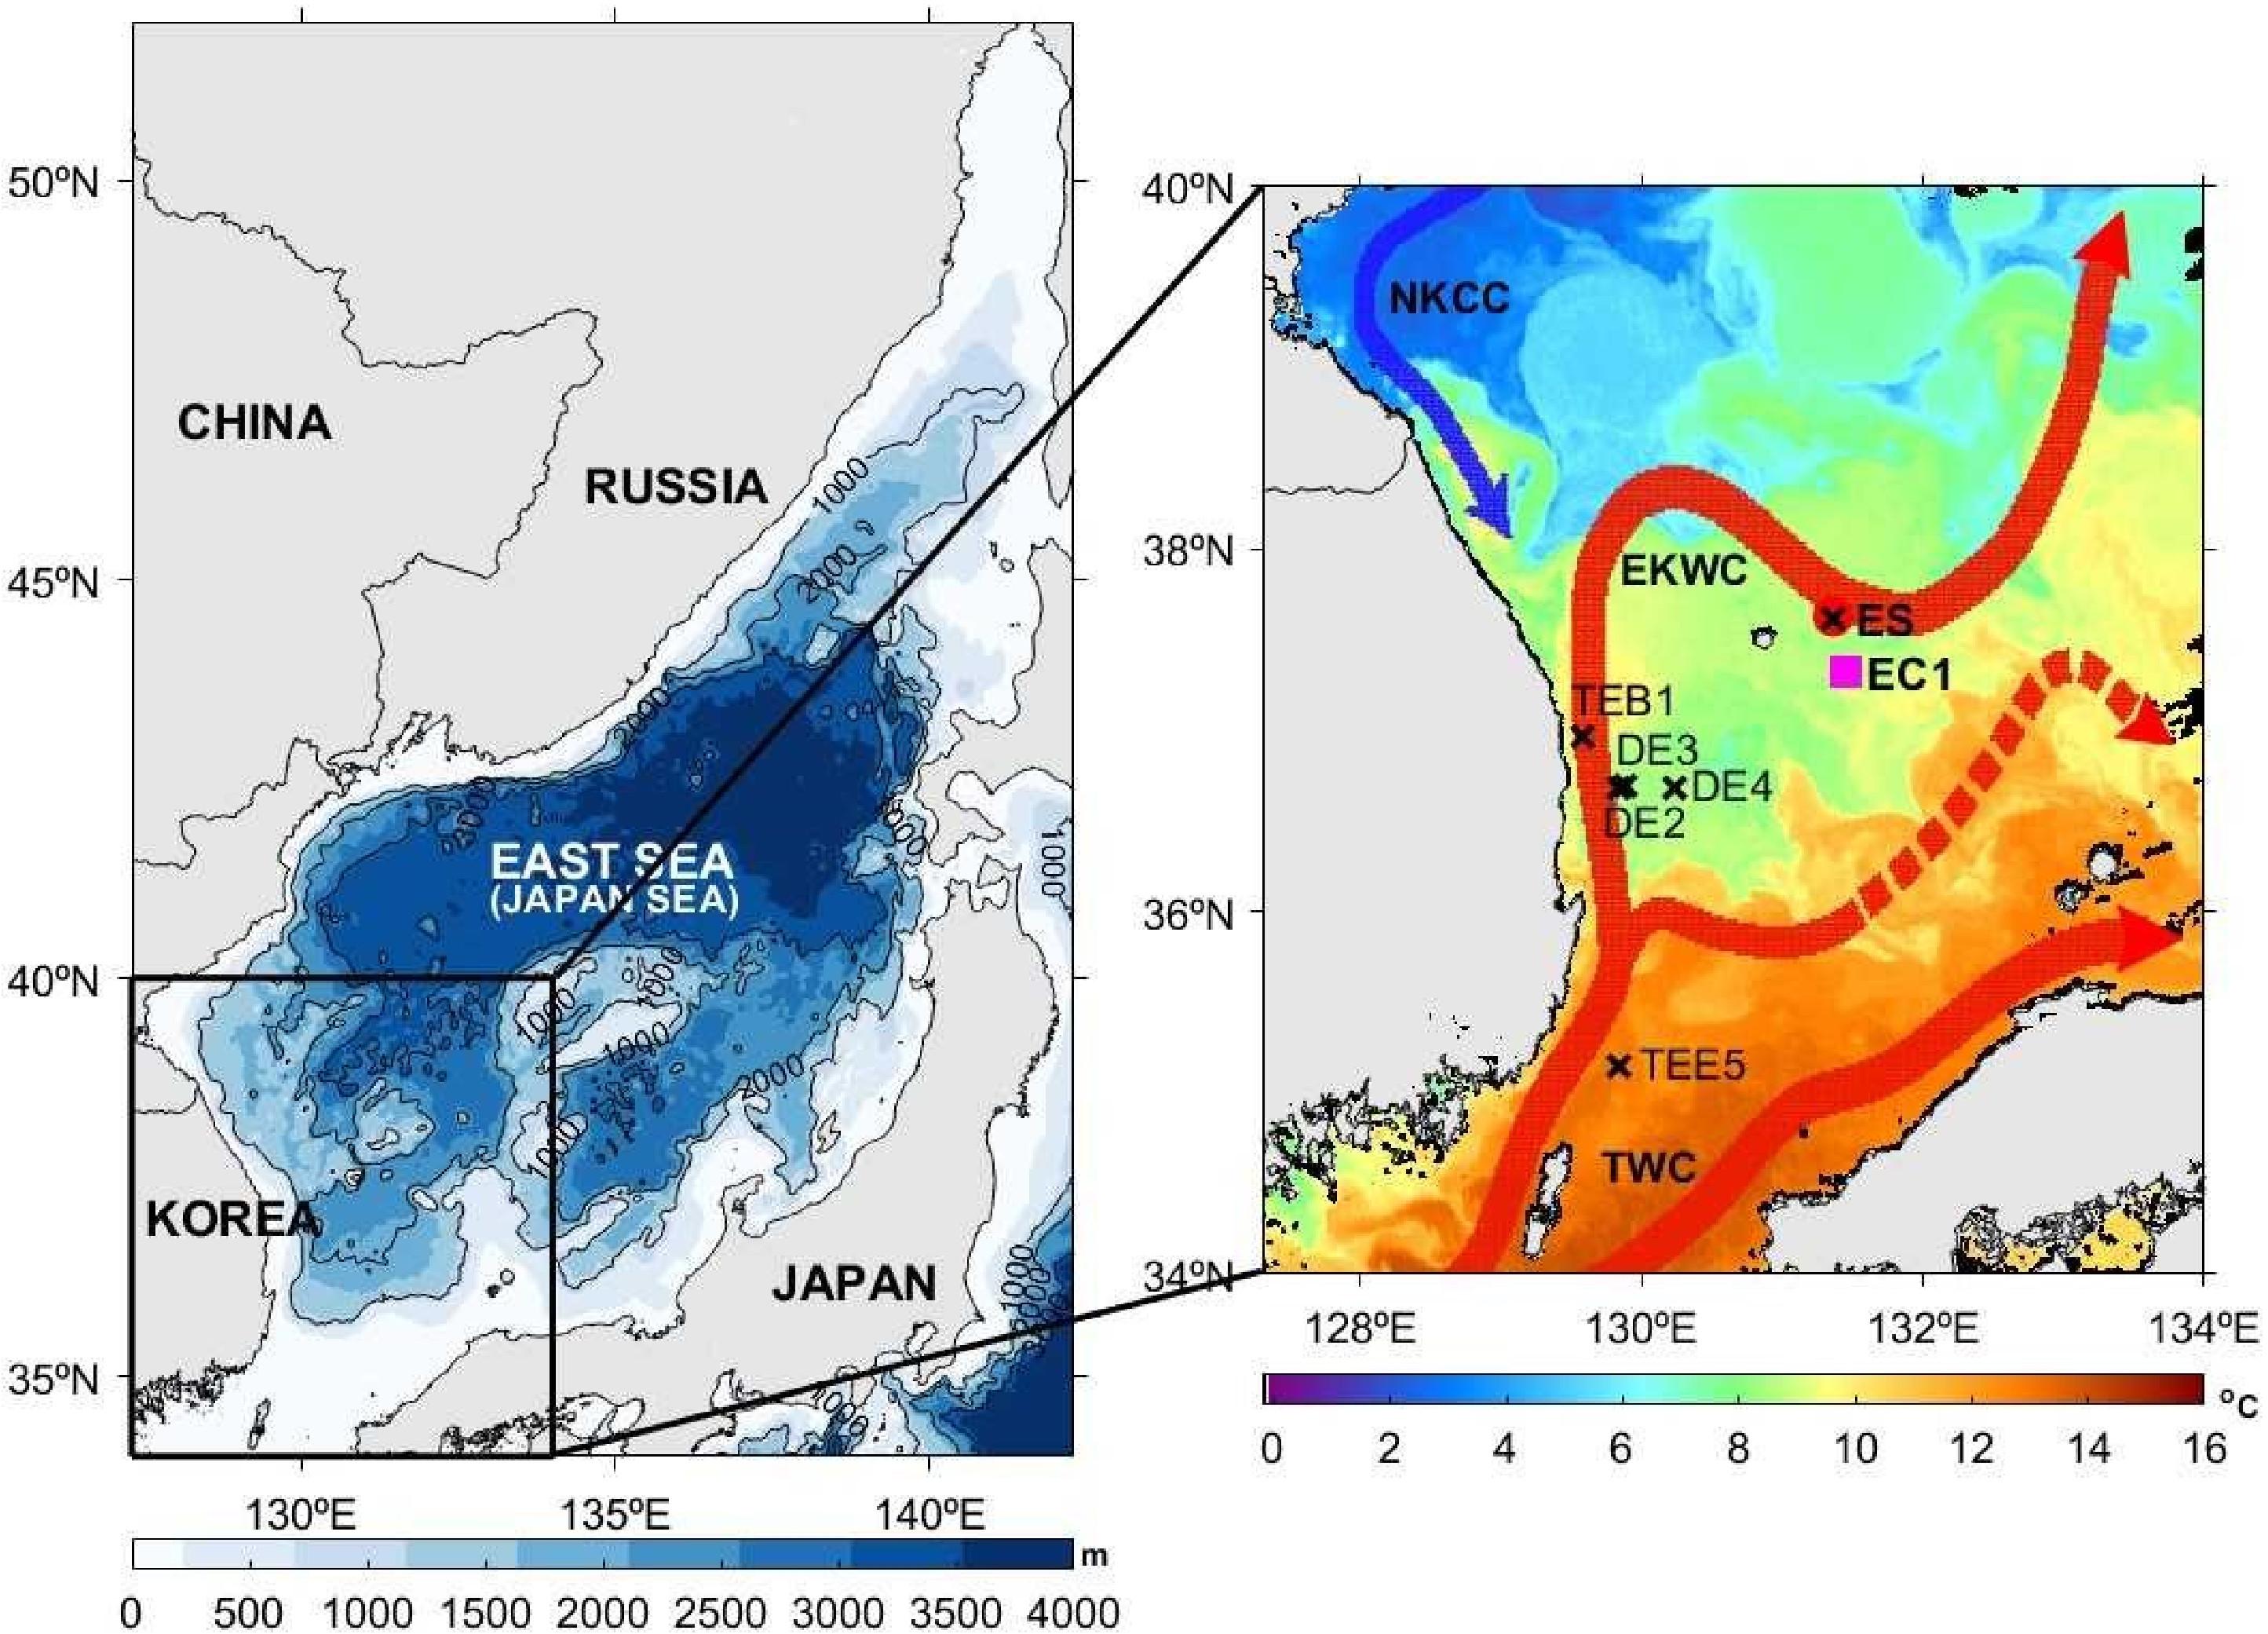
Figure 1. Bathymetry (left panel) of the East Sea (Japan Sea) and the sea surface temperature (right panel, the image was taken by satellite NOAA-19 on 30 March, 2011). The locations of the mooring sites, ES and EC1, and the surface sediment sampling sites are indicated (X marks). A schematic of major surface currents is also shown (NKCC: North Korea Cold Current, EKWC: East Korea Warm Current, TWC: Tsushima Warm Current).
Chen et al. (2017) reported rapid acidification of the interior of the EJS between 1965 and 2015. The deep waters of the EJS are vulnerable to acidification because of high levels of dissolved inorganic carbon (DIC) from organic matter decomposition, and low levels of carbonate alkalinity (Na et al., 2019). Therefore, improved understanding of the functioning of the biological carbon pump is necessary to inform projections of acidification of the deep waters of the EJS.
Changes in the physical and biological characteristics of surface waters including the vertical temperature profile, and the phytoplankton community structure, can affect the biological carbon pump in the Ulleung Basin (Yoo and Kim, 2004; Chiba et al., 2008). For example, when the surface water temperature rose and the inflow from the TWC strengthened, the contribution of small phytoplankton to NPP increased (Li et al., 2009; Lee et al., 2013; Joo et al., 2017). In their study of the monthly NPP in the Ulleung Basin, using Moderate Resolution Imaging Spectroradiometer (MODIS-aqua) satellite observations and the Vertically Generalized Productivity Model (VGPM, Behrenfeld and Falkowski, 1997), Joo et al. (2014) reported a decline of ∼17% in the annual NPP from 2006 to 2013. This was hypothesized to reflect the effect of sea surface warming and the negative phase of the Pacific Decadal Oscillation (PDO). The effects of the El Niño Southern Oscillation (ENSO) on the sinking particle flux in the tropical Pacific have been relatively well studied (Honjo et al., 1995; Kawahata et al., 2000; Kim et al., 2011, 2014, 2019). However, the relationship between the sinking particle flux and its composition and high and low frequency climate variability is not well understood because of the lack of long-term data.
The sinking particle flux in the EJS has been studied over periods of 1–2-years (Otosaka et al., 2004, 2008; Kim et al., 2017). A study based on 1 year’s data from March 2011 to February 2012 in the Ulleung Basin showed that the particulate organic carbon (POC) flux at a depth of 1000 m was bimodal, and mainly reflected the variations in the NPP. The ratio of the POC flux at 1000 m to the NPP (i.e., e-ratio at 1000 m) was ∼3%, which is similar to the values obtained for other basins in the EJS (Otosaka et al., 2008). Another finding was that, the sinking particles in the EJS contained high levels of lithogenic material from aeolian dust deposition and resuspended sediment (Otosaka et al., 2008; Kim et al., 2017), reflecting its location in a marginal sea.
In this study, we present quasi-continuous time-series data from 2011 to 2017 on the flux and composition of sinking particles at three depths at a site in the Ulleung Basin. We investigated the biological pump in the EJS, and paid particular attention to the marked increase in the particle flux that occurred in 2014–2016, and its relationship with climate variability.
Materials and Methods
Sample Collection
Samples of sinking particulate matter were collected from July 2011 to September 2017 (Supplementary Table S1) using conical-type sediment traps (aperture diameter 80 cm, height/diameter ratio = 2; model SMC26S-6000, Nichiyu Giken Kogyo Co., Ltd., Japan), deployed at 500 m (changed to 300 m in March 2017), 1000 m, and 2000 m on a bottom-tethered mooring at station ES (37.63°N, 131.36°E; ∼2370 m water depth) in the Ulleung Basin (Figure 1). The sampling interval for each cup of the sediment traps was programmed for 6–10 days. Sample collection was interrupted several times because of mooring turnaround and trap malfunctioning. Detailed information regarding the sampling times is presented in Supplementary Table S1. The mooring was equipped with RCM-type current meters at 550 m and 2050 m. The sampling cups of the traps were filled with artificial seawater, prepared using distilled water and sea salts (Sigma-Aldrich) and adjusted to the approximate salinity at the deployment depths. Sodium borate-buffered 10% formalin solution was added as a preservative. The study site is approximately 34 km northwest of station EC1 (37.33°N, 131.45°E; 2300 m water depth), which has mainly been used for physical oceanographic studies since 1996 (Chang et al., 2002; Noh and Nam, 2018), although the sinking particle flux and composition at station EC1 were reported for a 1-year period by Kim et al. (2017).
Seafloor sediment samples were collected using a box corer during two cruises (Figure 1 and Supplementary Table S3), the first in August 2011 aboard the survey vessel Haeyang 2000 involving three sampling locations: TEB1 (37.00°N, 129.50°E), TEB5 (37.00°N, 131.00°E), and TEE5 (35.18°N, 129.80°E); and the second in May 2014 aboard the R/V Eardo involving sampling at DE2 (36.71°N, 129.81°E), DE3 (36.73°N, 129.86°E), DE4 (36.71°N, 130.02°E), and ES (37.65°N, 131.35°E). These sites lie under the path of the surface currents leading toward the trap mooring sites and therefore were chosen as potential sources of resuspended sediment particles.
Sample Analyses
Particulate matter samples were filtered using a 1-mm teflon mesh to remove swimmers and any large particles, centrifuged, and freeze-dried. The freeze-dried samples were weighed for gravimetric determination of the total particle flux. For POC content measurement, ∼0.5 g of each homogenized particle sample was weighed and decarbonated by soaking in 10 ml of 1 N HCl (ACS grade, Merck) for 30 min. The decarbonated sample was dried in an oven for 3 days at 80°C, then desiccated for 2 h at room temperature. The POC content of each sample (5–7 mg, wrapped in a tin cup) was measured with an elemental analyzer (Thermo Flash EA 1112 series). The mean measured value of a standard reference material (SRM 1941b) provided by the National Institute of Standards and Technology (NIST, United States) was 2.98 ± 0.18% (certified value = 2.99 ± 0.24%).
For radiocarbon isotope analysis of POC, each particle sample was finely ground, weighed in a silver cup, fumigated with HCl in a desiccator for 3 days at 70°C to remove inorganic carbon, then stored in a desiccator with NaOH pellets (Fischer Scientific; analytical reagent grade) at 70°C for 3 days to remove residual HCl. Radiocarbon isotope ratios were measured using a gas-ion source MICADAS (Mini Carbon Dating System) accelerator mass spectrometer in the Laboratory for Ion Beam Physics at ETH Zürich (Christl et al., 2013; McIntyre et al., 2017). Radiocarbon data were normalized using an oxalic acid II standard (NIST SRM 4990C), and measurements were corrected for constant contamination introduced during fumigation using in-house shale and soil reference materials according to Haghipour et al. (2019). We assign ±5‰ as a conservative uncertainty for Δ14C measurements of POC samples although a precision of ±2‰ is routinely achievable for the modern standard oxalic acid II (McIntyre et al., 2017) and duplicate analysis results of a POC sample were within 3‰. After rinsing the samples with ultra-pure water three times and freeze-drying, the effect of formalin as a preservative on radiocarbon analysis is considered insignificant (Honda et al., 2000; Otosaka et al., 2008).
For metal analyses, ∼20 mg of each dry sample was digested in an acid mixture (HNO3, HClO4, and HF; Merck, Suprapur) for 12 h on a hot plate at 180°C, and the concentrations of Al and Mn in the digested sample were measured using inductively coupled plasma mass spectrometry (ICP-MS; Thermo X-Series). A standard material (MESS-3, National Research Council of Canada) was used for calibration. A subset of the sinking particle samples was analyzed for Al, Si, and Ca using inductively coupled plasma atomic emission spectrometry (ICP-AES; Optima 8300; PerkinElmer) at the Korea Basic Science Institute. Two standard materials (SRM 1646a, and SRM 2702, NIST, United States) were analyzed for calibration purposes. The lithogenic material content has been estimated to be 12.15-fold that of the Al content (Taylor and McLennan, 1985). For our set of samples, the CaCO3 content was estimated by multiplying the biogenic Ca content by a factor of 2.5; the biogenic Ca content was estimated by subtracting the lithogenic Ca content (= 0.5 × Al) from the total Ca content. The opal content was estimated by multiplying the content of biogenic Si by a factor of 2.4; the biogenic Si content was estimated by subtracting the lithogenic Si content (= 3.5 × Al) from the total Si content (Honjo et al., 1995).
Determination of Net Primary Production Based on Satellite Observations
The NPP in the study period was estimated using the VGPM (Behrenfeld and Falkowski, 1997) and the optimal carbon fixation rate (Kameda, 2003; Kameda and Ishizaka, 2005). Satellite data for the area of 2-km radius around Station ES were obtained using the MODIS Aqua level-2 chlorophyll-a concentration, the level-3 sea surface temperature (SST), the level-3 photosynthetically available radiation (PAR), and the level-3 diffuse attenuation coefficient for downwelling irradiance at 490 nm. A mean monthly map of the level-2 daily chlorophyll-a concentration was developed using an optimal interpolation technique after removing any speckles (Chae and Park, 2009; Park et al., 2013).
Results
Particle Flux and Composition
The total particle flux over the entire sampling period varied from 0.8 to 1586 mg m–2d–1, 48 to 1606 mg m–2d–1, and 89 to 1432 mg m–2d–1 at 500 m, 1000 m, and 2000 m, respectively (Supplementary Table S1). Because of interruptions in the data collection, no seasonal variation was detected, but the interannual variability was high. In general, the particle flux values were higher for 2014–2016 than in the preceding and following years. The total particle flux increased as the depth increased: the sampling period-weighted average particle fluxes at 500 m, 1000 m, and 2000 m were 344, 393, and 432 mg m–2d–1, respectively (Figure 2 and Table 1). Conspicuous peaks in the flux occurred coincidentally at all depths without any time lag. However, the particle fluxes at different depths were not tightly coupled. In particular, the correlation between particle fluxes at 500 m and 2000 m was very weak (R2 = 0.12).
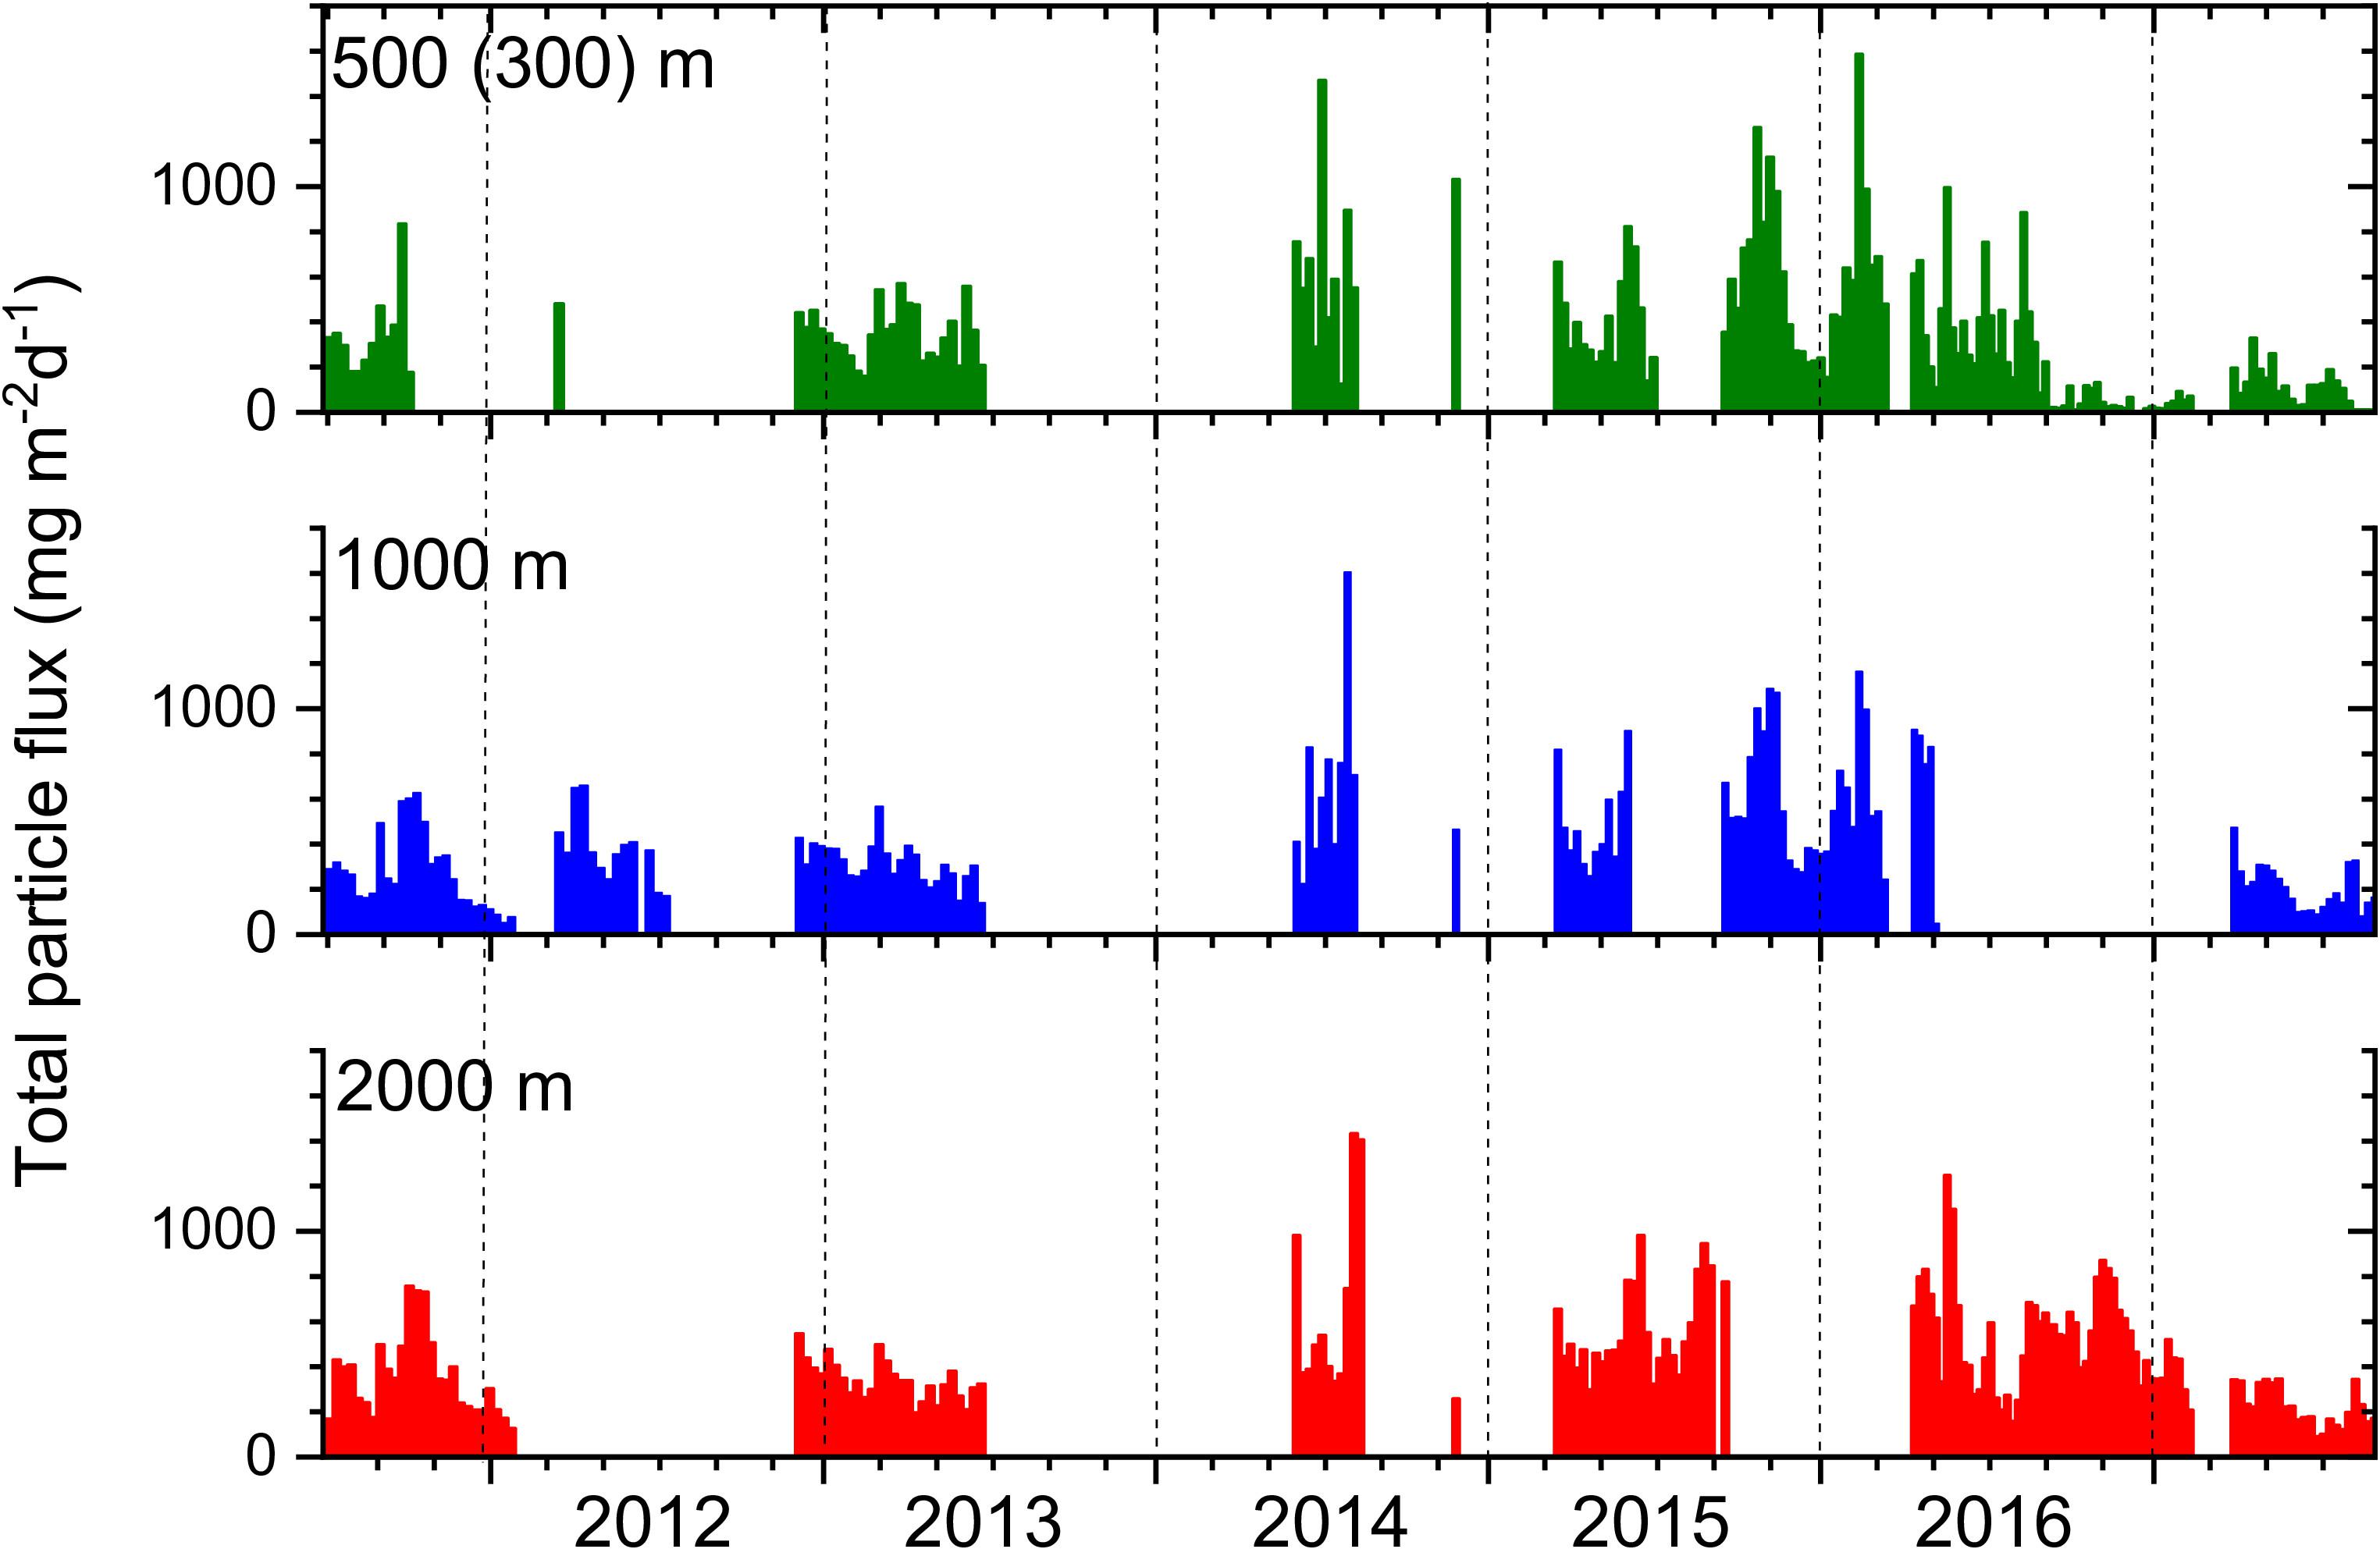
Figure 2. The total particle flux at the three sampling depths from July 2011 to September 2017 (No bar indicates no data).
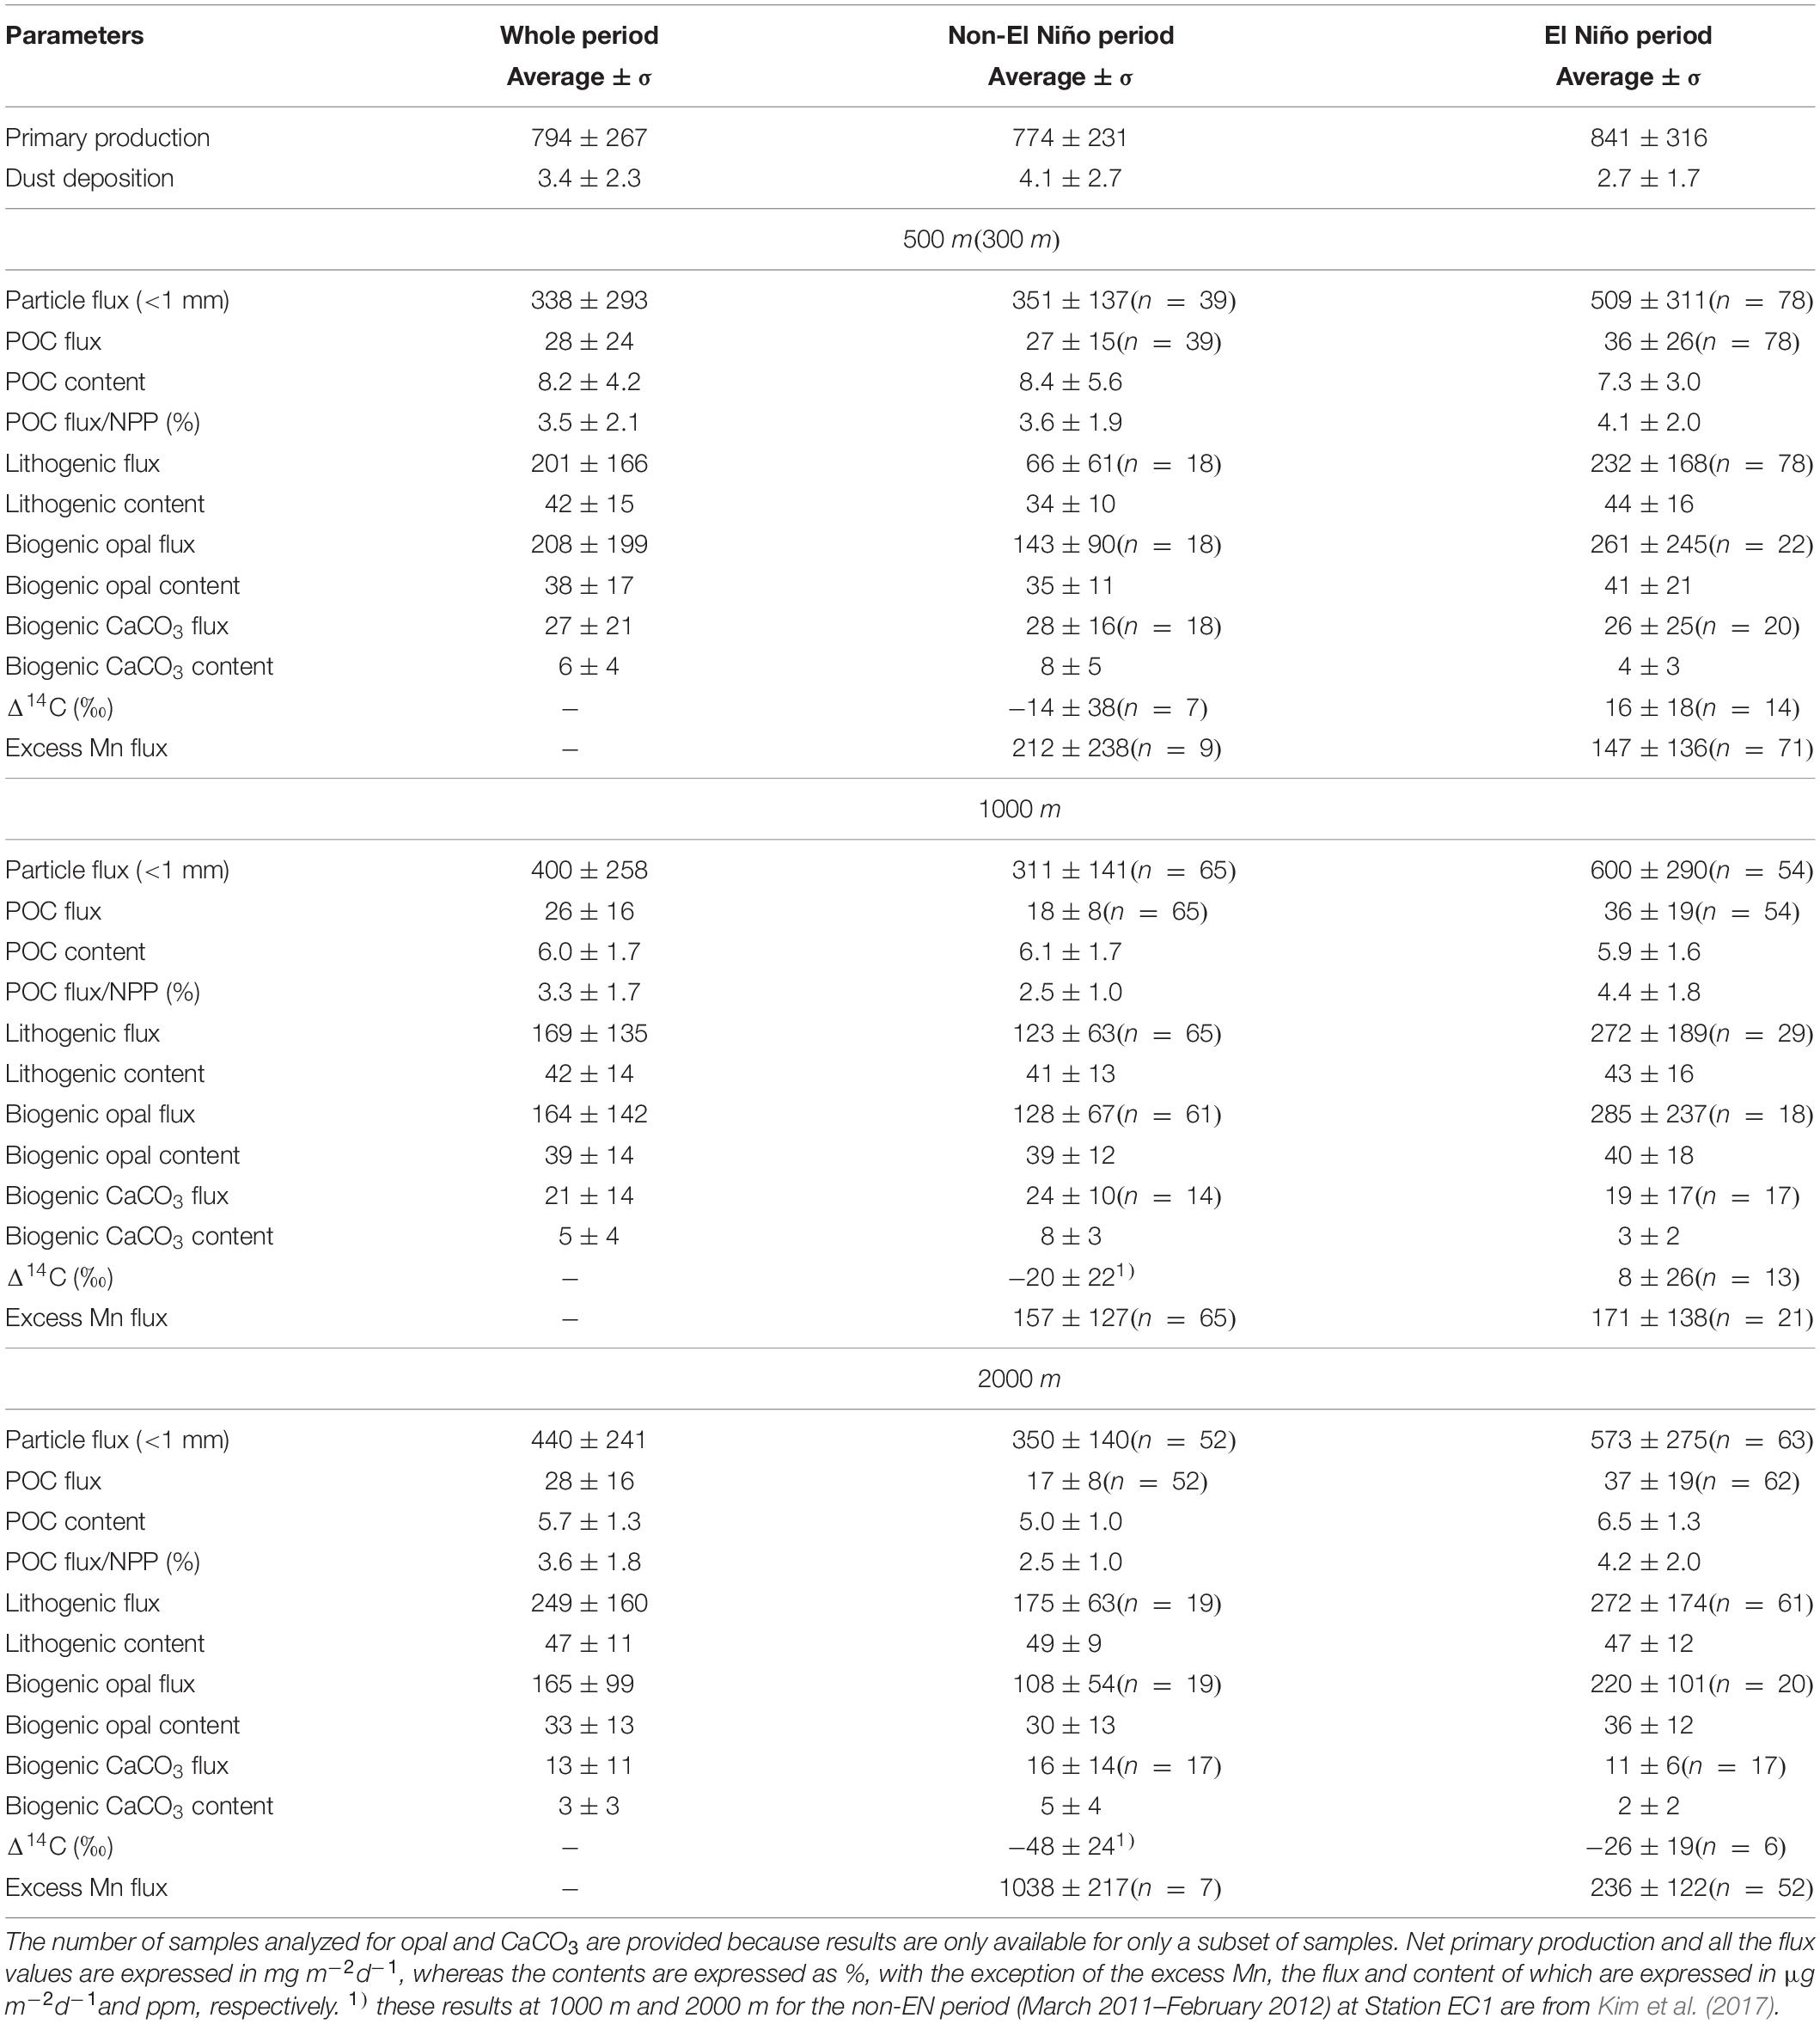
Table 1. Values of observed parameters averaged over the entire study period (July 2011-September 2017), the non-El Niño period (July 2011-March 2014), and the El Niño period (June 2014-September 2016).
The POC content varied widely at 500 m (0.4−29%; Supplementary Figure S1), and was particularly high in July 2011. Unlike the total particle flux, the POC content generally decreased with increasing depth; the arithmetic mean of the POC content throughout the study period was 8.2 ± 4.2 at 500 m, 6.0 ± 1.7 at 1000 m, and 5.7 ± 1.3% at 2000 m (Supplementary Figure S1 and Table 1; note: unless otherwise stated, the ±values throughout the paper indicate the standard deviation of the observed results, not measurement uncertainty). The temporal variation in the POC flux was in phase with the total particle flux (Figure 3). The POC flux ranged from 0.05 to 187 mgC m–2d–1 at 500 m (sampling duration-weighted average = 28), 0.9 to 84 mgC m–2d–1 at 1000 m (ave. = 25), and 6.8 to 95 mgC m–2d–1 (ave. = 26) at 2000 m (Figure 3 and Table 1). Because the POC content and total particle flux varied inversely with depth, the POC flux was highest at 500 m, while the values at 1000 m and 2000 m were similar, especially during the high flux period in 2014/16.
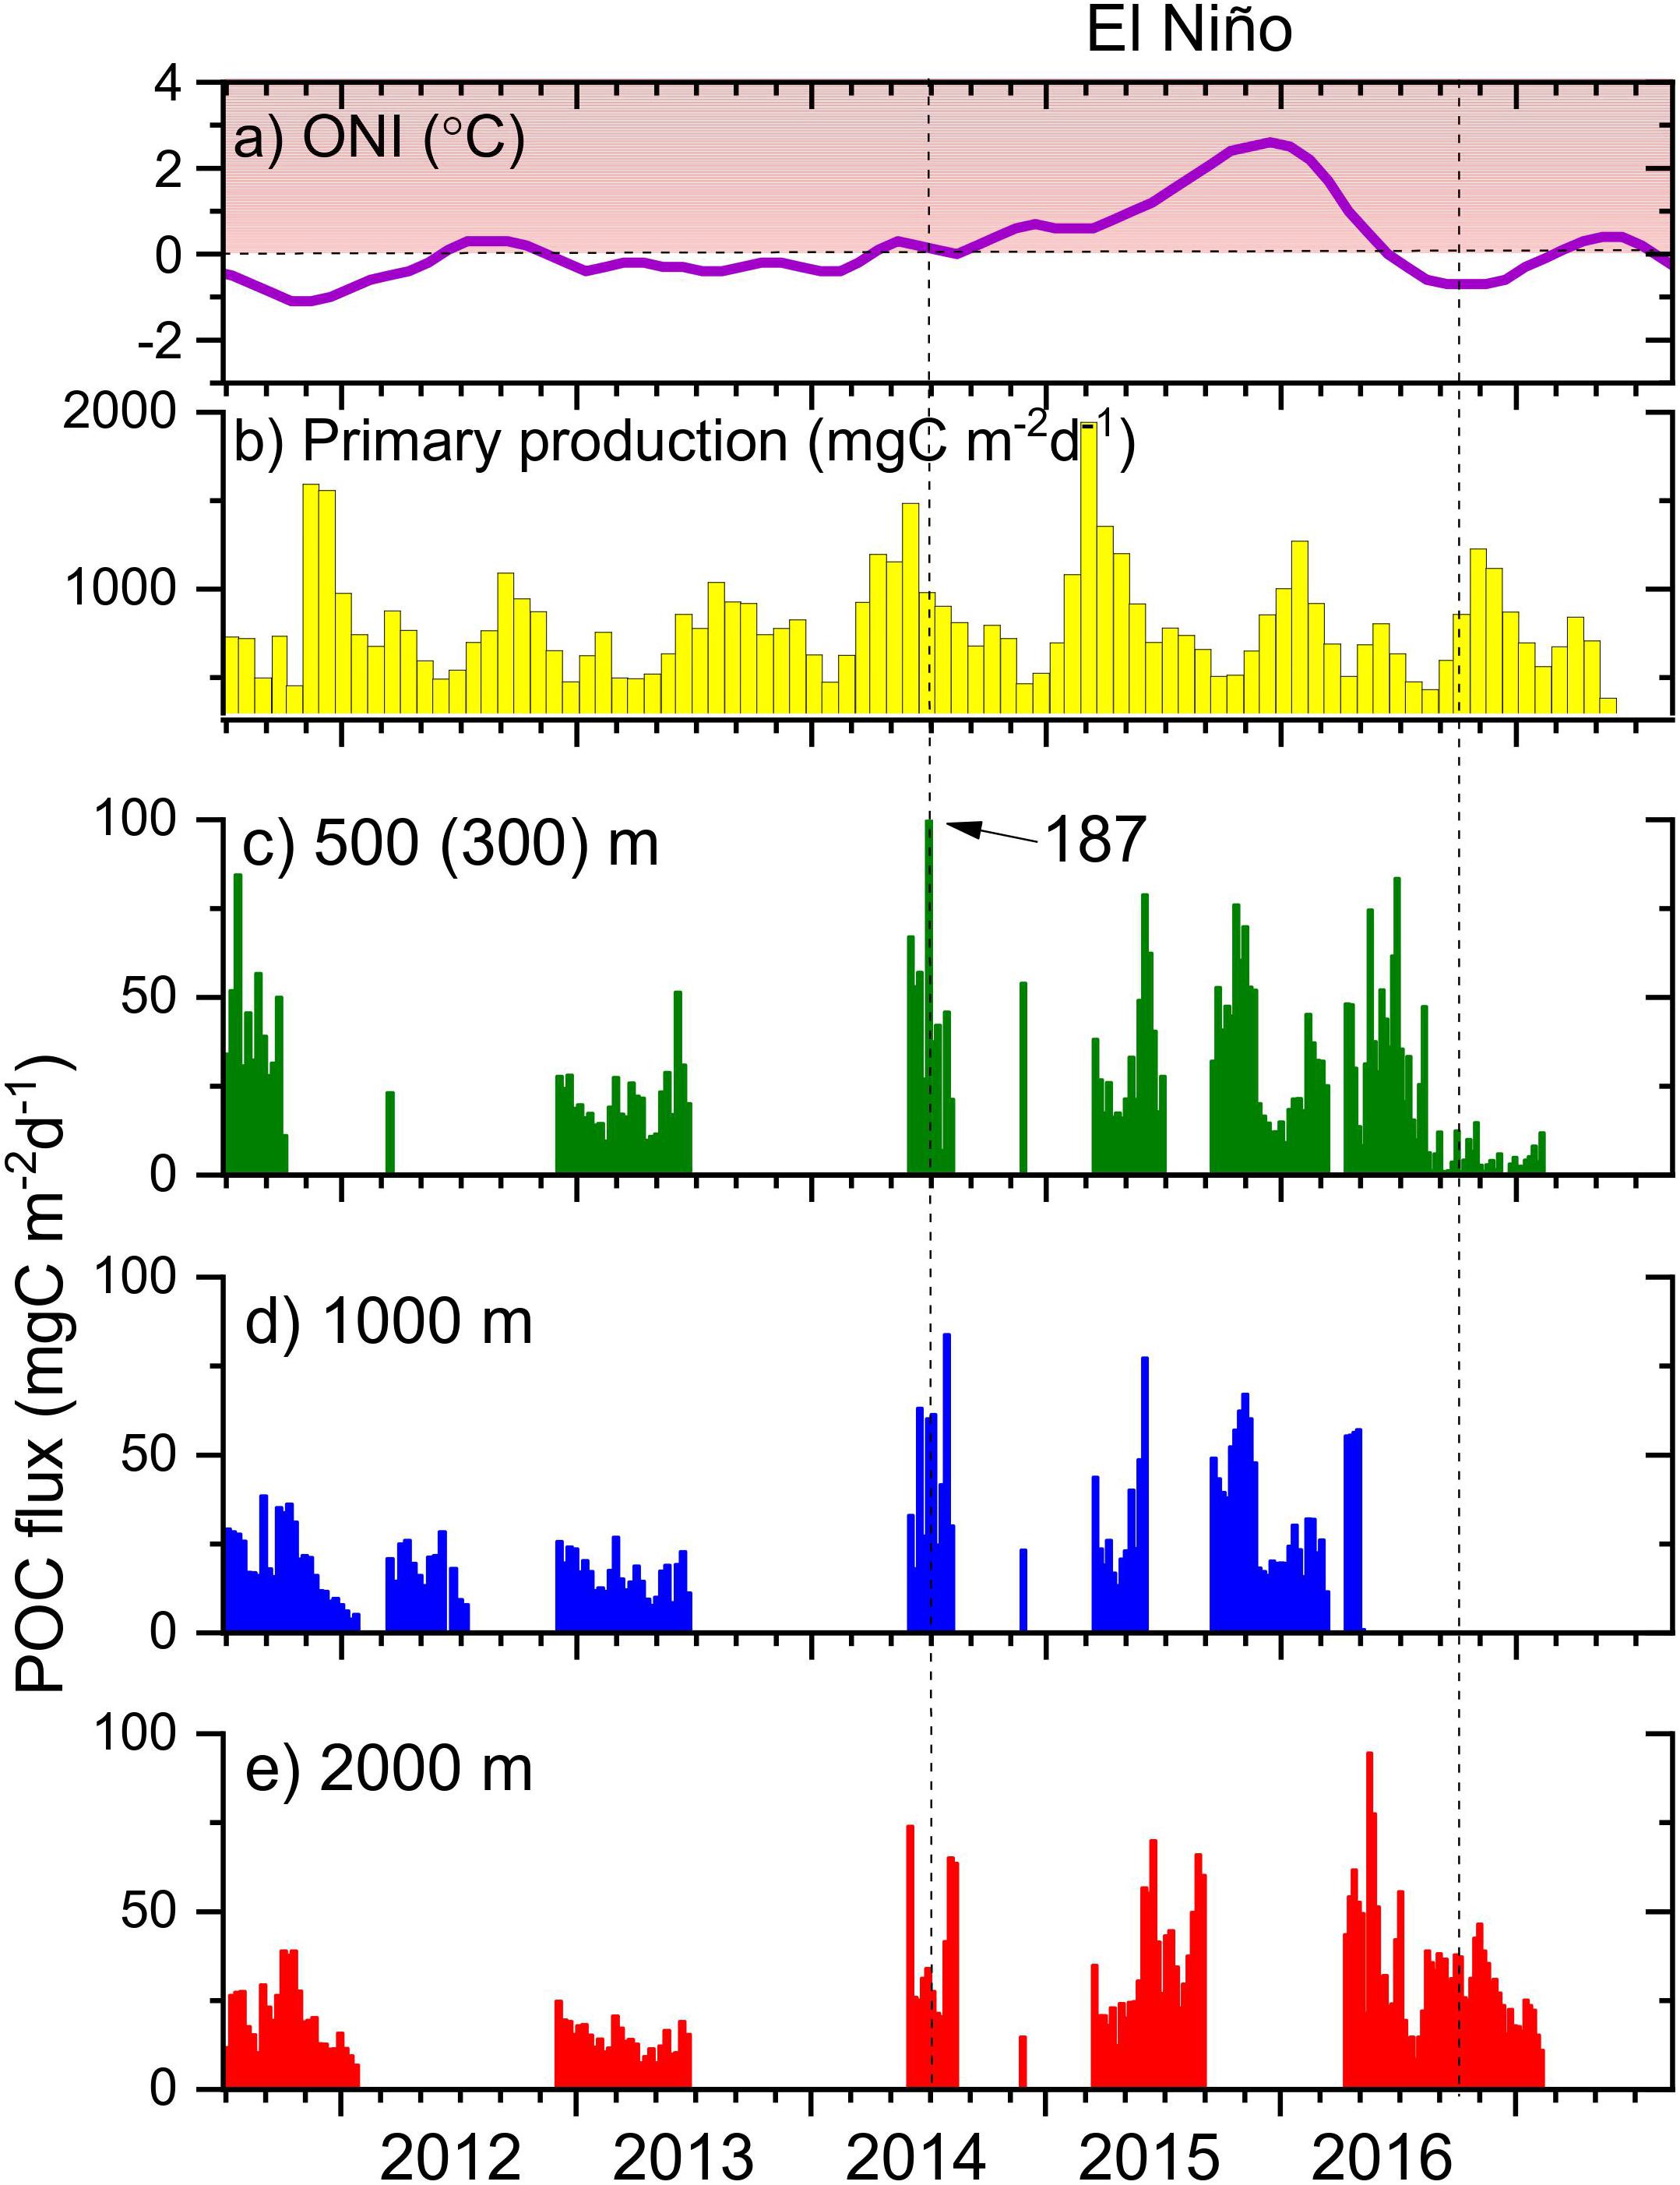
Figure 3. (a) ONI (Oceanic Nino Index; upper panel); (b) net primary production determined from MODIS-aqua satellite observations and the Vertically Generalized Productivity Model (middle panel); and (c–e) the POC flux at 500 m, 1000 m, and 2000 m, respectively. Where there is no bar, there were no data.
The content of lithogenic material varied widely from 11 to 75% at 500 m (mean = 42 ± 15%), from 12 to 73% at 1000 m (mean = 42 ± 14%), and from 14 to 80% (mean = 47 ± 11%) at 2000 m (Supplementary Figure S2 and Table 1). The lithogenic material flux was also very high at 500 m, where it varied from 5 to 765 mg m–2d–1 (Figure 4), and at this depth there was a distinct difference prior to and after June 2014. Before this time, the flux of lithogenic material increased considerably from 500 to 1000 m but showed only a small increase as the depth increased for 2014–2016. During the entire study period, the sampling duration-weighted average lithogenic material fluxes were 199, 161, and 241 mg m–2d–1 at 500, 1000, and 2000 m, respectively. Therefore, averaged over the entire period, both the content and the flux of lithogenic material was smallest at intermediate depth (1000 m). The increase in the flux of lithogenic material was largely responsible for the increase in the total particle flux in 2014–2016.
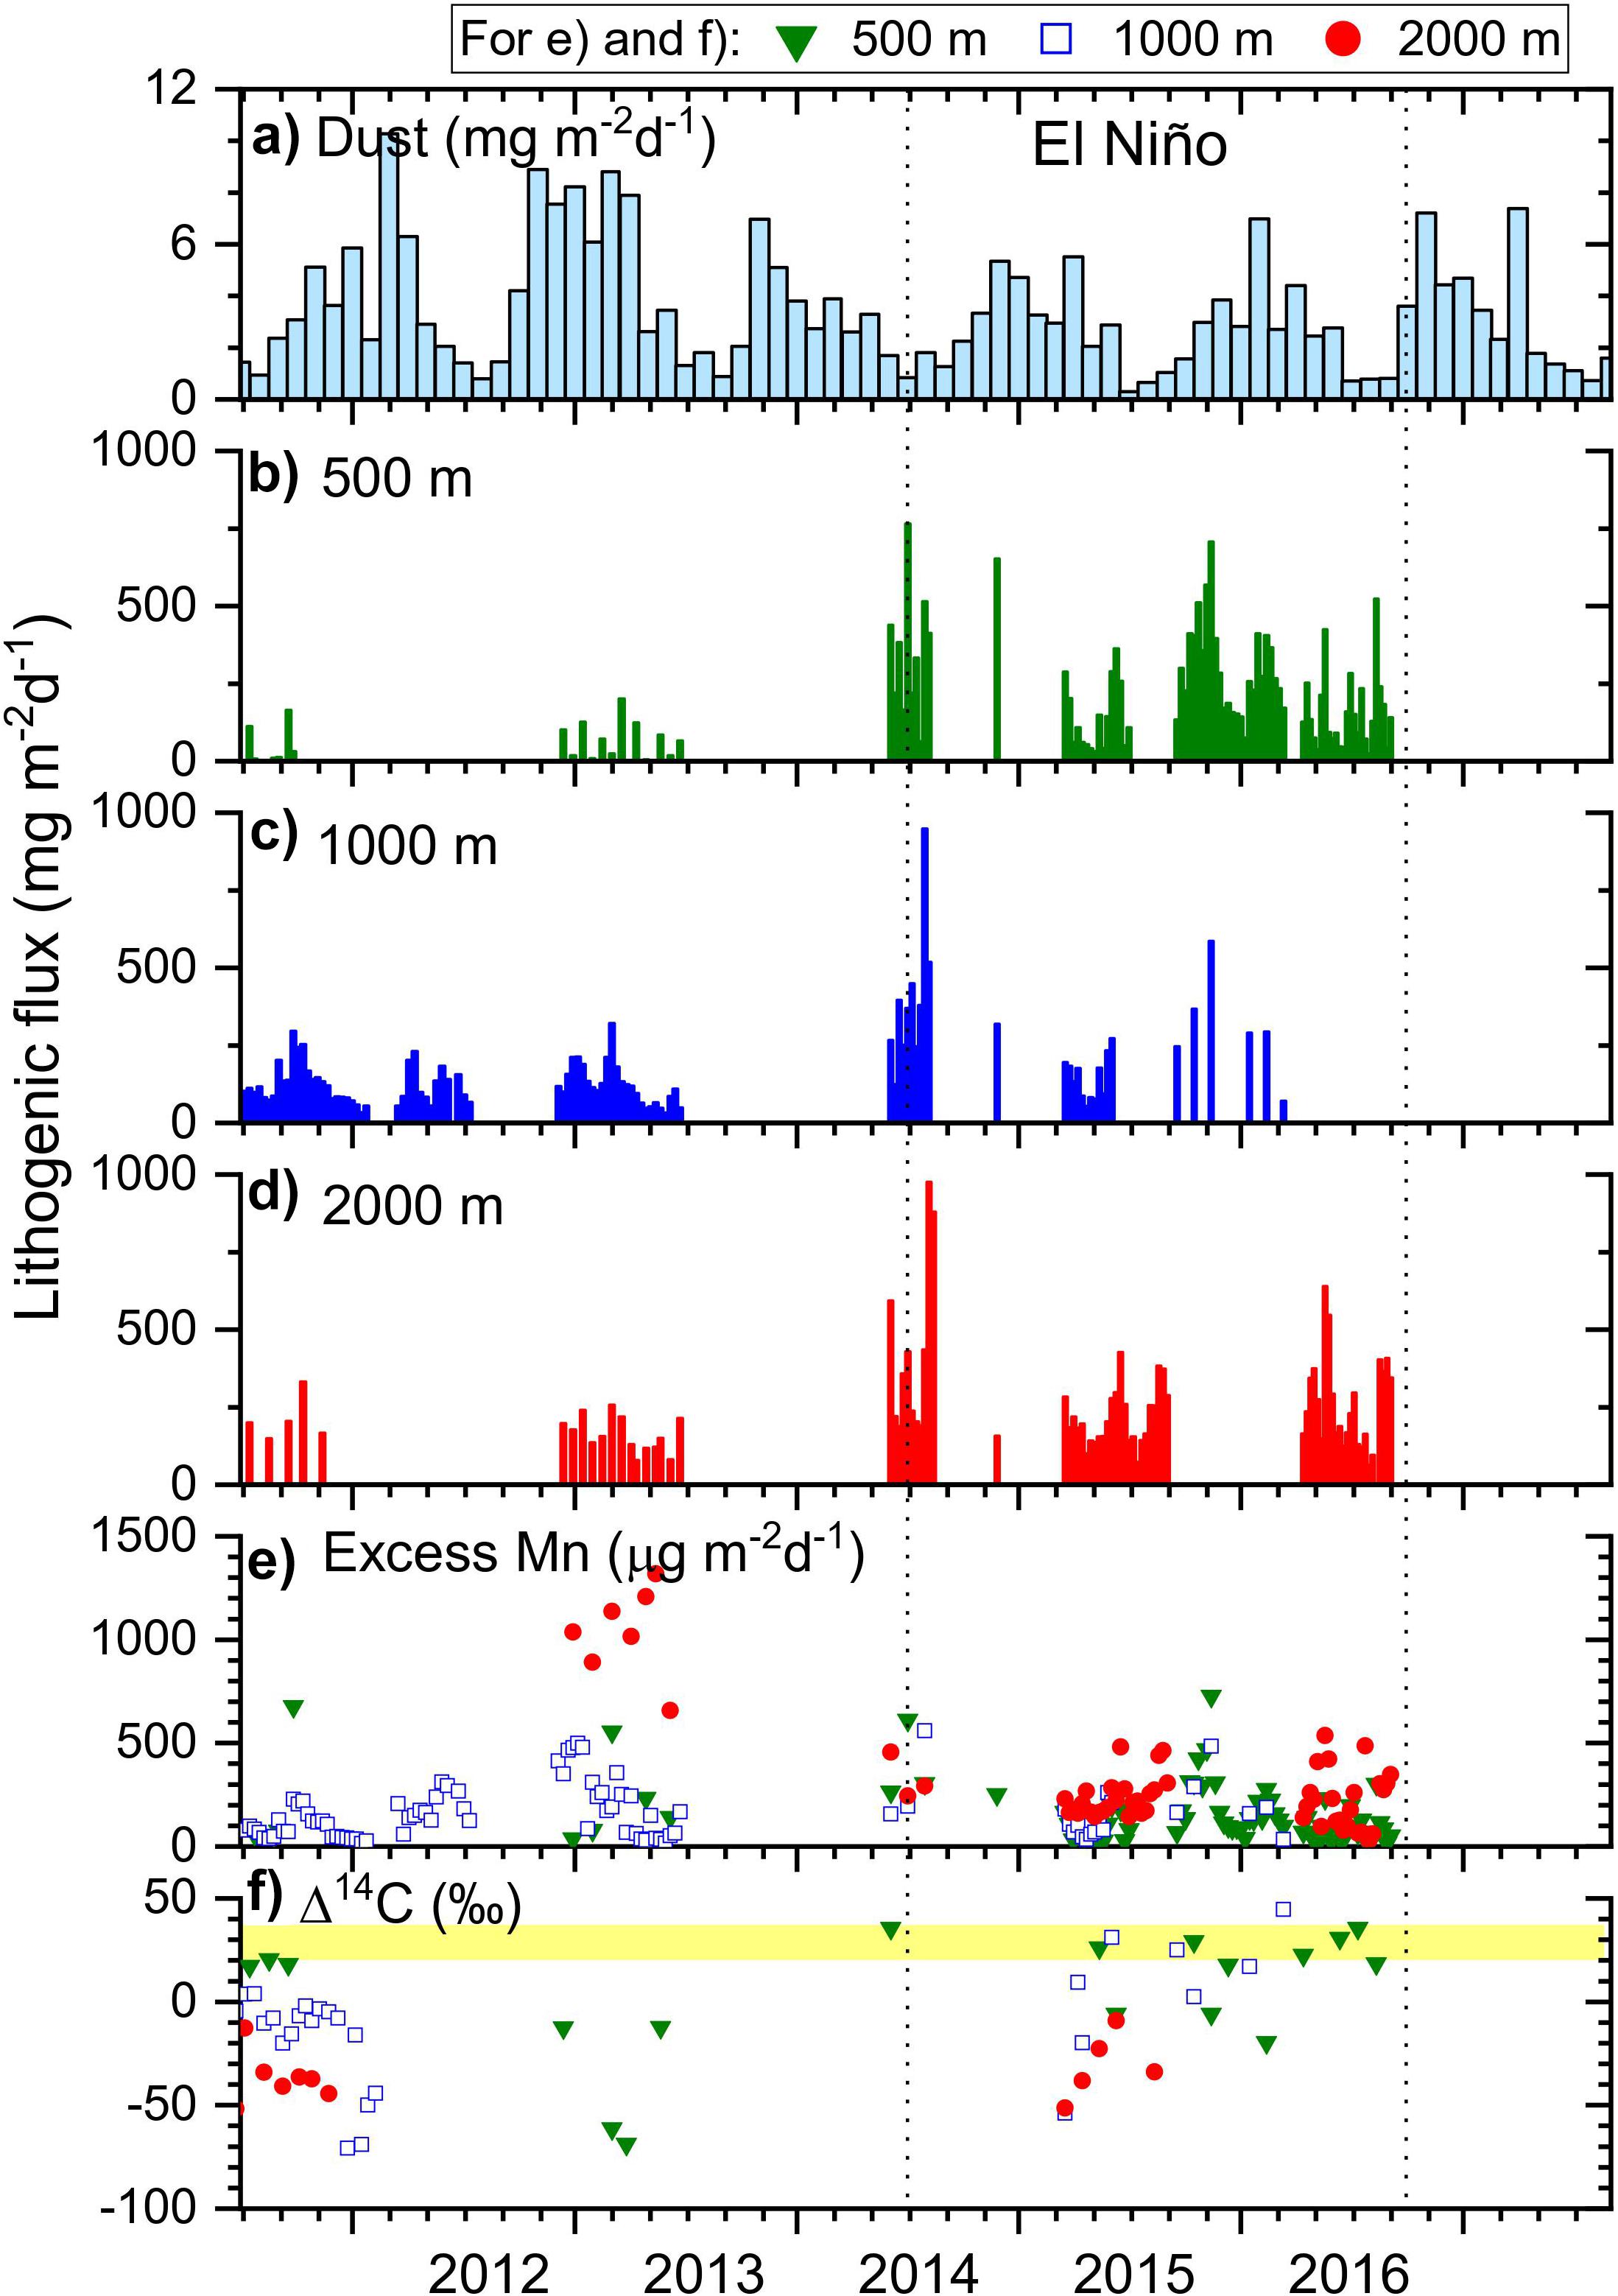
Figure 4. (a) Dust deposition to the sea surface based on a MERRA 2 model; (b–d) lithogenic material flux at 500 m, 1000 m, and 2000 m, respectively; (e) excess Mn flux at the three sampling depths; and (f) Δ14C (‰) values. To facilitate comparison, the Δ14C results at 1000 m and 2000 m of Station EC1 in 2011–2012 are also included (Kim et al., 2017). Yellow horizontal bar indicates the range of the Δ14C values of dissolved inorganic carbon (DIC) in the surface waters at nearby sites (30 ± 12‰, n = 7; Kim et al., 2017).
Biogenic opal accounted for 33–40% of the particulate matter. There was no clear trend in the vertical opal content (Supplementary Figure S3). The opal flux was greater at 500 m (204 mg m–2d–1) than at the other depths (160 and 159 mg m–2d–1, at 1000 m and 2000 m, respectively) (Supplementary Figure S3 and Table 1). At all depths, CaCO3 accounted for the smallest fraction of the particulate matter (Supplementary Figure S4). Both the CaCO3 content and flux decreased with increasing depth: 6.1 ± 4.1% (27 mg m–2d–1), 5.3 ± 3.6% (21 mg m–2d–1), and 3.3 ± 3.1% (11 mg m–2d–1) at 500 m, 1000 m, and 2000 m, respectively (Supplementary Figure S4 and Table 1).
Comparison Between Strong El Niño and Non-El Niño Periods
The particle flux was considerably higher in the period from June 2014 to September 2016 than in earlier years of the study or during the first 8 months 2017 (Figure 2). This period coincided with the occurrence of a super El Niño, as evidenced by a strong positive ONI (oceanic niño index) around 2015 (Figure 3); the period from 2011 to 2013 represented a negative phase of the ONI. For convenience, we refer to the former (2014–2016) and the latter periods (2011–2013) as the “EN” and the “non-EN” periods, respectively. Because the particle fluxes in these two periods were quite distinct, the properties of the two periods were compared (Figure 5 and Table 1). We performed t-test to examine whether each property between the two periods was significantly different, although it is acknowledged that this comparison between the EN and the non-EN periods may suffer from bias caused by sampling hiatuses.
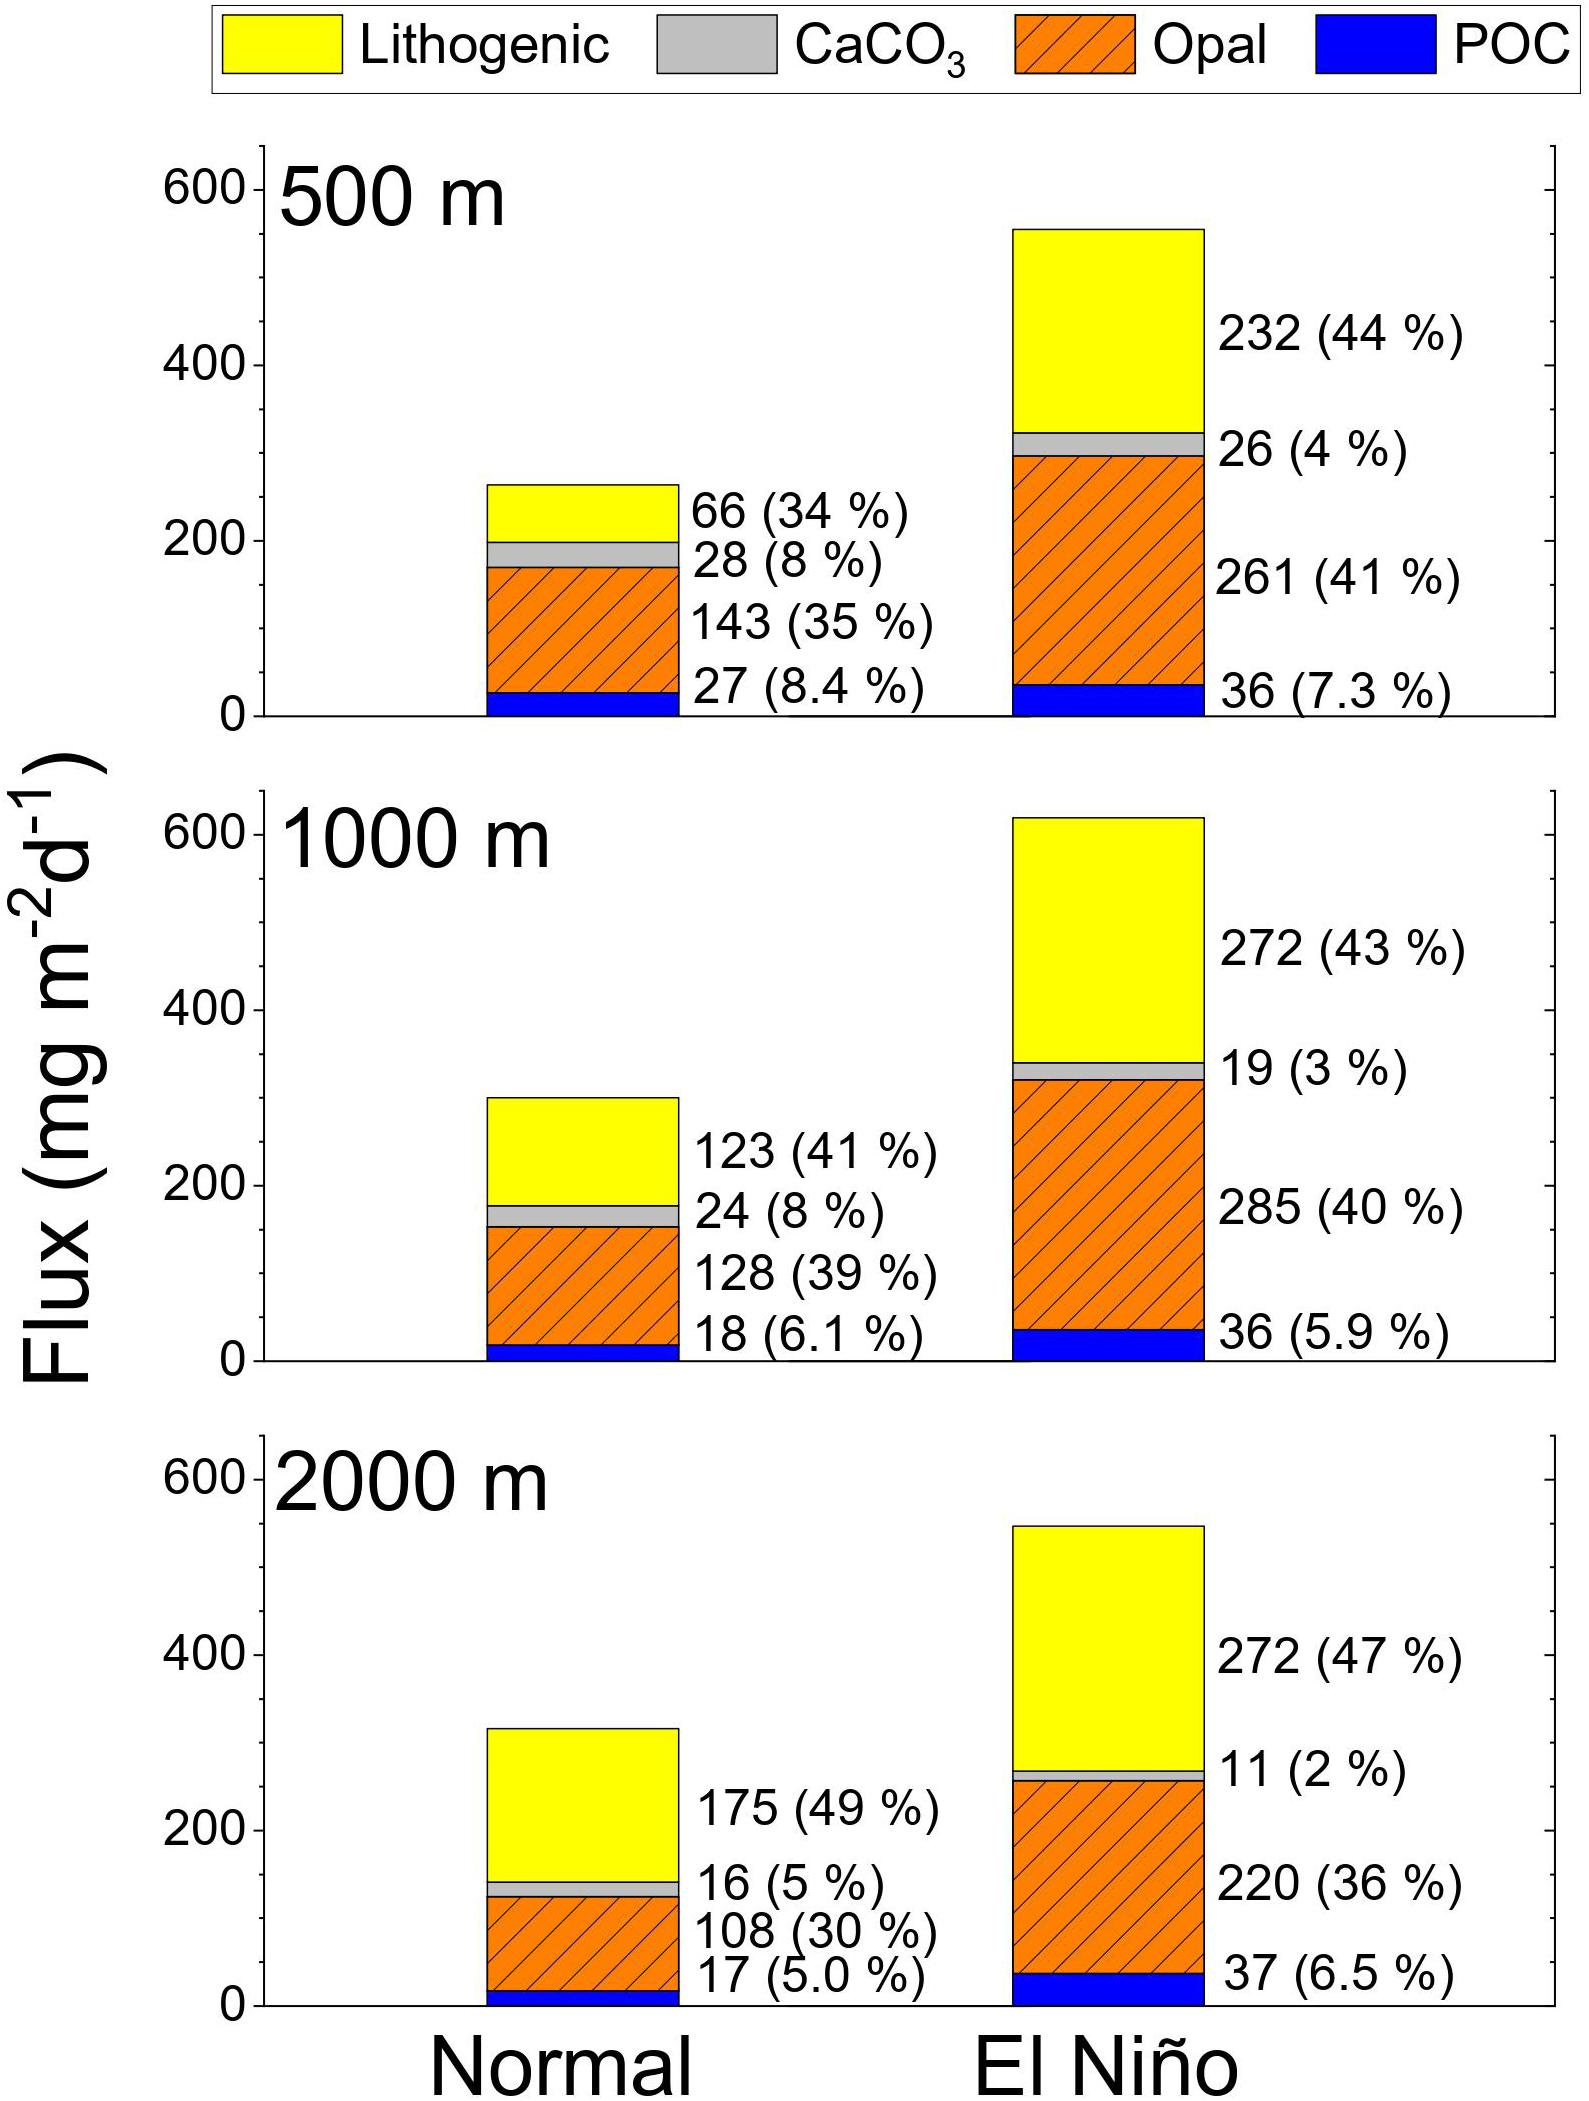
Figure 5. Stacked bar plots of the biogenic and lithogenic material fluxes at the three sampling depths for the normal (non-EN) and EN periods (see Table 1 for delineation of these periods). The proportions (as%) of each component are included (in parentheses). Note that the height of the stacked bar is not exactly equal to the total particle flux.
At 500 m, the POC flux averaged over each period was 32% higher for the EN period (2014–2016) than the non-EN period (2011–2013; Table 1), with a considerably greater discrepancy as the depth increased (the EN period being 96% and 113% higher at 1000 m and 2000 m, respectively). Small vertical changes in the POC flux during the EN period were responsible for this vertical difference. At all depths, p-values were <0.05 for POC flux between the non-EN and the EN periods. The opal flux in the EN period was consistently greater (by 83–123%) at all depths than in the non-EN period (Table 1). By comparison, the CaCO3 flux in the non-EN period was either similar to (at 500 m) or slightly higher (at 1000 and 2000 m) than in the EN period.
The differences between the two periods were also evident in the lithogenic material flux (p-values < 0.01). In the non-EN period, the lithogenic material fluxes were significantly lower at 500 m and 1000 m than at 2000 m, while these fluxes were similar at all depths during the EN period. Correspondingly, the relative increase in the lithogenic material flux from the non-EN period to the EN periods was much greater at 500 m (254%) and 1000 m (121%) than at 2000 m (56%; Table 1).
During the non-EN period, the particle composition changed with depth (Figure 5 and Table 1), with decreasing POC content and increasing lithogenic material content with increasing depth, and a maximum opal content at 1000 m. In contrast, the particle composition did not change substantially and showed no systematic trends during the EN period. The particle composition was similar at 500 m and 1000 m, but had a higher lithogenic material content and a lower opal content at 2000 m. However, these vertical changes were all much smaller than the temporal variation at each depth.
Discussion
Biological Carbon Pump in the EJS
We first evaluated whether the increase in POC flux at 500 m in the EN period was accompanied by a commensurate increase in the NPP. Although the existence of the SCM (subsurface chlorophyll maximum) may increase the uncertainty in the satellite-derived NPP, Joo et al. (2014) found that the MODIS-derived NPP using the regional primary production algorithm for the EJS correlated strongly with in situ measurements by Kwak et al. (2013). This lends confidence in the use of satellite-derived NPP values, at least with respect to temporal variability. The average of the NPP in the EN period was approximately 9% higher than in the non-EN period (841 and 774 gC m–2d–1, respectively). However, the relationship between the NPP and the ENSO indexes of the ONI and the MEI (multivariate ENSO index) was weak (R = 0.23). Next, we investigated the correlations between the variations in NPP and the POC flux. Monthly data for the NPP were interpolated to match the period when the sinking particles were sampled. While the two parameters appeared to co-vary, the highest correlation coefficient, between the log10(NPP) and log10(POC flux), was low (R = 0.42; not shown). The average change in POC flux at 500 m is greater between the two periods (by 32%) than the average difference in NPP (by 9%). Based on an empirical model in which export from the euphotic zone scales to NPP with a power of 1.3 (Laws et al., 2011), an increase of 9% in NPP would correspond to a 17% increase in the export flux. Therefore, the observed 32% increase in POC flux was likely caused by other factors in addition to the increase in the NPP.
The ratio of POC flux at 500 m (which accounts for the majority of flux attenuation; Na et al., 2019) to NPP was generally higher in the EN period than in the non-EN period (Table 1), and this pattern was even clearer when the POC flux at 1000 m was considered. The POC flux/NPP ratio remained elevated with increasing depth in the EN period (4.1, 4.4, and 4.2% at 500, 1000, and 2000 m, respectively), whereas it decreased between 500 m and the two deeper trap depths (1000 m and 2000 m) during the non-EN period (3.6 and 2.5%, respectively), implying enhanced carbon sequestration efficiency during the EN period. High opal and lithogenic material fluxes appear to have boosted particle transfer efficiency in the EN period. Because CaCO3 flux is always low in the EJS, opal and lithogenic material presumably have acted as ballast minerals (Armstrong et al., 2001).
Sources of Lithogenic Material and Its Influences on Particle Flux
The lithogenic material flux showed greatest relative difference between the two periods in both magnitude and vertical distribution (Figures 4, 5). In the non-EN period, the lithogenic material flux was considerably greater at 2000 m, although was also significant at 1000 m. In the EN period, the lithogenic material flux was similar at each of the three depths, primarily as a consequence of increased lithogenic material flux at 500 m during this period. We used monthly aeolian dust deposition data obtained from a MERRA2 (Modern-Era Retrospective analysis for Research and Applications) model1 to investigate whether dust deposition levels were higher and thus could be responsible for the increased lithogenic material flux during the EN period. Over the study period, the dust deposition reached a maximum in 2011, and did not increase significantly during the EN period (Figure 4). The dust deposition averaged 4.1 ± 2.7 and 2.7 ± 1.7 mg m–2d–1 during the non-EN and EN periods, respectively. The low levels of dust deposition observed during the EN period are consistent with the observations of Yumimoto and Takemura (2015), who found that there was more Asian dust occurrence in the source region during the La Niña years than in other years. The dust flux was estimated to account for only 1-3% of the observed lithogenic material flux at 500 m. We conclude, therefore, that dust deposition was not the major source of the lithogenic material flux.
Since we exclude dust deposition as a significant contributor to the lithogenic material flux, marine processes (i.e., sediment resuspension) must have been responsible for the observed difference in the lithogenic material flux between the two periods. However, despite the higher lithogenic material content, Δ14C values of POC in the EN period were similar to those in the non-EN period (Figure 4 and Supplementary Table S2). This finding is not consistent with the negative relationship between Δ14C values of POC and the lithogenic material content or the lithogenic material/POC ratio commonly observed in various environmental settings in the ocean (Hwang et al., 2010; Kim et al., submitted). Notably, higher Δ14C values accompanied higher lithogenic material flux in the 500 m and 1000 m samples from the EN period (Figure 6), suggesting a different provenance for resuspended sediments from the two periods. Specifically, the higher Δ14C values in the EN period implies an origin from of resuspended sediment entraining more modern POC (e.g., the continental shelf rather than the central basins). The Korea Strait and the southwestern shelf/slope of the Ulleung Basin represent potential sources where energetic semi-diurnal tides and internal waves can stimulate sediment resuspension (Chae et al., 2018). Surface sediments in this region have relatively high Δ14C values (−100 to −144‰; Supplementary Table S3) compared to those from central regions of the Japan and Yamato basins (−173 to ca. −375‰; Otosaka et al., 2008).
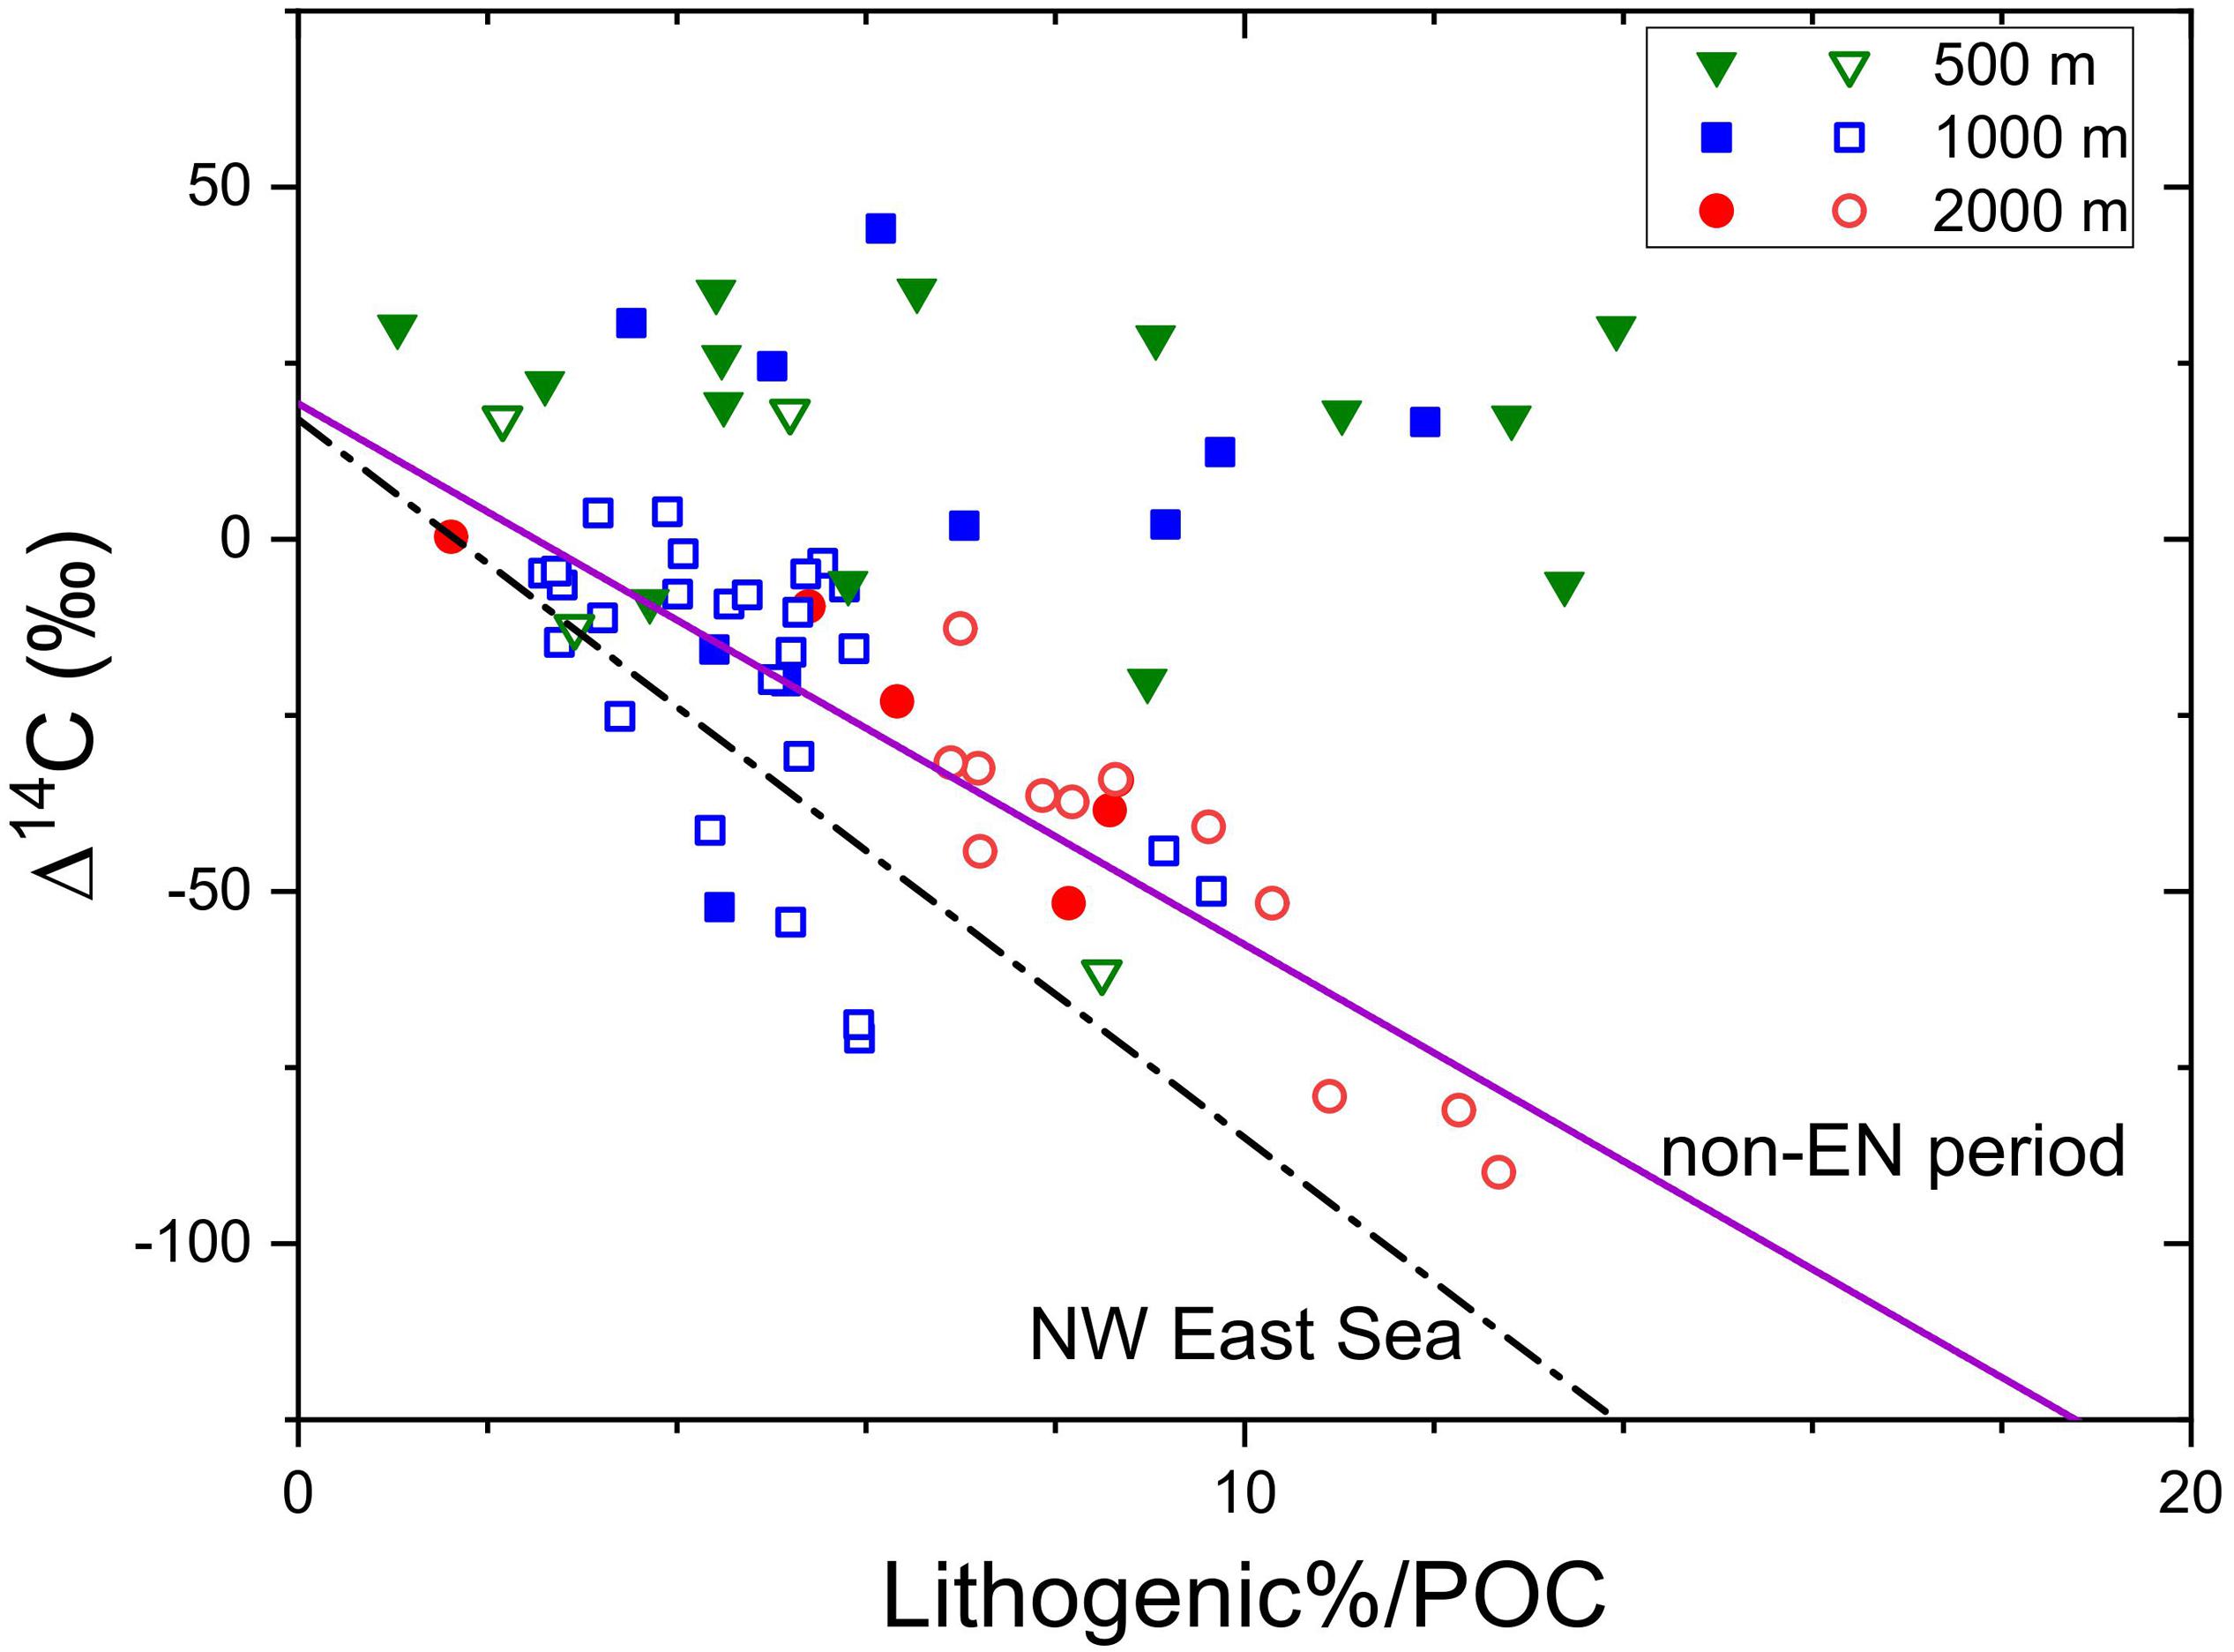
Figure 6. Δ14C values (‰) against the ratio of the content of lithogenic material to the POC of sinking particles. Open and closed symbols denote the non-EN and EN periods, respectively. Data from Station EC1 are included as non-EN period samples (Kim et al., 2017). The solid line denotes the linear fit of the non-EN period data and the dashed line denotes the linear fit of Japan Basin (Northwest East Sea; Otosaka et al., 2008; Kim et al., submitted).
The content and flux of excess Mn [i.e., Mn in excess of the Mn/Al ratio of the continental crust; excess Mn = Mnobserved – Alobserved × (Mn/Al)crust] were also consistent with the possible different sediment source areas noted above (Figure 4). The surface sediment in the central basin is reddish brown and enriched with Mn oxide, while the sediment of the slope are gray-brown (Hyun, 2016). The Mn content in the Ulleung Basin was up to 15,000 ppm, but was significantly lower (∼500 ppm) on shelf and slope. The lowest Mn content (∼250 ppm) was reported near the Korea Strait (Cha et al., 2007). Sediments in the central regions of the Japan Basin and the Yamato Basin also have significantly higher Mn contents than surrounding shelf/slope sediments (Otosaka et al., 2004). Consequently, the low excess Mn values in the EN period compared with the non-EN period imply that the lithogenic material at 500 m and 1000 m originated from resuspension of shelf/slope sediments rather than those underlying the central basin during the EN period.
Quantification of the relative contribution of autochthonous versus allochthonous (resuspended) POC based on Δ14C mass balance is challenging because of the uncertainty in the provenance of advected material. We used the Δ14C values of the Korea Strait region and the southwestern shelf/slope of the Ulleung Basin (−108‰, which is an average of 4 values obtained from this region) as the putative source for the 500 m and 1000 m samples in the EN period, and a lower Δ14C value of the western Japan Basin (−375‰; Otosaka et al., 2008) as the source of the 2000 m samples in the EN period as well as those at all depths in the non-EN period. A Δ14C value of 30‰ was used for freshly produced POC in the surface water (Kim et al., 2017). Using the mean Δ14C value at each trap depth in the two periods, we estimate the contribution of resuspended sediment to sinking POC to be ca. 11, 12, and 19% for the 500 m, 1000 m, and 2000 m samples in the non-EN period, and ca. 10, 16, and 14% for the corresponding depths in the EN period. These estimates are heavily dependent on the selected value for the allochthonous end-member, which remains highly uncertain. For example, adopting the Δ14C value of surface sediments from the central Ulleung Basin instead of the western Japan Basin, the estimated contribution from resuspended sediment increases to 50% for the 2000 m samples in the non-EN period. The actual contribution of resuspended sediment to sinking particles is likely between these two extreme cases. Additional Δ14C and geochemical measurements to constrain sediment provenance, together with improved knowledge of the currents that entrain and transport resuspended particles are needed for more robust assessment of the contribution of resuspended sedimentary POC to sinking particles.
Potential Connection Between the Particle Flux and the Regional Climate in the EJS
Connections and the underlying mechanisms linking ENSO and biophysical properties such as temperature, sea surface height, and primary production in the Ulleung Basin are not fully understood. Some studies have suggested a potential impact of ENSO on the NPP in the Ulleung Basin via cascading influence of this tropical phenomenon on the strength of the Kuroshio Current that in turn influences volume transport through the Korea Strait and mixed layer thickness (Toba et al., 2001; Yoo and Kim, 2004). However, these linkages need to be elucidated. Our results suggest that the El Niño may exert a strong influence on the efficiency of particle mobilization and export, with sediment resuspension and lateral transport potentially serving as a stronger vector than biogenic particle production in the Ulleung Basin.
A noteworthy feature in the Ulleung Basin during the 2015/16 El Niño was the development of a warm core eddy that persisted in the study region for protracted period of time (from September 2014 to August 2016; Jin et al., 2019; Figure 7). Enhanced biological activity and export flux associated with warm-core eddies have been well reported (e.g., Mahadevan et al., 2008; Shih et al., 2015). Eddy-driven subduction may have enhanced the export of biological particles (Boyd et al., 2019; Resplandy et al., 2019). Mesoscale eddy has also been invoked in sediment mobilization and transport (Zhang et al., 2014). Observations from 1993 to 2017 showed that up to 81% of the warm eddies in the Ulleung Basin were related to the EKWC (Shin et al., 2019). A strong EKWC could have entrained sediment during its passage along the western shelf of the Ulleung Basin, and these resuspended particles could have been further transported along the northern rim of the eddy to the mooring site (Figure 7). Further studies are needed to evaluate whether persistent eddies are characteristic of El Niño years in the Ulleung Basin (Yun et al., 2016), and if they are responsible for transporting resuspended sediments.
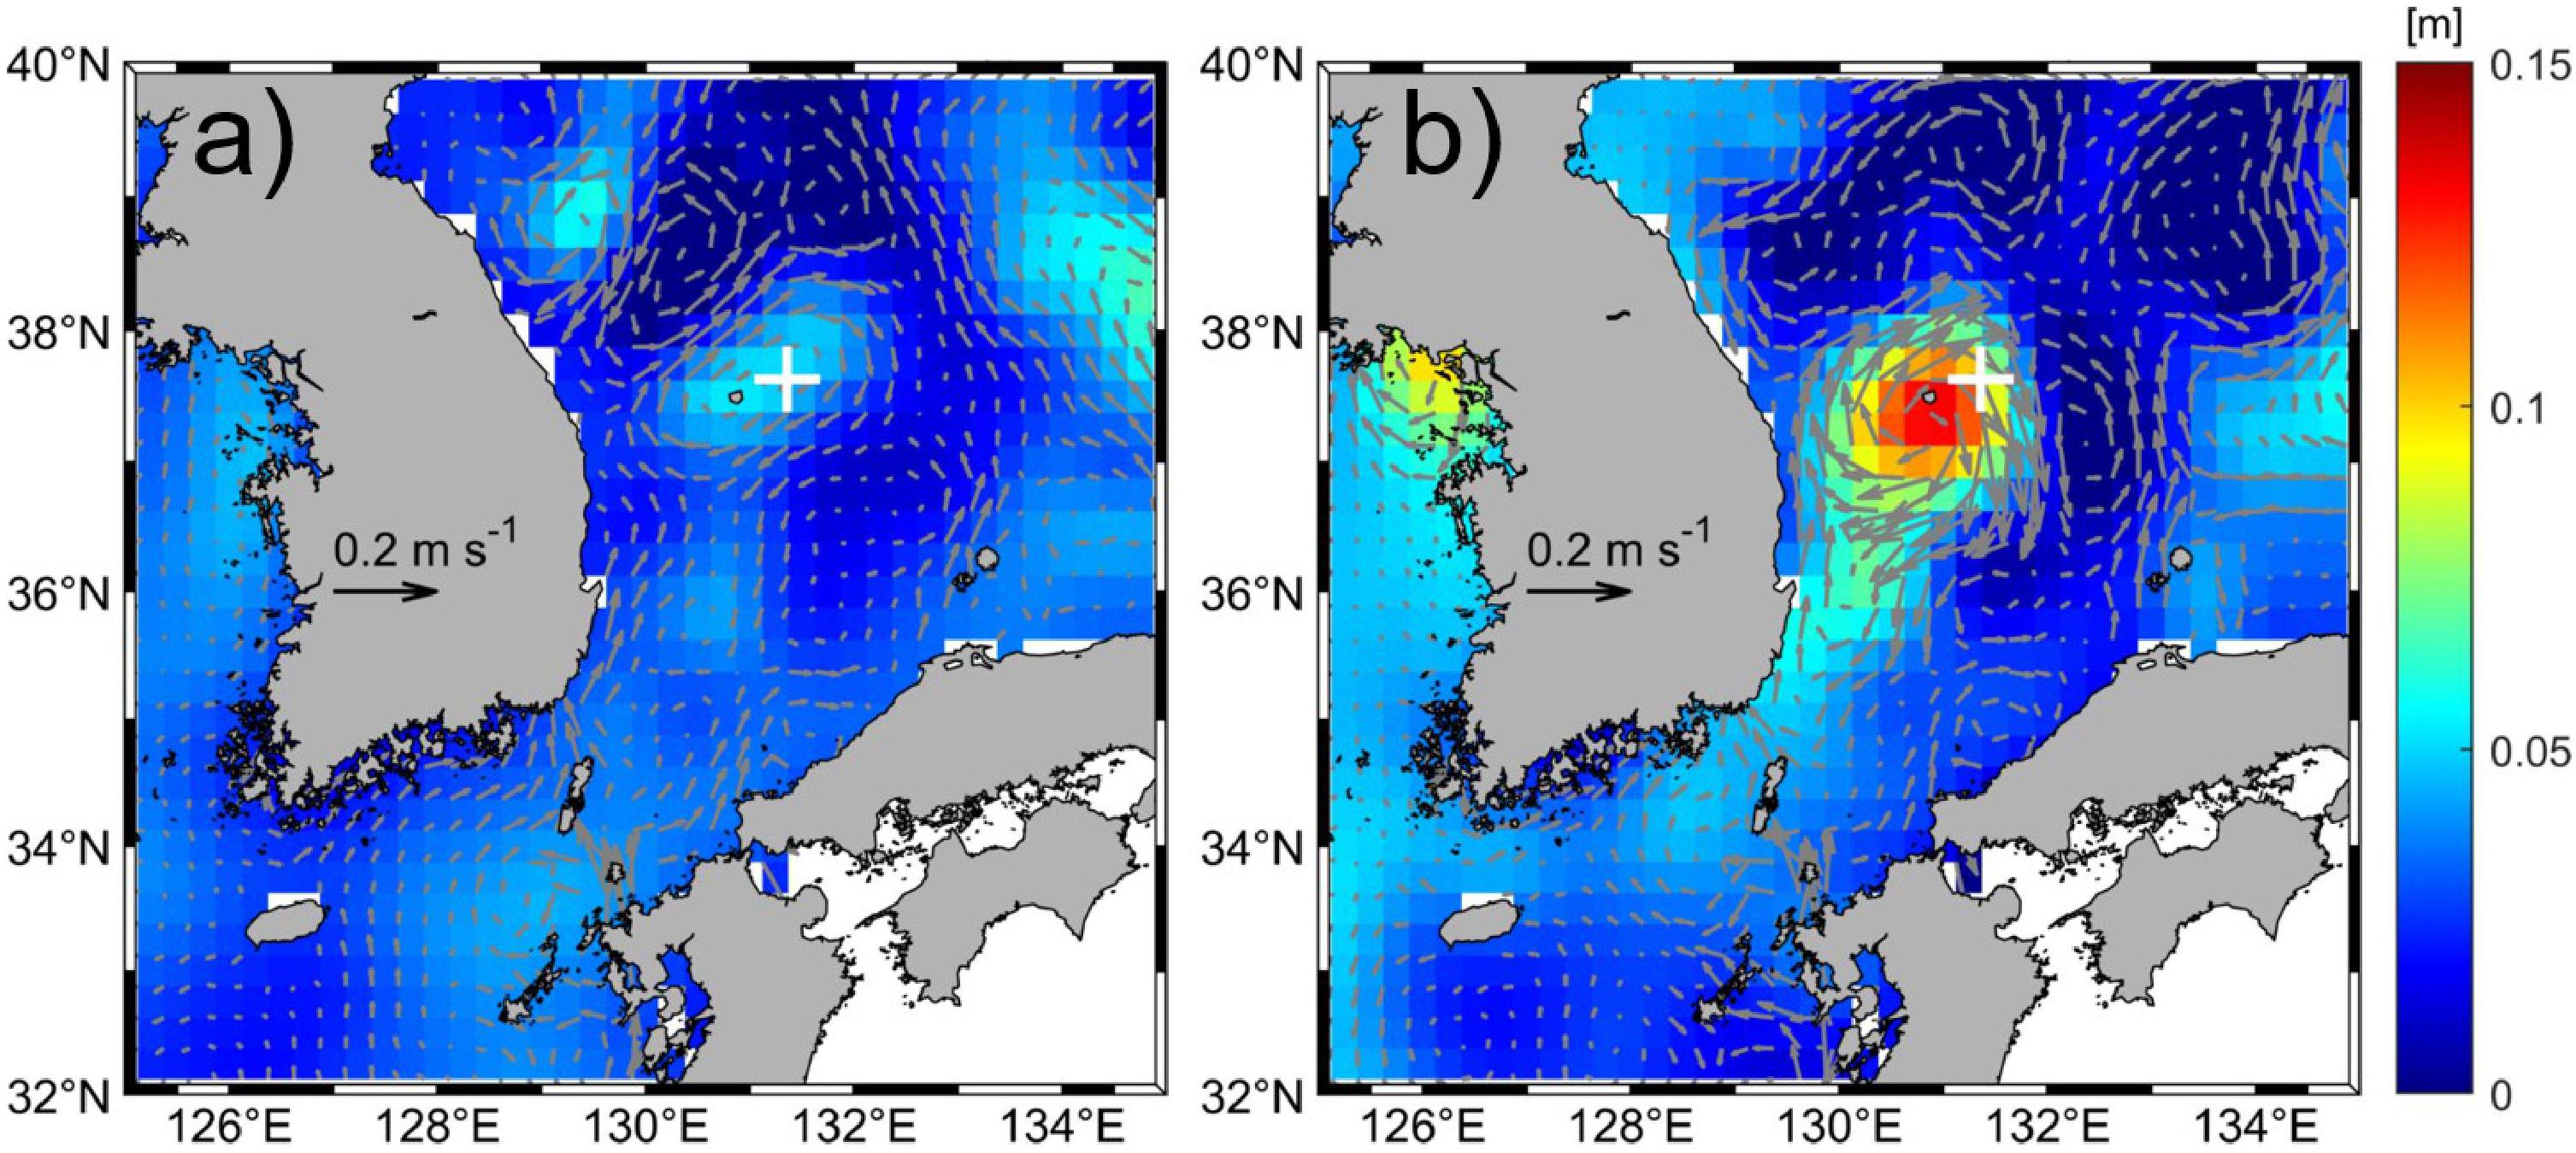
Figure 7. Mean sea surface height (colors) and corresponding geostrophic surface currents (arrows) averaged over (a) the non-EN period from July 2011 to March 2014 and (b) the EN period from June 2014 to September 2016, estimated from the multi-mission altimeter-based gridded sea surface height data (horizontal resolution of 0.25° grid with error variance of 1.4 cm2) of the Copernicus Marine Environment Monitoring Service (Taburet et al., 2019).
Data Availability Statement
All datasets generated for this study are included in the article/Supplementary Material.
Author Contributions
Y-IK and JH designed the study. MK, KC, CK, YR, NH, and TE did sample analyses and/or data interpretation. J-EP, J-HP, K-AP, and SN provided satellite-based data and interpretation. MK and JH lead manuscript writing. All authors contributed to the manuscript writing through discussion on the manuscript.
Funding
This research was partly supported by the project titled “Biogeochemical cycling and marine environmental change studies (PE99821).” This research was also partly supported by the project titled “Deep Water Circulation and Material Cycling in the East Sea (20160040),” funded by the Ministry of Oceans and Fisheries, Korea. MK was partly supported by the National Research Foundation of Korea grant funded by the Korean Government (Young Researchers’ Exchange Programme between Korea and Switzerland 2017–2018: NRF-2017K1A3A1A14092122).
Conflict of Interest
The authors declare that the research was conducted in the absence of any commercial or financial relationships that could be construed as a potential conflict of interest.
Acknowledgments
We thank Yun-Bae Kim and Suyun Noh for providing current data and discussion on the draft of the manuscript. We also thank captains and crews of the survey vessel Haeyang 2000 and the R/V Eardo and the Laboratory of Ion Beam Physics at ETHZ for support with the AMS measurements.
Supplementary Material
The Supplementary Material for this article can be found online at: https://www.frontiersin.org/articles/10.3389/feart.2020.00144/full#supplementary-material
Footnotes
References
Armstrong, R. A., Lee, C., Hedges, J. I., Honjo, S., and Wakeham, S. G. (2001). A new, mechanistic model for organic carbon fluxes in the ocean based on the quantitative association of POC with ballast minerals. Deep Sea Res. II 49, 219–236.
Behrenfeld, M. J., and Falkowski, P. G. (1997). Photosynthetic rates derived from satellite-based chlorophyll concentration. Limnol. Oceanogr. 42, 1–20.
Boyd, P. W., Claustre, H., Levy, M., Siegel, D. A., and Weber, T. (2019). Multi-faceted particle pumps drive carbon sequestration in the ocean. Nature 568, 327–335.
Cha, H. J., Choi, M. S., Lee, C. B., and Shin, D. H. (2007). Geochemistry of surface sediments in the southwestern East/Japan Sea. J. Asian Earth Sci. 29, 685–697. doi: 10.1016/j.jseaes.2006.04.009
Chae, H. J., and Park, K. (2009). Characteristics of speckle errors of SeaWiFS chlorophyll-α concentration in the East Sea. J. Korean Earth Sci. Soc. 30, 234–246. doi: 10.5467/jkess.2009.30.2.234
Chae, J. Y., Jeon, C., Park, S. J., and Park, J. H. (2018). Behavior of Diurnal Internal Waves in the Southwestern East/Japan Sea. J. Coastal Res. 85, 486–490. doi: 10.2112/SI85-098.1
Chang, K. I., Hogg, N. G., Suk, M. S., Byun, S. K., Kim, Y. G., and Kim, K. (2002). Mean flow and variability in the southwestern East Sea. Deep Sea Res. I. 49, 2261–2279.
Chen, C. T. A., Lui, H.-K., Hsieh, C. H., Yanagi, T., Kosugi, N., Ishii, M., et al. (2017). Deep oceans may acidify faster than anticipated due to global warming. Nat. Clim. Change 7, 890–894. doi: 10.1038/s41558-017-0003-y
Chiba, S., Aita, M. N., Tadokoro, K., Saino, T., Sugisaki, H., and Nakata, K. (2008). From climate regime shifts to lower-trophic level phenology: synthesis of recent progress in retrospective studies of the western North Pacific. Prog. Oceanogr. 77, 112–126. doi: 10.1016/j.pocean.2008.03.004
Christl, M., Vockenhuber, C., Kubik, P. W., Wacker, L., Lachner, J., Alfimov, V., et al. (2013). The ETH Zürich AMS facilities: performance parameters and reference materials. Nucl. Instrum. Methods Phys. Res. 294, 29–38. doi: 10.1016/j.nimb.2012.03.004
Haghipour, N., Ausin, B., Usman, M. O., Ishikawa, N., Wacker, L., Welte, C., et al. (2019). Compound-specific radiocarbon analysis by elemental analyzer–accelerator mass spectrometry: precision and limitations. Anal. Chem. 91, 2042–2049. doi: 10.1021/acs.analchem.8b04491
Honda, M. C., Kusakabe, M., Nakabayashi, S., and Katagiri, M. (2000). Radiocarbon of sediment trap samples from the Okinawa trough: lateral transport of 14C-poor sediment from the continental slope. Mar. Chem. 68, 231–247.
Honjo, S., Dymond, J., Collier, R., and Manganini, S. J. (1995). Export production of particles to the interior of the equatorial Pacific Ocean during the 1992 EqPac experiment. Deep Sea Res. II. 42, 831–870. doi: 10.1016/0967-0645(95)00034-N
Hwang, J., Druffel, E. R., and Eglinton, T. I. (2010). Widespread influence of resuspended sediments on oceanic particulate organic carbon: insights from radiocarbon and aluminum contents in sinking particles. Glob. Biogeochem. Cycles 24:GB4016.
Hyun, J. H. (2016). “Microbial ecology and biogeochemical processes in the Ulleung Basin,” in Oceanography of the East Sea (Japan Sea), eds K. I. L. Chang, C. I. K. Zhang, C. Park, and D. J. Kang (Cham: Springer), 247–296.
Jin, H., Park, Y. G., Pak, G., and Kim, Y. H. (2019). On the Persistence of Warm Eddies in the East Sea. Sea 24, 318–331. doi: 10.7850/JKSO.2019.24.2.318
Joo, H., Park, J. W., Son, S., Noh, J. H., Jeong, J. Y., Kwak, J. H., et al. (2014). Long-term annual primary production in the Ulleung Basin as a biological hot spot in the East/Japan Sea. J. Geophys. Res. 119, 3002–3011.
Joo, H., Son, S., Park, J. W., Kang, J. J., Jeong, J. Y., Kwon, J. I., et al. (2017). Small phytoplankton contribution to the total primary production in the highly productive Ulleung Basin in the East/Japan Sea. Deep Sea Res. II 143, 54–61. doi: 10.1016/j.dsr2.2017.06.007
Kameda, T. (2003). Studies on oceanic primary production using ocean color remote sensing data. Bull. Fish. Res. Agency 9, 118–148.
Kameda, T., and Ishizaka, J. (2005). Size-fractionated primary production estimated by a two-phytoplankton community model applicable to ocean color remote sensing. J. Oceanogr. 61, 663–672. doi: 10.1007/s10872-005-0074-7
Kawahata, H., Suzuki, A., and Ohta, H. (2000). Export fluxes in the western Pacific warm pool. Deep Sea Res. I 47, 2061–2091. doi: 10.1016/S0967-0637(00)00025-X
Kim, H. J., Hyeong, K., Park, J. Y., Jeong, J. H., Jeon, D., Kim, E., et al. (2014). Influence of Asian monsoon and ENSO events on particle fluxes in the western subtropical Pacific. Deep Sea Res. I 90, 139–151. doi: 10.1016/j.dsr.2014.05.002
Kim, H. J., Kim, D., Yoo, C. M., Chi, S. B., Khim, B. K., Shin, H. R., et al. (2011). Influence of ENSO variability on sinking-particle fluxes in the northeastern equatorial Pacific. Deep Sea Res. I 58, 865–874.
Kim, H. J., Kim, T. W., Hyeong, K., Yeh, S. W., Park, J. Y., Yoo, C. M., et al. (2019). Suppressed CO2 outgassing by an enhanced biological pump in the Eastern Tropical Pacific. J. Geophys. Res. 124, 7962–7973. doi: 10.1029/2019JC015287
Kim, M., Hwang, J., Rho, T., Lee, T., Kang, D. J., Chang, K. I., et al. (2017). Biogeochemical properties of sinking particles in the southwestern part of the East Sea (Japan Sea). J. Mar. Syst. 167, 33–42.
Kim, M., Hwang, J., Druffel, E. R., and Eglinton, T. I (submitted). Lateral particle supply as a key vector in the oceanic carbon cycle. Glob. Biogeochem. Cycles
Kwak, J. H., Lee, S. H., Park, H. J., Choy, E. J., Jeong, H. D., Kim, K. R., et al. (2013). Monthly measured primary and new productivities in the Ulleung Basin as a biological “hot spot” in the East/Japan Sea. Biogeosciences 10, 4405–4417. doi: 10.5194/bg-10-4405-2013
Laws, E. A., D’Sa, E., Naik, P. J. L., and Methods, O. (2011). Simple equations to estimate ratios of new or export production to total production from satellite-derived estimates of sea surface temperature and primary production. Limnol. Oceanogr. Meth. 9, 593–601. doi: 10.4319/lom.2011.9.593
Lee, S. H., Yun, M. S., Kim, B. K., Joo, H., Kang, S. H., Kang, C. K., et al. (2013). Contribution of small phytoplankton to total primary production in the Chukchi Sea. Cont. Shelf Res. 68, 43–50. doi: 10.1016/j.csr.2013.08.008
Li, W. K., McLaughlin, F. A., Lovejoy, C., and Carmack, E. C. (2009). Smallest algae thrive as the Arctic Ocean freshens. Science 326:539. doi: 10.1126/science.1179798
Mahadevan, A., Thomas, L. N., and Tandon, A. (2008). Comment on “eddy/wind interactions stimulate extraordinary mid-ocean plankton blooms”. Science 320:448. doi: 10.1126/science.1152111
McIntyre, C. P., Wacker, L., Haghipour, N., Blattmann, T. M., Fahrni, S., Usman, M., et al. (2017). Online 13 C and 14 C Gas measurements by EA-IRMS–AMS at ETH Zürich. Radiocarbon 59, 893–903. doi: 10.1017/RDC.2016.68
Na, T., Hwang, J., Kim, S., Jeong, S., Rho, T., and Lee, T. (2019). Acidification -vunerable carbonate system of the East Sea (Japan Sea). Biogeosci. Discuss doi: 10.5194/bg-2019-474
Noh, S., and Nam, S. (2018). Data from: EC1, mooring time-series since 1996. SEANOE doi: 10.17882/58134
Otosaka, S., Tanaka, T., Togawa, O., Amano, H., Karasev, E. V., Minakawa, M., et al. (2008). Deep sea circulation of particulate organic carbon in the Japan Sea. J. Oceanogr. 64, 911–923.
Otosaka, S., Togawa, O., Baba, M., Karasev, E., Volkov, T. N., Omata, N., et al. (2004). Lithogenic flux in the Japan Sea measured with sediment traps. Mar. Chem. 91, 143–163.
Park, K. A., Chae, H. J., and Park, J. E. (2013). Characteristics of satellite chlorophyll-a concentration speckles and a removal method in a composite process in the East/Japan Sea. Int. J. Remote Sens. 34, 4610–4635.
Resplandy, L., Lévy, M., and McGillicuddy, D. J. Jr. (2019). Effects of eddy-driven subduction on ocean biological carbon pump. Glob. Biogeochem. Cycles 33, 1071–1084. doi: 10.1029/2018GB006125
Shih, Y. Y., Hung, C. C., Gong, G. C., Chung, W. C., Wang, Y. H., Lee, I. H., et al. (2015). Enhanced particulate organic carbon export at eddy edges in the oligotrophic Western North Pacific Ocean. PLoS One 10:e0131538. doi: 10.1371/journal.pone.0131538
Shin, H. R., Kim, I., Kim, D., Kim, C. H., Kang, B., and Lee, E. (2019). Physical characteristics and classification of the Ulleung Warm Eddy in the East Sea (Japan Sea). Sea 24, 298–317. doi: 10.7850/jkso.2019.24.2.298
Taburet, G., Sanchez-Roman, A., Ballarotta, M., Pujol, M. I., Legeais, J. F., Fournier, F., et al. (2019). DUACS DT-2018: 25 years of reprocessed sea level altimeter products. Ocean Sci. 15, 1207–1224. doi: 10.5194/os-2018-150
Taylor, S. R., and McLennan, S. M. (1985). The Continental Crust: Its Composition and Evolution. Oxford: Blackwell Sci.
Toba, Y., Kimura, J., Murakami, H., Kim, M., Yoshikawa, Y., and Shimada, K. (2001). Unusual behavior of the kuroshio current system from Winter 1996 to Summer 1997 Revealed by ADEOS-OCTS and other Data (continued): a study from broad external conditions with bottom topography. J. Oceanogr. 57, 141–154. doi: 10.1023/A:1011187023116
Yamada, K., Ishizaka, J., and Hagata, H. (2005). Spatial and temporal variability of satellite primary production in the Japan Sea from 1998 to 2002. J. Oceanogr. 61, 857–869.
Yoo, S., and Kim, H. C. (2004). Suppression and enhancement of the spring bloom in the southwestern East Sea/Japan Sea. Deep Sea Res. II 51, 1093–1111. doi: 10.1016/j.dsr2.2003.10.008
Yumimoto, K., and Takemura, T. (2015). Long-term inverse modeling of Asian dust: interannual variations of its emission, transport, deposition, and radiative forcing. J. Geophys. Res. 120, 1582–1607. doi: 10.1002/2014JD022390
Yun, J. Y., Chang, K. I., Kim, K. Y., Cho, Y. K., Park, K. A., and Magaard, L. (2016). ENSO teleconnection to the isopycnal depth fluctuations of the East/Japan Sea Intermediate Water in the Ulleung Basin during 1968-2002. J. Phys. Oceanogr. 46, 2675–2694. doi: 10.1175/JPO-D-15-0225.1
Keywords: biological carbon pump, particulate organic carbon, sediment resuspension, sediment trap, lithogenic material, ENSO
Citation: Kim M, Kim Y-I, Hwang J, Choi KY, Kim CJ, Ryu Y, Park J-E, Park K-A, Park J-H, Nam S, Haghipour N and Eglinton TI (2020) Influence of Sediment Resuspension on the Biological Pump of the Southwestern East Sea (Japan Sea). Front. Earth Sci. 8:144. doi: 10.3389/feart.2020.00144
Received: 27 February 2020; Accepted: 17 April 2020;
Published: 19 May 2020.
Edited by:
Makio Honda, Japan Agency for Marine-Earth Science and Technology (JAMSTEC), JapanReviewed by:
Shigeyoshi Otosaka, The University of Tokyo, JapanTing Hsuan Huang, National Sun Yat-sen University, Taiwan
Copyright © 2020 Kim, Kim, Hwang, Choi, Kim, Ryu, Park, Park, Park, Nam, Haghipour and Eglinton. This is an open-access article distributed under the terms of the Creative Commons Attribution License (CC BY). The use, distribution or reproduction in other forums is permitted, provided the original author(s) and the copyright owner(s) are credited and that the original publication in this journal is cited, in accordance with accepted academic practice. No use, distribution or reproduction is permitted which does not comply with these terms.
*Correspondence: Young-Il Kim, yikim@kiost.ac; Jeomshik Hwang, jeomshik@snu.ac.kr
†Present address: Minkyoung Kim, Geological Institute, ETH Zürich, Zurich, Switzerland