Responses of a Natural Phytoplankton Community From the Drake Passage to Two Predicted Climate Change Scenarios
 Franziska Pausch1,2*
  Florian Koch1
  Christel Hassler3,4
  Astrid Bracher5,6 Kai Bischof2
  Scarlett Trimborn1,2
- 1EcoTrace, Alfred Wegener Institute, Helmholtz Centre for Polar and Marine Research, Bremerhaven, Germany
- 2Marine Botany, University of Bremen, Bremen, Germany
- 3Department F.-A. Forel for Environmental and Aquatic Science, University of Geneva, Geneva, Switzerland
- 4Swiss Polar Institute, Ecole Polytechnique Fédérale de Lausanne, Lausanne, Switzerland
- 5Phytooptics, Alfred Wegener Institute, Helmholtz Centre for Polar and Marine Research, Bremerhaven, Germany
- 6Institute of Environmental Physics, University of Bremen, Bremen, Germany
Contrasting models predict two different climate change scenarios for the Southern Ocean (SO), forecasting either less or stronger vertical mixing of the water column. To investigate the responses of SO phytoplankton to these future conditions, we sampled a natural diatom dominated (63%) community from today’s relatively moderately mixed Drake Passage waters with both low availabilities of iron (Fe) and light. The phytoplankton community was then incubated at these ambient open ocean conditions (low Fe and low light, moderate mixing treatment), representing a control treatment. In addition, the phytoplankton was grown under two future mixing scenarios based on current climate model predictions. Mixing was simulated by changes in light and Fe availabilities. The two future scenarios consisted of a low mixing scenario (low Fe and higher light) and a strong mixing scenario (high Fe and low light). In addition, communities of each mixing scenario were exposed to ambient and low pH, the latter simulating ocean acidification (OA). The effects of the scenarios on particulate organic carbon (POC) production, trace metal to carbon ratios, photophysiology and the relative numerical contribution of diatoms and nanoflagellates were assessed. During the first growth phase, at ambient pH both future mixing scenarios promoted the numerical abundance of diatoms (∼75%) relative to nanoflagellates. This positive effect, however, vanished in response to OA in the communities of both future mixing scenarios (∼65%), with different effects for their productivity. At the end of the experiment, diatoms remained numerically the most abundant phytoplankton group across all treatments (∼80%). In addition, POC production was increased in the two future mixing scenarios under OA. Overall, this study suggests a continued numerical dominance of diatoms as well as higher carbon fixation in response to both future mixing scenarios under OA, irrespective of different changes in light and Fe availability.
Introduction
The Southern Ocean (SO), south of the Antarctic Polar Front (at 50°S), contributes for 10% of the global surface ocean area and acts as a disproportionally high carbon sink, accounting for about 20% of the oceanic uptake of anthropogenic CO2, due to both the solubility pump and the biological pump (Takahashi et al., 2002; Sabine et al., 2004; Arrigo et al., 2008). Through the formation of deep water, the SO plays a key role in the transport of carbon, nutrients and heat into the deeper waters of the global ocean (Mikaloff Fletcher et al., 2006; Khatiwala et al., 2009; Frölicher et al., 2015). Despite high concentrations of macronutrients like nitrate, phosphate and silicate, primary production in many parts of the SO is low, a phenomenon driven by the low availability of trace metals, especially iron (Fe; Martin, 1990; de Baar et al., 1995; Smetacek et al., 2012). Next to Fe availability, irradiance is another important factor shaping SO phytoplankton community structure (Carvalho et al., 2017). The depth of the surface mixed layer (MLD) varies during the course of the year and determines the amount of solar radiation that is available for photosynthesis by phytoplankton cells (Behrenfeld and Boss, 2014; Smith and Jones, 2015). Sverdrup (1953) proposed the critical depth model, which states that phytoplankton blooms can only develop in mixed layers that are shallower than the depth, at which respiration and photosynthesis balance each other, termed the critical depth. In the SO, strong westerly winds over the Antarctic Circumpolar Current (ACC) strongly influence the MLD (Meijers, 2014).
Due to changes in the global climate system caused by ongoing anthropogenic emissions of greenhouse gases, wind patterns and melting rates of sea ice and the Antarctic ice shields are predicted to be altered and based on these assumptions two different climate scenarios for the SO are projected for the end of this century (Boyd and Law, 2011; Meijers, 2014; Deppeler and Davidson, 2017). One climate scenario predicts an increase in sea surface temperature, resulting in a more stratified water column and a reduced MLD. This will lead to an increase in the mean solar radiation available to phytoplankton cells, while simultaneously decreasing the nutrient supply (including Fe) from deeper water layers (Lovenduski and Gruber, 2005; Petrou et al., 2016). The second climate scenario predicts a poleward shift and strengthening of the westerly winds, which will deepen the MLD and thus counteract the stratification caused by warming (Meijers, 2014; Hauck et al., 2015; Panassa et al., 2018). A deeper MLD would reduce the mean solar irradiance level that phytoplankton will be exposed to, but increase nutrient input, including Fe, from deeper nutrient-rich waters (Laufkötter et al., 2015; Deppeler and Davidson, 2017).
At the same time, the scenarios will be accompanied by ocean acidification (OA) as atmospheric CO2 concentrations are projected to rise from present day values of ∼410 to up to ∼1300 μatm by 2100, leading to a decrease of surface ocean seawater pH of up to 0.32 (RCP 8.5; IPCC, 2014). The increased dissolution of CO2 in the surface ocean will alter the carbonate chemistry of the seawater and lead to a decrease in pH due to an increase of hydrogen ions (Wolf-Gladrow et al., 1999). The polar regions will be particularly affected by global change due to a higher degree of acidification of cold waters and above average warming (Bopp et al., 2001; Sarmiento et al., 2004). Studies suggest that OA may affect the bioavailability of Fe (Millero et al., 2009). Most of the dissolved Fe is bound to organic ligands such as humic substances, exopolymeric substances, and siderophores with different effects on Fe bioavailability (Hutchins et al., 1999; Laglera and Van Den Berg, 2009; Hassler et al., 2011). The reduced pH due to OA could alter the affinity of these ligands for binding Fe(III), making it less bioavailable for phytoplankton (Shi et al., 2010).
So far, several studies have been conducted to investigate the effects of changes in Fe availability in combination with OA (Shi et al., 2010; Hoppe et al., 2013; Trimborn et al., 2017b; Koch et al., 2018; McQuaid et al., 2018) or with different irradiance levels (Van Leeuwe and Stefels, 1998, 2007; Timmermans et al., 2001; Hoffmann et al., 2008; Petrou et al., 2011; Alderkamp et al., 2012; Trimborn et al., 2019), but only few studies have examined all factors together (Feng et al., 2010, 2020; Xu et al., 2014; Boyd et al., 2016; Andrew et al., 2019). Laboratory experiments investigating the responses of single species to multiple stressors may unravel their physiological strategies and previous studies have suggested that Fe availability might not always be the dominant driver (Feng et al., 2010; Xu et al., 2014). Xu et al. (2014) reported species-specific responses in growth and POC production of Phaeocystis antarctica and Fragilariopsis cylindrus in response to the interactive effects of OA, light, temperature and Fe availability. In their study, the diatom F. cylindrus benefited from projected future conditions and outcompeted the prymnesiophyte P. antarctica under increased irradiance levels, warming and OA regardless of Fe additions. However, a multiple stressor experiment including warming, light and Fe showed an increased thermal tolerance of various SO phytoplankton species (Chaetoceros flexuosus, Proboscia inermis, Thalassiosira antarctrica, and P. antarctica) under Fe-enriched conditions (Andrew et al., 2019). In another study, the exposure of the coccolithophore Emiliania huxleyi to a future scenario consisting of an enhanced irradiance level, reduced nutrient supply and elevated temperature in combination with OA, resulted in strong negative synergistic effects on genes regulating carbon acquisition and calcification (Feng et al., 2020).
Experiments with natural phytoplankton communities can provide environmentally relevant information on floristic shifts and potential changes of the carbon export potential of the community (Arrigo et al., 1999; Boyd et al., 2010). OA perturbation experiments with natural SO phytoplankton assemblages, investigating three or more environmental factors simultaneously are, however, still rare (Boyd et al., 2018; Seifert et al., 2020). When a natural phytoplankton community from the Ross Sea was exposed to high light levels and OA together, the diatom community shifted from the large, centric Chaetoceros species toward the smaller pennate Cylindrotheca species both under Fe-poor and Fe-enriched conditions (Feng et al., 2010). Since the SO (south of 50°S) accounts for 20% of the global annual primary production (Takahashi et al., 2002), subtle changes in SO community composition can alter carbon export fluxes with major implications for the global carbon cycle (Basu and Mackey, 2018).
In this study, we sampled a natural phytoplankton community from today’s relative moderately mixed Drake Passage waters with both low Fe and low light availabilities. The phytoplankton community was then incubated at these ambient conditions (low Fe and low light) as well as at conditions predicted to occur by current climate model predictions. Mixing was simulated by changes in light and Fe availabilities. The two future scenarios consisted of a low mixing scenario representing increased stratification with higher light levels and reduced Fe input and a strong mixing scenario mimicking increased mixing with reduced light availability under Fe-enriched conditions (Figure 1). In addition, all incubations were exposed to ambient and lowered pH to assess the potential impact of OA.
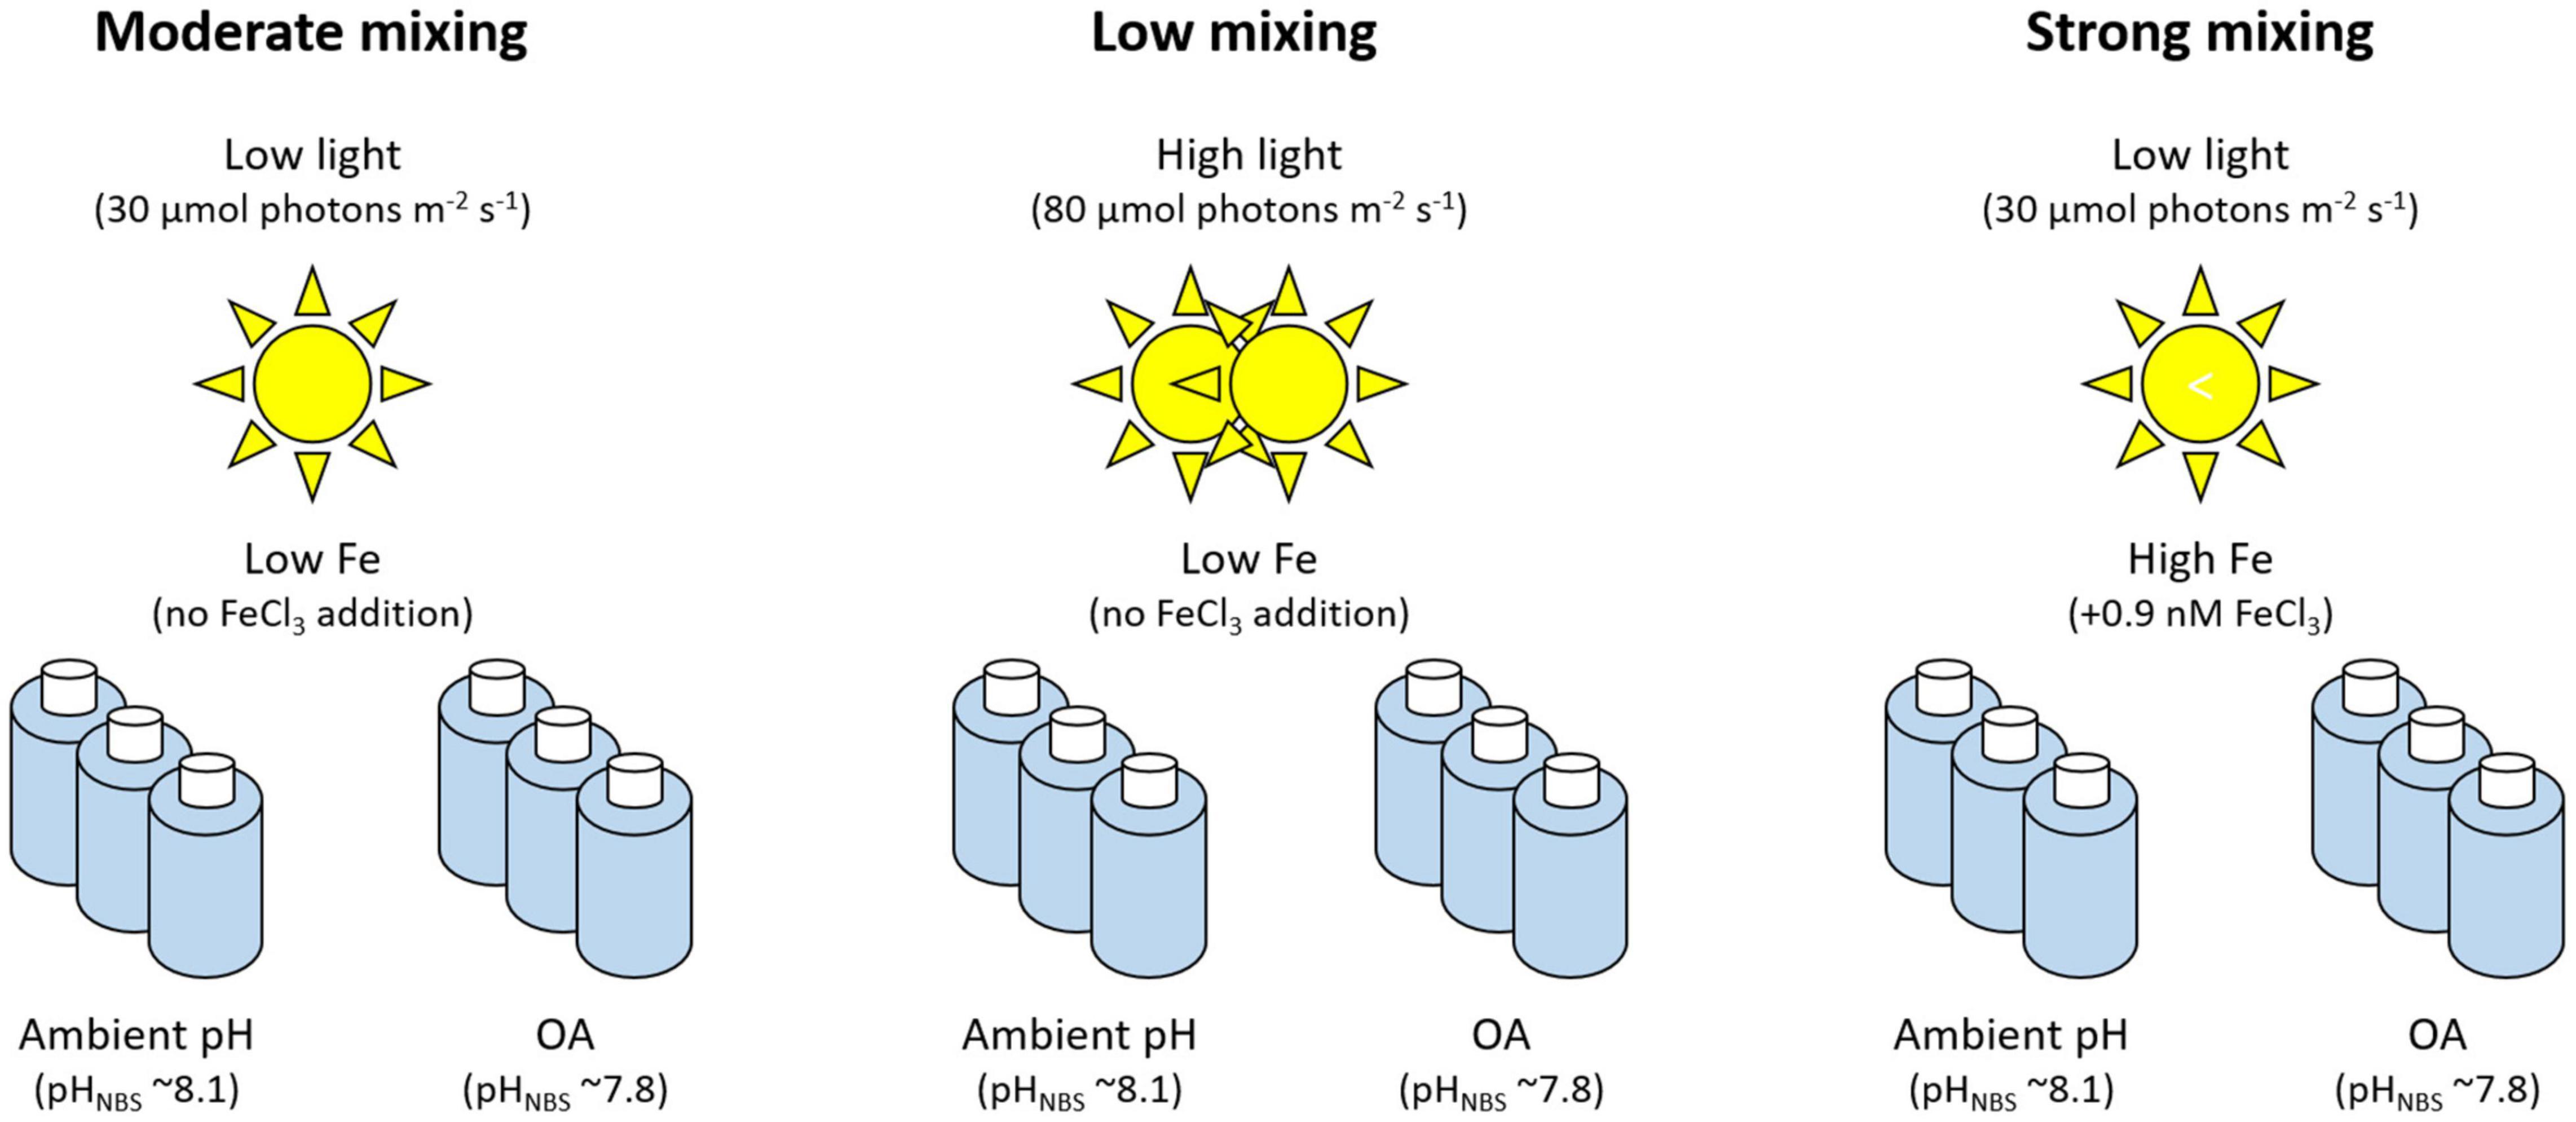
Figure 1. Overview of the experimental setup. The moderate mixing treatment at ambient pH represents current open ocean conditions (both low Fe and low light conditions) and thus serves as a control treatment. In addition, the phytoplankton was grown under two predicted future mixing scenarios (low and strong mixing) combined with ambient pH or ocean acidification (OA).
Materials and Methods
Experimental Setup
A shipboard bottle incubation experiment was performed with a natural phytoplankton community sampled on 2 March 2016 in the Drake Passage south of the Polar Front (60° 24.758′ S 66° 21.682′ W, BIO 1 station) during the RV Polarstern cruise PS97. Additional experiments were conducted at this sampling site to test how Fe associated with different organic ligands influenced Fe uptake rates and trace metal chemistry (Cabanes et al., 2020) as well as phytoplankton, microbial and viral abundances (Blanco-Ameijeiras et al., 2020). Furthermore, it was tested whether in addition to Fe, SO phytoplankton growth may also be limited by manganese availability (Balaguer et al., 2022).
A Teflon membrane pump was used to collect Antarctic seawater from 20 m depth, filtered through an acid-cleaned 200 μm mesh to exclude mesozooplankton and to fill 4 L polycarbonate (PC; Nalgene, Thermo Fisher Scientific, Waltham, MA, United States) bottles. All labware including the incubation bottles were cleaned prior to the cruise using standard trace metal (TM) clean techniques according to the Geotraces cookbook (Cutter et al., 2017). All TM work was conducted inside a TM clean container under a clean bench (US class 100) to avoid contamination. Since the water was collected in a high nutrient low chlorophyll region, Fe concentrations were low [dissolved Fe (dFe) = 0.03 nmol Fe L–1] and the low photosynthetic yield (Fv/Fm = 0.16 ± 0.03) of the plankton community was also indicative of low, Fe-limiting conditions. Samples for the biological and chemical characterization of the initial natural phytoplankton community were taken during seawater collection.
For the incubation experiment, Fe availability, light intensity and pH were manipulated to mimic today’s open ocean conditions and two potential SO future climate change scenarios (Figure 1). Using light-emitting diodes (LED) daylight lamps (SolarStinger LED Sun Strip Marine Daylight, Econlux, Cologne, Germany) light intensity were set to 30 μmol photons m–2 s–1 (hereafter referred to as low light) and to 80 μmol photons m–2 s–1 (hereafter referred to as high light). Based on previously published light attenuation coefficients for this region (Bracher and Tilzer, 2001), 30 μmol photons m–2 s–1 mimicked median light conditions experienced by the phytoplankton community at our sampling depth (20 m). In order to test the increased light availability modeled to coincide with future climatic conditions, we exposed the community to 80 μmol photons m–2 s–1, representing a realistic shallowing of the mixed layer. This range of light intensities was also used in previous studies (Timmermans et al., 2005; Passow and Laws, 2015; Coad et al., 2016; Trimborn et al., 2017a).
In addition to this, two pH levels were created by continuously gentle bubbling humidified air with pCO2 into the bottles using a gas flow controller (CGM 2000; MCZ Umwelttechnik, Bad Nauheim, Germany), using pure CO2 (Air Liquide Germany, Düsseldorf, Germany) mixed with CO2-free air (< 1 ppmv CO2; Dominick Hunter, Parker Hannifin, Cleveland, OH, United States). A non-dispersive infrared analyzer system (LI6252; LI-COR Biosciences, Lincoln, NE, United States) calibrated with CO2-free air and purchased gas mixtures of 150 ± 10 and 1,000 ± 20 ppmv CO2 (Air Liquide Germany) was used to calibrate and monitor the CO2 concentrations. The continuous bubbling with 400 and 1,000 ppmv CO2 resulted in pHNBS levels of 8.18 ± 0.04 (hereafter referred to as ambient pH) and of 7.83 ± 0.02 (hereafter referred to as OA), respectively (Table 1). In addition to the changes in light and pH, the phytoplankton community was grown either under the in situ Fe concentration of the natural seawater (hereafter referred to as low Fe) or enriched with 0.9 nmol L–1 FeCl3 (hereafter referred to as high Fe). Fe was added as FeCl3 (AAS standard, TraceCERT, Fluka, Honeywell International Inc., Charlotte, NC, United States) without the chelating agent ethylenediaminetetraacetic acid (EDTA). At the sampling location, the Fe binding ligands present in-situ were high enough (1.67 ± 0.03 nM) to fully chelate the added Fe, preventing the formation of Fe oxides (Cabanes et al., 2020).
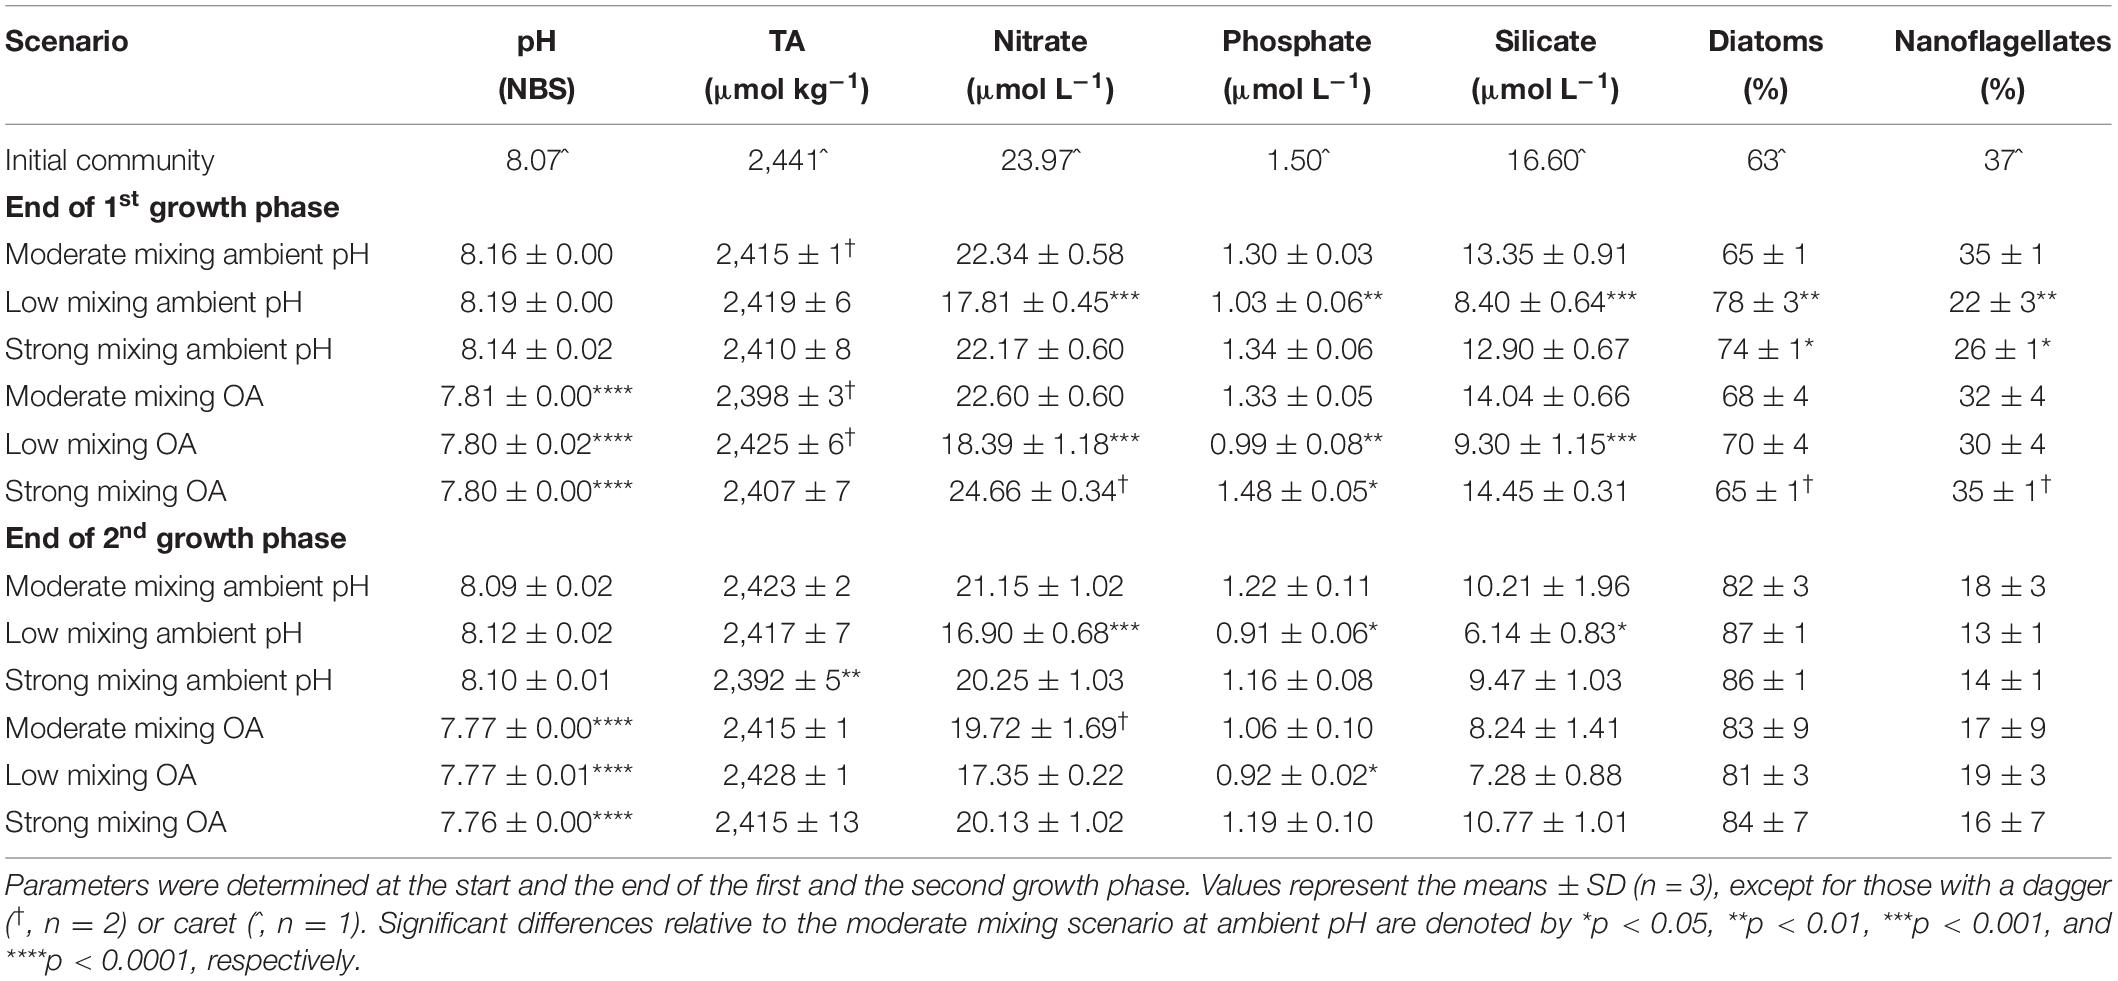
Table 1. Seawater pHNBS, total alkalinity (TA) and concentrations of the macronutrients nitrate, phosphate and silicate as well as relative proportions of diatoms and nanoflagellates (via microscope counts) of a natural Antarctic phytoplankton community grown under moderate mixing (low Fe and low light), low mixing (low Fe and high light) and strong mixing (high Fe and low light) exposed to ambient pH or ocean acidification (OA).
The “moderate mixing treatment” represents a control treatment, which mimics natural open ocean conditions, with the phytoplankton community grown at low light (30 μmol photons m–2 s–1) and low Fe availability (0.03 nmol L–1; Figure 1). The “low mixing scenario” consisted of high light (80 μmol photons m–2 s–1) and low Fe (0.03 nmol L–1) conditions while the “strong mixing scenario” exposed the phytoplankton community to low light (30 μmol photons m–2 s–1) and high Fe conditions (0.9 nmol L–1). All treatments were cultured at ambient pH or OA conditions and grown in triplicate bottles at 1°C. Mimicking the ambient light cycle at the season of sampling, treatments were exposed to a 16:8 h light:dark cycle. Since concentrations of macronutrients were high (23.97, 1.50 and 16.60 μmol L–1 for nitrate, phosphate, and silicic acid, respectively), no further macronutrients were added to the experimental bottles. Throughout the experiment, silicate and nitrate concentrations were monitored on board, ensuring that the communities did not run into macronutrient limitation (Figure 2 and Table 1). In order to maximize the effects of the different treatments, the experiment consisted of two growth phases. The first growth phase lasted 12 days for the low mixing treatment and 13 days for the moderate and strong mixing treatments, respectively. To start the second growth phase, a 200 mL aliquot from each bottle was then used to re-inoculate a fresh 4 L bottle, which was filled with the initially collected and 0.2 μm filtered seawater. These bottles were then grown under the same conditions as in the first growth phase for another 10 (low mixing ambient pH) or 11 days (low mixing OA) and 13 (moderate mixing ambient pH and strong mixing ambient pH) or 15 days (moderate mixing OA and strong mixing OA). Hereafter, the two growth phases prior and after the dilution will be referred to as first and second growth phase, respectively. At the end of each growth phase, the various parameters described below were collected from each bottle.
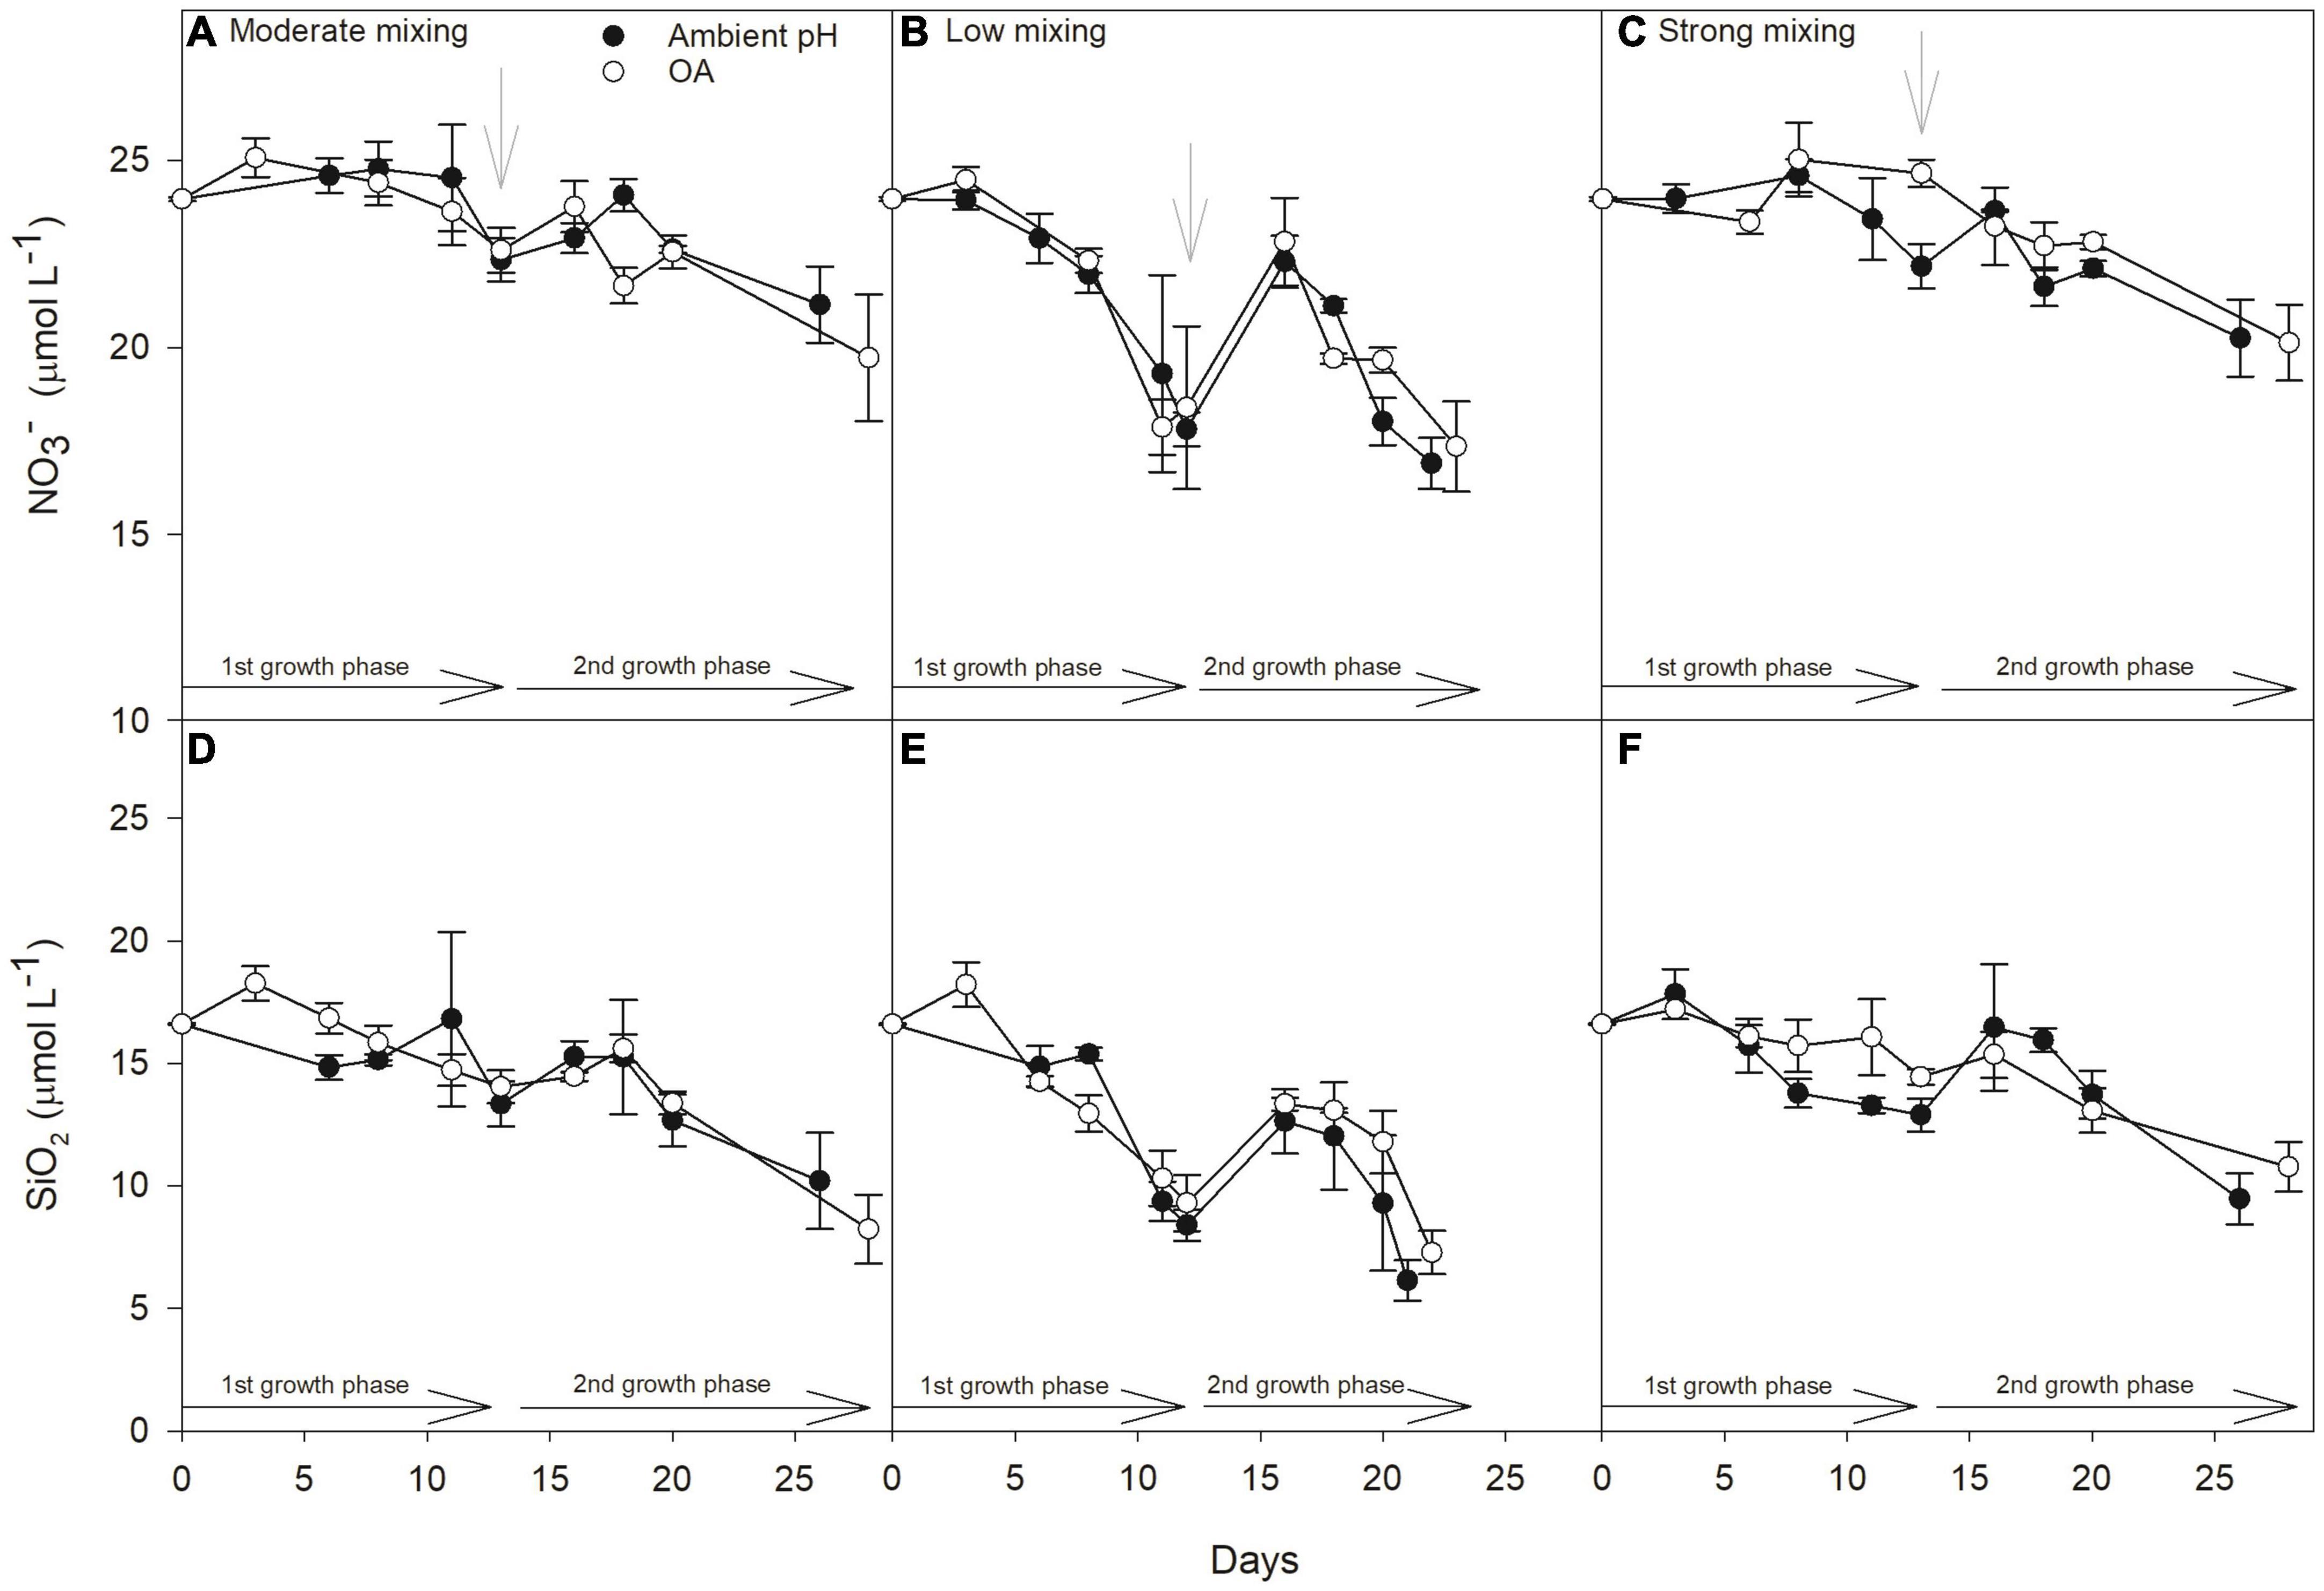
Figure 2. Development of nitrate (NO3–, μmol L–1) and silicate concentrations (SiO2, μmol L–1) during the incubation time of the experiment. Values are shown for the scenarios: moderate mixing (low Fe and low light; A,D), low mixing (low Fe and high light; B,E), and strong mixing (high Fe and low light; C,F) with open and solid circles representing treatments grown at ambient pH or OA, respectively. Gray arrows indicate the time of dilution with filtered seawater. The growth phase of the experiment is divided into before and after the dilution and denoted as first (1st growth phase) and second (2nd growth phase), respectively. Values represent the means ± SD (n = 3).
Seawater Chemistry
In order to analyze the seawater carbonate chemistry, samples for pH and total alkalinity (TA) were collected from all replicates at the start of the experiment as well as at the end of both growth phases (Table 1). Seawater pH was measured on the NBS scale with a pH-meter (827 pH mobile with Aquatrode plus Pt1000 electrode, Metrohm, Herisau, Switzerland) calibrated with a three-point calibration (buffers certified by National Institute of Standards and Technology). TA samples were taken from the filtrate of the pigment filtration (Whatman GF/F filter, 0.6 mm, Cytiva, Marlborough, MA, United States), fixed with 0.03% HgCl2, and stored at 4°C in 100 mL borosilicate flasks. TA samples were analyzed using duplicate potentiometric titration (Brewer et al., 1986) on a TitroLine alpha plus (SI Analytics, Weilheim, Germany) and calculated from linear Gran Plots (Gran, 1952). The instrument was calibrated with certified reference material (CRM provided by A. Dickson, Scripps Institute of Oceanography). Nitrate and silicate concentrations were measured colorimetrically on board during the incubation with a Technicon TRAACS 800 autoanalyser (SEAL Analytical, Mequon, WI, United States) according to the improved method after Grasshoff et al. (1999). Samples for the initial and final macronutrient concentrations for each growth phase were filtered through a 0.2 μm filter and stored in a falcon tube at −20°C. Macronutrient concentrations were determined with a QuAAtro autoanalyser (Seal Analytical) back in the laboratory using standard colorimetric techniques.
Particulate Trace Metals
Samples for particulate TM (Fe, Co, Cu, Mn, Zn) were collected onto 0.2 mm TM clean PC filters (Millipore, Merck, Darmstadt, Germany) at the beginning and end of each growth phase. To remove trace metals bound to the outside of the phytoplankton cells, the filters were rinsed for 15 min with a 0.1 M oxalic acid wash surface (Hassler and Schoemann, 2009). The filters were then rinsed with filtered seawater and placed into TM-cleaned 25 mL polyfluor alkoxy (PFA) vials. Before sample measurement, the samples were digested for 16 h at 180°C with a mixture of 5 mL sub-boiled HNO3 (distilled 65% HNO3, pro analysis, Merck) and 0.5 mL of sub-boiled HF (40%, suprapure, Merck; Ho et al., 2003; Twining and Baines, 2013). In a second step, 0.5 mL Milli-Q was added before the cell extract solution was concentrated at 140°C via evaporation with a hot plate. The evaporate was neutralized by introducing the gas to a Ca(OH)2/NaOH solution. The solution was transferred into 10 mL TM cleaned polypropylene vials after adding 0.2 ml of sub-boiled HNO3. After adding 10 μL of rhodium (1 mg L–1) as an internal standard and bringing the volume up to 10 mL with Milli-Q, samples were measured with a high resolution inductively coupled plasma mass spectrometer (ICP-MS, Attom, Nu Instruments, Wrexham, United Kingdom). Together with the phytoplankton sample, acid blanks, two filter blanks as well as a plankton reference material (BCR-414, Sigma-Aldrich, St. Louis, MO, United States) were processed and analyzed to assure the digestion quality (Supplementary Table 1). Unfortunately, the particulate TM of the initial community could not be analyzed due to a technical problem during the ICP-MS measurement of the filters. Intracellular TM contents were normalized to particulate organic carbon (POC).
Particulate Organic Carbon and Nitrogen Content
POC and particulate organic nitrogen (PON) samples were taken by filtering 200 mL of each replicate bottle onto pre-combusted (500°C, 15 h) 25-mm GF/F filters (Whatman). Next to the samples, for each bottle one filter blank was taken as a blank sample and all filters were stored at −20°C in pre-combusted glass petri dishes. Prior the analysis, samples were first dried at 50°C for > 12 h, then acidified with 200 μL of 0.2 M HCl followed by analysis on an automated carbon nitrogen elemental analyzer (Euro EA – CN Elemental Analyzer, HEKAtech GmbH, Wegberg, Germany). Values for POC and PON content were then normalized to filtered volume. Taking into account the incubation time of each experimental bottle (Δt in days), net POC production rates were calculated using the equation (Eq. 1):
where Pt1 and Pt2 denotes the POC concentration on the respective sampling days t1 and t2. In addition, molar ratios of carbon to nitrogen (C:N) were calculated.
Chlorophyll a Fluorescence
Chlorophyll a (Chl a) fluorescence was monitored for each replicate during the course of the experiment (every 1–4 days) at 1°C using a Fast Repetition Rate fluorometer (FRRf, FastOcean PTX sensor, Chelsea Technologies Group (CTG) Ltd, West Molesey, United Kingdom) connected with a FastAct Laboratory system (CTG Ltd). The excitation wavelength of the fluorometer’s LEDs were set to 450, 530, and 624 nm and the light intensity was automatically adjusted. A light sensor (ULM-500 Universal Light Meter equipped with a Spherical Micro Quantum Sensor US-SQS, Walz GmbH, Effeltrich, Germany) was used to measure the actual light intensity (E, μmol photons m–2 s–1) emitted from the FastAct Laboratory system. The single turnover mode was set with a saturation phase consisting of 100 flashlets on a 2 μs pitch followed by a relaxing phase of 40 flashlets on a 50 μs pitch. Prior the measurements, all samples were dark-acclimated for 1 h to allow full oxidation of all photosystem II (PSII) reaction centers. After dark acclimation, the minimum (F0) and maximum (Fm) Chl a fluorescence of PSII was measured 6 times, using the FastPro8 Software (Version 1.0.55, Kevin Oxborough, CTG Ltd.), to calculate the maximum quantum yield of photochemistry in PSII (Fv/Fm, rel. unit) with the equation (Eq. 2):
Based on Oxborough et al. (2012), functional absorption cross section of PSII (σPSII, nm2 PSII–1), the time constant for electron transport at the acceptor side of PSII (τQa, μs) and the connectivity factor (P, dimensionless) were derived from the single turnover measurements of the dark-acclimated community. Electron transport rate (ETR)-irradiance curves were performed using 9 irradiances ranging from 0 to 777 μmol photons m–2 s–1 with a 5 min acclimation to each light level. At each light level Chl a fluorescence was determined 6 times for each sample. The absolute electron transport rates (ETR, e– PSII–1 s–1) were calculated from these measurements based on the formula (Suggett et al., 2004, 2009; Huot and Babin, 2010; Schuback et al., 2015):
where denotes the effective PSII quantum yield under ambient light and E is the irradiance level (photons m–2 s–1). From the fitted ETR-irradiance curve, maximum ETR (ETRmax, e– PSII–1 s–1), maximum light utilization efficiency (α, rel. unit) and minimum saturation irradiance (Ik, μmol photons m–2 s–1) were calculated according to Ralph and Gademann (2005) from the fitted irradiance-dependent ETR using the SigmaPlot 13.0 software (Systat Software Inc., San Jose, CA, United States).
Pigments
For the analysis of the photosynthetic pigments, samples were filtered onto 25-mm glass fiber filters (GF/F, Whatman), which were then flash frozen in liquid nitrogen and stored at −80°C. Concentrations of the pigments Chl a, chlorophyll c1+2 (Chl c1+2), fucoxanthin, diadinoxanthin, diatoxanthin and β-carotene were determined by High Performance Liquid Chromatography (HPLC). For this purpose, pigments were extracted from the GF/F filter using 1.5 mL of > 99.9% acetone (HPLC grade; Merck). As an internal standard, 50 μm of the synthetic pigment canthaxanthin (≥ 95.0% HPLC grade, Sigma Aldrich) was added. For homogenization, a Precellys24 tissue homogenizer (Bertin Instruments, Montigny-le-Bretonneux, France) with 5,500 revolutions per minute (rpm) for 20 s was used after adding 0.5 mm silica beads (BioSpec Products, Bartlesville, OK, United States). Subsequently, samples were centrifuged (Centrifuge 5430R, Eppendorf, Hamburg, Germany) for 5 min at 0°C with 15,000 × g. The supernatant was filtered through 0.2 μm polytetrafluoroethylene (PTFE) filters (Labsolute, Th. Geyer GmbH, Renningen, Germany) and stored in Eppendorf tubes by −80°C until measurement. Pigment composition was analyzed using a HPLC system consisting of a Waters 600 controller (Waters Corporation, Milford, MA, United States) combined with a refrigerated auto sampler (Waters 717 plus), a photodiode array detector (Waters 2996), a fluorescence detector (Waters 2475) and the EMPOWER software (Waters) for identification and quantification of the pigments. Prior each measurement, 170 μL of the sample extract was mixed with 1 M ammonium acetate solution (1:1, v/v). Reverse-phase HPLC was conducted using a VARIAN Microsorb-MV 3 C8 column (4.6 × 100 mm, Agilent Technologies, Inc., Santa Clara, CA, United States) and HPLC-grade solvents (Merck). Solvent A and B consisted of a mix of 70% methanol and 30% 1 M ammonium acetate and 100% methanol, respectively. Pigments were identified through comparison of their retention time to those of the standards. Based on peak areas of external standards, the pigment concentrations were quantified. Using the internal standard canthaxanthin, the pigment concentrations were normalized to the extraction volume. Based on the concentration of the single pigments, the ratio of light harvesting pigments (LH) to light protecting pigments (LP) was calculated by dividing the sum of the content of Chl a, Chl c1+2 and fucoxanthin by the sum of the content of diadinoxanthin (DD) and diatoxanthin (DT) (Supplementary Table 2).
Phytoplankton Community Characterization
Aliquots of 100 ml unfiltered seawater were taken at the start of the experiment and at the end of both growth phases from each incubation bottle. Samples were preserved with acid Lugol’s solution (1% final concentration) and stored in brown glass bottles at 2°C in the dark until enumeration. Subsamples were transferred into Utermöhl cylinders (Hydro-Bios GmbH, Altenholz, Germany) and cells were allowed to settle for at least 24 h before counting. The settling volume ranged from 50 ml for the low cell density samples from the initial community to 10 ml for samples from the experimental bottles. The taxonomic composition of the natural phytoplankton community was determined using an inverted microscope (Axio Observer D1, Carl Zeiss AG, Oberkochen, Germany). Cells were counted according to the method of Utermöhl (1958): half of the chamber for the initial community and in stripes for the experimental bottles. We chose to count cells of the two phytoplankton groups diatoms (4–60 μm) and nanoflagellates (2–8 μm), representing the majority of the phytoplankton cells present in all samples. Too small and unidentifiable cells represented < 10% of the total phytoplankton community and were therefore not considered in the counting.
Statistics
The treatment moderate mixing under ambient pH was used as control for the statistical analysis. Kolmogorov-Smirnov tests and Brown-Forsythe tests were applied to test for normal distribution and equal variances of the data, respectively. Two Way Analyses of Variance (ANOVA) with subsequent Dunnett’s multiple comparison tests as post hoc tests were performed for each growth phase to test for significant differences between the treatments and a pairwise comparison of the two future mixing scenarios with the moderate mixing treatment under ambient pH, respectively. The statistical analysis was performed using the program GraphPad Prism (Version 5.00 for Windows, GraphPad Software, San Diego, CA, United States) and all graphs were created with SigmaPlot 13.0 (Systat Software, Inc.). The significance testing was done at the p < 0.05 level.
Results
Seawater Chemistry
The initial community had a seawater pHNBS of 8.07 and a total alkalinity of 2,441 μmol kg–1 (Table 1). At the end of first growth phase, the average (mean ± standard deviation) pHNBS value of all ambient pH treatments was 8.17 ± 0.03. Under OA, average pHNBS values were significantly reduced to 7.80 ± 0.01. At the end of the second growth phase, the pHNBS values in the ambient pH treatments were 8.10 ± 0.02, while in the OA, pHNBS was significantly lower (7.77 ± 0.01). The initial concentrations of nitrate (NO3–), phosphate (PO4–3) and silicate (SiO2) in the seawater were 23.97, 1.50 and 16.60 μmol L–1, respectively (Table 1). During the experiment, the concentration never decreased below 16.90 ± 0.68 μmol NO3– L–1, 0.91 ± 0.06 μmol PO4–3 L–1, and 6.14 ± 0.83 μmol SiO2 L–1 (n = 3, respectively; Figure 2), ruling out that the communities experienced macronutrient limitation.
Intracellular Trace Metals
At the end of the first growth phase, Fe:C ratios in the incubations ranged from 3.93 ± 0.68 to 29.51 ± 11.04 μmol mol –1 (Figure 3A). At ambient pH, there was no significant difference of the Fe:C ratio between the Fe-deplete low mixing scenario (17.92 ± 3.29 μmol mol –1) and the moderate mixing treatment under ambient pH (3.93 ± 0.68 μmol mol –1). The Fe addition in the strong mixing scenario, however, resulted in a significantly (p < 0.05) higher Fe:C ratio (22.96 ± 5.91 μmol mol–1) relative to the moderate mixing treatment under ambient pH. Under OA, the low mixing scenario (29.51 ± 11.04 μmol mol–1) had a significantly (p < 0.01) higher Fe:C ratio compared to the moderate mixing treatment under ambient pH (3.93 ± 0.68 μmol mol–1), whereas the strong mixing scenario (18.59 ± 5.15 μmol mol–1) did not differ from the moderate mixing treatment under ambient pH. At the end of the second growth phase, the Fe:C ratios of the low and strong mixing scenarios did not differ relative to the moderate mixing treatment under ambient pH (Figure 3B).
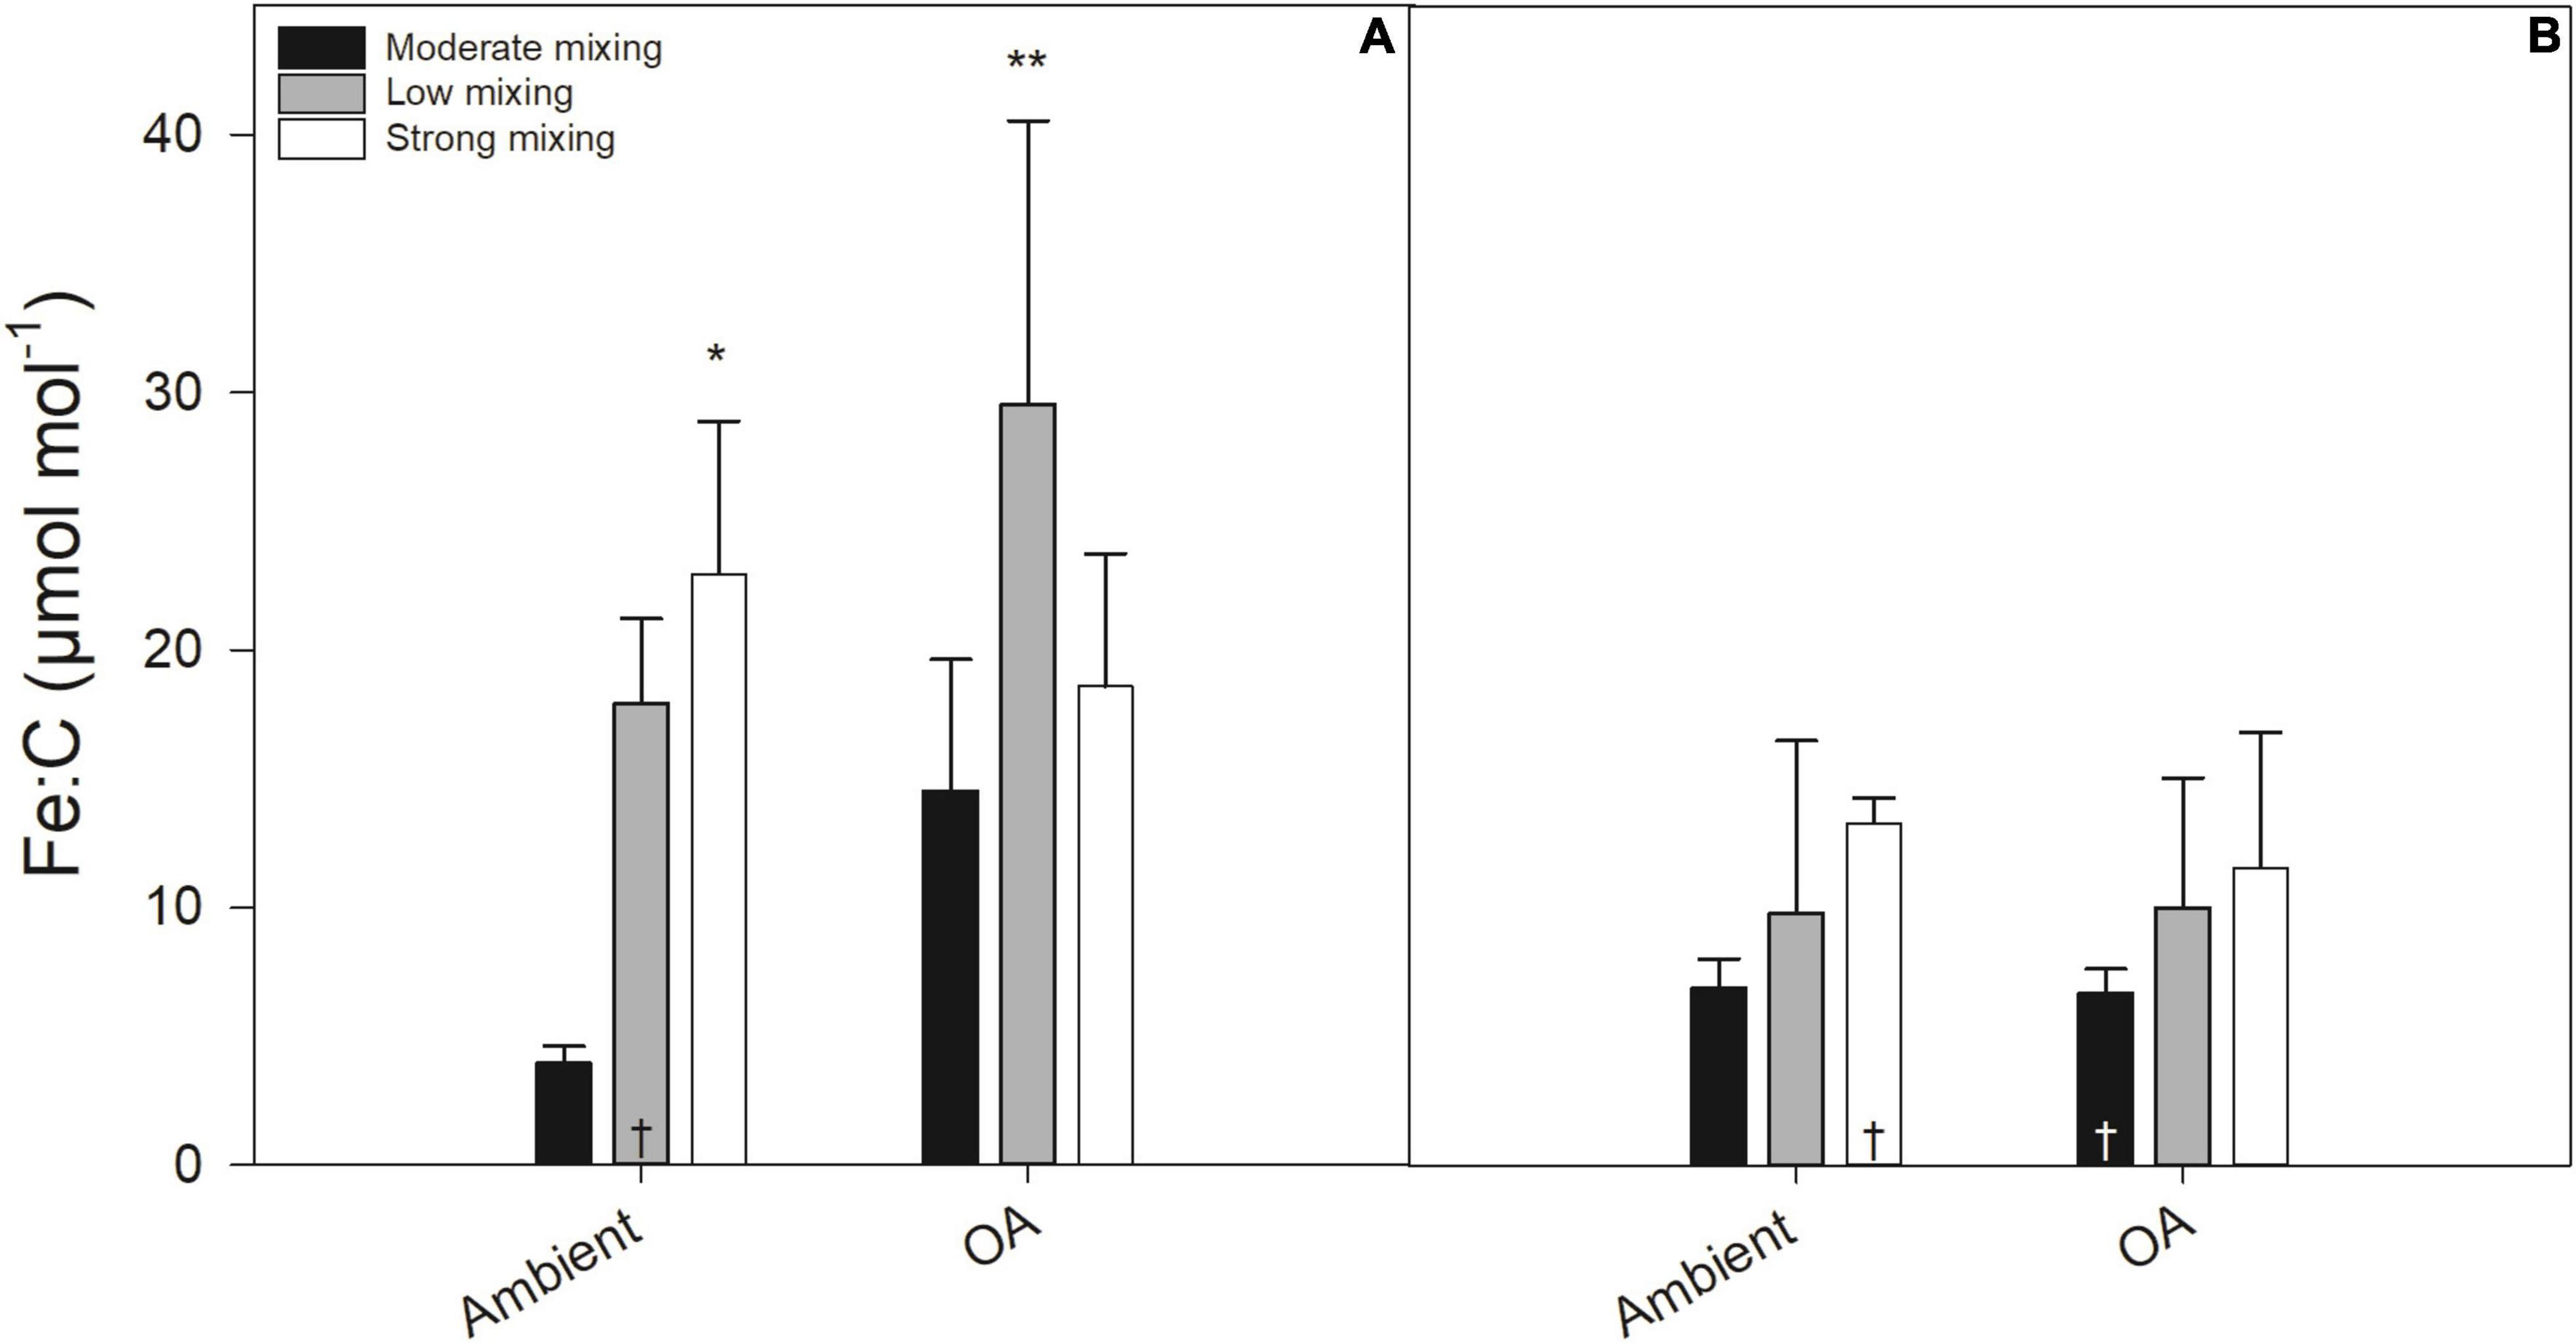
Figure 3. Molar ratios of iron (Fe) to carbon (C; μmol L−1 Fe per mol L−1 C) of a natural Antarctic phytoplankton community grown under moderate mixing (low Fe and low light), low mixing (low Fe and high light), and strong mixing (high Fe and low light) exposed to ambient pH or ocean acidification (OA). Molar ratios were determined at the end of the first (A) and the second (B) growth phase. Values represent the means ± SD (n = 3) except for those with a dagger (†, n = 2). Significant differences relative to the moderate mixing scenario at ambient pH are denoted by *p < 0.05 and **p < 0.01, respectively.
In addition to Fe:C ratios, carbon normalized quotas were also determined for Co, Mn, Cu, and Zn (Table 2). Since the intracellular Co concentrations were very low and below the detection limit in most of the samples at the end of the first growth phase, no statistical analysis of the Co:C ratios was possible. At the end of the second growth phase, the strong mixing scenario had significantly higher Co:C ratios under ambient pH (p < 0.001) and OA (p < 0.05) compared to the moderate mixing treatment under ambient pH. Mn:C ratios did not differ between the mixing scenarios and the moderate mixing treatment under ambient pH at the end of both growth phases. The Cu:C ratio of the community incubated under the low mixing scenario at ambient pH was significantly higher compared to the moderate mixing treatment under ambient pH at the end of the first growth phase (p < 0.05). Under OA, two replicates of the strong mixing scenario were excluded from the analysis of the Cu:C ratio since their values were below the ICP-MS blank measurement. The remaining replicate had a significantly lower Cu:C quota compared to the moderate mixing treatment under ambient pH (p < 0.05). At the end of the second growth phase, Cu:C ratios did not differ between both future mixing scenarios and the moderate mixing treatment under ambient pH. Due to the reduced number of replicates, the Zn:C ratios should be treated with caution. At ambient pH, both future mixing scenarios had significantly higher Zn:C ratios than the moderate mixing treatment under ambient pH (p = 0.0005 and 0.005, respectively). At the end of the second growth phase, there was no difference between the mixing scenarios and the moderate mixing treatment under ambient pH.
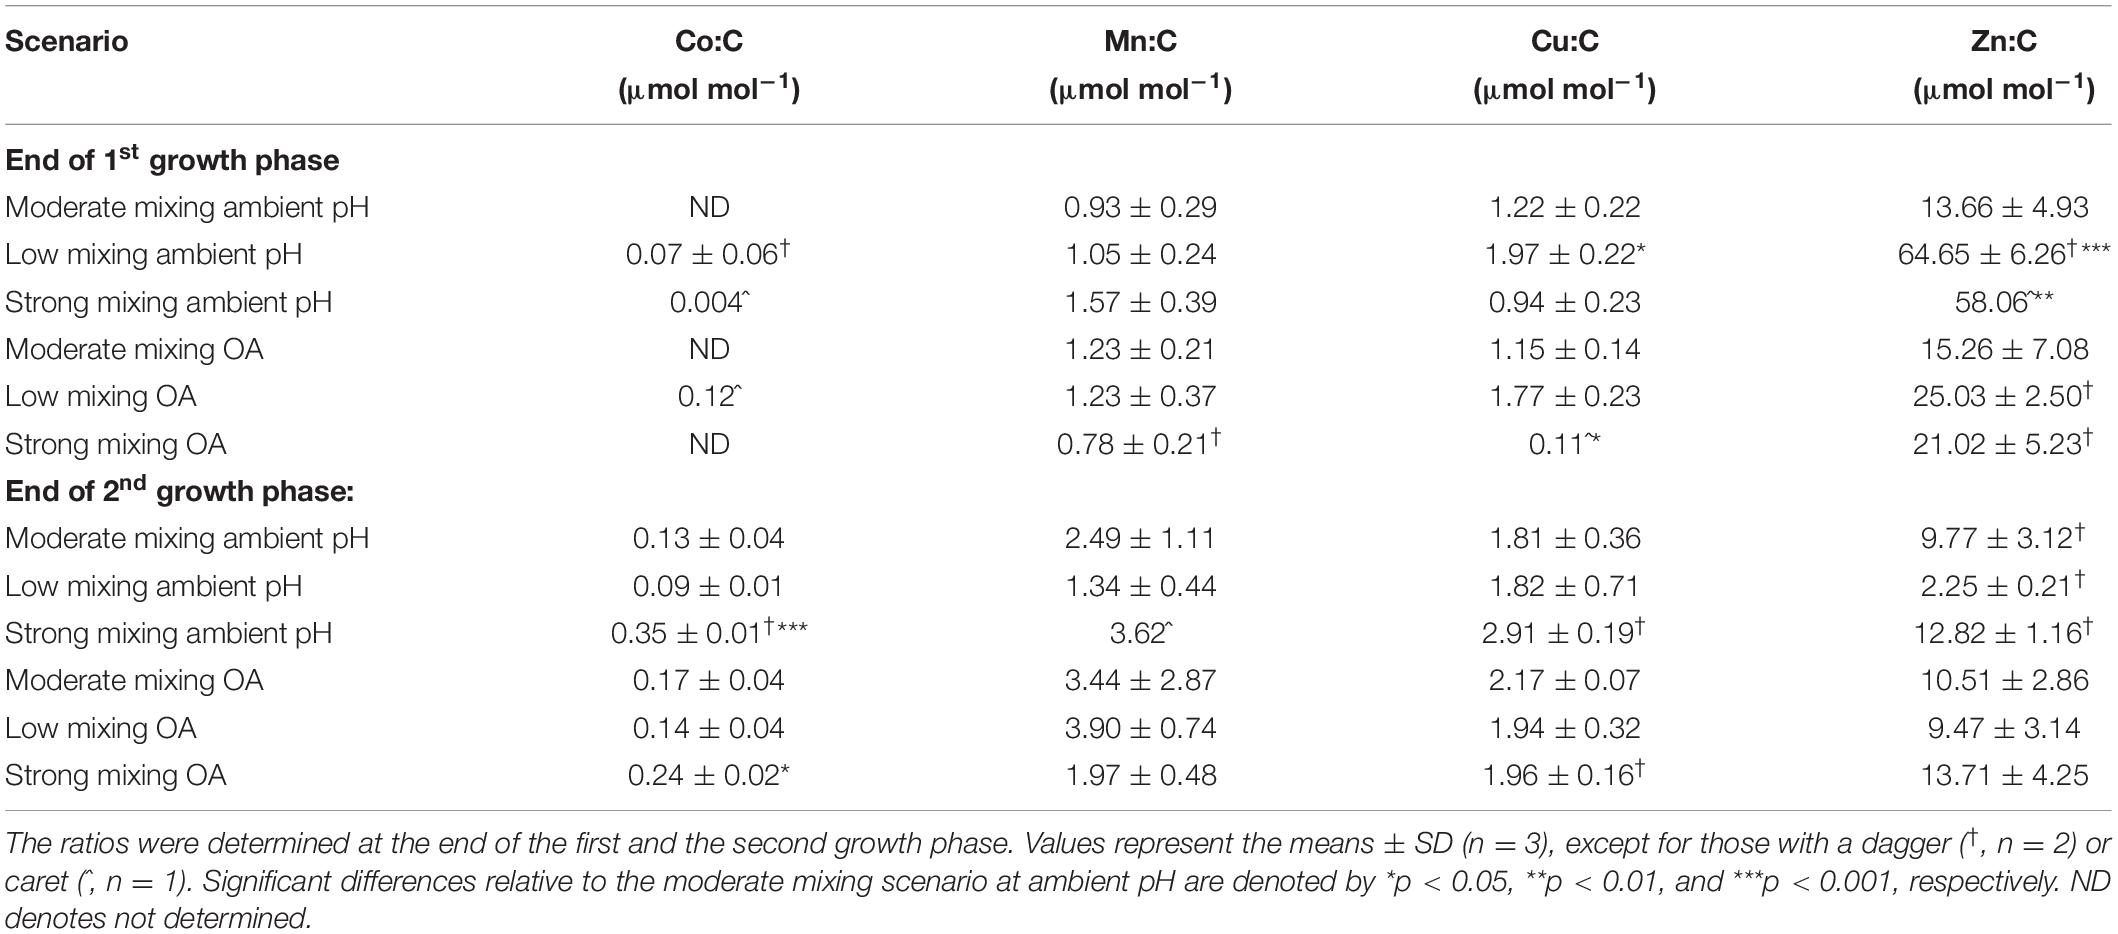
Table 2. Ratios of the trace metals (TM) cobalt (Co), manganese (Mn), copper (Cu), and zinc (Zn) relative to C (μmol L−1 TM per mol L−1 C) measured for a natural phytoplankton community grown under moderate mixing (low Fe and low light), low mixing (low Fe and high light), and strong mixing (high Fe and low light) exposed to ambient pH or ocean acidification (OA).
Photophysiology
The Fv/Fm of the initial phytoplankton community was 0.16 ± 0.03. During the incubation, Fv/Fm values increased in all treatments relative to the initial community. At the end of the first growth phase, the Fv/Fm values of the low mixing scenario under both pH levels were significantly lower compared to the moderate mixing treatment under ambient pH (p < 0.001, respectively) whereas the strong mixing scenario did not differ from the moderate mixing treatment under ambient pH (Figure 4A). At the end of the second growth phase, there was no difference between the Fv/Fm of the two future mixing scenarios relative to the moderate mixing treatment under ambient pH (Figure 4B). The functional absorption cross sections of PSII (σPSII) of the initial community was 5.34 ± 0.37 nm2 PSII–1 (Table 3). At the end of the first growth phase, σPSII was lower in all treatments. In comparison to the moderate mixing treatment under ambient pH, there was no significant difference in σPSII between the mixing scenarios apart from the moderate mixing OA treatment, where σPSII was significantly higher (p < 0.01). At the end of the second growth phase, σPSII was significantly lower in the strong mixing scenario under ambient pH compared to the moderate mixing treatment under ambient pH (p < 0.005). Under OA, σPSII of both future mixing scenarios were significantly reduced compared to the moderate mixing treatment under ambient pH (p < 0.005, respectively). The time constant for electron transfer at PSII (τQa) for the initial community was 619 ± 76 μs (Table 3). At the end of the first growth phase, τQa was significantly increased in the strong mixing scenario under OA compared to the moderate mixing treatment under ambient pH (p < 0.05). For all other treatments, there was no difference in τQa relative to the moderate mixing treatment under ambient pH. The energy transfer between PSII units (i.e., connectivity, P) of the initial community was 0.23 ± 0.03 (Table 3). At the end of the first growth phase, P was higher in all treatments. In comparison to the moderate mixing treatment under ambient pH, P was significantly lower in the low mixing scenario under both pH levels compared to the moderate mixing treatment under ambient pH (p < 0.05). At the end of the second growth phase, P did not differ between the mixing scenarios under both pH conditions and the moderate mixing treatment under ambient pH, respectively. The absolute maximum electron transport rate (ETRmax) of the initial community was 408 e– PSII–1 s–1 (Table 3). At the end of the first growth phase, there was a significant OA effect for the moderate mixing treatment, with higher ETRmax under OA compared to the treatment under ambient pH (p < 0.05). Apart from this OA effect, there was no significant effect on ETRmax at the end of both growth phases. The light saturation point (Ik) for the initial community was at 118 μmol photons m–2 s–1 (Table 3). At the end of the first growth phase, Ik values ranged from 61 ± 0 to 112 ± 38 μmol photons m−2 s−1 and did not differ between the mixing scenarios and the moderate mixing treatment under ambient pH. At the end of the second growth phase, Ik was also not different under ambient pH, but was significantly increased in the low mixing scenario under OA relative to the moderate mixing treatment under ambient pH (p < 0.05). The light use efficiency (α) of the initial community was 3.45 (Table 3). There was no difference in α between the moderate mixing treatment under ambient pH and the mixing scenarios at the end of both growth phases.
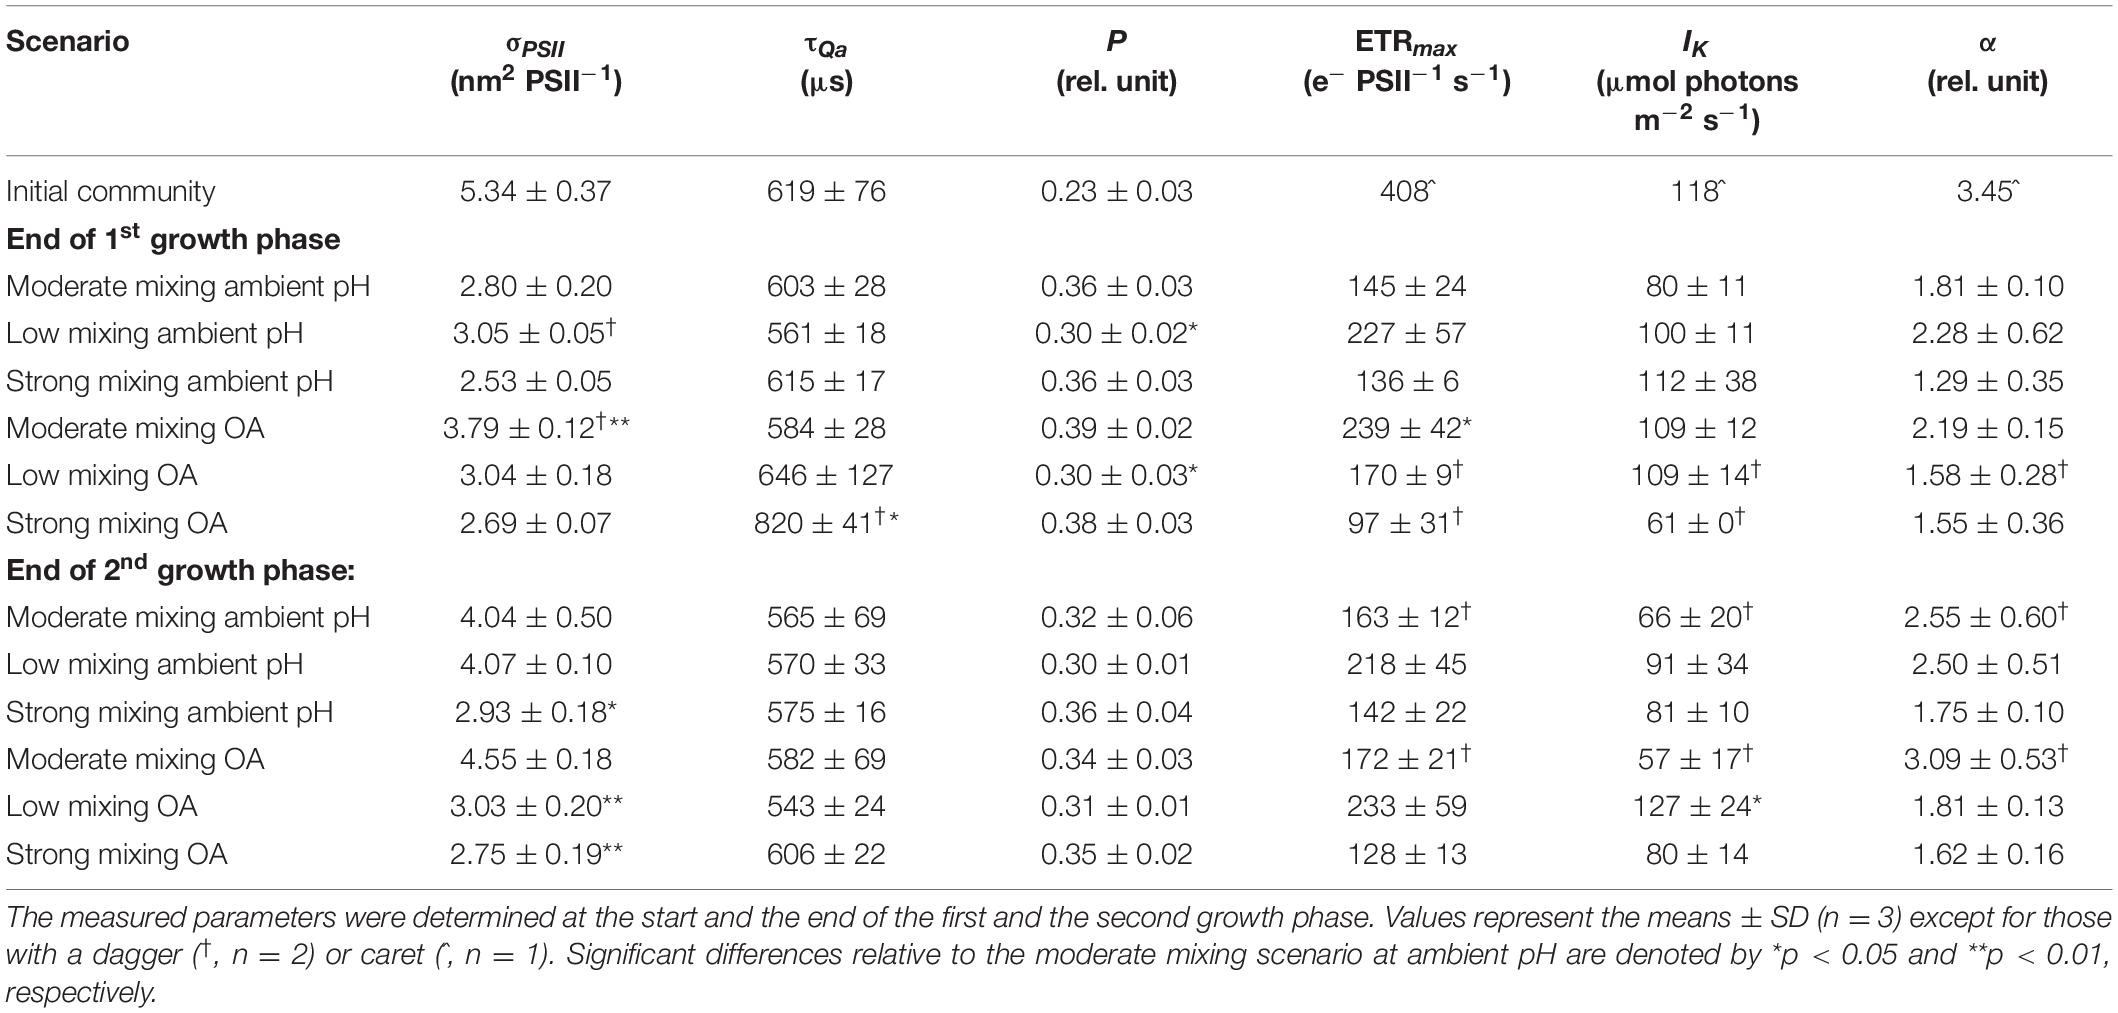
Table 3. Functional absorption cross section of PSIIs (σPSII), time constant for electron transfer at PSII (τQa), connectivity between adjacent photosystems (P), maximum electron transport rates (ETRmax), light saturation point (IK) and light use efficiency (α) measured for a natural phytoplankton community grown under moderate mixing (low Fe and low light), low mixing (low Fe and high light), and strong mixing (high Fe and low light) exposed to ambient pH or ocean acidification (OA).
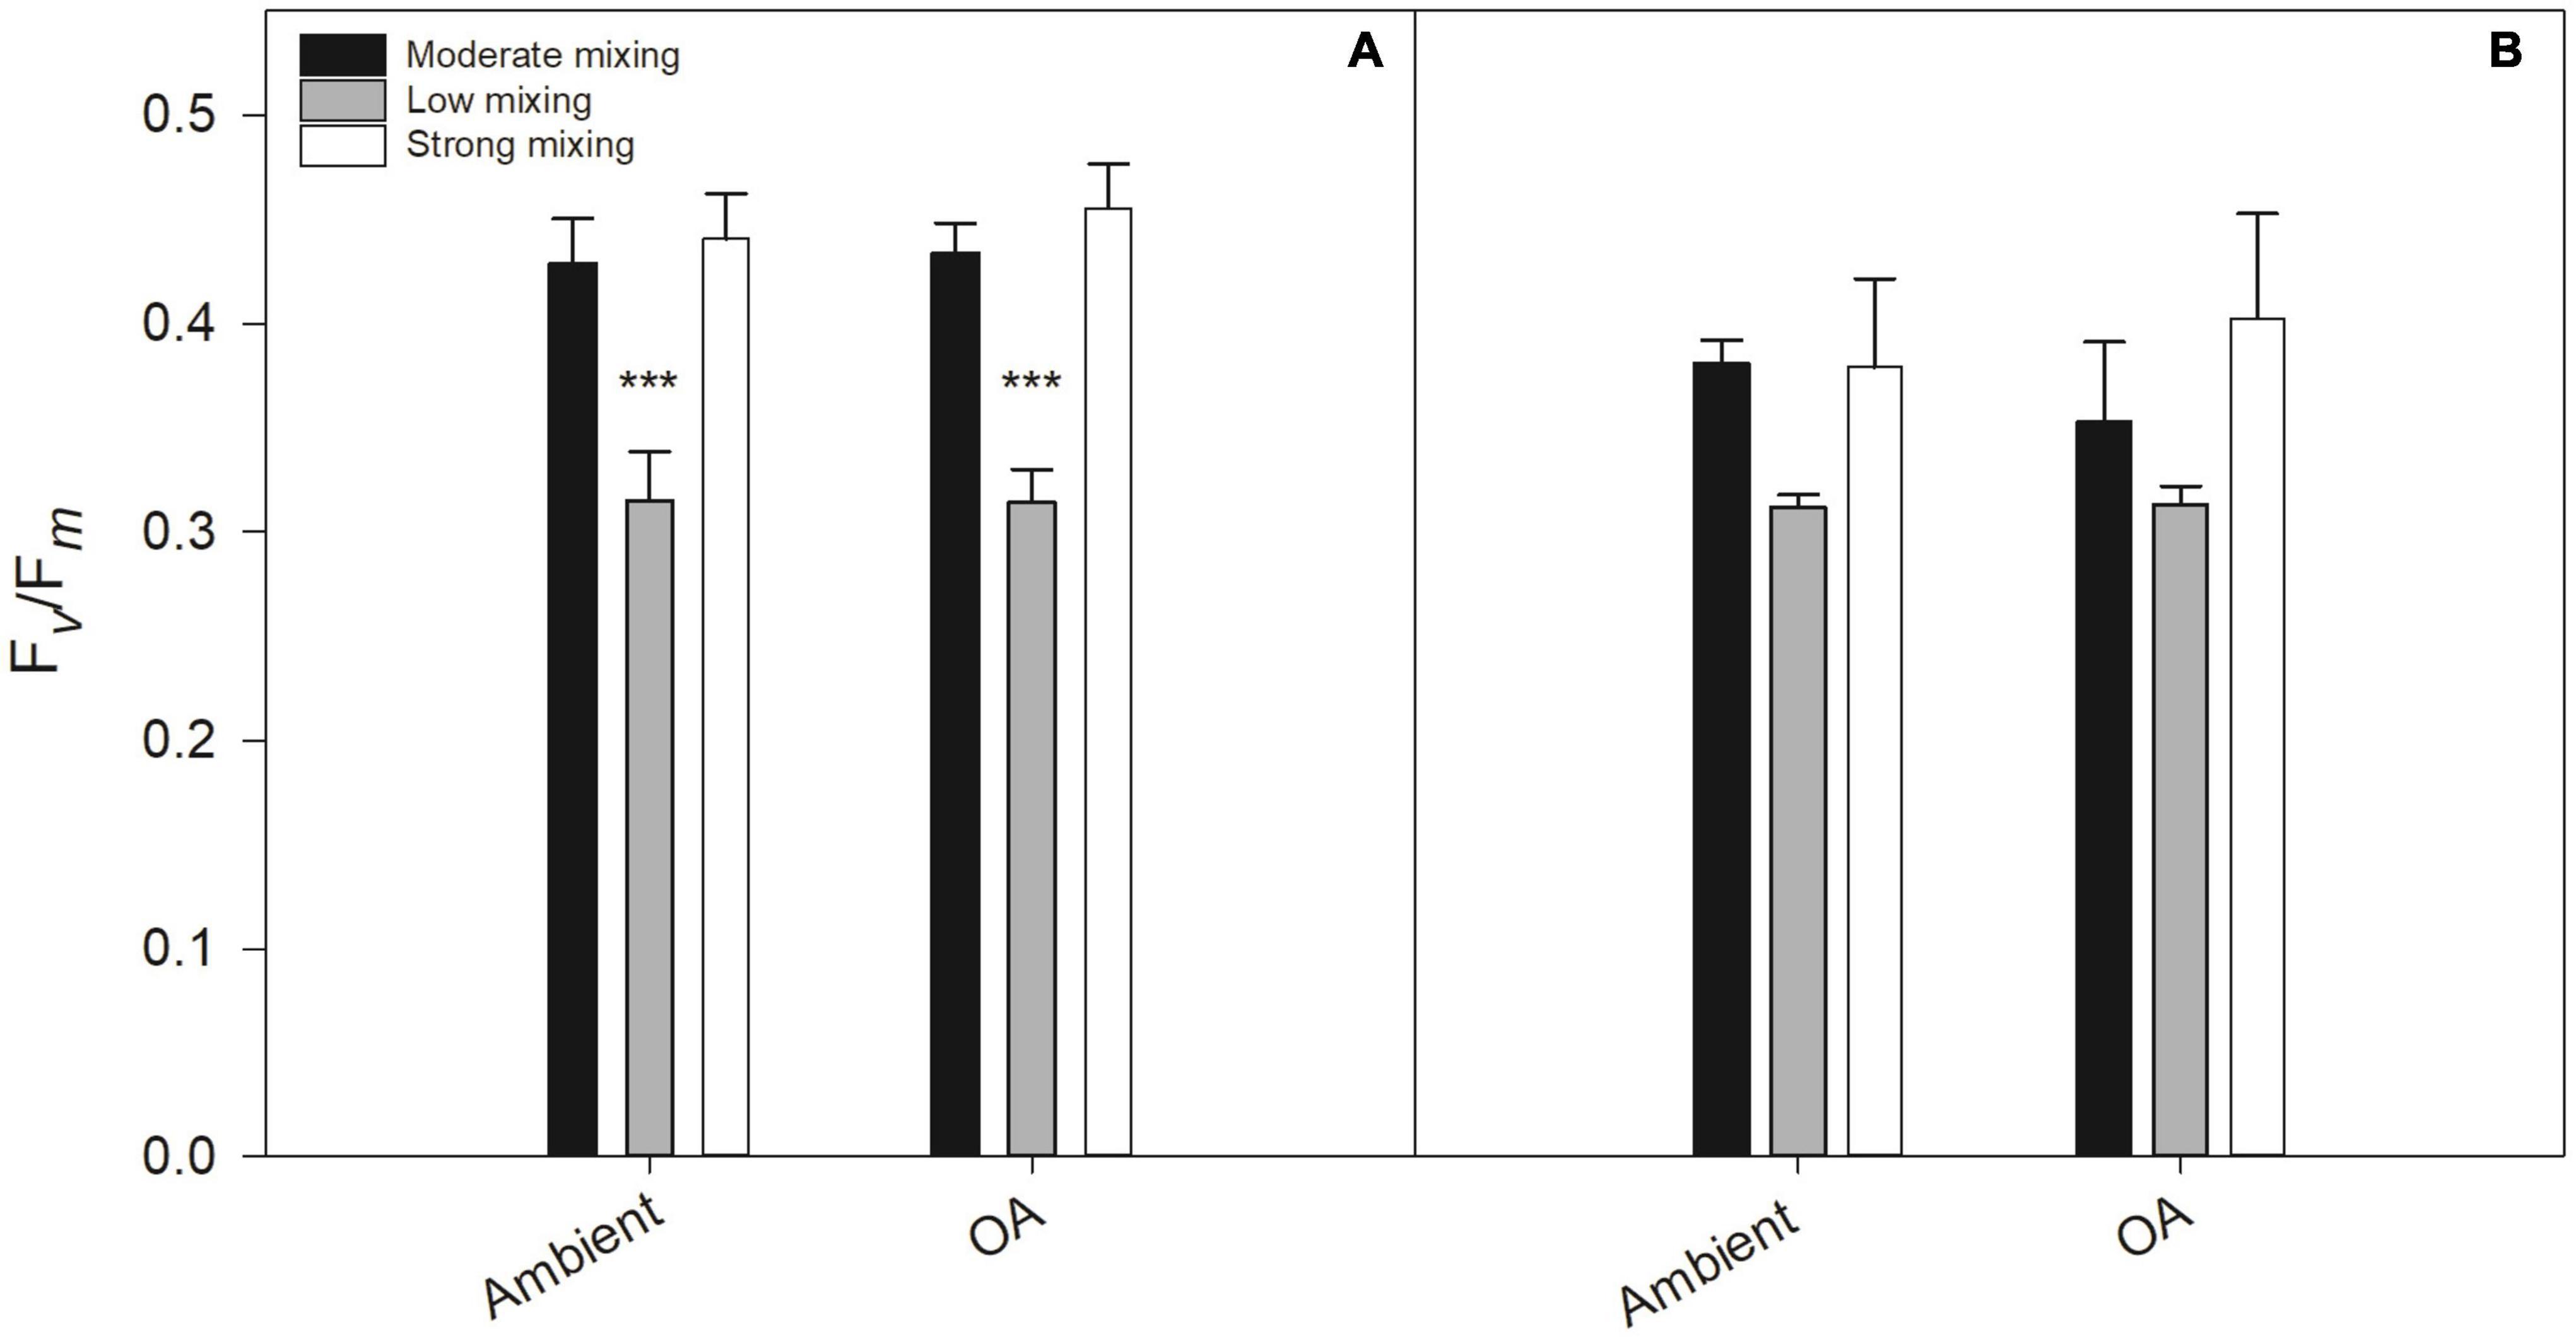
Figure 4. Dark-acclimated maximum PSII quantum yield (Fv/Fm, rel. unit) of a natural Antarctic phytoplankton community grown under moderate mixing (low Fe and low light), low mixing (low Fe and high light), and strong mixing (high Fe and low light) exposed to ambient pH or ocean acidification (OA). Fv/Fm was determined at the end of the first (A) and the second (B) growth phase. Values represent the means ± SD (n = 3). Significant differences relative to the moderate mixing scenario at ambient pH are denoted by ***p < 0.001.
Net Particulate Organic Carbon Production Rates
At the end of the first growth phase, net POC production rates (μg C d−1) were similar across most treatments apart from the strong mixing scenario under OA, which was significantly reduced relative to the moderate mixing treatment under ambient pH (p < 0.005; Figure 5A). In contrast, at the end of the second growth phase, net POC production rates were higher and significantly increased in the low mixing scenario under both pH conditions (p = 0.0001, respectively) as well as in the strong mixing scenario under OA compared to the moderate mixing treatment under ambient pH (p < 0.005; Figure 5B). Carbon to nitrogen ratios (C:N) of the future mixing scenarios did not differ compared to the moderate mixing treatment under ambient pH in both growth phases and ranged between 6.80 ± 2.17 and 12.87 ± 3.14 mol mol–1 (Supplementary Table 3).
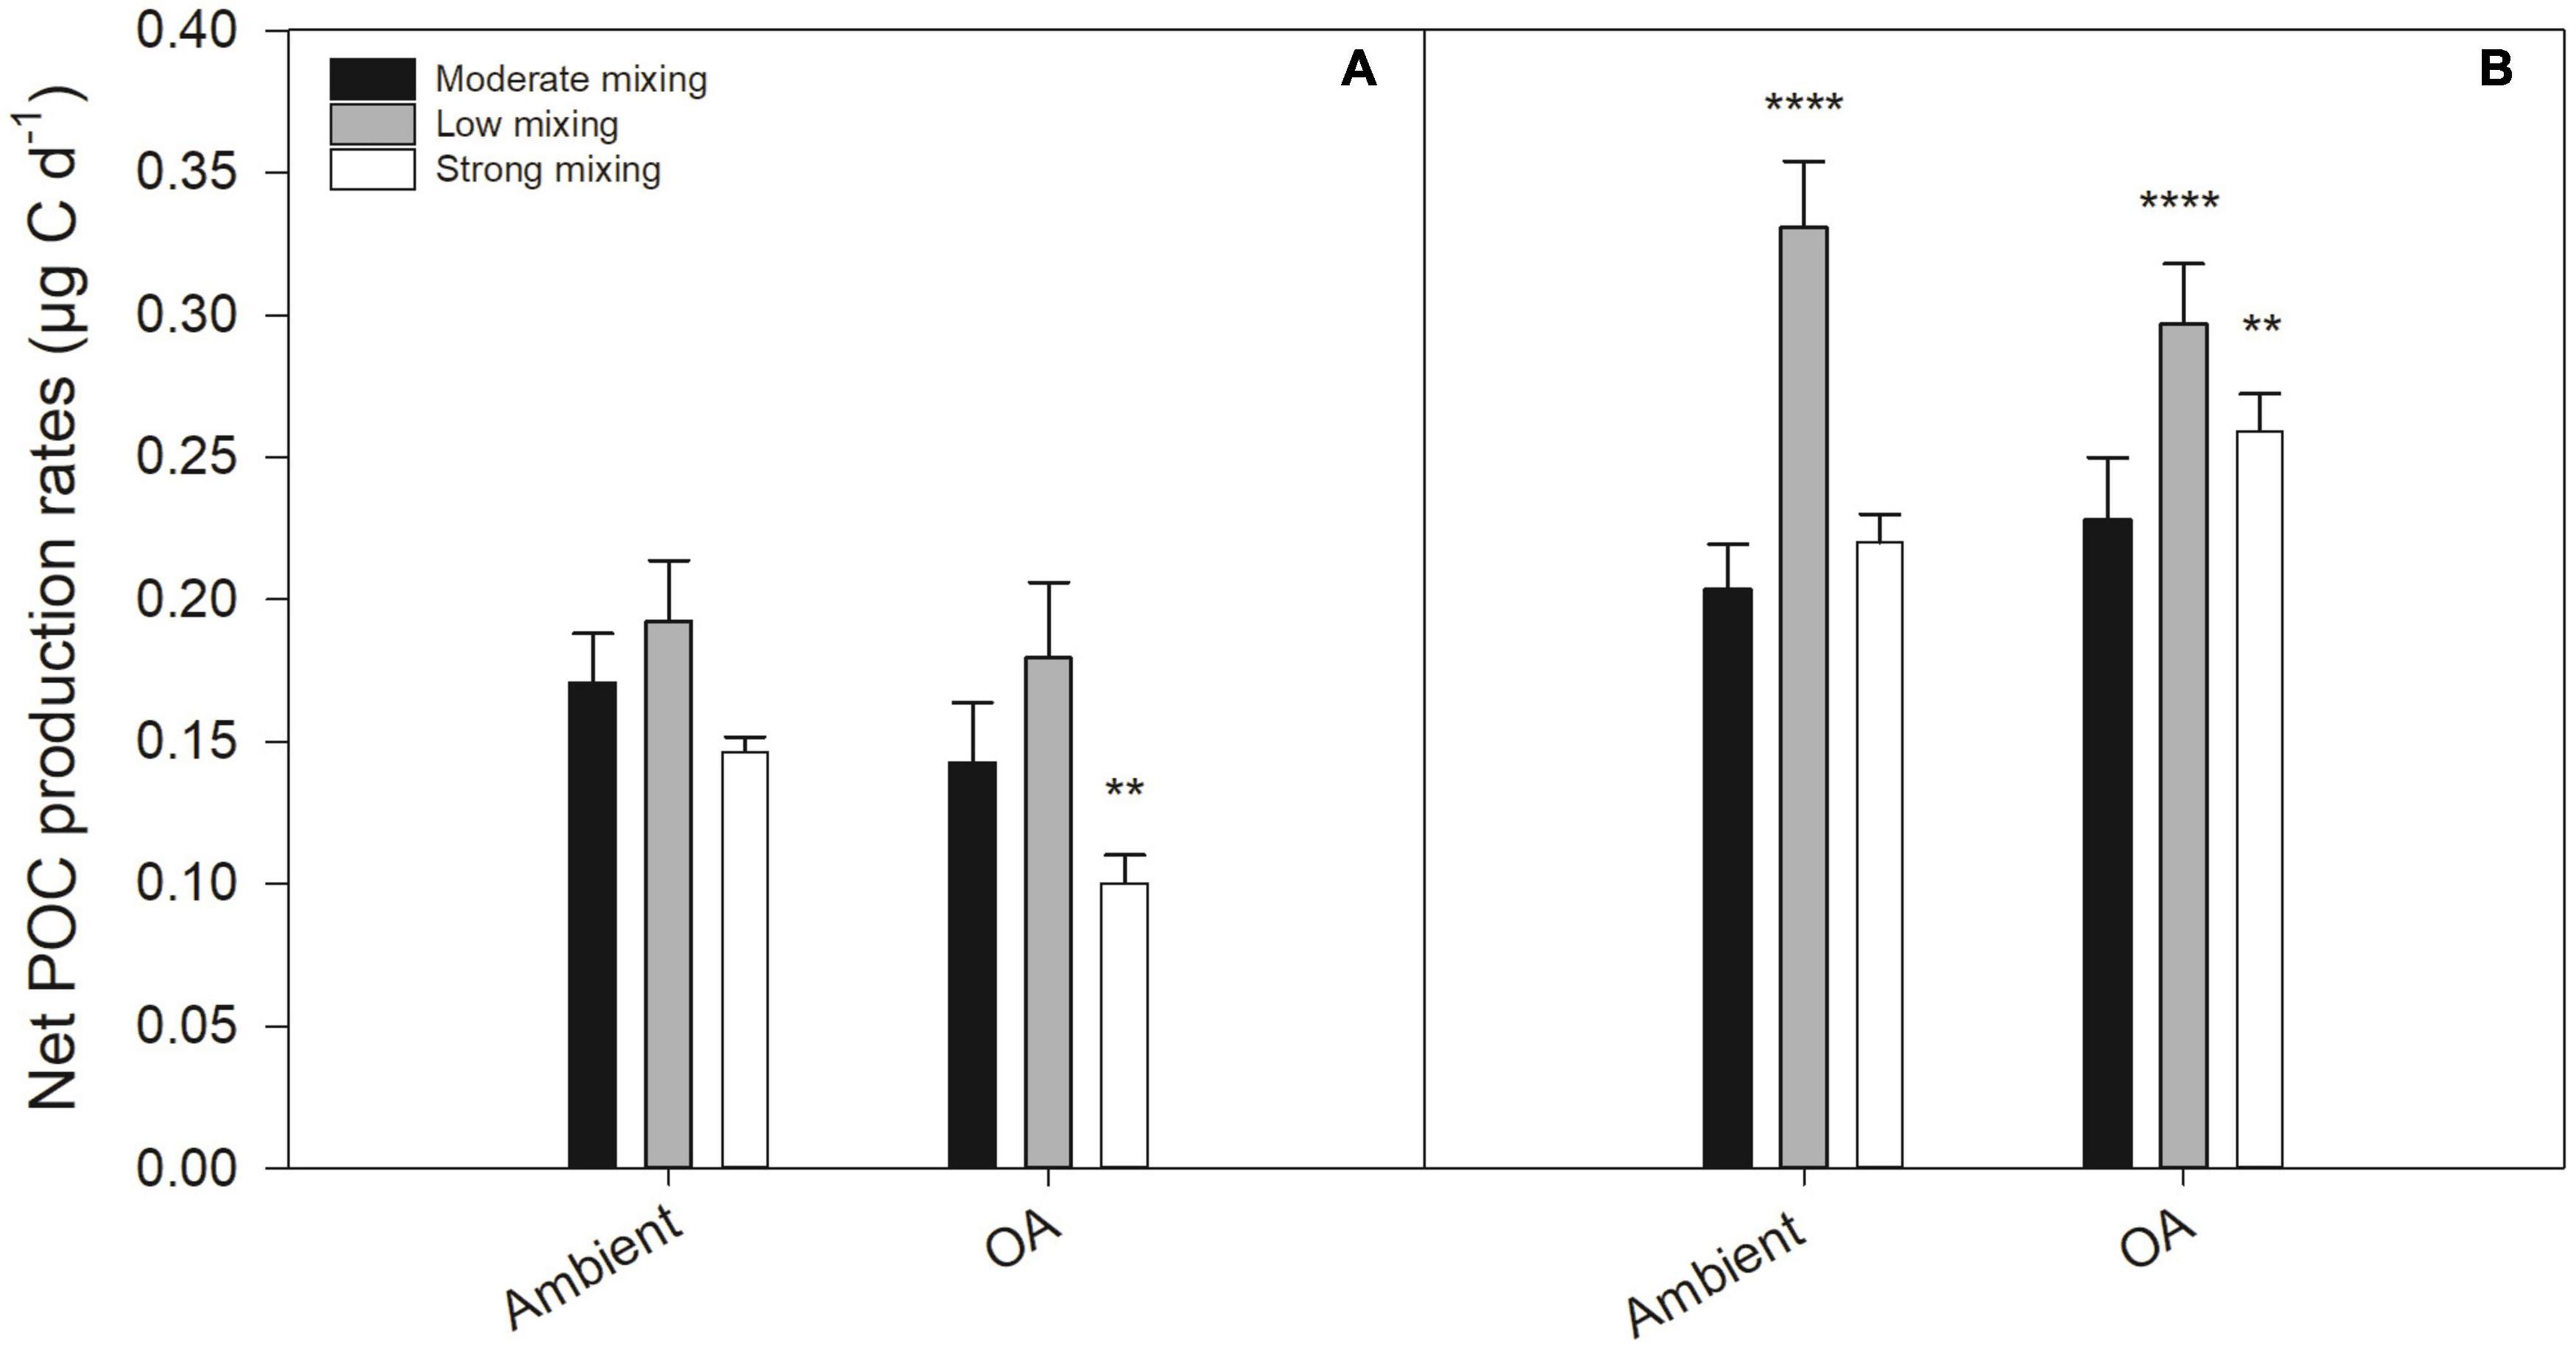
Figure 5. Net POC production rates (μg C d–1) of a natural Antarctic phytoplankton community grown under moderate mixing (low Fe and low light), low mixing (low Fe and high light), and strong mixing (high Fe and low light) exposed to ambient pH or ocean acidification (OA). Net POC production was determined at the end of the first (A) and the second (B) growth phase. Values represent the means ± SD (n = 3). Significant differences relative to the moderate mixing scenario at ambient pH are denoted by **p < 0.01 and ****p < 0.0001, respectively.
Pigments and Community Composition
The ratio of light-harvesting (LH) to light-protective pigments (LP; LH:LP, g g–1) in the initial community was 8.94 ± 0.20 g g–1. At the end of the first growth phase, the LH:LP ratio ranged from 11.81 ± 0.63 to 24.09 ± 2.84 g g–1 (Figure 6A). The LH:LP ratio was significantly reduced in the low mixing scenario under both pH conditions compared to the moderate mixing treatment under ambient pH (p < 0.0005, respectively). This lower LH:LP ratio was due to a significant higher concentration of DD+DT (p < 0.05) in both low mixing treatments, whereas the concentrations of Chl a, Chl c1+2, and fucoxanthin did not differ (Supplementary Table 2). The communities incubated under the strong mixing scenario had a significantly higher LH:LP ratio under ambient pH (p < 0.05) and OA (p < 0.05) relative to the moderate mixing treatment under ambient pH. At the end of the second growth phase, there was no difference, but the LH:LP ratio was significantly lower in the low mixing scenario under OA relative to the moderate mixing treatment under ambient pH (p < 0.01; Figure 6B).
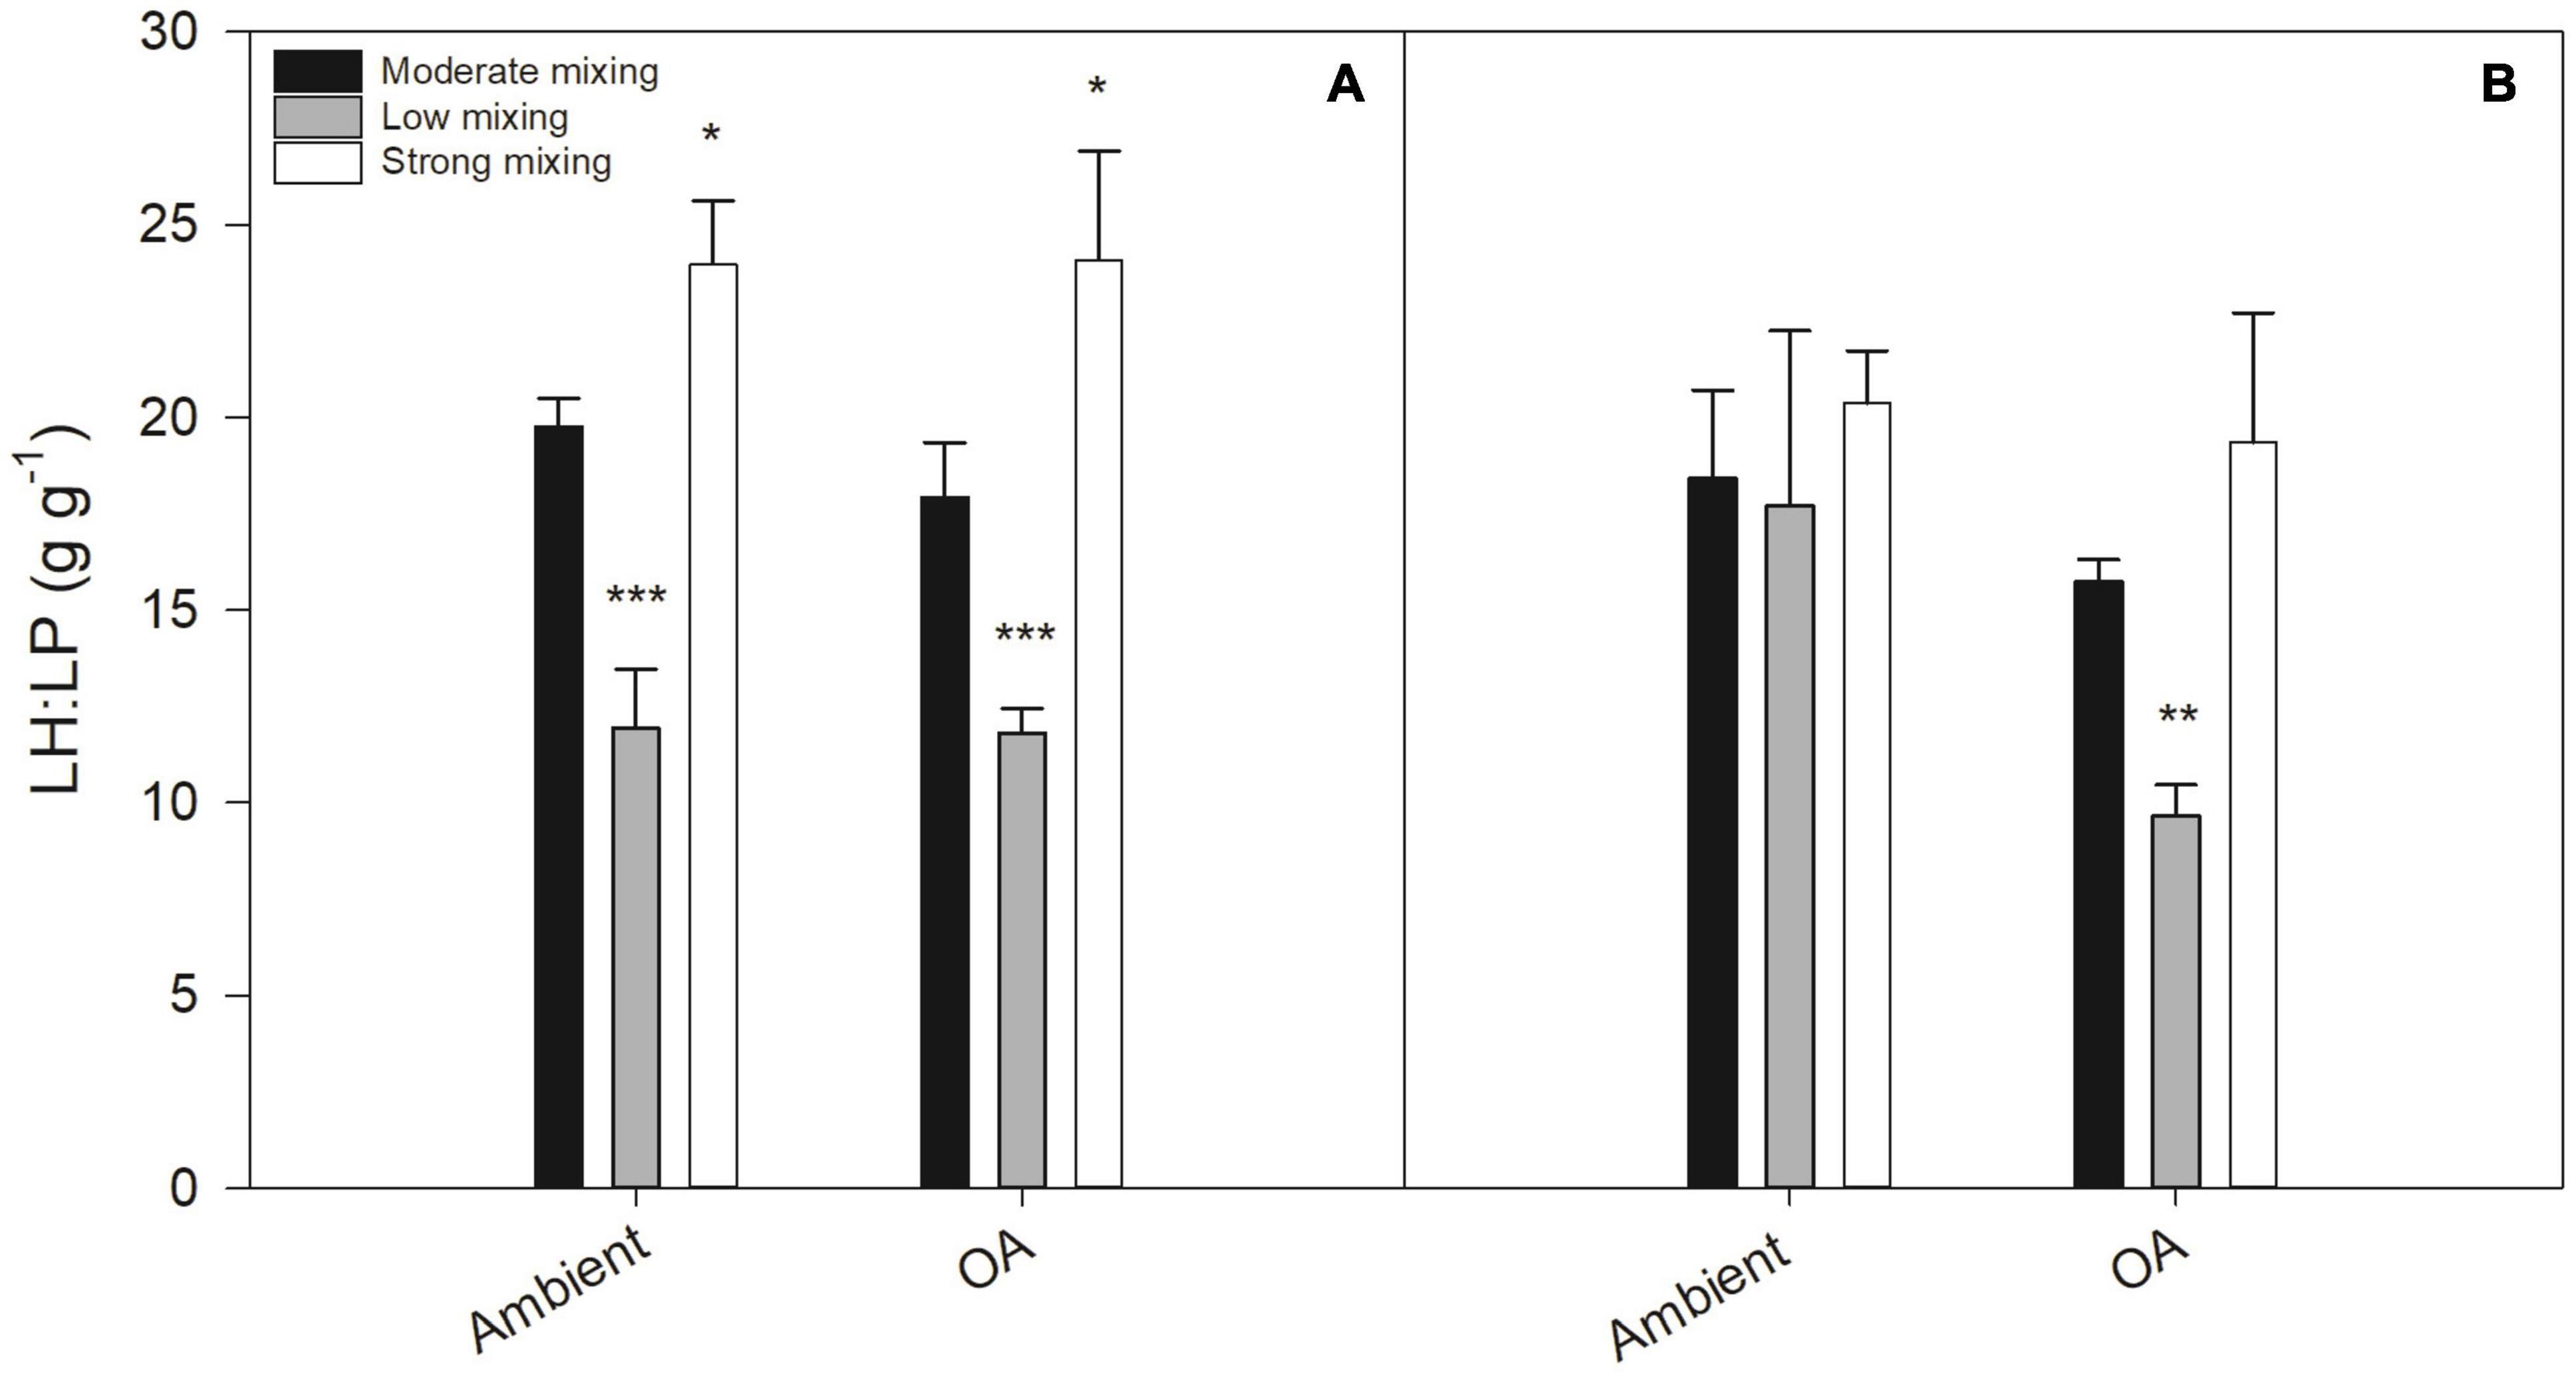
Figure 6. Ratios of light-harvesting (LH: sum of chlorophyll a, chlorophyll c1+2, and fucoxanthin) to light-protective pigments (LP: sum of diadinoxanthin and diatoxanthin; LH:LP, g g–1) for a natural Antarctic phytoplankton community grown under moderate mixing (low Fe and low light), low mixing (low Fe and high light), and strong mixing (high Fe and low light) exposed to ambient pH or ocean acidification (OA). LH:LP ratios were determined at the end of the first (A) and the second (B) growth phase. Values represent the means ± SD (n = 3). Significant differences relative to the moderate mixing scenario at ambient pH are denoted by *p < 0.05, **p < 0.01, and ***p < 0.001, respectively.
Based on the microscopic counts of the numerically most abundant phytoplankton groups in the samples, the initial community was numerically dominated by diatoms (63%) compared to nanoflagellates (37%, Table 1). At the end of the first growth phase, the relative numerical contribution by diatoms increased in both future mixing scenarios compared to the moderate mixing treatment under ambient pH (p < 0.005 and p < 0.05, respectively), but not under OA. At the end of the second growth phase, the relative numerical contribution by diatoms increased in all treatments, but did not differ between the mixing scenarios under both pH conditions relative to the moderate mixing treatment under ambient pH (Supplementary Table 4).
Discussion
The anthropogenic increase in atmospheric CO2 leads to changes in climate circulation patterns, thereby affecting various environmental parameters in the global oceans (Laufkötter et al., 2015; Henson et al., 2017; Bindoff, 2019). Even though large parts of the SO have low Fe concentrations, it plays a significant role in the biological carbon pump (Takahashi et al., 2002; Khatiwala et al., 2009). Therefore, it represents an important region to investigate the productivity and composition of phytoplankton communities. In this study, we investigated the response of a phytoplankton community from the Drake Passage to two predicted climate scenarios for the SO simulating low and strong vertical mixing. Bottle incubation experiments with natural phytoplankton communities, such as the one presented here, can provide valuable insights into how certain environmental parameters (e.g., Fe, light and pH) influence interactions within the phytoplankton community or elemental composition. When interpreting and transferring the observed effects to natural conditions in the world’s oceans, it is important to take into account that the results were obtained under artificial conditions and will include some “bottle effects” (Venrick et al., 1977; Carpenter, 1996; Calvo-Díaz et al., 2011). However, these “bottle effects” are likely uniform and will not skew the relative changes resulting from the tested environmental parameters. Thus, multiple stressors bottle incubations are still the most effective way to investigate the effects of future environmental conditions and their effects on natural SO phytoplankton communities.
The study area represented typical conditions found in the Fe-limited waters of the Drake Passage south of the Polar Front, with high macronutrient concentrations and low biomass (Hopkinson et al., 2007; Alderkamp et al., 2011; Trimborn et al., 2015; Garcia et al., 2019). At the sampling site, macronutrient concentrations (PO4–3 = 1.50 μmol L–1; NO3– = 24 μmol L–1; SiO2 = 17 μmol L–1) were high, whereas Fe concentrations were very low (0.03 nmol Fe L–1). As typical for a HNLC region, both Chl a (0.04 ± 0.01 μg L–1) and POC concentrations (52.31 ± 3.76 μg L–1) of the initial community were also very low (Hopkinson et al., 2007; Alderkamp et al., 2011; Trimborn et al., 2015; Garcia et al., 2019). The pHNBS of 8.07 represented present-day seawater conditions (Jiang et al., 2019). In addition to the very low dFe concentrations, the reduced Fv/Fm (0.16 ± 0.03) in combination with the large σPSII (5.34 ± 0.37 nm2 PSII–1) suggested also that the sampled phytoplankton community was Fe-limited, as previously observed (Petrou et al., 2014; Koch and Trimborn, 2019).
The initial community was numerically dominated by diatoms (63%), while nanoflagellates accounted for 37%. Diatom-dominated phytoplankton assemblages are typical for HNLC waters of the Drake Passage (Sommer and Stabel, 1986; Alderkamp et al., 2011; Trimborn et al., 2015). The community was sampled in the early morning from a depth of 20 m and thus was exposed to low solar irradiance. Similar to Alderkamp et al. (2011), the (DD + DT) : Chl a ratio (0.18 ± 0.01) showed a high contribution of LP relative to Chl a pigments, indicating an acclimation of the initial community to mixing and frequent changes in irradiance levels, as typical for this region (Venables and Moore, 2010; Alderkamp et al., 2011).
It was mainly during the first growth phase that the phytoplankton communities in the two future mixing scenarios underwent changes in trace metal content, physiology and community composition. In comparison, the physiological characteristics of all phytoplankton communities remained the same during the second growth phase except for Co:C ratios, POC production rates and community composition, indicating that the final communities had fully acclimated to the experimental conditions, as previously observed in other OA perturbation experiments with SO phytoplankton assemblages (Coad et al., 2016; Heiden et al., 2019).
Trace Metal Stoichiometry Is Affected Differently by Both Future Mixing Scenarios at Ambient pH
During the first growth phase, both future mixing scenarios altered the carbon-normalized quotas of the trace metals Fe, Cu, Zn, Co, and Mn under ambient pH. Previous studies have explained these differences via TM substitution (Lee and Morel, 1995; Saito and Goepfert, 2008; Saito et al., 2008; Koch et al., 2018) and biodilution (Sunda and Huntsman, 1998). The Fe:C ratios of the two low Fe treatments (moderate and low mixing) were similar under ambient pH. As expected, the Fe addition in the strong mixing scenario resulted in an increase of the Fe:C ratio relative to the moderate mixing treatment at ambient pH. In line with this, several studies have shown enhanced Fe:C ratios of Fe-enriched relative to Fe-limited cells in the laboratory (Sunda and Huntsman, 1995; Maldonado and Price, 1996; Marchetti et al., 2006; Marchetti and Maldonado, 2016; Koch et al., 2018; Koch and Trimborn, 2019) and in the field (Twining et al., 2004).
Higher Cu:C quotas were frequently observed in response to Fe-limitation in several diatoms (Annett et al., 2008; Koch and Trimborn, 2019). Under Fe-limitation, high-affinity Fe uptake takes place, as Cu is needed in Fe-reductases and multicopper oxidases (Behnke and LaRoche, 2020). Moreover, some oceanic diatoms can also replace the Fe-rich cytochrome c6 by the Cu-containing plastocyanin in the electron transport chain (Raven et al., 1999; Peers et al., 2005; Behrenfeld and Milligan, 2013). The same Fe-dependent pattern was observed in this study, with higher Cu:C ratios in the two low Fe (moderate and low mixing) treatments compared to the Fe-rich treatment (strong mixing scenario). Finkel et al. (2006) observed an increased Cu:C ratio in diatoms in response to low irradiance. Unexpectedly, the Cu:C ratio was higher in the high light low Fe (low mixing) scenario relative to the low light low Fe (moderate mixing) treatment at ambient pH indicating that high light was amplifying the Fe limitation effect. Hence, the high light in the low mixing scenario may have promoted the substitution of Fe- toward Cu-containing plastocyanin. This could have enabled the Fe-limited cells in the high light low Fe (low mixing) scenario to achieve the same ETRmax values as the ones in the low light low Fe (moderate mixing) treatment.
The Zn:C ratios of the cells of both future mixing scenarios were significantly higher than in the ones of the moderate mixing treatment at ambient pH. Since Zn is required in proteins that are involved in DNA and RNA synthesis (Klug, 2010; Twining and Baines, 2013), it can be speculated that cells of both future mixing scenarios required an increase of the transcriptomic machinery leading potentially to higher demands for Zn containing proteins. Another possibility could be that Zn was used to sustain certain enzymatic chain reactions, substituting for the low Co and Cd concentrations (Saito and Goepfert, 2008; Morel et al., 2020). In line with this, the Co:C ratios were very low, in some cases even undetectable.
During the second growth phase, a significantly increased Co:C ratio was found only in the Fe-enriched strong mixing scenario, at both pH levels. Bacteria need Co for the production of vitamin B12 (Banerjee and Ragsdale, 2003), an essential vitamin for phytoplankton, which, after uptake by the cells, acts as cofactor in various enzymatic reactions (Twining and Baines, 2013). The availability of vitamin B12 can shape phytoplankton community composition in high latitude regions (Koch et al., 2011), including the SO (Panzeca et al., 2006). The increase in Co:C could be a result of a higher B12 demand of the phytoplankton community due to increased Fe availability and indicate an increased demand of reactions requiring vitamin B12 like methionine synthesis (Banerjee and Ragsdale, 2003; Helliwell et al., 2011).
Both Future Mixing Scenarios Resulted in Different Photophysiological Adjustments Under Ambient pH
Similar to previous studies (Feng et al., 2010; Hoppe et al., 2015; Trimborn et al., 2017a), the Fv/Fm increased in all scenarios at the end of the first growth phase relative to the Fv/Fm of the initial community. As constant light was applied during the light phase of the experiment, this increase can be explained by the absence of continuous photoacclimation that the cells had to perform under the dynamic light conditions in the water column. Similar photophysiological adjustments were previously observed (Hoppe et al., 2015; Trimborn et al., 2017a; Heiden et al., 2018).
The low mixing scenario, mimicking more stratified SO waters with higher light availability and low Fe supply, resulted in changes in the community’s photophysiology during the first growth phase, mainly a reduction in Fv/Fm and P. The decrease of the Fv/Fm compared to the moderate mixing treatment at ambient pH indicates that the applied high light level induced a light stress response by the community, as previously reported (van de Poll et al., 2009; Hoogstraten et al., 2012; Heiden et al., 2019; Trimborn et al., 2019). The lowered PSII connectivity of the cells in the low mixing scenario decreased the redistribution of photons across PSII, reducing thereby their light use efficiency. Such a decrease of P with increasing irradiance was previously observed in SO phytoplankton species (Heiden et al., 2016; Trimborn et al., 2017b,2019). An increase in Fv/Fm or P is commonly observed after Fe addition (Hopkinson et al., 2007; Petrou et al., 2014; Pausch et al., 2019), however, this might not always be the case as no such effect was observed here as well as in another SO natural phytoplankton assemblage (Feng et al., 2010).
In addition, under ambient pH the community incubated under the high light low mixing scenario had a lower LH:LP ratio compared to the low light moderate mixing treatment. The reason for this was a significant increase of the concentration of the LP pigment DD, which indicates a shift from a previous LH toward a more LP state. In many phytoplankton groups, DD plays an important role in the dissipation of excess energy under high irradiances as part of the xanthophyll cycle (Dimier et al., 2009). Such an increase in the LP relative to LH pigments in response to high light was previously observed for various SO phytoplankton species (Van Leeuwe et al., 2005; Kropuenske et al., 2010; Van De Poll et al., 2011; Alderkamp et al., 2019; Trimborn et al., 2019). As Fe is required for chlorophyll synthesis, the addition of Fe under low light in the strong mixing scenario likely increased the LH:LP ratio here, as previously observed in various SO phytoplankton culture experiments (Van Leeuwe and Stefels, 1998; Hoffmann et al., 2008; Alderkamp et al., 2012; Luxem et al., 2017). Apart from the latter adjustment, photophysiological characteristics of the community exposed to strong mixing remained the same. Overall, these photophysiological adjustments enabled both communities to maintain similar ETRmax and POC production rates.
Both Future Mixing Scenarios Alter Numerical Abundance of Diatoms and Nanoflagellates Without Affecting Particulate Organic Carbon Production Under Ambient pH
At ambient pH, during the first growth phase, the relative numerical contribution of diatoms and nanoflagellates did not change between the initial phytoplankton community and the moderate mixing treatment, but was altered under both future mixing scenarios, with a significant numerical increase in diatoms relative to nanoflagellates. Thus, both higher light availability, as simulated in the low mixing scenario, and higher Fe availability, as simulated in the strong mixing scenario, promoted diatom growth compared to nanoflagellates. Even though diatoms became numerically more abundant in both future mixing scenarios, this did not change net POC production under ambient pH, not even for the Fe-enriched strong mixing treatment. This is in line with previous observations, showing that the productivity of a phytoplankton community can remain the same even when exposed to changes in environmental factors such as light, temperature, OA or Fe (Trimborn et al., 2017a; Hoppe et al., 2018; Heiden et al., 2019). Another reason why net POC production remained constant irrespective of higher light (low mixing treatment) or Fe input (strong mixing treatment) could be secondary or co-limitation by other TMs and vitamins, as previously reported for SO phytoplankton communities (Panzeca et al., 2006; Browning et al., 2021; Balaguer et al., 2022).
Ocean Acidification Lowered the Numerical Abundance of Diatoms in Both Future Mixing Scenarios
Previous laboratory and field studies showed that both OA and high light reduce growth and POC production of various diatoms (Gao et al., 2012; Heiden et al., 2016, 2019; Trimborn et al., 2017b; Beszteri et al., 2018; Donahue et al., 2019). Such reduction in growth or biomass buildup was, however, not found for P. antarctica (Trimborn et al., 2014, 2017a,b; Thoisen et al., 2015; Koch et al., 2018). In this study, under ambient pH both increased light or Fe addition (strong and low mixing treatment, respectively) enhanced the numerical abundance of diatoms relative to the nanoflagellates. This positive effect by the two factors light and Fe for the diatoms, however, vanished when also being exposed to OA in both future mixing scenarios. In agreement with previous studies, we observed a negative effect of OA and high light, as simulated by the low mixing scenario, on the numerical abundance of diatoms, but not of nanoflagellates. The higher light availability on the other hand could have caused photolysis of Fe-binding ligands, thereby enhancing Fe availability for phytoplankton cells (Anderson and Morel, 1982; Barbeau et al., 2001; Küpper et al., 2006; Amin et al., 2009), as seen in the observed higher Fe content of the low mixing community. Thus, the negative effect of OA and high light was potentially dampened by the higher intracellular Fe content of the low mixing community, thereby resulting in no relative change of POC production in response to OA and high light.
In the low light strong mixing scenario, OA had also a negative effect on the numerical abundance of diatoms, even though Fe was added. Negative OA effects on the growth of diatoms were previously reported under low light conditions, potentially caused by higher metabolic costs (Hoogstraten et al., 2012; Heiden et al., 2016). The latter could explain why no OA-dependent increase in the number of diatoms was found under the low light conditions of the strong mixing scenario. For this scenario, OA also resulted in a significant decrease of the POC production rate, indicating that the overall productivity of the numerically diatom-dominated community was reduced. Hence, OA negatively influenced the diatom-dominated communities in both future mixing scenarios, with different implications for their productivity during the first growth phase.
At the end of the experiment, diatoms reached their maximum numerical abundance across treatments (∼80%). In agreement with this study, Xu et al. (2014) observed that irrespective of changes in temperature, pH, Fe and light the diatom Fragilariopsis cylindrus was more abundant than the prymnesiophyte P. antarctica. Surprisingly, in this study the higher light availability stimulated POC production of the low mixing community at ambient pH, suggesting that the cells benefited from an increase in light, even though Fe availability was low. A similar positive response to higher light availability, in particular under Fe-limiting conditions, was previously observed in the Antarctic diatom Thalassiosira antarctica and pinpoints toward the importance of light as driver of SO phytoplankton ecophysiology (Andrew et al., 2019). Similarly, under OA POC production rate of the low mixing community was high relative to the moderate mixed community indicating also a stimulation by high light. There was, however, a significant OA dependent reduction by 9% in the POC production rate in the low mixing community (p < 0.05, Student’s t-test). Such a reduction was already observed in various diatoms (Gao et al., 2012; Heiden et al., 2016, 2019; Trimborn et al., 2017b; Beszteri et al., 2018; Donahue et al., 2019), indicating that the combination of OA with high light was particularly stressful for the numerically diatom-dominated community.
Similar to the first growth phase, at the end of the experiment the Fe addition in the strong mixing treatment did not result in enhanced POC production rates at ambient pH. This could be due to a co-limitation by other micronutrients, as previously discussed. Unexpectedly, at the end of the experiment the exposure to OA resulted in higher POC production rates in the Fe-enriched strong mixing treatment. While we cannot explain this increase, these results highlight the complex interaction between multiple environmental factors (Fe, pH, and light). Similar interactive effects by Fe, light, and pH on POC accumulation in a SO phytoplankton community were observed by Feng et al. (2010). Together these results show the complex interplay of multiple factors, resulting in community responses that cannot be predicted by reactions to one or two factors. Overall, our study suggests a continued numerical dominance of diatoms, irrespective of light and Fe availability. The increased carbon production under both future mixing scenarios under OA suggests a higher productivity of the currently Fe-limited open ocean waters of the SO.
Data Availability Statement
The raw data supporting the conclusions of this article will be made available by the authors, without undue reservation.
Author Contributions
FK and ST designed and conducted the experiment. FP analyzed the samples, performed the statistical analysis, and wrote the first draft of the manuscript. FP, FK, CH, and ST edited the manuscript. All authors contributed to manuscript revision, read, and approved the submitted version.
Funding
FP, FK, and ST were funded by the Helmholtz Impulse Fond (HGF Young Investigators Group EcoTrace, VH-NG-901). AB’s contribution was partially funded by the Helmholtz Infrastructure Initiative FRAM and DFG-Priority Program SPP 1158 “Antarktis” PhySyn Br2913/3.
Conflict of Interest
The authors declare that the research was conducted in the absence of any commercial or financial relationships that could be construed as a potential conflict of interest.
Publisher’s Note
All claims expressed in this article are solely those of the authors and do not necessarily represent those of their affiliated organizations, or those of the publisher, the editors and the reviewers. Any product that may be evaluated in this article, or claim that may be made by its manufacturer, is not guaranteed or endorsed by the publisher.
Acknowledgments
We thank J. Heiden, R. Zimmerman, and P. Karitter for laboratory assistance and C. Völkner and D. Wilhelms-Dick for ICP-MS measurements. We also thank S. Wiegmann and T. Brenneis for assistance with the pigment and POC measurements. Finally, we would like to thank the captain and crew of RV Polarstern during PS97.
Supplementary Material
The Supplementary Material for this article can be found online at: https://www.frontiersin.org/articles/10.3389/fmars.2022.759501/full#supplementary-material
References
Alderkamp, A. C., Garcon, V., de Baar, H. J. W., and Arrigo, K. R. (2011). Short-term photoacclimation effects on photoinhibition of phytoplankton in the Drake Passage (Southern Ocean). Deep. Res. Part I Oceanogr. Res. Pap. 58, 943–955. doi: 10.1016/j.dsr.2011.07.001
Alderkamp, A. C., Kulk, G., Buma, A. G. J., Visser, R. J. W., Van Dijken, G. L., Mills, M. M., et al. (2012). The effect of iron limitation on the photophysiology of Phaeocystis antarctica (Prymnesiophyceae) and Fragilariopsis cylindrus (Bacillariophyceae) under dynamic irradiance. J. Phycol. 48, 45–59. doi: 10.1111/j.1529-8817.2011.01098.x
Alderkamp, A. C., Van Dijken, G. L., Lowry, K. E., Lewis, K. M., Joy-Warren, H. L., Van De Poll, W., et al. (2019). Effects of iron and light availability on phytoplankton photosynthetic properties in the Ross Sea. Mar. Ecol. Prog. Ser. 621, 33–50. doi: 10.3354/meps13000
Amin, S. A., Green, D. H., Hart, M. C., Kupper, F. C., Sunda, W. G., and Carrano, C. J. (2009). Photolysis of iron–siderophore chelates promotes bacterial–algal mutualism. Proc. Natl. Acad. Sci. U.S.A. 106, 17071–17076.
Anderson, M. A., and Morel, F. M. M. (1982). The influence of aqueous iron chemistry on the uptake of iron by the coastal diatom Thalassiosira weissflogii. Limnol. Oceanogr. 27, 789–813. doi: 10.4319/lo.1982.27.5.0789
Andrew, S. M., Morell, H. T., Strzepek, R. F., Boyd, P. W., and Ellwood, M. J. (2019). Iron availability influences the tolerance of Southern Ocean phytoplankton to warming and elevated irradiance. Front. Mar. Sci. 6:681. doi: 10.3389/fmars.2019.00681
Annett, A. L., Lapi, S., Ruth, T. J., and Maldonado, M. T. (2008). The effects of Cu and Fe availability on the growth and Cu:C ratios of marine diatoms. Limnol. Oceanogr. 53, 2451–2461. doi: 10.4319/lo.2008.53.6.2451
Arrigo, K. R., Robinson, D. H., Worthen, D. L., Dunbar, R. B., DiTullio, G. R., VanWoert, M., et al. (1999). Phytoplankton community structure and the drawdown of nutrients and CO2 in the Southern Ocean. Science 283, 365–367. doi: 10.1126/science.283.5400.365
Arrigo, K. R., van Dijken, G. L., and Bushinsky, S. (2008). Primary production in the Southern Ocean, 1997–2006. J. Geophys. Res. 113, 1–27. doi: 10.1029/2007JC004551
Balaguer, J., Koch, F., Hassler, C., and Trimborn, S. (2022). Iron and manganese co-limit the growth of two phytoplankton groups dominant at two locations of the Drake Passage. Commun. Biol. (in press).
Banerjee, R., and Ragsdale, S. W. (2003). The many faces of vitamin B12: catalysis by cobalamin-dependent enzymes. Annu. Rev. Biochem. 72, 209–247. doi: 10.1146/annurev.biochem.72.121801.161828
Barbeau, K., Rue, E. L., Butler, K. W., and Bruland, A. (2001). Photochemical cycling of iron in the surface ocean mediated by microbial iron(III)-binding ligands. Nature 413, 409–413. doi: 10.1017/CBO9780511623370
Basu, S., and Mackey, K. R. M. (2018). Phytoplankton as key mediators of the biological carbon pump: their responses to a changing climate. Sustainability 10:869. doi: 10.3390/su10030869
Behnke, J., and LaRoche, J. (2020). Iron uptake proteins in algae and the role of Iron Starvation-Induced Proteins (ISIPs). Eur. J. Phycol. 55, 339–360. doi: 10.1080/09670262.2020.1744039
Behrenfeld, M. J., and Milligan, A. J. (2013). Photophysiological expressions of iron stress in phytoplankton. Ann. Rev. Mar. Sci. 5, 217–246. doi: 10.1146/annurev-marine-121211-172356
Behrenfeld, M. J., and Boss, E. S. (2014). Resurrecting the ecological underpinnings of ocean plankton blooms. Ann. Rev. Mar. Sci. 6, 167–194. doi: 10.1146/annurev-marine-052913-021325
Beszteri, S., Thoms, S., Benes, V., Harms, L., and Trimborn, S. (2018). The response of three southern ocean phytoplankton species to ocean acidification and light availability: a transcriptomic study. Protist 169, 958–975. doi: 10.1016/j.protis.2018.08.003
Bindoff, N. L. (2019). “Changing ocean, marine ecosystems, and dependent communities coordinating,” in IPCC Special Report on the Ocean and Cryosphere in a Changing Climate, eds H.-O. Pörtner, D. C. Roberts, V. Masson-Delmotte, P. Zhai, M. Tignor, E. Poloczanska, et al. (Geneva: IPCC).
Blanco-Ameijeiras, S., Cabanes, D. J. E., Cable, R. N., Trimborn, S., Jacquet, S., Wiegmann, S., et al. (2020). Exopolymeric substances control microbial community structure and function by contributing to both C and Fe nutrition in Fe-limited southern ocean provinces. Microorganisms 8, 1–21. doi: 10.3390/microorganisms8121980
Bopp, L., Monfray, P., Aumont, O., Dufresne, J. L., Le Treut, H., Madec, G., et al. (2001). Potential impact of climate change on marine export production. Global Biogeochem. Cycles 15, 81–99. doi: 10.1029/1999GB001256
Boyd, P. W., Collins, S., Dupont, S., Fabricius, K., Gattuso, J. P., Havenhand, J., et al. (2018). Experimental strategies to assess the biological ramifications of multiple drivers of global ocean change—A review. Glob. Chang. Biol. 24, 2239–2261. doi: 10.1111/gcb.14102
Boyd, P. W., Dillingham, P. W., Mcgraw, C. M., Armstrong, E. A., Cornwall, C. E., Feng, Y. Y., et al. (2016). Physiological responses of a Southern Ocean diatom to complex future ocean conditions. Nat. Clim. Chang. 6, 207–213. doi: 10.1038/nclimate2811
Boyd, P. W., and Law, C. S. (2011). An Ocean Climate Change Atlas for New Zealand Waters. NIWA Information Series No. 79. Auckland: NIWA, 20.
Boyd, P. W., Strzepek, R., Fu, F., and Hutchins, D. A. (2010). Environmental control of open-ocean phytoplankton groups: now and in the future. Limnol. Oceanogr. 55, 1353–1376. doi: 10.4319/lo.2010.55.3.1353
Bracher, A. U., and Tilzer, M. M. (2001). Underwater light field and phytoplankton absorbance in different surface water masses of the Atlantic sector of the Southern Ocean. Polar Biol. 24, 687–696. doi: 10.1007/s003000100269
Brewer, P. G., Bradshaw, A. L., and Williams, R. T. (1986). “Measurements of total carbon dioxide and alkalinity in the North Atlantic Ocean in 1981,” in The Changing Carbon Cycle: A Global Analysis, eds J. R. Trabalka and D. E. Reichle (New York, NY: Springer), 348–370. doi: 10.1007/978-1-4757-1915-4_18
Browning, T. J., Achterberg, E. P., Engel, A., and Mawji, E. (2021). Manganese co-limitation of phytoplankton growth and major nutrient drawdown in the Southern Ocean. Nat. Commun. 12, 1–9. doi: 10.1038/s41467-021-21122-6
Cabanes, D. J. E., Blanco-Ameijeiras, S., Bergin, K., Trimborn, S., Völkner, C., Lelchat, F., et al. (2020). Using Fe chemistry to predict Fe uptake rates for natural plankton assemblages from the Southern Ocean. Mar. Chem. 225:103853. doi: 10.1016/j.marchem.2020.103853
Calvo-Díaz, A., Dìaz-Pérez, L., Suárez, L. Á, Morán, X. A. G., Teira, E., and Marañón, E. (2011). Decrease in the autotrophic-to-heterotrophic biomass ratio of picoplankton in oligotrophic marine waters due to bottle enclosure. Appl. Environ. Microbiol. 77, 5739–5746. doi: 10.1128/AEM.00066-11
Carpenter, S. R. (1996). Microcosm experiments have limited relevance for community and ecosystem ecology. Ecology 77, 677–680. doi: 10.2307/2265490
Carvalho, F., Kohut, J., Oliver, J. M., and Schofield, O. (2017). Defining the ecologically relevant mixed-layer depth for Antarctica’s coastal seas. Geophys. Res. Lett 44, 338–345. doi: 10.1002/2016GL071205
Coad, T., McMinn, A., Nomura, D., and Martin, A. (2016). Effect of elevated CO2 concentration on microalgal communities in Antarctic pack ice. Deep. Res. Part II Top. Stud. Oceanogr. 131, 160–169. doi: 10.1016/j.dsr2.2016.01.005
Cutter, G., Casciotti, K., Croot, P., Geibert, W. Heimbürger, L.-E., Lohan, M., et al. (2017). Sampling and Sample-handling Protocols for GEOTRACES Cruises. GEOTRACES Stand. Intercalibration Comm. Available online at: http://www.geotraces.org/images/stories/documents/intercalibration/Cookbook.pdf
de Baar, H. J. W., de Jong, J. T. M., Bakker, D. C. E., Löscher, B. M., Veth, C., Bathmann, U. V., et al. (1995). Importance of iron for plankton blooms and carbon dioxide drawdown in the Southern Ocean. Nature 373, 412–415. doi: 10.1038/373412a0
Deppeler, S. L., and Davidson, A. T. (2017). Southern ocean phytoplankton in a changing climate. Front. Mar. Sci. 4:40. doi: 10.3389/fmars.2017.00040
Dimier, C., Brunet, C., Geider, R., and Raven, J. (2009). Growth and photoregulation dynamics of the picoeukaryote Pelagomonas calceolata in fluctuating light. Limnol. Oceanogr. 54, 823–836. doi: 10.4319/lo.2009.54.3.0823
Donahue, K., Klaas, C., Dillingham, P. W., and Hoffmann, L. J. (2019). Combined effects of ocean acidification and increased light intensity on natural phytoplankton communities from two Southern Ocean water masses. J. Plankton Res. 41, 30–45. doi: 10.1093/plankt/fby048
Feng, Y., Hare, C. E., Rose, J. M., Handy, S. M., DiTullio, G. R., Lee, P. A., et al. (2010). Interactive effects of iron, irradiance and CO2 on Ross Sea phytoplankton. Deep. Res. Part I Oceanogr. Res. Pap. 57, 368–383. doi: 10.1016/j.dsr.2009.10.013
Feng, Y., Roleda, M. Y., Armstrong, E., Summerfield, T. C., Law, C. S., Hurd, C. L., et al. (2020). Effects of multiple drivers of ocean global change on the physiology and functional gene expression of the coccolithophore Emiliania huxleyi. Glob. Chang. Biol. 26, 5630–5645. doi: 10.1111/gcb.15259
Finkel, Z. V., Quigg, A., Raven, J. A., Reinfelder, J. R., Schofield, O. E., and Falkowski, P. G. (2006). Irradiance and the elemental stoichiometry of marine phytoplankton. Limnol. Oceanogr. 51, 2690–2701. doi: 10.4319/lo.2006.51.6.2690
Frölicher, T. L., Sarmiento, J. L., Paynter, D. J., Dunne, J. P., Krasting, J. P., and Winton, M. (2015). Dominance of the Southern Ocean in anthropogenic carbon and heat uptake in CMIP5 models. J. Clim. 28, 862–886. doi: 10.1175/JCLI-D-14-00117.1
Gao, K., Helbling, E. W., Häder, D. P., and Hutchins, D. A. (2012). Responses of marine primary producers to interactions between ocean acidification, solar radiation, and warming. Mar. Ecol. Prog. Ser. 470, 167–189. doi: 10.3354/meps10043
Garcia, H., Weathers, K. W., Paver, C. R., Smolyar, I., Boyer, T. P., Locarnini, R. A., et al. (2019). World Ocean Atlas 2018. Volume 4: Dissolved Inorganic Nutrients. NOAA Atlas NESDIS 82. Washington, DC: NOAA, 2.
Gran, G. (1952). Determination of the equivalence point in potentiometric titrations. Part II Analyst 77, 661–671.
Grasshoff, K., Kremling, K., and Ehrhardt, M., (eds.) (1999). Methods of Seawater Analysis, 3rd Edn. Weinheim: Wiley-VCH.
Hassler, C. S., and Schoemann, V. (2009). Bioavailability of organically bound Fe to model phytoplankton of the Southern Ocean. Biogeosciences 6, 2281–2296. doi: 10.5194/bg-6-2281-2009
Hassler, C. S., Schoemann, V., Mancuso Nichols, C., Butler, E. C. V., and Boyd, P. W. (2011). Saccharides enhance iron bioavailability to Southern Ocean phytoplankton. Proc. Natl. Acad. Sci. U.S.A. 108, 1076–1081.
Hauck, J., Völker, C., Wolf-Gladrow, D. A., Laufkötter, C., Vogt, M., Aumont, O., et al. (2015). On the Southern Ocean CO2 uptake and the role of the biological carbon pump in the 21st century. Glob. Biogeochem. Cycles 29, 1451–1470. doi: 10.1002/2015GB005140.Received
Heiden, J. P., Bischof, K., and Trimborn, S. (2016). Light intensity modulates the response of two antarctic diatom species to ocean acidification. Front. Mar. Sci. 3:260. doi: 10.3389/fmars.2016.00260
Heiden, J. P., Thoms, S., Bischof, K., and Trimborn, S. (2018). Ocean acidification stimulates particulate organic carbon accumulation in two Antarctic diatom species under moderate and high natural solar radiation. J. Phycol. 54, 505–517. doi: 10.1111/jpy.12753
Heiden, J. P., Völkner, C., Jones, E. M., Van De Poll, W. H., Buma, A. G. J., Meredith, M. P., et al. (2019). Impact of ocean acidification and high solar radiation on productivity and species composition of a late summer phytoplankton community of the coastal Western Antarctic Peninsula. Limnol. Oceanogr. 64, 1–21. doi: 10.1002/lno.11147
Helliwell, K. E., Wheeler, G. L., Leptos, K. C., Goldstein, R. E., and Smith, A. G. (2011). Insights into the evolution of vitamin B12 auxotrophy from sequenced algal genomes. Mol. Biol. Evol. 28, 2921–2933. doi: 10.1093/molbev/msr124
Henson, S. A., Beaulieu, C., Ilyina, T., John, J. G., Long, M., Séférian, R., et al. (2017). Rapid emergence of climate change in environmental drivers of marine ecosystems. Nat. Commun. 8:14682. doi: 10.1038/ncomms14682
Ho, T., Quigg, A., Finkel, Z. V., Milligan, A. J., Wyman, K., Falkowski, P. G., et al. (2003). The elemental composition of some marine phytoplankton. J. Phycol. 39, 1145–1159.
Hoffmann, L. J., Peeken, I., and Lochte, K. (2008). Iron, silicate, and light co-limitation of three Southern Ocean diatom species. Polar Biol. 31, 1067–1080. doi: 10.1007/s00300-008-0448-6
Hoogstraten, A., Peters, M., Timmermans, K. R., and De Baar, H. J. W. (2012). Combined effects of inorganic carbon and light on Phaeocystis globosa Scherffel (Prymnesiophyceae). Biogeosciences 9, 1885–1896. doi: 10.5194/bg-9-1885-2012
Hopkinson, B. M., Mitchell, B. G., Reynolds, R. A., Wang, H., Selph, K. E., Measures, C. I., et al. (2007). Iron limitation across chlorophyll gradients in the southern Drake Passage: phytoplankton responses to iron addition and photosynthetic indicators of iron stress. Limnol. Oceanogr. 52, 2540–2554. doi: 10.4319/lo.2007.52.6.2540
Hoppe, C. J., Hassler, C. S., Payne, C. D., Tortell, P. D., Rost, B., and Trimborn, S. (2013). Iron limitation modulates ocean acidification effects on southern ocean phytoplankton communities. PLoS One 8:e79890. doi: 10.1371/journal.pone.0079890
Hoppe, C. J. M., Holtz, L.-M., Trimborn, S., and Rost, B. (2015). Ocean acidification decreases the light-use efficiency in an Antarctic diatom under dynamic but not constant light. New Phytol. 207, 159–171. doi: 10.1111/nph.13334
Hoppe, C. J. M., Wolf, K. K. E., Schuback, N., Tortell, P. D., and Rost, B. (2018). Compensation of ocean acidification effects in Arctic phytoplankton assemblages. Nat. Clim. Chang. 8, 529–533. doi: 10.1038/s41558-018-0142-9
Huot, Y., and Babin, M. (2010). “Overview of fluorescence protocols: theory, basic concepts, and practice,” in Chlorophyll A Fluorescence In Aquatic Sciences: Methods And Applications, eds D. J. Suggett, M. A. Borowitzka, and O. Prášil (Berlin: Springer), doi: 10.1007/978-90-481-9268-7
Hutchins, D. A., Witter, A. E., Butler, A., and Luther, G. W. (1999). Competition among marine phytoplankton for different chelated iron species. Nature 400, 858–861. doi: 10.1038/23680
IPCC (2014). in Synthesis Report. Contribution of Working Groups I, II and III to the Fifth Assessment Report of the Intergovernmental Panel on Climate Change, eds R. K. Pachauri and L. A. Meyer Geneva (Geneva: IPCC).
Jiang, L. Q., Carter, B. R., Feely, R. A., Lauvset, S. K., and Olsen, A. (2019). Surface ocean pH and buffer capacity: past, present and future. Sci. Rep. 9:18624. doi: 10.1038/s41598-019-55039-4
Khatiwala, S., Primeau, F., and Hall, T. (2009). Reconstruction of the history of anthropogenic CO2 concentrations in the ocean. Nature 462, 346–350. doi: 10.1038/nature08526
Klug, A. (2010). The discovery of zinc fingers and their applications in gene regulation and genome manipulation. Annu. Rev. Biochem. 79, 213–231. doi: 10.1146/annurev-biochem-010909-095056
Koch, F., Beszteri, S., Harms, L., and Trimborn, S. (2018). The impacts of iron limitation and ocean acidification on the cellular stoichiometry, photophysiology, and transcriptome of Phaeocystis antarctica. Limnol. Oceanogr. 64, 357–375. doi: 10.1002/lno.11045
Koch, F., Marcoval, M. A., Panzeca, C., Bruland, K. W., Sañudo-Wilhelmy, S. A., and Gobler, C. J. (2011). The effect of vitamin B12 on phytoplankton growth and community structure in the Gulf of Alaska. Limnol. Oceanogr. 56, 1023–1034. doi: 10.4319/lo.2011.56.3.1023
Koch, F., and Trimborn, S. (2019). Limitation by Fe, Zn, Co, and B12 results in similar physiological responses in two antarctic phytoplankton species. Front. Mar. Sci. 6:514. doi: 10.3389/fmars.2019.00514
Kropuenske, L. R., Mills, M. M., Van Dijken, G. L., Alderkamp, A. C., Mine Berg, G., Robinson, D. H., et al. (2010). Strategies and rates of photoacclimation in two major Southern Ocean phytoplankton taxa: Phaeocystis antarctica (haptophyta) and Fragilariopsis cylindrus (bacillariophyceae). J. Phycol. 46, 1138–1151. doi: 10.1111/j.1529-8817.2010.00922.x
Küpper, F. C., Carrano, C. J., Kuhn, J. U., and Butler, A. (2006). Photoreactivity of iron(III)-aerobactin: photoproduct structure and iron(III) coordination. Inorg. Chem. 45, 6028–6033. doi: 10.1021/ic0604967
Laglera, L. M., and Van Den Berg, C. M. G. (2009). Evidence for geochemical control of iron by humic substances in seawater. Limnol. Oceanogr. 54, 610–619. doi: 10.4319/lo.2009.54.2.0610
Laufkötter, C., Vogt, M., Gruber, N., Aita-Noguchi, M., Aumont, O., Bopp, L., et al. (2015). Drivers and uncertainties of future global marine primary production in marine ecosystem models. Biogeosciences 12, 6955–6984. doi: 10.5194/bg-12-6955-2015
Lee, J. G., and Morel, F. M. M. (1995). Replacement of zinc by cadmium in marine phytoplankton. Mar. Ecol. Prog. Ser. 127, 305–309. doi: 10.3354/meps127305
Lovenduski, N. S., and Gruber, N. (2005). Impact of the Southern Annular Mode on Southern Ocean circulation and biology. Geophys. Res. Lett. 32, 1–4. doi: 10.1029/2005GL022727
Luxem, K. E., Ellwood, M. J., and Strzepek, R. F. (2017). Intraspecific variability in Phaeocystis antarctica’s response to iron and light stress. PLoS One 12:e0179751. doi: 10.1371/journal.pone.0179751
Maldonado, M. T., and Price, N. M. (1996). Influence of N substrate on Fe requirements of marine centric diatoms. Mar. Ecol. Prog. Ser. 141, 161–172. doi: 10.3354/meps141161
Marchetti, A., and Maldonado, M. T. (2016). in The Physiology of Microalgae, eds M. A. Borowitzka, J. Beardall, and J. A. Raven Cham (Cham: Springer International Publishing), doi: 10.1007/978-3-319-24945-2
Marchetti, A., Maldonado, M. T., Lane, E. S., and Harrison, P. J. (2006). Iron requirements of the pennate diatom Pseudo-nitzschia: comparison of oceanic (high-nitrate, low-chlorophyll waters) and coastal species. Limnol. Oceanogr. 51, 2092–2101. doi: 10.4319/lo.2006.51.5.2092
Martin, J. H. (1990). Glacial-interglacial CO2 change: the Iron Hypothesis. Paleoceanography 5, 1–13. doi: 10.1029/PA005i001p00001
McQuaid, J. B., Kustka, A. B., Oborník, M., Horák, A., McCrow, J. P., Karas, B. J., et al. (2018). Carbonate-sensitive phytotransferrin controls high-affinity iron uptake in diatoms. Nature 555, 534–537. doi: 10.1038/nature25982
Meijers, A. J. S. (2014). The Southern Ocean in the Coupled Model Intercomparison Project phase 5. Philos. Trans. R. Soc. A 372:20130296.
Mikaloff Fletcher, S. E., Gruber, N., Jacobson, A. R., Doney, S. C., Dutkiewicz, S., Gerber, M., et al. (2006). Inverse estimates of anthropogenic CO2 uptake, transport, and storage by the ocean. Global Biogeochem. Cycles 20:GB2002. doi: 10.1029/2005GB002530
Millero, F., Woosley, R., DiTrolio, B., and Waters, J. (2009). Effect of ocean acidification on the speciation of metals in seawater. Oceanography 22, 72–85. doi: 10.5670/oceanog.2009.98
Morel, F. M. M., Lam, P. J., and Saito, M. A. (2020). Trace metal substitution in marine phytoplankton. Annu. Rev. Earth Planet. Sci. 48, 491–517.
Oxborough, K., Moore, C. M., Suggett, D. J., Lawson, T., Chan, H. G., and Geider, R. J. (2012). Direct estimation of functional PSII reaction center concentration and PSII electron flux on a volume basis: a new approach to the analysis of Fast Repetition Rate fluorometry (FRRf) data. Limnol. Oceanogr. Methods 10, 142–154. doi: 10.4319/lom.2012.10.142
Panassa, E., Völker, C., Wolf-Gladrow, D., and Hauck, J. (2018). Drivers of interannual variability of summer mixed layer depth in the southern ocean between 2002 and 2011. J. Geophys. Res. Ocean. 123, 5077–5090. doi: 10.1029/2018JC013901
Panzeca, C., Tovar-Sanchez, A., Agustí, S., Reche, I., Duarte, C. M., Taylor, G. T., et al. (2006). B vitamins as regulators of phytoplankton dynamics. Eos (Washington. DC) 87, 4–6. doi: 10.1029/2006EO520001
Passow, U., and Laws, E. A. (2015). Ocean acidification as one of multiple stressors: growth response of Thalassiosira weissflogii (diatom) under temperature and light stress. Mar. Ecol. Prog. Ser. 541, 75–90. doi: 10.3354/meps11541
Pausch, F., Bischof, K., and Trimborn, S. (2019). Iron and manganese co-limit growth of the Southern Ocean diatom Chaetoceros debilis. PLoS One 14:e0221959.
Peers, G., Quesnel, S.-A., and Price, N. M. (2005). Copper requirements for iron acquisition and growth of coastal and oceanic diatoms. Limnol. Ocean. 50, 1149–1158. doi: 10.4319/lo.2005.50.4.1149
Petrou, K., Hassler, C. S., Doblin, M. A., Shelly, K., Schoemann, V., van den Enden, R., et al. (2011). Iron-limitation and high light stress on phytoplankton populations from the Australian Sub-Antarctic Zone (SAZ). Deep. Res. Part II Top. Stud. Oceanogr. 58, 2200–2211. doi: 10.1016/j.dsr2.2011.05.020
Petrou, K., Kranz, S. A., Trimborn, S., Hassler, C. S., Ameijeiras, S. B., Sackett, O., et al. (2016). Southern Ocean phytoplankton physiology in a changing climate. J. Plant Physiol. 203, 135–150. doi: 10.1016/j.jplph.2016.05.004
Petrou, K., Trimborn, S., Rost, B., Ralph, P. J., and Hassler, C. S. (2014). The impact of iron limitation on the physiology of the Antarctic diatom Chaetoceros simplex. Mar. Biol. 161, 925–937. doi: 10.1007/s00227-014-2392-z
Ralph, P. J., and Gademann, R. (2005). Rapid light curves: a powerful tool to assess photosynthetic activity. Aquat. Bot. 82, 222–237. doi: 10.1016/j.aquabot.2005.02.006
Raven, J. A., Evans, M. C. W., and Korb, R. E. (1999). The role of trace metals in photosynthetic electron transport in O2-evolving organisms. Photosynth. Res. 60, 111–149. doi: 10.1023/a:1006282714942
Sabine, C. L., Feely, R. A., Gruber, N., Key, R. M., Lee, K., Bullister, J. L., et al. (2004). The Oceanic Sink for Anthropogenic CO2. Science 305, 367–371.
Saito, M. A., and Goepfert, T. J. (2008). Zinc-cobalt colimitation of Phaeocystis antarctica. Limnol. Oceanogr. 53, 266–275. doi: 10.4319/lo.2008.53.1.0266
Saito, M. A., Goepfert, T. J., and Ritt, J. T. (2008). Some thoughts on the concept of colimitation: three definitions and the importance of bioavailability. Limnol. Oceanogr. 53, 276–290. doi: 10.4319/lo.2008.53.1.0276
Sarmiento, J. L., Slater, R., Barber, R., Bopp, L., Doney, S. C., Hirst, A. C., et al. (2004). Response of ocean ecosystems to climate warming. Global Biogeochem. Cycles 18:GB3003. doi: 10.1029/2003GB002134
Schuback, N., Schallenberg, C., Duckham, C., Maldonado, M. T., and Tortell, P. D. (2015). Interacting effects of light and iron availability on the coupling of photosynthetic electron transport and CO2-assimilation in marine phytoplankton. PLoS One 10:e0133235. doi: 10.1371/journal.pone.0133235
Seifert, M., Rost, B., Trimborn, S., and Hauck, J. (2020). Meta-analysis of multiple driver effects on marine phytoplankton highlights modulating role of pCO2. Glob. Chang. Biol. 26, 6787–6804. doi: 10.1111/gcb.15341
Shi, D., Xu, Y., Hopkinson, B. M., and Morel, F. M. M. (2010). Effect of ocean acidification on iron availability to marine phytoplankton. Science 327, 676–679. doi: 10.1126/science.1183517
Smetacek, V., Klaas, C., Strass, V. H., Assmy, P., Montresor, M., Cisewski, B., et al. (2012). Deep carbon export from a Southern Ocean iron-fertilized diatom bloom. Nature 487, 313–319. doi: 10.1038/nature11229
Smith, W. O., and Jones, R. M. (2015). Vertical mixing, critical depths, and phytoplankton growth in the Ross Sea science. ICES J. Mar. Sci. 72, 1952–1960. doi: 10.1038/278097a0
Sommer, U., and Stabel, H. H. (1986). Near surface nutrient and phytoplankton distribution in the Drake Passage during early December. Polar Biol. 6, 107–110. doi: 10.1007/BF00258261
Suggett, D. J., MacIntyre, H. L., and Geider, R. J. (2004). Evaluation of biophysical and optical determinations of light absorption by photosystem II in phytoplankton. Limnol. Oceanogr. Methods 2, 316–332. doi: 10.4319/lom.2004.2.316
Suggett, D. J., Moore, C. M., Hickman, A. E., and Geider, R. J. (2009). Interpretation of fast repetition rate (FRR) fluorescence: signatures of phytoplankton community structure versus physiological state. Mar. Ecol. Prog. Ser. 376, 1–19. doi: 10.3354/meps07830
Sunda, W. G., and Huntsman, S. A. (1995). Iron uptake and growth limitation in oceanic and coastal phytoplankton. Mar. Chem. 50, 189–206.
Sunda, W. G., and Huntsman, S. A. (1998). Processes regulating cellular metal accumulation and physiological effects: phytoplankton as model systems. Sci. Total Environ. 219, 165–181. doi: 10.1016/S0048-9697(98)00226-5
Sverdrup, H. U. (1953). On conditions for the vernal blooming of phytoplankton. J. Cons. Cons. Int. Explor. Mer 18, 287–295. doi: 10.4319/lom.2007.5.269
Takahashi, T., Sutherland, S. C., Sweeney, C., Poisson, A., Metzl, N., Tilbrook, B., et al. (2002). Global sea–air CO2 flux basedon climatological surface ocean pCO2, andseasonal biological andtemperature effects. Deep Sea Res. Part II 19, 1601–1622.
Thoisen, C., Riisgaard, K., Lundholm, N., Nielsen, T. G., and Hansen, P. J. (2015). Effect of acidification on an Arctic phytoplankton community from Disko Bay, West Greenland. Mar. Ecol. Prog. Ser. 520, 21–34. doi: 10.3354/meps11123
Timmermans, K. R., Davey, M. S., Van der Wagt, B., Snoek, J., Geider, R. J., Veldhuis, M. J. W., et al. (2001). Co-limitation by iron and light of Chaetoceros brevis, C. dichaeta and C. calcitrans (Bacillariophyceae). Mar. Ecol. Prog. Ser. 217, 287–297. doi: 10.3354/meps217287
Timmermans, K. R., Van Der Wagt, B., Veldhuis, M. J. W., Maatman, A., and De Baar, H. J. W. (2005). Physiological responses of three species of marine pico-phytoplankton to ammonium, phosphate, iron and light limitation. J. Sea Res. 53, 109–120. doi: 10.1016/j.seares.2004.05.003
Trimborn, S., Hoppe, C. J. M., Taylor, B. B., Bracher, A., and Hassler, C. (2015). Physiological characteristics of open ocean and coastal phytoplankton communities of Western Antarctic Peninsula and Drake Passage waters. Deep Sea Res. Part I Oceanogr. Res. Pap. 98, 115–124. doi: 10.1016/j.dsr.2014.12.010
Trimborn, S., Thoms, S., Bischof, K., and Beszteri, S. (2019). Susceptibility of two Southern Ocean phytoplankton key species to iron limitation and high light. Front. Mar. Sci. 6:167. doi: 10.3389/FMARS.2019.00167
Trimborn, S., Thoms, S., Brenneis, T., Heiden, J. P., Beszteri, S., and Bischof, K. (2017b). Two Southern Ocean diatoms are more sensitive to ocean acidification and changes in irradiance than the prymnesiophyte Phaeocystis antarctica. Physiol. Plant. 160, 155–170. doi: 10.1111/ppl.12539
Trimborn, S., Brenneis, T., Hoppe, C. J. M., Laglera, L. M., Norman, L., Santos-Echeandía, J., et al. (2017a). Iron sources alter the response of Southern Ocean phytoplankton to ocean acidification. Mar. Ecol. Prog. Ser. 578, 35–50. doi: 10.3354/meps12250
Trimborn, S., Thoms, S., Petrou, K., Kranz, S. A., and Rost, B. (2014). Photophysiological responses of Southern Ocean phytoplankton to changes in CO2 concentrations: short-term versus acclimation effects. J. Exp. Mar. Bio. Ecol. 451, 44–54. doi: 10.1016/j.jembe.2013.11.001
Twining, B. S., and Baines, S. B. (2013). The trace metal composition of marine phytoplankton. Ann. Rev. Mar. Sci. 5, 191–215. doi: 10.1146/annurev-marine-121211-172322
Twining, B. S., Baines, S. B., Fisher, N. S., and Landry, M. R. (2004). Cellular iron contents of plankton during the Southern Ocean Iron Experiment (SOFeX). Deep. Res. Part I Oceanogr. Res. Pap. 51, 1827–1850. doi: 10.1016/j.dsr.2004.08.007
Utermöhl, H. (1958). Zur Vervollkommung der quantitativen Phytoplankton-Methodik. Int. Vereinigung Theor. Angew. Limnol. Kom. Limnol. Methoden 9, 1–39.
van de Poll, W. H., Janknegt, P. J., van Leeuwe, M. A., Visser, R. J. W., and Buma, A. G. J. (2009). Excessive irradiance and antioxidant responses of an Antarctic marine diatom exposed to iron limitation and to dynamic irradiance. J. Photochem. Photobiol. B Biol. 94, 32–37. doi: 10.1016/j.jphotobiol.2008.09.003
Van De Poll, W. H., Lagunas, M., De Vries, T., Visser, R. J. W., and Buma, A. G. J. (2011). Non-photochemical quenching of chlorophyll fluorescence and xanthophyll cycle responses after excess PAR and UVR in Chaetoceros brevis, Phaeocystis antarctica and coastal Antarctic phytoplankton. Mar. Ecol. Prog. Ser. 426, 119–131. doi: 10.3354/meps09000
Van Leeuwe, M., and Stefels, J. (1998). Effects of iron and light stress on the biochemical composition of antarctic Phaeocystis sp. (Prymnesiophyceae). II. Pigment composition. J. Phycol. 503, 496–503. doi: 10.1046/j.1529-8817.1998.340486.x
Van Leeuwe, M. A., and Stefels, J. (2007). Photosynthetic responses in Phaeocystis antarctica towards varying light and iron conditions. Biogeochemistry 83, 61–70. doi: 10.1007/s10533-007-9083-5
Van Leeuwe, M. A., Van Sikkelerus, B., Gieskes, W. W. C., and Stefels, J. (2005). Taxon-specific differences in photoacclimation to fluctuating irradiance in an Antarctic diatom and a green flagellate. Mar. Ecol. Prog. Ser. 288, 9–19. doi: 10.3354/meps288009
Venables, H., and Moore, C. M. (2010). Phytoplankton and light limitation in the Southern Ocean: learning from high-nutrient, high-chlorophyll areas. J. Geophys. Res. 115:C02015. doi: 10.1029/2009jc005361
Venrick, E. L., Beers, J. R., and Heinbokel, J. F. (1977). Possible consequences of containing microplankton for physiological rate measurements. J. Exp. Mar. Bio. Ecol. 26, 55–76. doi: 10.1016/0022-0981(77)90080-6
Wolf-Gladrow, D. A., Riebesell, U., Burkhardt, S., and Bijma, J. (1999). Direct effects of CO2 concentration on growth and isotopic composition of marine plankton. Tellus Ser. B Chem. Phys. Meteorol. 51, 461–476. doi: 10.3402/tellusb.v51i2.16324
Keywords: mixing, Southern Ocean, multiple stressors, iron, diatoms, ocean acidification, pH, light
Citation: Pausch F, Koch F, Hassler C, Bracher A, Bischof K and Trimborn S (2022) Responses of a Natural Phytoplankton Community From the Drake Passage to Two Predicted Climate Change Scenarios. Front. Mar. Sci. 9:759501. doi: 10.3389/fmars.2022.759501
Received: 16 August 2021; Accepted: 07 January 2022;
Published: 17 February 2022.
Edited by:
Peng Jin, University of Guangzhou, ChinaReviewed by:
Wei Li, Huangshan University, ChinaLennart Thomas Bach, University of Tasmania, Australia
Copyright © 2022 Pausch, Koch, Hassler, Bracher, Bischof and Trimborn. This is an open-access article distributed under the terms of the Creative Commons Attribution License (CC BY). The use, distribution or reproduction in other forums is permitted, provided the original author(s) and the copyright owner(s) are credited and that the original publication in this journal is cited, in accordance with accepted academic practice. No use, distribution or reproduction is permitted which does not comply with these terms.
*Correspondence: Franziska Pausch, Franziska.Pausch@awi.de