 Bruna Santos Lopes1*
 Karlmer A. B. Corrêa1
 Matheus Eijii Kinchoku Ogasawara1
 Raíza Salomão Precinoto1
 Carla Cristina Cassiano2
 Bruna Moreira Sell3
 Renata Siqueira Melo1
 Paula Caroline dos Reis Oliveira1
 Silvio Frosini de Barros Ferraz1
- 1Department of Forestry Sciences, Luiz de Queiroz College of Agriculture, University of São Paulo, Piracicaba, Brazil
- 2Department of Forestry Engineering, Federal University of Mato Grosso, Cuiabá, Brazil
- 3Center for Technological Development/Postgraduate Program in Water Resources, Federal University of Pelotas, Pelotas, Brazil
Water availability is influenced by climate conditions and physical characteristics such as topography, soil type, and land use and cover. The Atlantic Forest has a long deforestation history and shows a climatic and environmental gradient that results in natural vegetation diversity driven mainly by water availability and local conditions. Therefore, Atlantic Forest ecoregions are expected to show a natural variability of water responses and different hydrological effects caused by land-use cover change. In this study, we compared the hydrological response among 11 Atlantic Forest ecoregions in areas of native vegetation and pasture, using CHIRPS rainfall data, evapotranspiration by the MOD16A2 product of the MODIS satellite and water surplus calculated by the 19-year mass balance for 712 sampling points. The parameter “m”, which can be considered a proxy for local hydrological responsiveness, was calculated by equations based on the Budyko framework and varied between 1.2 and 3.6 in the biome. In 10 of the 11 ecoregions, the parameter “m” in native vegetation was statistically higher than in the pasture, and in the REST, ECOT, SEMI, STEP, and PARK ecoregions this difference was more pronounced. For all ecoregions, the R/P ratio was inversely proportional to the parameter “m”, but there were different levels of variation among them. In wetter and drier areas, there is less variation in the water surplus, while the greatest variations occurred in areas where the PET/P ratio is 1.5. In conclusion, the parameter “m” of native vegetation and pasture varies in different Atlantic Forest ecoregions. The results of each ecoregion regarding hydrological response and implications for water yield can be used to understand and plan changes in land use for water production.
Introduction
Water availability is influenced by climatic factors, such as precipitation and potential evapotranspiration, and by physical characteristics of the environment, such as the type of vegetation (Oudin et al., 2008). The Atlantic Forest biome, which occupies an extension of 128 million hectares from north to south of Brazil (IBGE, 2019), covering different climatic conditions, with tropical, subtropical and semiarid climates (Alvares et al., 2013), reflects in its different ecoregions a variety of local water availability. In addition to the diversity of climatic and environmental conditions in the Atlantic Forest biome, the intense changes in land use can also result in different water responses.
The annual evapotranspiration is higher in forests than in pasturelands in places with similar climatic conditions, so the vegetation type is supposed to be the main factor responsible for evapotranspiration (Choudhury, 1999; Zhang et al., 2001; Liang et al., 2015). Besides, forests and pasturelands' evapotranspiration discrepancy increase the higher the annual precipitation and decreases when the annual precipitation is lower than 500 mm (Zhang et al., 2001). Therefore, in places with low precipitation, climatic conditions would control evapotranspiration. Other factors associated with the physical characteristics of the site could also influence water availability, and these characteristics can be estimated by the equation developed by Zhou et al. (2015), based on Budyko hypothesis, represented by the parameter “m”. The parameter “m” can be considered a proxy for local hydrological responsiveness. Thus, characteristics related to forest cover, area and slope in some regions would be more important for determining water availability than climatic factors (Creed et al., 2014; Zhou et al., 2015). In places with dryness index (PET/P) lower than 1, water availability is expected to be more responsive to land-use changes (Zhou et al., 2015), that is, water availability decreases with increasing forest cover.
Knowing the water availability of the different ecoregions of the Atlantic Forest biome based on their natural characteristics related to climate and vegetation, as well as anthropic changes in land use, can promote greater efficiency and success in conservation measures and management of this biome. The Atlantic Forest biome is one of the biodiversity hotspots (Myers et al., 2000; Galindo-Leal and Câmara, 2003) that have areas, mostly pastures, susceptible to restoration (Latawiec et al., 2015). Currently, the increase in native vegetation cover is driven by global ecosystem restoration goals (United Nations, 2019). The main expected gains with the restoration of the Atlantic Forest are biodiversity conservation, mitigation and adaptation to climate change, and water security for humans (Brancalion et al., 2019). However, the restoration of native vegetation in this biome should consider that each ecoregion may show distinct responses regarding water availability.
Thus, this study aimed to estimate the hydrological responsiveness potential of native vegetation over pastures in the different ecoregions of the Atlantic Forest, and so answer some questions: Is there a difference in hydrological responsiveness among the ecoregions? Does the type of vegetation cover (native or pasture) change hydrological responsiveness in each of the 11 ecoregions? How does the water yield of native vegetation and pasture vary along the dryness gradient? This study intends to support more effective restoration measures in the Atlantic Forest Biome.
Materials and methods
Study area
We selected 11 ecoregions within the coverage area of the Atlantic Forest biome, namely: Arboreal restinga and mangrove (REST), Bushy grassland (BUSH), Deciduous broadleaved forest (DECI), Ecotone (ECOT), Evergreen broadleaved forest (EVER), Mixed needle-broadleaved forest (MIXE), Montane and upper montane forest (MONT), Open ombrophilous forest (OPEN), Parkland savanna (PARK), Semideciduous broadleaved forest (SEMI) and Steppe savanna (STEP) (Figure 1; Supplementary Table 1). These regions were established by the Brazilian Institute of Geography and Statistics (IBGE) and the Brazilian Ministry of Environment (MMA) according to their native forest formation and associated ecosystems, and extend for more than 120 Mha, occupying 17 of the 27 Brazilian states and covering much of the Brazilian coast.
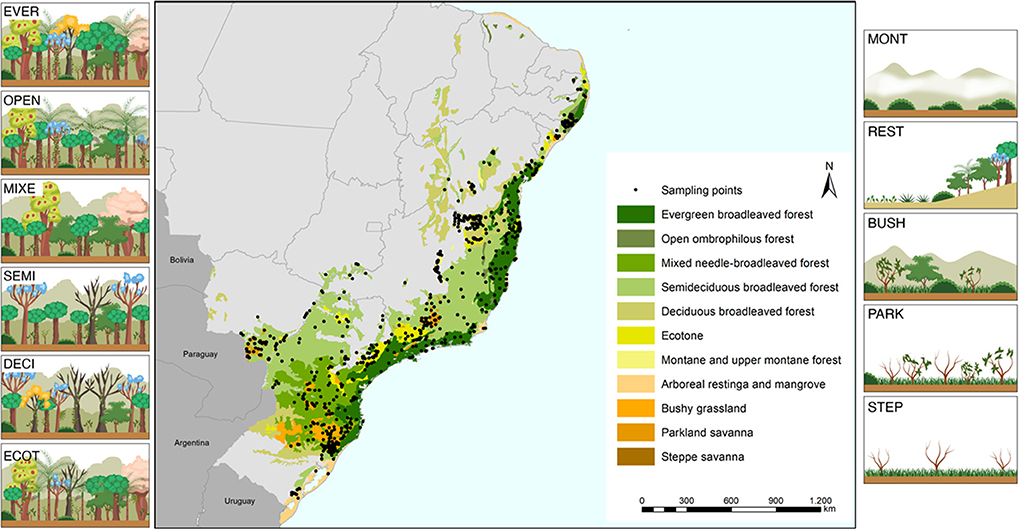
Figure 1. Spatial distribution of the 11 ecoregions of the Atlantic Forest and the location of the points sampled for this study. REST, Arboreal restinga and mangrove; BUSH, Bushy grassland; DECI, Deciduous broadleaved forest; ECOT, Ecotone; EVER, Evergreen broadleaved forest; MIXE, Mixed needle-broadleaved forest; MONT, Montane and upper montane forest; OPEN, Open ombrophilous forest; PARK, Parkland savanna; SEMI, Semideciduous broadleaved forest; STEP, Steppe savanna.
Based on the criteria established for the selection of sampling points, 712 sampling points were found, 344 points in native vegetation and 368 points in pasture, distributed in the 11 ecoregions (Supplementary Table 1).
Data selection
For each of the 11 regions, sampling points were selected in different categories of land use, with conditioning factors of slope and size of the area, from the last 19 years (2001–2019). Land use and occupation was obtained using Collection 5.1 of Brazil's Annual Land Cover and Use Mapping Project (MapBiomas), an open and collaborative monitoring initiative that promotes the annual mapping of land cover and use in Brazil for the last three decades (Souza et al., 2020). The categories of land use were Native Vegetation (NV), which encompasses forest and savanna formations, and Pasture (PA).
Since it is a factor with strong influence on the hydrological response (Shao et al., 2012; Ogasawara, 2020), we chose only sampling points where the slope was lower than 20% in order to reduce its effect. The slope data used were extracted from the Digital Terrain Model (DTM) of the United States Geological Survey (USGS), a product created from the Shuttle Radar Topography Mission (SRTM) data, with a spatial resolution of 30 m (Farr et al., 2007; NASA JPL, 2020).
The minimum size of the area to be sampled was obtained using a grid representing the spatial resolution of MODIS—Moderate Resolution Imaging Spectroradiometer (sensor on board NASA's Terra satellite), for which evapotranspiration data were extracted, with this pixel having a spatial resolution of 500 m. This methodology was used to ensure the concept of pure pixel selection (Plaza et al., 2009), which in this case means that land use covers 100% of the pixel area. This selection allows the values extracted for each pixel to be in fact representative of the class of use of interest, and each sampling point therefore comprises an area of 0.25 km2 (Supplementary Figure 1).
All selection of sampling points and access to the necessary data collections were carried out through the Google Earth Engine (GEE) platform. GEE is a platform that makes it possible to process and share a range of geospatial data with all the storage of information in Google's server cloud. The interface consists of an interactive development environment, where programming codes can be used for data collection and processing (Gorelick et al., 2017).
Based on the criteria explained above, the GEE platform was used to select the sampling points, first evaluating the slope and then the land use cover in the 19 years of coverage. We selected all possible points within these criteria (Figure 1).
Climate data
The climatic data used in this study were also extracted through the GEE platform, according to the databases available in the GEE catalog (Gorelick et al., 2017). These data were extracted by the Application Programming Interface (API) in Phyton language through Google Colab Notebook, which is a Python development environment that connects to the GEE database, storing these data in the Google cloud. We decided to use Evapotranspiration and Precipitation directly from satellite data in order to reduce interference from different field measurements. Also, this data represents a viable alternative to sample a biome as extensive and diverse as the Atlantic Forest.
Evapotranspiration data were extracted from version 6 of MOD16A2.006 (Terra Net Evapotranspiration 8-Day Global 500 m), which is produced from MODIS remote sensing data, such as Leaf Area Index, albedo and surface emissivity, with a resolution of 500 m. The algorithm used in the MOD16 collection is based on the Penman-Monteith (PM) equation. The data are accumulated over a period of 8 days and have been available since 2001 (Running et al., 2017). MOD16 has data every 8 days, which were then used to calculate the accumulation to obtain the annual value.
Precipitation estimates were obtained from the images of the Climate Hazards Group Infra-Red Precipitation with Station (CHIRPS) satellite, which combines an optimized interpolation of techniques, creating a global database of high spatial resolution (0.05°), with daily and monthly intervals, and long data period, from 1981 to the present (Funk et al., 2015). CHIRPS daily precipitation data were also accumulated for the period of 1 year.
Water surplus
For each sample, the hydrological response represented by the water surplus was estimated. From the calculation of the mass balance, evapotranspiration (ET) is the result of the relationship between the water input from the atmosphere and the energy availability in the system (Budyko, 1974). The water balance of a watershed can be described in a simplified way as shown in Equation (1) (Du et al., 2016).
Where:
P = Precipitation
ET = evapotranspiration
Q = Runoff
ΔS = Variation in soil water storage
Considering ΔS ≈ 0 for a complete water year (Hewlett and Nutter, 1969), it follows that P = ET + Q. As geospatial products and not hydrographic monitoring data were used, we chose to use the difference between ET and P, as the water surplus (SURP) of the groups.
Some SURP data showed negative values, which may be due to the sensitivity of satellite data. Although CHIRPS estimates show a marked agreement, being quite similar to the information from weather stations in Brazil (Costa et al., 2019; Santos et al., 2019), for instance, MOD16 evapotranspiration data, in turn, show significant overestimation or underestimation compared to ET data measured in situ (Ramoelo et al., 2014; Tang et al., 2015; Degano et al., 2021).
Because of this, data that were negative and equal to 0 were deleted from the dataset. Also, the sampling points in which this number of years with negative data was greater than nine were also excluded, so that for each sampling point there were at least 10 years of climatic and hydrological data (Ogasawara, 2020). After data filtering, precipitation, potential evapotranspiration and water surplus ranged from 738 to 1,885 mm, 1,144 to 1,814 mm and 201 to 1,062 mm, respectively, in the ecoregions (Supplementary Table 1).
Hydrological model
According to Budyko (1958, 1974) theory, the actual evapotranspiration is the result of a functional balance between the water supply by the atmosphere, represented by precipitation, and the energy availability of the system, represented by potential evapotranspiration. Thus, it is understood that, in regions with high water availability, the actual evapotranspiration will be limited by the energy availability of the system, whereas in regions with high energy availability, the actual evapotranspiration will be limited by water availability. This relationship between evapotranspiration and its variation due to water availability led to the emergence of several studies that sought to better understand the behavior of these variables at different scales. Among the theoretical equations used, the adaptation made by Zhou et al. (2015) for the method of Fu (1981) used global data to validate a pattern of dependence between annual water yield (R) and precipitation on wetness index (P/PET) and watershed characteristics (parameter “m”), resulting in Equation (2) (Fu, 1981; Zhou et al., 2015).
Where:
R/P = dimensionless annual water yield coefficient
P/PET = dimensionless wetness index
m = dimensionless constant representing the watershed characteristics
The adapted Fu model (Zhou et al., 2015) combined applied to small hydrological response units (pixel size of 0.25 km2) was used in order to effects of scale and accumulated interaction of soil/relief commonly observed at watershed scale (Zhang et al., 2017).
A curve was fitted using the R/P and P/PET ratios to provide an average value of “m” for each sampling point of land use in each ecoregion using the non-linear least squares (nls) method with start m = 2. All calculations were performed in the RStudio interface (version 4.0.3) of R software. A relationship between the values of “m” and the water yield coefficient (R/P) was created to observe the water retention capacity for each sampling point (Zhou et al., 2015).
Statistical analysis
To assess the statistical differences between the ecoregions, we compared the values of “m” through the ANOVA statistical test and Tukey test and checked the assumptions of the model of normality and homogeneity of variances by the Shapiro-Wilk and Levene tests, respectively (Sokal and Rohlf, 2012). For the cases in which the assumptions of the model were not met, the data were transformed by the Box-Cox method; for the data set that, even after transformation, continued not meeting the assumptions, the Kruskal-Wallis and Mann-Whitney non-parametric tests were applied (Sprent and Smeeton, 2007).
To check whether there was a statistical difference between the land uses of each ecoregion, we compared the “m” values by the t-test, when the data showed normal distribution verified in the Shapiro-Wilk test and homogeneity of variances verified in the Levene test (Sokal and Rohlf, 2012). As with the previous data set, Box-Cox transformation was applied to the data that did not meet the assumptions of the model and, for those which continued not meeting the assumptions, we applied the Kolmogorov-Smirnov non-parametric test (Sprent and Smeeton, 2007).
The 95% confidence interval was adopted for all statistical analyses, which were performed in the RStudio interface (version 4.1.3) of R software.
Results
Hydrological responsiveness among the ecoregions of the Atlantic Forest biome
The “m” values for the Atlantic Forest biome varied between 1.2 and 3.6, and the means of all ecoregions were between 1.72 and 2.30.
The results showed that there are 2 large groups of ecoregions with statistically different hydrological responsiveness (p < 0.05), namely: (i) Arboreal restinga and mangrove (REST) and Ecotone (ECOT) and (ii) the other ecoregions. In addition, another (sub)group of ecoregions showed similarities with the previous groups, consisting of Ecotone (ECOT), Semideciduous broadleaved forest (SEMI), Steppe savanna (STEP), Evergreen broadleaved forest (EVER), Mixed needle-broadleaved forest (MIXE) and Open ombrophilous forest (OPEN). We highlight that REST is located at an end and BUSH, PARK, DECI and MONT are located at another end. Figure 2 illustrates these results.
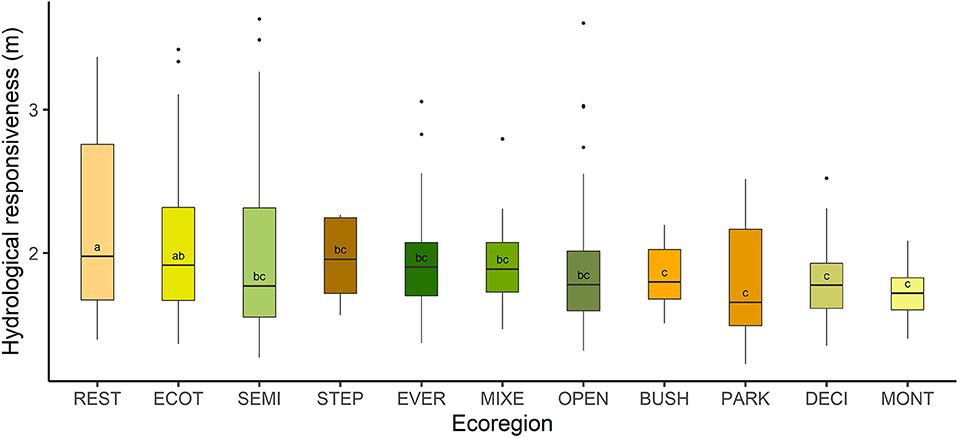
Figure 2. Hydrological responsiveness (m) of the Atlantic Forest ecoregions, Brazil. REST, Arboreal restinga and mangrove; BUSH, Bushy grassland; DECI, Deciduous broadleaved forest; ECOT, Ecotone; EVER, Evergreen broadleaved forest; MIXE, Mixed needle-broadleaved forest; MONT, Montane and upper montane forest; OPEN, Open ombrophilous forest; PARK, Parkland savanna; SEMI, Semideciduous broadleaved forest; STEP, Steppe savanna. Treatments labeled with different letters indicate a significant difference between the means (p < 0.05, analysis of variance followed by multiple comparison test).
Effect of the type of vegetation cover (native or pasture) on hydrological responsiveness in the ecoregions
The “m” values ranged from 1.79 to 2.70 in native vegetation and from 1.48 to 1.75 in pasture. When comparing hydrological responsiveness in terms of land use and cover, a standard behavior was observed in all ecoregions, in which the native vegetation had the highest values of hydrological responsiveness, differing significantly (p < 0.05) from pasture areas, except in the MONT ecoregion (Figure 3).
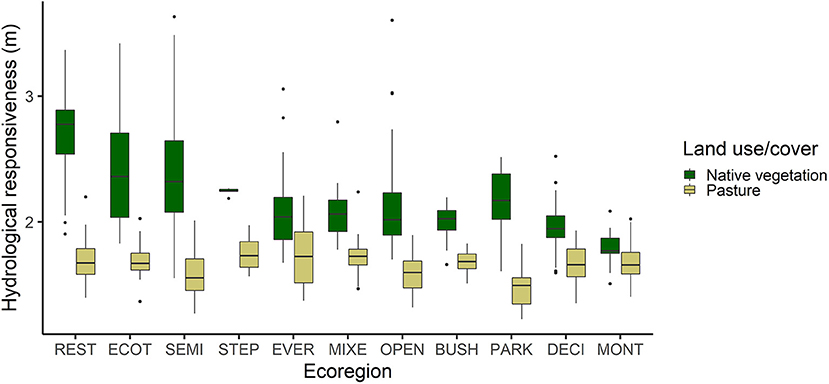
Figure 3. Hydrological responsiveness of natural cover and pasture in the 11 ecoregions of the Atlantic Forest, Brazil. REST, Arboreal restinga and mangrove; BUSH, Bushy grassland; DECI, Deciduous broadleaved forest; ECOT, Ecotone; EVER, Evergreen broadleaved forest; MIXE, Mixed needle-broadleaved forest; MONT, Montane and upper montane forest; OPEN, Open ombrophilous forest; PARK, Parkland savanna; SEMI, Semideciduous broadleaved forest; STEP, Steppe savanna.
Variation of water yield of native vegetation and pasture along the dryness gradient
The general pattern observed was an inversely proportional relationship between the water yield ratio (R/P) and hydrological responsiveness (m). However, water yield is higher in some regions than in others, since places with equal values of “m” vary in their water yield, such as DECI and EVER (Figure 4). Moreover, in some ecoregions the magnitude of the effect of the parameter “m” is greater on the water yield, since the slope of the curves of some ecoregions is more pronounced than that of others, as can be observed in STEP and MONT. However, the effect of the parameter “m” in water yield for STEP cannot be fully conclusive in this ecoregion, which being very small, even selecting all possible points the sampling was very limited.
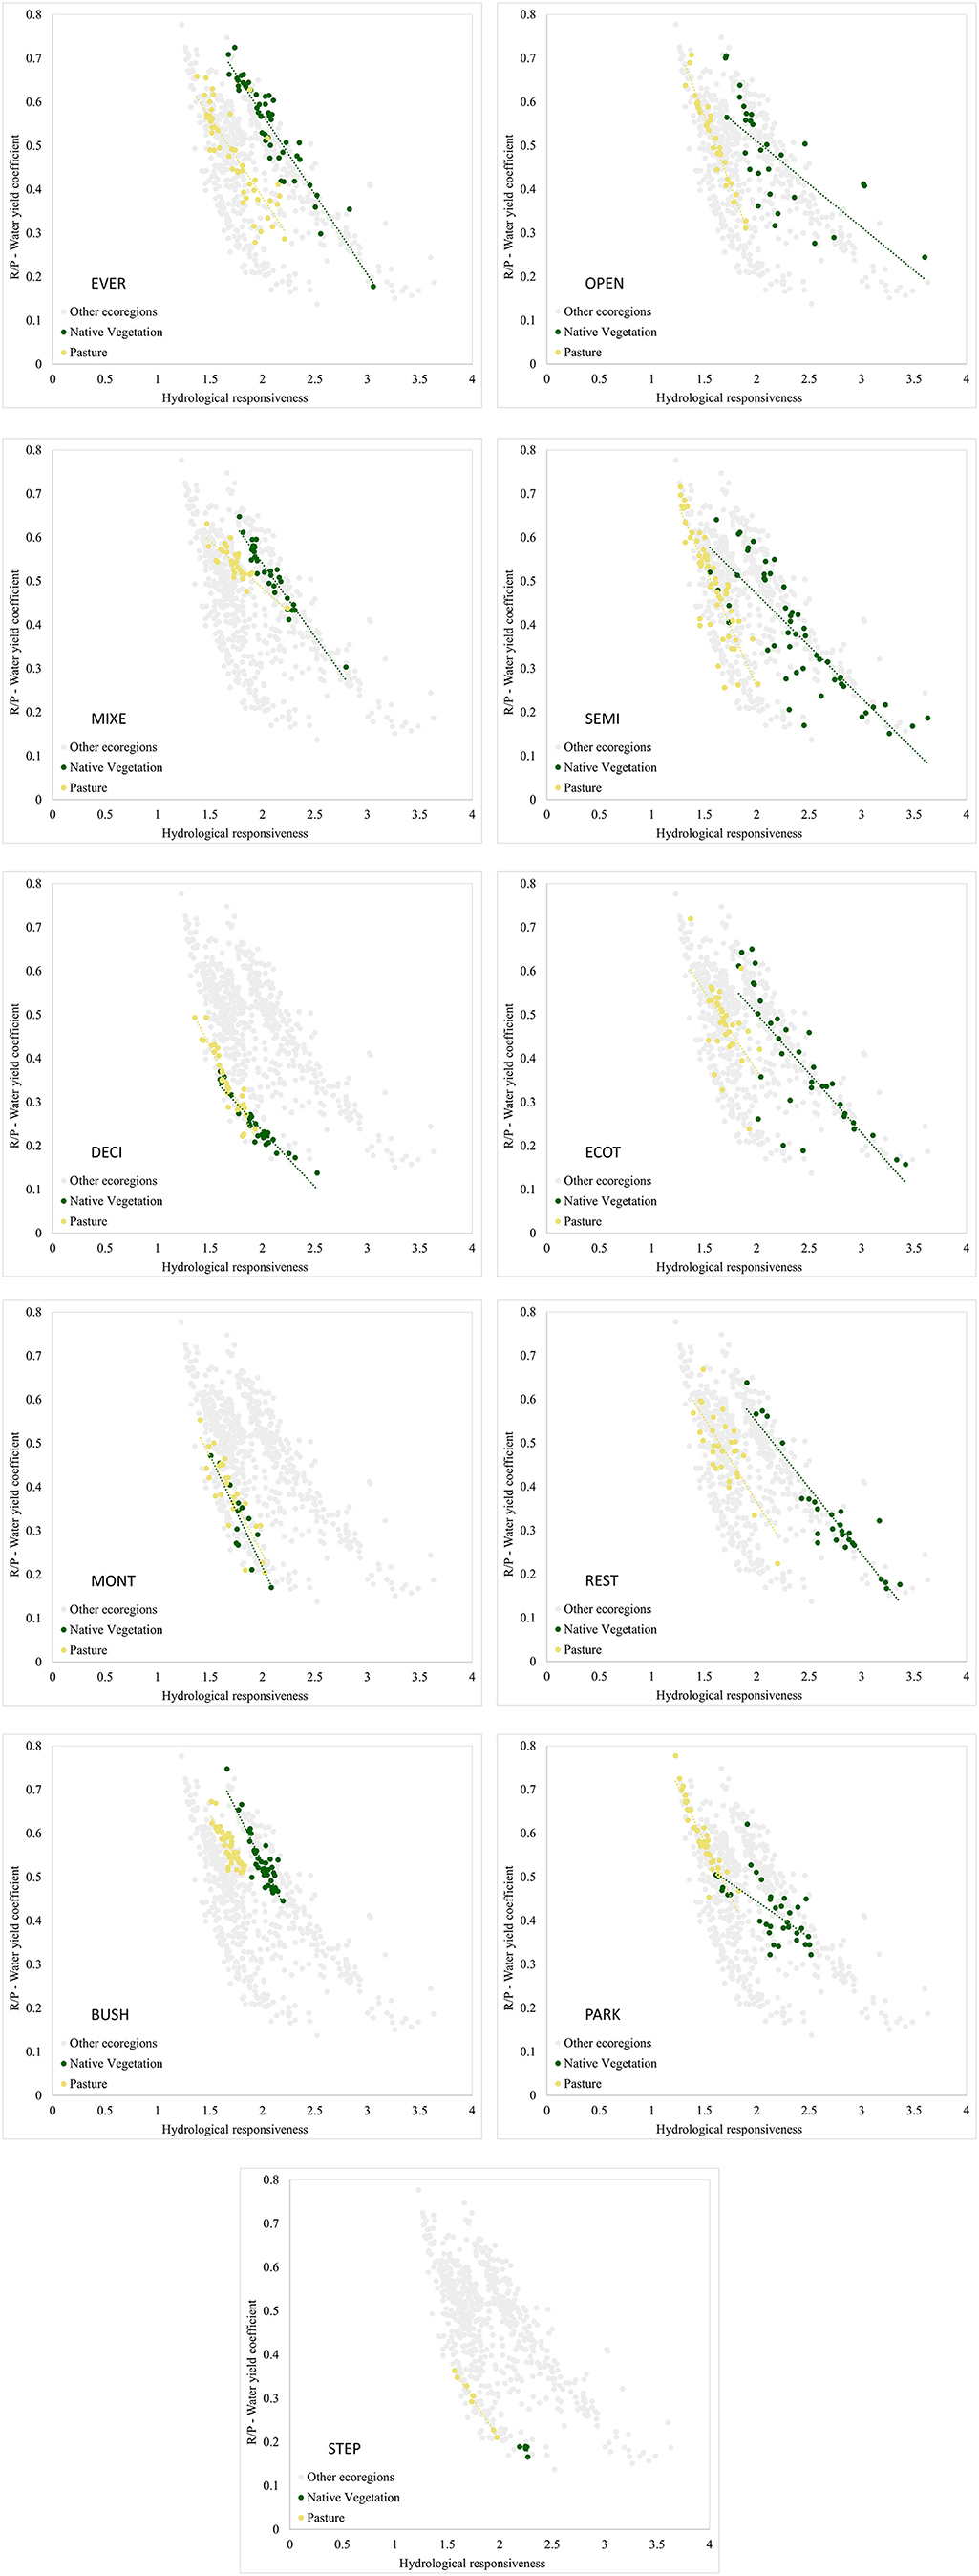
Figure 4. Water yield ratio (R/P) according to the coefficient of hydrological responsiveness (m) for each land use-cover and ecoregion of the Atlantic Forest, Brazil. Gray points represent all ecoregions. REST, Arboreal restinga and mangrove; BUSH, Bushy grassland; DECI, Deciduous broadleaved forest; ECOT, Ecotone; EVER, Evergreen broadleaved forest; MIXE, Mixed needle-broadleaved forest; MONT, Montane and upper montane forest; OPEN, Open ombrophilous forest; PARK, Parkland savanna; SEMI, Semideciduous broadleaved forest; STEP, Steppe savanna.
[n]
When analyzing the relationship between the water yield ratio (R/P) and the dryness index (PET/P), most of the points of native vegetation are in wetter places (PET/P < 1), and this land cover showed a relationship inversely proportional to water yield, that is, the lower the dryness index, the higher the water yield (Figure 5). The native vegetation has a high relationship of reduction in water yield as the dryness index (PET/P) increases in the wettest regions, until R/P begins to stabilize at ~0.3 in the subhumid regions, from PET/P = 1. From this point on, the increase in dryness does not result in changes in water yield.
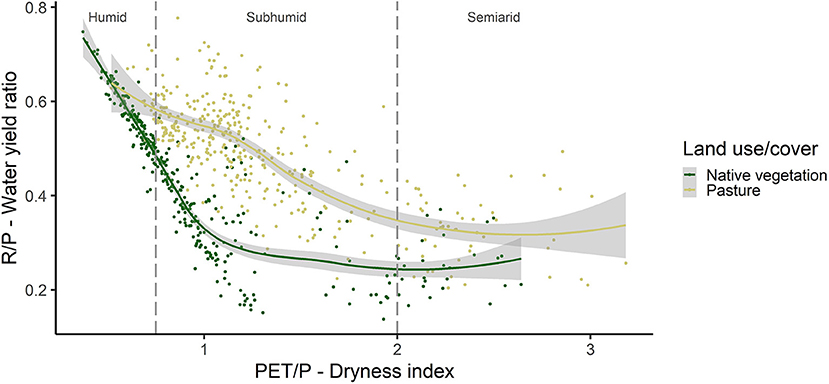
Figure 5. Water yield ratio (R/P) according to the dryness index (PET/P) for natural cover and pasture in the sampled points, separating the climatic regions according to Ponce et al. (2000).
Pastures respond less intensely to the increase in dryness index (PET/P) than native vegetation. However, in humid and subhumid regions the pasture has higher values of R/P, and as PET/P increases the R/P ratio decreases until it stabilizes in the semiarid regions (PET/P > 2), with a value of approximately 0.4. In semiarid regions, the increase in PET/P does not result in greater changes in R/P neither for vegetation nor for pasture.
Discussion
Hydrological responsiveness among the ecoregions of the Atlantic Forest biome
The “m” values in the Atlantic Forest ecoregions (ranging between 1.2 and 3.6, with an average between 1.72 and 2.30) are compatible with those observed on a global scale by Zhou et al. (2015), although these authors estimated “m” values above 4 in some coastal and northeastern regions of Brazil. For the southeast region of Brazil, including the Cerrado biome (Ogasawara, 2020) found “m” values ranging from 1.79 to 3.63 with an average of 2.95, showing that the results are similar. In general, the Atlantic Forest showed a pattern, with mean values of “m” lower than 2.5, demonstrating the hydrological sensitivity of these regions to the change in land use (Zhou et al., 2015). Water sensitivity reflects the greater capacity of forest cover to alter the water response of catchments, as observed in different studies (Zhang et al., 2001; Brown et al., 2005).
Although there is a pattern, the studied ecoregions showed variations in “m” values, possibly due to the different responses obtained in the distributed sampling with the presence of remaining native vegetation and also areas where it was removed (pasture), since these covers have different evapotranspiration rates (Zhang et al., 2001; Huxman et al., 2005). The areas of Arboreal restinga and mangrove (REST) have the highest value of water response and also the highest variability, demonstrating that changes in land use in the ecoregion affect its hydrological responsiveness, which is in line with the high variation in evapotranspiration observed in these environments (Liang et al., 2019).
Another group with intermediate responsiveness is formed by ecoregions with greater coverage in the biome such as Evergreen broadleaved forest (EVER), Mixed needle-broadleaved forest (MIXE) and Semideciduous broadleaved forest (SEMI). These three ecoregions cover more than 68% of the Atlantic Forest area and have been heavily deforested since the colonization of Brazil (Cabral and Cesco, 2008; Supplementary Table 2). The Semideciduous broadleaved forest (SEMI) ecoregion covers the entire western regions of the São Paulo and Minas Gerais states, currently occupied by agriculture, and the high variation in responsiveness makes it possible to infer about the changes in the hydrology of the rivers of this region caused by deforestation that occurred in the past (Fonseca, 1985).
The driest ecoregions with Deciduous broadleaved forest (DECI) and Montane and upper montane forest (MONT) showed lower values and lower variations in “m”. In these regions, low variability may demonstrate the lower sensitivity to change in land use since the response is mostly controlled by climate (Zhou et al., 2015).
The Bushy Grassland (BUSH) ecoregion showed a small variation in the value of “m”, which is explained by the type of natural vegetation with a strong presence of natural grasses (Azevedo et al., 2021). The Parkland Savanna (PARK) ecoregion had the lowest mean value of “m” and high variation, proving to be one of those in transition to the Brazilian Cerrado with highest sensitivity to the change in land use, located in a region with increasing water deficit (Hofmann et al., 2021).
Effect of the type of vegetation cover (native or pasture) on hydrological responsiveness in the ecoregions
The analysis of hydrological responsiveness of native vegetation and pasture covers shows that the change from pasture to native vegetation alters the responsiveness in almost all ecoregions, except Montane and upper montane forest (MONT). This result confirms observations of other studies in the region, demonstrating differences in the water yield of catchments with native vegetation and pasture (Salemi et al., 2013). The main effect of natural vegetation removal is the reduction of responsiveness, that is, the capacity of water retention by the catchment, increasing water yield, but changing its dynamics and regulation (Zhang and Wei, 2012; Zhou et al., 2015). The opposite can also be expected by the restoration of natural vegetation, but with a more pronounced effect on the reduction of water yield due to the increased consumption by young, growing vegetation and with the same age, known as “plantation effect” (Kuczera, 1987).
Indeed, vegetation changes water availability (Zhang et al., 2001; Liu et al., 2018; Wei et al., 2018; Ning et al., 2019). This change is more significant in water-limited regions (Zhou et al., 2015). Thus, the greatest variations in water responses are expected in the areas of Arboreal restinga and mangrove (REST), Ecotone (ECOT), Semideciduous broadleaved forest (SEMI) and Parkland Savanna (PARK), which show differences in the value of “m” between the natural cover and the pasture > 1.
In the case of coastal Restingas and Ecotones, due to the proximity to the coast and drainage to the sea, changes in responsiveness may not be noticeable to the population, but may have effects on the hydrological cycle and regional precipitation due to the transport of wet masses (Ellison et al., 2017). On the other hand, in areas with Semideciduous forest (SEMI), located in the inland part of the country and historically deforested for agricultural use, the conversion of pastures into forests should reduce the flow of streams due to the increase in evapotranspiration (Brown et al., 2005; Huxman et al., 2005), but bringing future benefits for water regulation (Zhang et al., 2001; Brown et al., 2005).
Forested areas have higher evapotranspiration than areas with shorter vegetation, so the increase of forests would cause a decrease in water availability (Zhang et al., 2001; Zhou et al., 2015). On the other hand, in the other regions, which do not show this sensitivity to water limitation (lower values of “m”), the increase in forest cover can intensify hydrological processes or even reduce evaporation rates, resulting in increased water availability, which is also gradually amplified on a time scale, constituting hydrologically more resilient areas (Ning et al., 2019; Ogasawara, 2020). This is the case of the Evergreen broadleaved forest (EVER) ecoregion, where the largest natural reserves of the Atlantic Forest are located (Ribeiro et al., 2009), with lower relative variations in responsiveness due to the conversion of pasture to native forest, probably resulting from the high rainfall of the region. The same result was observed by Salemi et al. (2013), who found no statistical difference in the average flows in paired catchments with native vegetation and pasture of this ecoregion.
Variation in water yield of native vegetation and pasture along the dryness gradient
The relationship between the values of “m” and R/P (water yield ratio) shows an inversely proportional pattern, that is, the higher the value of “m”, the lower the water production (R/P) and vice versa. Considering that the value of “m” here represents mostly the characteristics of land use and that the areas with native vegetation had the highest values of “m”, it is possible to infer that the results obtained in this work show that the increase in native vegetation reduces water production (R/P) in most sampling points, as also observed by Zhou et al. (2015), because forest cover has a strong correlation with the Budyko parameter (“m”) (Li et al., 2013; Zhang et al., 2016; Xing et al., 2018).
However, different levels of variation can be observed. In the first, the intermediate values of “m” (between 1.5 and 2.5) and low water yield (between 0.1 and 0.5) represent regions with water deficit and the removal of natural vegetation can be used as an instrument to increase water yield due to the low natural availability. In these regions, the reverse process of restoration of natural vegetation can reduce the water availability historically affected by deforestation and human occupation, even if it brings long-term regulation benefits. This is the case of the Deciduous broadleaved forest (DECI) ecoregion.
A second level of variation has low values of “m” (between 1 and 2) and high values of water yield (between 0.3 and 0.7), that is, these are regions that do not naturally have the capacity of water retention, due to relief or soil factors, as is the case of the Brazilian Cerrado, but which have water yield very sensitive to change in responsiveness, that is, in land-use change. The Parkland Savanna (PARK) ecoregion is an example of vegetation in which the trees contribute to better soil structuring and water regulation, but which does not have high water consumption due to the natural characteristic of vegetation, adapted to sandy soil and long drought periods (Tobella et al., 2014).
Finally, the third level of variation encompasses the highest values of “m” (from 1.7 to 3.5) and a large variation in water yield (0.15–0.7). This more diverse group, representing regions with higher water retention capacity, contains the Bushy grassland (BUSH) areas, with high yields and low variation in responsiveness due to changes in land use, considering the native vegetation of grasses (Supplementary Table 3). However, this region is subject to variation in water yield through the introduction of commercial planted forests that would significantly alter evapotranspiration (Reichert et al., 2017).
In this group, it is also possible to observe the concentration of samples from Evergreen broadleaved forest (EVER) as areas of high water yield in which natural forests do not affect water yield and also contribute to greater water retention and regulation (Teixeira et al., 2021). At the end of this group, some samples showed the highest values of “m” (good water retention capacity) and the lowest water yields, possibly encompassing taller forest vegetation and high evapotranspiration rates (Calder, 1998). The samples from Semideciduous broadleaved Forest (SEMI) are mixed between the 2nd and 3rd group, perhaps due to the high variability found in this ecoregion, ranging from flatter regions and clay soils to more sloping and sandy regions. In any case, the region is highly sensitive to vegetation changes that affect water yield.
By observing the samples of native vegetation and pasture along the water availability gradient (PET/P) and considering the classification of water availability proposed by Ponce et al. (2000), it is possible to confirm that in humid climate regions (between 0.375 and 0.750) there is a greater effect on land cover change, but the natural vegetation (mostly forests in this region), despite changing water yield, still maintains high water availability, being highly recommended for its effect on water regulation (Beguería et al., 2003; Ranjan et al., 2006; Hall et al., 2022). This region contains mainly the EVER, BUSH, and MIXE ecoregions.
In the subhumid climate range (PET/P between 0.76 and 2.00) are the greatest effects of the change in natural cover to pasture and vice versa. This is the most critical region for changes in vegetation cover, since it represents a large part of the Atlantic Forest biome, mainly in the inland region of the country where the vegetation is highly fragmented and degraded by the historical occupation of the population (Dean, 1996; Myers et al., 2000) with high development of agriculture (Tabarelli et al., 2010). This is the region with the greatest coverage of different ecoregions of the Atlantic Forest, particularly SEMI, PARK, ECOT and BUSH. Above 2, in the semiarid climate, changes in land cover intensify the low natural water availability until water limitation becomes so dominant that the change in vegetation cover does not result in major effects (Montenegro and Ragab, 2010). STEP and DECI ecoregions are partially contained in this region.
Practical implications
The results indicate that the change from pasture to natural vegetation would have the potential to positively change responsiveness, improving the retention and regulation capacity of most Atlantic Forest ecoregions (Chazdon and Guariguata, 2016; Teixeira et al., 2021). In this context, forest restoration actions in degraded areas should consider soil quality, to enable the establishment of plant species and success of the restoration (Chazdon and Guariguata, 2016; Mendes et al., 2019), allowing the hydrological response of the restored areas, in a more advanced stage of ecological succession, to be positive compared to pasture, as shown in our results. However, the conversion of pasture to natural vegetation also negatively affects water yield, something that is widely reported in the literature (Farley et al., 2005; Brown et al., 2013; Brogna et al., 2017; Filoso et al., 2017). Thus, it is necessary to understand and evaluate the benefit/cost ratio of the conversion to natural vegetation, especially in places with low natural water availability (Feng et al., 2012), high seasonality (Farley et al., 2005) or large concentration of population that depends directly on the water yield of catchments (Ellison et al., 2012; Liu et al., 2022).
Figure 6 shows variations in the mean values of PET/P and the parameter “m” calculated for the studied ecoregions, regardless of the land cover present. Regions with PET/P < 1 have higher water availability and lower sensitivity to change in vegetation cover (Li et al., 2017). This groups includes the BUSH, MIXE and EVER ecoregions, where the restoration of native vegetation should only bring hydrological benefits of regulation, without affecting water availability (Calder, 2007; Aguilos et al., 2021).
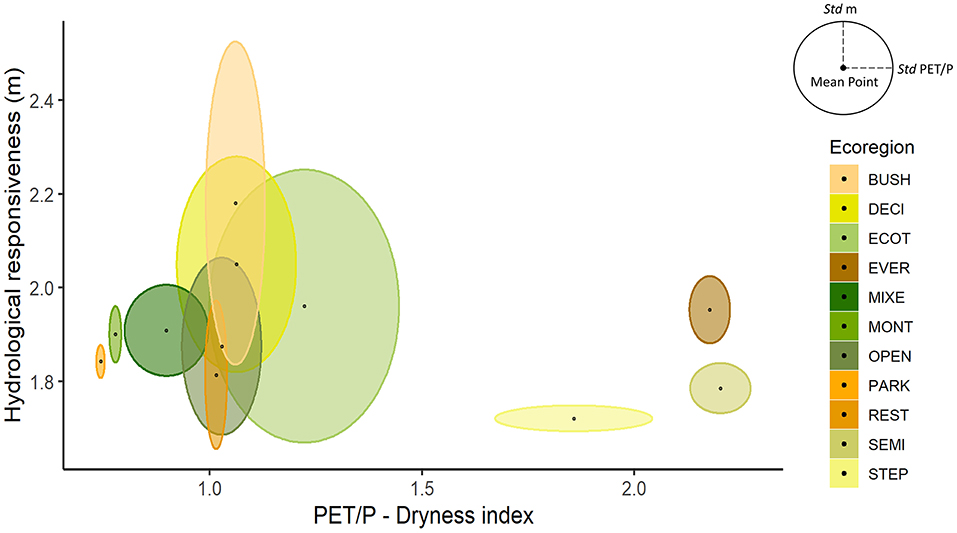
Figure 6. Variation in the mean values of hydrological responsiveness (m) and dryness index (PET/P) in each of the Atlantic Forest ecoregions, Brazil. Ellipses are formed by the standard deviation of the mean. REST, Arboreal restinga and mangrove; BUSH, Bushy grassland; DECI, Deciduous broadleaved forest; ECOT, Ecotone; EVER, Evergreen broadleaved forest; MIXE, Mixed needle-broadleaved forest; MONT, Montane and upper montane forest; OPEN, Open ombrophilous forest; PARK, Parkland savanna; SEMI, Semideciduous broadleaved forest; STEP, Steppe savanna.
With PET/P values around 1, some ecoregions have variable availability, possibly determined by local conditions (de Assis et al., 2011), but have high sensitivity to the change in vegetation cover. This group includes ECOT, PARK, OPEN, and REST, where the vegetation most strongly alters the hydrological response (Nunes da Cunha et al., 2006). In this case, especially forest vegetation can be used as a regulatory element in places with higher water availability (Valente et al., 2021).
The SEMI ecoregion has high variability of water availability due to its spatial coverage and local conditions, but also high sensitivity to change in land use. In this ecoregion, agricultural activities and a significant portion of the population are concentrated, as in the inland part of the São Paulo state. Thus, large-scale restoration actions may reduce the flow of streams (Filoso et al., 2017), especially in regions with prolonged drought season, which may affect water availability (Jackson et al., 2005). The region is subject to a negative tradeoff that represents a faster increase in evapotranspiration due to increased leaf cover and a gradual improvement in soil water infiltration conditions (Ferraz et al., 2020). In these regions, the recommendation is to identify critical regions in relation to water availability considering climatic conditions (Ponce et al., 2000) and local conditions (of Assis et al., 2011) and, in these areas, give focus more on the restoration of riparian strips aiming at water quality (Souza et al., 2013; Piffer et al., 2021) and adoption of techniques that allow better evolution of soil structure and lower evapotranspiration rates such as agroforestry systems (Murta et al., 2021).
It is possible to observe ecoregions with low water availability and low sensitivity to change in land cover. These regions have shrubby vegetation (STEP), with shorter stature in regions of altitude (MONT) or adapted to drought conditions (DECI). In these regions, the role of native vegetation is very important to maintain low levels of evapotranspiration and good soil conditions (Murphy and Lugo, 1986; Cotler and Ortega-Larrocea, 2006), ensuring replenishment of water table in a region with low natural water availability. It is not recommended to use forest species in these ecoregions, at the risk of worsening the low water availability (Xiao et al., 2020).
Conclusions
The diversity of the Atlantic Forest is also expressed in the responsiveness to rainfall, since the ecoregions have different response characteristics. The alteration of natural vegetation cover, especially of forests in the region, affects hydrological responsiveness, presenting itself as a powerful instrument for changing water availability and regulation. The results show the need for ecological restoration to respect the natural vegetation of each region (Xiao et al., 2020). Understanding the natural water availability of the region and how changes in the removal of natural vegetation or restoration can affect the water yield of the watersheds is fundamental for the planning of conservation and ecological restoration actions.
Data availability statement
The original contributions presented in the study are included in the article/Supplementary material, further inquiries can be directed to the corresponding author.
Author contributions
BL and SF designed the study. BL, KC, MO, RP, and RM conducted the data analyses. BL analyzed most of the data and wrote most of the manuscript together with KC, MO, RP, CC, BS, RM, PO, and SF. All authors contributed to the article and approved the submitted version.
Funding
We are grateful to the São Paulo Research Foundation (FAPESP) for the master fellowships to BL (2021/09086-1), to MO (2018/10751-7), and for the Research Project grants led by SF (2016/02877-5 e 2019/25466-9).
Conflict of interest
The authors declare that the research was conducted in the absence of any commercial or financial relationships that could be construed as a potential conflict of interest.
Publisher's note
All claims expressed in this article are solely those of the authors and do not necessarily represent those of their affiliated organizations, or those of the publisher, the editors and the reviewers. Any product that may be evaluated in this article, or claim that may be made by its manufacturer, is not guaranteed or endorsed by the publisher.
Supplementary material
The Supplementary Material for this article can be found online at: https://www.frontiersin.org/articles/10.3389/frwa.2022.998349/full#supplementary-material
References
Aguilos, M., Sun, G., Noormets, A., Domec, J.-C., McNulty, S., Gavazzi, M., et al. (2021). Effects of land-use change and drought on decadal evapotranspiration and water balance of natural and managed forested wetlands along the southeastern US lower coastal plain. Agric. Forest Meteorol. 303, 108381. doi: 10.1016/j.agrformet.2021.108381
Alvares, C. A., Stape, J. L., Sentelhas, P. C., De Moraes Gonçalves, J. L., and Sparovek, G. (2013). Köppen's climate classification map for Brazil. Meteorol. Zeitschrift 22, 711–728. doi: 10.1127/0941-2948/2013/0507
Azevedo, F. C. C., Bastille-Rousseau, G., and Murray, D. L. (2021). Habitat selection of jaguars in a seasonally flooded landscape. Mamm. Biol. 101, 817–830. doi: 10.1007/s42991-021-00185-4
Beguería, S., López-Moreno, J. I., Lorente, A., Seeger, M., and García-Ruiz, J. M. (2003). Assessing the effect of climate oscillations and land-use changes on streamflow in the Central Spanish Pyrenees. Ambio 32, 283–286. doi: 10.1579/0044-7447-32.4.283
Brancalion, P. H. S., Niamir, A., Broadbent, E., Crouzeilles, R., Barros, F. S. M., Zambrano, A. M. A., et al. (2019). Global restoration opportunities in tropical rainforest landscapes. Sci. Adv. 5, 1–12. doi: 10.1126/sciadv.aav3223
Brogna, D., Vincke, C., Brostaux, Y., Soyeurt, H., Dufrêne, M., and Dendoncker, N. (2017). How does forest cover impact water flows and ecosystem services? Insights from “real-life” catchments in Wallonia (Belgium). Ecol. Indic. 72, 675–685. doi: 10.1016/j.ecolind.2016.08.011
Brown, A. E., Western, A. W., McMahon, T. A., and Zhang, L. (2013). Impact of forest cover changes on annual streamflow and flow duration curves. J. Hydrol. 483, 39–50. doi: 10.1016/j.jhydrol.2012.12.031
Brown, A. E., Zhang, L., McMahon, T. A., Western, A. W., and Vertessy, R. A. (2005). A review of paired catchment studies for determining changes in water yield resulting from alterations in vegetation. J. Hydrol. 310, 28–61. doi: 10.1016/j.jhydrol.2004.12.010
Budyko, M. I. (1958). The Heat Balance of the Earth's Surface. Washington, D.C.: U.S. Dept. of Commerce, Weather Bureau.
Cabral, D. D. C., and Cesco, S. (2008). Notes for a history of timber exploitation in the south-southeastern Brazilian Atlantic forest. Ambiente Sociedade. 11, 33–48. doi: 10.1590/S1414-753X2008000100004
Calder, I. R. (1998). Water use by forests, limits and controls. Tree Physiol. 18, 625–631. doi: 10.1093/treephys/18.8-9.625
Calder, I. R. (2007). Forests and water-ensuring forest benefits outweigh water costs. For. Ecol. Manage. 251, 110–120. doi: 10.1016/j.foreco.2007.06.015
Chazdon, R. L., and Guariguata, M. R. (2016). Natural regeneration as a tool for large-scale forest restoration in the tropics: prospects and challenges. Biotropica 48, 716–730. doi: 10.1111/btp.12381
Choudhury, B. J. (1999). Evaluation of an empirical equation for annual evaporation using field observations and results from a biophysical model. J. Hydrol. 216, 99–110. doi: 10.1016/S0022-1694(98)00293-5
Costa, J. C., Pereira, G., Siqueira, M. E., Cardozo, F. S., and Da Silva, V. V. (2019). Validação dos dados de precipitação estimados pelo CHIRPS para o Brasil. Rev. Bras. Climatol. 24, 228–243. doi: 10.5380/abclima.v24i0.60237
Cotler, H., and Ortega-Larrocea, M. P. (2006). Effects of land use on soil erosion in a tropical dry forest ecosystem, Chamela watershed, Mexico. CATENA 65, 107–117. doi: 10.1016/j.catena.2005.11.004
Creed, I. F., Spargo, A. T., Jones, J. A., Buttle, J. M., Adams, M. B., Beall, F. D., et al. (2014). Changing forest water yields in response to climate warming: results from long-term experimental watershed sites across North America. Glob. Chang. Biol. 20, 3191–3208. doi: 10.1111/gcb.12615
de Assis, A. C. C., Coelho, R. M., Pinheiro, E. S., and Durigan, G. (2011). Water availability determines physiognomic gradient in an area of low-fertility soils under Cerrado vegetation. Plant Ecol. 212, 1135–1147. doi: 10.1007/s11258-010-9893-8
Dean, W. (1996). A ferro e fogo: a história e a devastação da Mata Atlântica Brasileira. Santiago: Companhia das Letras.
Degano, M. F., Rivas, R. E., Carmona, F., Niclòs, R., and Sánchez, J. M. (2021). Evaluation of the MOD16A2 evapotranspiration product in an agricultural area of Argentina, the Pampas region. Egypt. J. Remote Sens. Sp. Sci. 24, 319–328. doi: 10.1016/j.ejrs.2020.08.004
Du, C., Sun, F., Yu, J., Liu, X., and Chen, Y. (2016). New interpretation of the role of water balance in an extended Budyko hypothesis in arid regions. Hydrol. Earth Syst. Sci. 20, 393–409. doi: 10.5194/hess-20-393-2016
Ellison, D., Futter, M. N., and Bishop, K. (2012). On the forest cover–water yield debate: from demand- to supply-side thinking. Glob. Chang. Biol. 18, 806–820. doi: 10.1111/j.1365-2486.2011.02589.x
Ellison, D., Morris, C. E., Locatelli, B., Sheil, D., Cohen, J., Murdiyarso, D., et al. (2017). Trees, forests and water: cool insights for a hot world. Glob. Environ. Chang. 43, 51–61. doi: 10.1016/j.gloenvcha.2017.01.002
Farley, K. A., Jobbágy, E. G., and Jackson, R. B. (2005). Effects of afforestation on water yield: a global synthesis with implications for policy. Glob. Chang. Biol. 11, 1565–1576. doi: 10.1111/j.1365-2486.2005.01011.x
Farr, T. G., Rose, P. A., Caro, E., Crippen, R., Duren, R., Hensley, S., et al. (2007). The shuttle radar topography mission. Rev. Geophys. 45, RG2004. doi: 10.1029/2005RG000183
Feng, X. M., Sun, G., Fu, B. J., Su, C. H., Liu, Y., and Lamparski, H. (2012). Regional effects of vegetation restoration on water yield across the Loess Plateau, China. Hydrol. Earth Syst. Sci. 16, 2617–2628. doi: 10.5194/hess-16-2617-2012
Ferraz, S., Brancalion, P. H. S., Guillemot, J., and Meli, P. (2020). On the need to differentiate the temporal trajectories of ecosystem structure and functions in restoration programs. Trop. Conserv. Sci. 13, 1940082920910314. doi: 10.1177/1940082920910314
Filoso, S., Bezerra, M. O., Weiss, K. C. B., and Palmer, M. A. (2017). Impacts of forest restoration on water yield: a systematic review. PLoS ONE 12, e0183210. doi: 10.1371/journal.pone.0183210
Fonseca, G. A. B. (1985). The vanishing Brazilian Atlantic forest. Biol. Conserv. 34, 17–34. doi: 10.1016/0006-3207(85)90055-2
Fu, B. P. (1981). On the calculation of the evaporation from land surface. Sci. Atmos. Sin. 5, 23–31.
Funk, C., Peterson, P., Landsfeld, M., Pedreros, D., Verdin, J., Shukla, S., et al. (2015). The climate hazards infrared precipitation with stations—a new environmental record for monitoring extremes. Sci. Data 2, 150066. doi: 10.1038/sdata.2015.66
Galindo-Leal, C., and Câmara, I. G. (2003). “Atlantic Forest hotspot status: an overview,” in The Atlantic Forest of South America: Biodiversity Status, Threats and Outlook, eds C. Galindo-Leal and I. G. Câmara (Washington: CABS and Island Press), 3–11.
Gorelick, N., Hancher, M., Dixon, M., Ilyushchenko, S., Thau, D., and Moore, R. (2017). Google earth engine: planetary-scale geospatial analysis for everyone. Remote Sens. Environ. 202, 18–27. doi: 10.1016/j.rse.2017.06.031
Hall, J., Scholl, M., Gorokhovich, Y., and Uriarte, M. (2022). Forest cover lessens the impact of drought on streamflow in Puerto Rico. Hydrol. Process. 36, 1–16. doi: 10.1002/hyp.14551
Hewlett, J. D., and Nutter, W. L. (1969). An Outline of Forest Hydrology. Athens: University of Georgia Press, Athens.
Hofmann, G. S., Cardoso, M. F., Alves, R. J. V., Weber, E. J., Barbosa, A. A., Toledo, P. M., et al. (2021). The Brazilian Cerrado is becoming hotter and drier. Glob. Chang. Biol. 27, 4060–4073. doi: 10.1111/gcb.15712
Huxman, T. E., Wilcox, B. P., Breshears, D. D., Scott, R. L., Snyder, K. A., Small, E. E., et al. (2005). Ecohydrological implications of woody plant encroachment. Ecology 86, 308–319. doi: 10.1890/03-0583
IBGE (2019). Biomas e sistema costeiro-marinho do Brasil: compatí vel com a escala 1:250 000. Rio de Janeiro: Instituto Brasileiro de Geografia e Estatística.
Jackson, R. B., Jobbágy, E. G., Avissar, R., Roy, S. B., Barrett, D. J., Cook, C. W., et al. (2005). Trading water for carbon with biological carbon sequestration. Science 310, 1944–1947. doi: 10.1126/science.1119282
Kuczera, G. (1987). Prediction of water yield reductions following a bushfire in ash-mixed species eucalypt forest. J. Hydrol. 94, 215–236. doi: 10.1016/0022-1694(87)90054-0
Latawiec, A. E., Strassburg, B. B. N., Brancalion, P. H. S., Rodrigues, R. R., and Gardner, T. (2015). Creating space for large-scale restoration in tropical agricultural landscapes. Front. Ecol. Environ. 13, 211–218. doi: 10.1890/140052
Li, D., Pan, M., Cong, Z., Zhang, L., and Wood, E. (2013). Vegetation control on water and energy balance within the Budyko framework. Water Resour. Res. 49, 969–976. doi: 10.1002/wrcr.20107
Li, Q., Wei, X., Zhang, M., Liu, W., Fan, H., Zhou, G., et al. (2017). Forest cover change and water yield in large forested watersheds: A global synthetic assessment. Ecohydrology 10, 1–7. doi: 10.1002/eco.1838
Liang, J., Wei, Z., Lee, X., Wright, J. S., Cui, X., Chen, H., et al. (2019). Evapotranspiration characteristics distinct to mangrove ecosystems are revealed by multiple-site observations and a modified two-source model. Water Resour. Res. 55, 11250–11273. doi: 10.1029/2019WR024729
Liang, W., Bai, D., Wang, F., Fu, B., Yan, J., Wang, S., et al. (2015). Quantifying the impacts of climate change and ecological restoration on streamflow changes based on a Budyko hydrological model in China's Loess Plateau. Water Resour. Res. 51, 6500–6519. doi: 10.1002/2014WR016589
Liu, J., Zhang, Q., Singh, V. P., Song, C., Zhang, Y., Sun, P., et al. (2018). Hydrological effects of climate variability and vegetation dynamics on annual fluvial water balance in global large river basins. Hydrol. Earth Syst. Sci. 22, 4047–4060. doi: 10.5194/hess-22-4047-2018
Liu, N., Dobbs, G. R., Caldwell, P. V., Miniat, C. F., Sun, G., Duan, K., et al. (2022). Inter-basin transfers extend the benefits of water from forests to population centers across the conterminous U.S. Water Resour. Res. 58, 1–19. doi: 10.1029/2021WR031537
Mendes, M. S., Latawiec, A. E., Sansevero, J. B. B., Crouzeilles, R., Moraes, L. F. D., Castro, A., et al. (2019). Look down - there is a gap - the need to include soil data in Atlantic Forest restoration. Restor. Ecol. 27, 361–370. doi: 10.1111/rec.12875
Montenegro, A., and Ragab, R. (2010). Hydrological response of a Brazilian semi-arid catchment to different land use and climate change scenarios: a modelling study. Hydrol. Process. 24, 2705–2723. doi: 10.1002/hyp.7825
Murphy, P. G., and Lugo, A. E. (1986). Ecology of tropical dry forest. Annu. Rev. Ecol. Syst. 17, 67–88. doi: 10.1146/annurev.es.17.110186.000435
Murta, J. R., de, M., Brito, G.Q., de, Mendonça Filho, S. F., Hoffmann, M. R., and Salemi, L. F. (2021). Understanding the effect of an agroforestry system with high litter input on topsoil permeability. Soil Use Manag. 37, 802–809. doi: 10.1111/sum.12647
Myers, N., Mittermeier, R. A., Mittermeier, C. G., da Fonseca, G. A. B., and Kent, J. (2000). Biodiversity hotspots for conservation priorities. Nature 403, 853–858. doi: 10.1038/35002501
NASA JPL (2020). Data from: NASADEM Merged DEM Global 1 arc second V001. NASA EOSDIS Land Processes DAAC.
Ning, T., Zhou, S., Chang, F., Shen, H., Li, Z., and Liu, W. (2019). Interaction of vegetation, climate and topography on evapotranspiration modelling at different time scales within the Budyko framework. Agric. For. Meteorol. 275, 59–68. doi: 10.1016/j.agrformet.2019.05.001
Nunes da Cunha, C., Rawiel, P., Wantzen, K. M., Junk, W. J., and do Prado, A. L. (2006). Mapping and characterization of vegetation units by means of Landsat imagery and management recommendations for the Pantanal of Mato Grosso (Brazil), North of Poconé. Amazoniana 19, 1–32.
Ogasawara, M. E. K. (2020). Modelagem de efeitos das mudanças climáticas sobre o deflúvio e a qualidade de água em bacias hidrográficas do Estado de São Paulo. Piracicaba: Universidade de São Paulo.
Oudin, L., Andréassian, V., Lerat, J., and Michel, C. (2008). Has land cover a significant impact on mean annual streamflow? An international assessment using 1508 catchments. J. Hydrol. 357, 303–316. doi: 10.1016/j.jhydrol.2008.05.021
Piffer, P. R., Tambosi, L. R., Ferraz, S. F., de, B., Metzger, J. P., and Uriarte, M. (2021). Native forest cover safeguards stream water quality under a changing climate. Ecol. Appl. 31, e02414. doi: 10.1002/eap.2414
Plaza, J., Plaza, A., Valencia, D., and Paz, A. (2009). Massively parallel processing of remotely sensed hyperspectral images. Satell. Data Compression, Commun. Process. 7455, 74550O-74550O−11. doi: 10.1117/12.825455
Ponce, V. M., Pandey, R. P., and Ercan, S. (2000). Characterization of drought across climatic spectrum. J. Hydrol. Eng. 5, 222–224. doi: 10.1061/(ASCE)1084-0699(2000)5:2(222)
Ramoelo, A., Majozi, N., Mathieu, R., Jovanovic, N., Nickless, A., and Dzikiti, S. (2014). Validation of global evapotranspiration product (MOD16) using flux tower data in the African Savanna, South Africa. Remote Sens. 6, 7406–7423. doi: 10.3390/rs6087406
Ranjan, S. P., Kazama, S., and Sawamoto, M. (2006). Effects of climate and land use changes on groundwater resources in coastal aquifers. J. Environ. Manage. 80, 25–35. doi: 10.1016/j.jenvman.2005.08.008
Reichert, J. M., Rodrigues, M. F., Peláez, J. J. Z., Lanza, R., Minella, J. P. G., Arnold, J. G., et al. (2017). Water balance in paired watersheds with eucalyptus and degraded grassland in Pampa biome. Agric. For. Meteorol. 237–238, 282–295. doi: 10.1016/j.agrformet.2017.02.014
Ribeiro, M. C., Metzger, J. P., Martensen, A. C., Ponzoni, F. J., and Hirota, M. M. (2009). The Brazilian Atlantic Forest: How much is left, and how is the remaining forest distributed? Implications for conservation. Biol. Conserv. 142, 1141–1153. doi: 10.1016/j.biocon.2009.02.021
Running, S., Mu, Q., and Zhao, M. (2017). Data from: MOD16A2 v006 MODIS/Terra Net Evapotranspiration 8-Day L4 Global 500 m SIN Grid, distributed by NASA EOSDIS Land Processes DAAC.
Salemi, L. F., Groppo, J. D., Trevisan, R., de Moraes, J. M., Ferraz, S. F., de, B., et al. (2013). Land-use change in the Atlantic rainforest region: Consequences for the hydrology of small catchments. J. Hydrol. 499, 100–109. doi: 10.1016/j.jhydrol.2013.06.049
Santos, S. R. Q., Cunha, A. P. M., do, A., and Ribeiro-Neto, G.G. (2019). Avaliação de dados de precipitação para o monitoramento do padrão espaço-temporal da seca no Nordeste do Brasil. Rev. Bras. Climatol. 25, 80–100. doi: 10.5380/abclima.v25i0.62018
Shao, Q., Traylen, A., and Zhang, L. (2012). Nonparametric method for estimating the effects of climatic and catchment characteristics on mean annual evapotranspiration. Water Resour. Res. 48, 1–13. doi: 10.1029/2010WR009610
Sokal, R. R., and Rohlf, F. J. (2012). Biometry: The Principles and Practice of Statistics in Biological Research, 4th ed. New York: W.H. Freeman and Company.
Souza, A. L. T., de Fonseca, D. G., Libório, R. A., and Tanaka, M. O. (2013). Influence of riparian vegetation and forest structure on the water quality of rural low-order streams in SE Brazil. For. Ecol. Manage. 298, 12–18. doi: 10.1016/j.foreco.2013.02.022
Souza, C. M., Shimbo, J. Z., Rosa, M. R., Parente, L. L., Alencar, A. A., Rudorff, B. F. T., et al. (2020). Reconstructing three decades of land use and land cover changes in brazilian biomes with Landsat archive and Earth Engine. Remote Sens. 12, 2735. doi: 10.3390/rs12172735
Sprent, P., and Smeeton, N. C. (2007). Applied Nonparametric Statistical Methods, 4th ed. London: Taylor & Francis Group.
Tabarelli, M., Aguiar, A. V., Ribeiro, M. C., Metzger, J. P., and Peres, C. A. (2010). Prospects for biodiversity conservation in the Atlantic Forest: lessons from aging human-modified landscapes. Biol. Conserv. 143, 2328–2340. doi: 10.1016/j.biocon.2010.02.005
Tang, R., Shao, K., Li, Z.-L., Wu, H., Tang, B.-H., Zhou, G., et al. (2015). Multiscale validation of the 8-day MOD16 evapotranspiration product using flux data collected in China. IEEE J. Sel. Top. Appl. Earth Obs. Remote Sens. 8, 1478–1486. doi: 10.1109/JSTARS.2015.2420105
Teixeira, G. M., Figueiredo, P. H. A., Salemi, L. F., Ferraz, S. F. B., Ranzini, M., Arcova, F. C. S., et al. (2021). Regeneration of tropical montane cloud forests increases water yield in the Brazilian Atlantic Forest. Ecohydrology 14, e2298. doi: 10.1002/eco.2298
Tobella, A. B., Reese, H., Almaw, A., Bayala, J., Malmer, A., Laudon, H., et al. (2014). The effect of trees on preferential flow and soil infiltrability in an agroforestry parkland in semiarid Burkina Faso. Water Resour. Res. 50, 3342–3354. doi: 10.1002/2013WR015197
United Nations. (2019). Resolution 73/284 United Nations Decade on Ecosystem Restoration (2021–2030). New York, NY: United Nations General Assembly.
Valente, M. L., Reichert, J. M., Cavalcante, R. B. L., Minella, J. P. G., Evrard, O., and Srinivasan, R. (2021). Afforestation of degraded grasslands reduces sediment transport and may contribute to streamflow regulation in small catchments in the short-run. CATENA 204, 105371. doi: 10.1016/j.catena.2021.105371
Wei, X., Li, Q., Zhang, M., Giles-Hansen, K., Liu, W., Fan, H., et al. (2018). Vegetation cover - another dominant factor in determining global water resources in forested regions. Glob. Chang. Biol. 24, 786–795. doi: 10.1111/gcb.13983
Xiao, Y., Xiao, Q., and Sun, X. (2020). Ecological risks arising from the impact of large-scale afforestation on the regional water supply balance in southwest China. Sci. Rep. 10, 4150. doi: 10.1038/s41598-020-61108-w
Xing, W., Wang, W., Zou, S., and Deng, C. (2018). Projection of future runoff change using climate elasticity method derived from Budyko framework in major basins across China. Glob. Planet. Change 162, 120–135. doi: 10.1016/j.gloplacha.2018.01.006
Zhang, L., Dawes, W. R., and Walker, G. R. (2001). Response of mean annual evapotranspiration to vegetation changes at catchment scale. Water Resour. Res. 37, 701–708. doi: 10.1029/2000WR900325
Zhang, M., Liu, N., Harper, R., Li, Q., Liu, K., Wei, X., et al. (2017). A global review on hydrological responses to forest change across multiple spatial scales: Importance of scale, climate, forest type and hydrological regime. J. Hydrol., 546, 44–59. doi: 10.1016/j.jhydrol.2016.12.040
Zhang, M., and Wei, X. (2012). The effects of cumulative forest disturbance on streamflow in a large watershed in the central interior of British Columbia, Canada. Hydrol. Earth Syst. Sci. 16, 2021–2034. doi: 10.5194/hess-16-2021-2012
Zhang, S., Yang, H., Yang, D., and Jayawardena, A. W. (2016). Quantifying the effect of vegetation change on the regional water balance within the Budyko framework. Geophys. Res. Lett. 43, 1140–1148. doi: 10.1002/2015GL066952
Keywords: native vegetation, forest restoration, hydrological modeling, water yield, dryness index
Citation: Lopes BS, Corrêa KAB, Ogasawara MEK, Precinoto RS, Cassiano CC, Sell BM, Melo RS, dos Reis Oliveira PC and Ferraz SFB (2022) How does land use cover change affect hydrological response in the Atlantic Forest? Implications for ecological restoration. Front. Water 4:998349. doi: 10.3389/frwa.2022.998349
Received: 19 July 2022; Accepted: 05 September 2022;
Published: 03 October 2022.
Edited by:
Timothy O. Randhir, University of Massachusetts Amherst, United StatesReviewed by:
Lisheng Song, Anhui Normal University, ChinaFadji Maina, National Aeronautics and Space Administration, United States
Copyright © 2022 Lopes, Corrêa, Ogasawara, Precinoto, Cassiano, Sell, Melo, dos Reis Oliveira and Ferraz. This is an open-access article distributed under the terms of the Creative Commons Attribution License (CC BY). The use, distribution or reproduction in other forums is permitted, provided the original author(s) and the copyright owner(s) are credited and that the original publication in this journal is cited, in accordance with accepted academic practice. No use, distribution or reproduction is permitted which does not comply with these terms.
*Correspondence: Bruna Santos Lopes, bruna.santos.lopes@usp.br