 Ri-Cong Xu1,2†Jian-Ying Guo1,2†Tao Cao1,2Yi Xu1,2Ying Liao1,2Yu-Na Chen1,2Hai-Ying Song1,2Xiao-Jie Chen1,2Mi-Jie Guan1,2Fei Tang1,2Qiong Xiang1,2Xing-Lin Chen3
 Qi-Jun Wan1,2*
- 1Department of Nephrology, The First Affiliated Hospital of Shenzhen University, Shenzhen, China
- 2Department of Nephrology, The Second People's Hospital of Shenzhen, Shenzhen, China
- 3Department of Epidemiology and Biostatistics, Empower U, X&Y solutions Inc., Boston, MA, United States
Introduction: This study aimed to investigate the relationship between Oxford Classification scores and longitudinal changes in proteinuria in patients with immunoglobulin A nephropathy (IgAN).
Methods: The study was a single-center retrospective cohort study involving 358 patients with primary IgAN who were treated at the Shenzhen Second People’s Hospital, China, between January 2011 and May 2021. Multivariate linear regression and generalized additive mixed models (GAMMs), adjusted for traditional risk confounders, were used to evaluate the correlation between scores for mesangial hypercellularity (M), endocapillary hypercellularity (E), segmental glomerulosclerosis (S), tubular atrophy/interstitial fibrosis (T), and crescents (C) (known as the Oxford Classification MEST-C score system), with proteinuria/creatinine ratio (PCR) at the time of renal biopsy and longitudinal changes in PCR, respectively.
Results: The median PCR was 1061 mg/g, and it increased on average by 68.82 mg/g per year in these patients. Among patients with renal insufficiency, compared with patients without relative lesions, those with E present (E1) (1153.44; 95% confidence interval [CI], 188.99–2117.89 mg/g) and C > 0 (C1/2) (1063.58; 95% CI, 185.25–1941.90 mg/g) were associated with increased PCR levels at the time of renal biopsy. What’s more, S present (S1) (194.96; 95% CI, 54.50–335.43 mg/g per year) was associated with the fastest PCR increase; C > 0 (C1/2) (147.59; 95% CI, 8.32–286.86 mg/g per year) and T >25% (T1/2) (77.04; 95% CI, 7.18–146.89 mg/g per year), were also correlated with a faster PCR increase. In patients with normal kidney function, associations between S1 (55.46; 95% CI, 8.93–101.99 mg/g per year) and E1 (94.02; 95% CI, 21.47–166.58 mg/g per year) and PCR change could be observed. Additionally, in patients with overweight/obesity, S1 (156.09; 95% CI, 52.41–259.77 mg/g per year), E1 (143.34; 95% CI, 35.30–251.38 mg/g per year), T1/2 (116.04; 95% CI, 22.58–209.51 mg/g per year), as well as C1/2 (134.03; 95% CI, 41.73–226.32 mg/g per year) were associated with noticeably quicker PCR increase.
Conclusions: Overall, E1 and C1/2 were independently associated with raised proteinuria levels at the time of renal biopsy, and S1, E1, T1/2, C1/2 were independently associated with a longitudinal increase in proteinuria in the patients with IgAN, especially in those with renal insufficiency or overweight/obesity, suggesting that currently available treatments might not be satisfactory, and weight control might be beneficial. Individual therapy development might benefit from the use of the Oxford Classification system.
Introduction
Immunoglobulin A nephropathy (IgAN) is the most common form of primary glomerulonephritis and the leading cause of end-stage renal disease in China (1). Variable clinical manifestations, from isolated microscopic hematuria to severe renal function decline, can be seen in patients with IgAN, and there is worldwide consensus regarding the use of the Oxford Classification system to evaluate the severity of renal damage. This system uses the following markers: mesangial hypercellularity (M), endocapillary hypercellularity (E), segmental glomerulosclerosis (S), and tubular atrophy and interstitial fibrosis (T), and the revised Oxford Classification, called the MEST-C score system, also includes the presence of crescents (C) (2). Of these five markers, T lesions have been consistently confirmed to predict renal disease progression, with more variable results for M, E, S, and C lesions (3–18). Repeated measurements of the estimated glomerular filtration rate (eGFR) have shown that after renal biopsy, patients with S present (S1), T >50% (T2), and C >25% glomeruli (C2) lesions have notably faster renal function decline (19).
Factors such as renal injury, massive proteinuria, hypertension, and a low GFR, which could increase the risk of entering end-stage renal disease (ESRD) by 10–15 times, have been found to be present in more than half of patients with IgAN (20–22). However, the only risk factor currently considered in the kidney disease: Improving Global Outcomes guidelines, with respect to targeting corticosteroid and/or immunosuppressive treatment in IgAN, is proteinuria at a persistent level of >0.75–1 g/day, with three months of optimized supportive care (23). At present, there is insufficient evidence to support the use of Oxford Pathological Classification MEST-C scores to determine whether immunosuppressive therapy would benefit patients with IgAN, as most published randomized controlled trials to date (24–27) have not considered renal pathology at enrollment.
Thus, in this study, linear regression and mixed methods are used to evaluate the association of each Oxford Classification score (MEST-C) with baseline and longitudinal changes in proteinuria respectively in patients with IgAN.
Results
A total of 358 patients were included in the study (Figure 1). The mean age was 34.94 ± 9.43 years, 49.16% of the patients were male, the mean BMI was 22.73 ± 3.40 kg/m2, 43.12% of them were overweight/obesity, and 71.23% of them with hematuria at the time of renal biopsy. With regard to the Oxford Classification system, in each score group, M >0.5 (M1), E present (E1), and S1 lesions accounted for 76.84%, 22.60%, and 33.15% of all lesions, respectively, and T >25% (T1/2) and C > 0 (C1/2) lesions accounted for 23.66% and 54.86% of all lesions, respectively. (Table 1) The characteristics of patients with different Oxford Classification scores were also shown (Supplementary Tables 1–5).
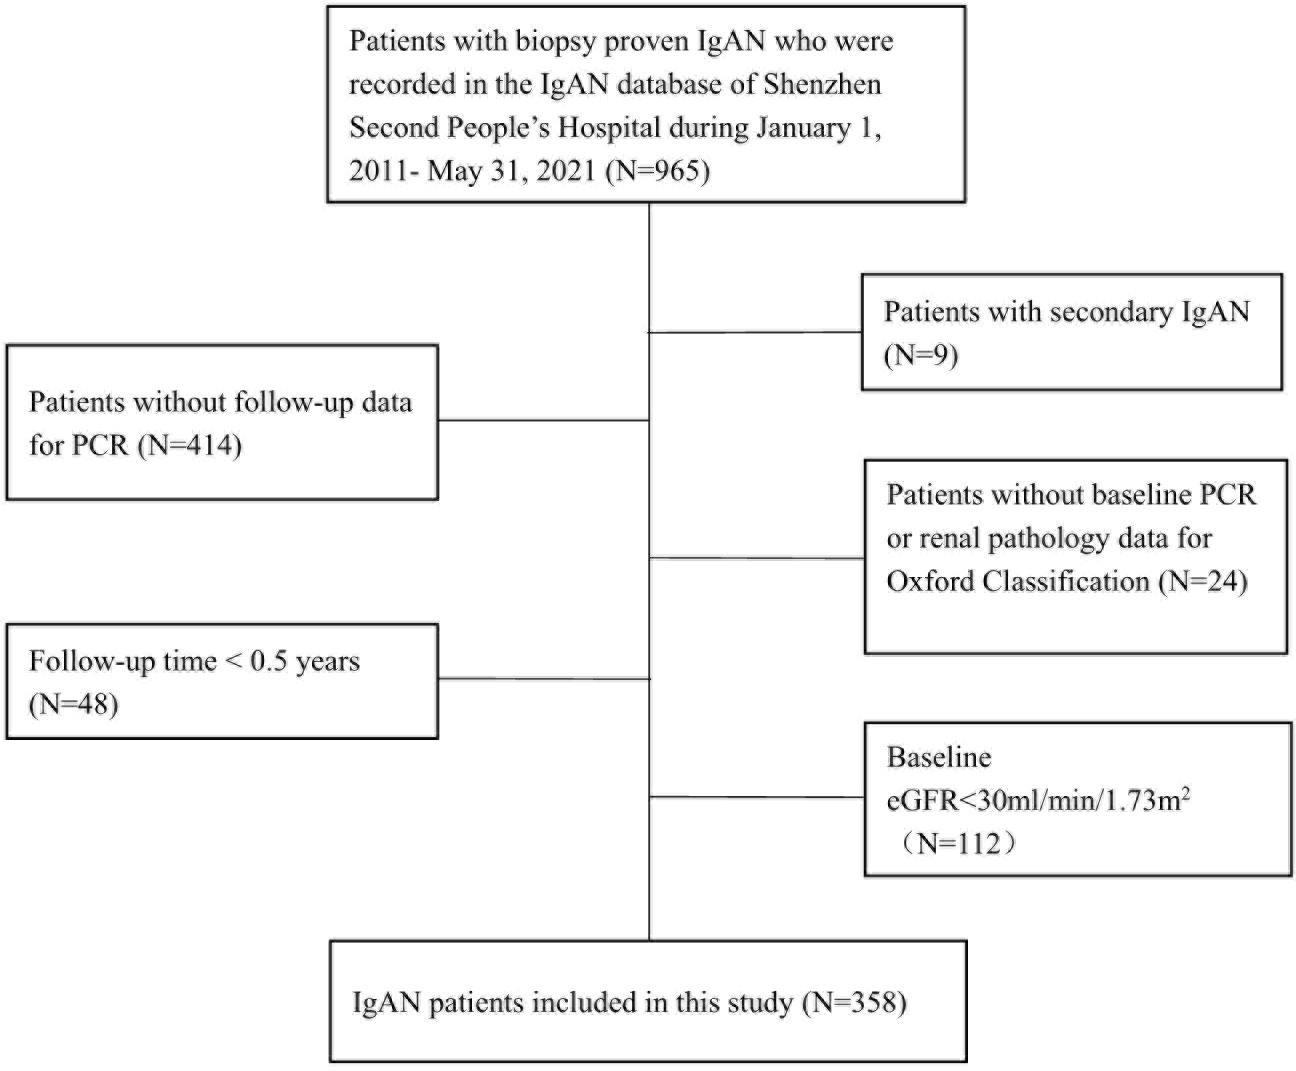
Figure 1 Flowchart of patients with immunoglobulin A nephropathy included in the study.
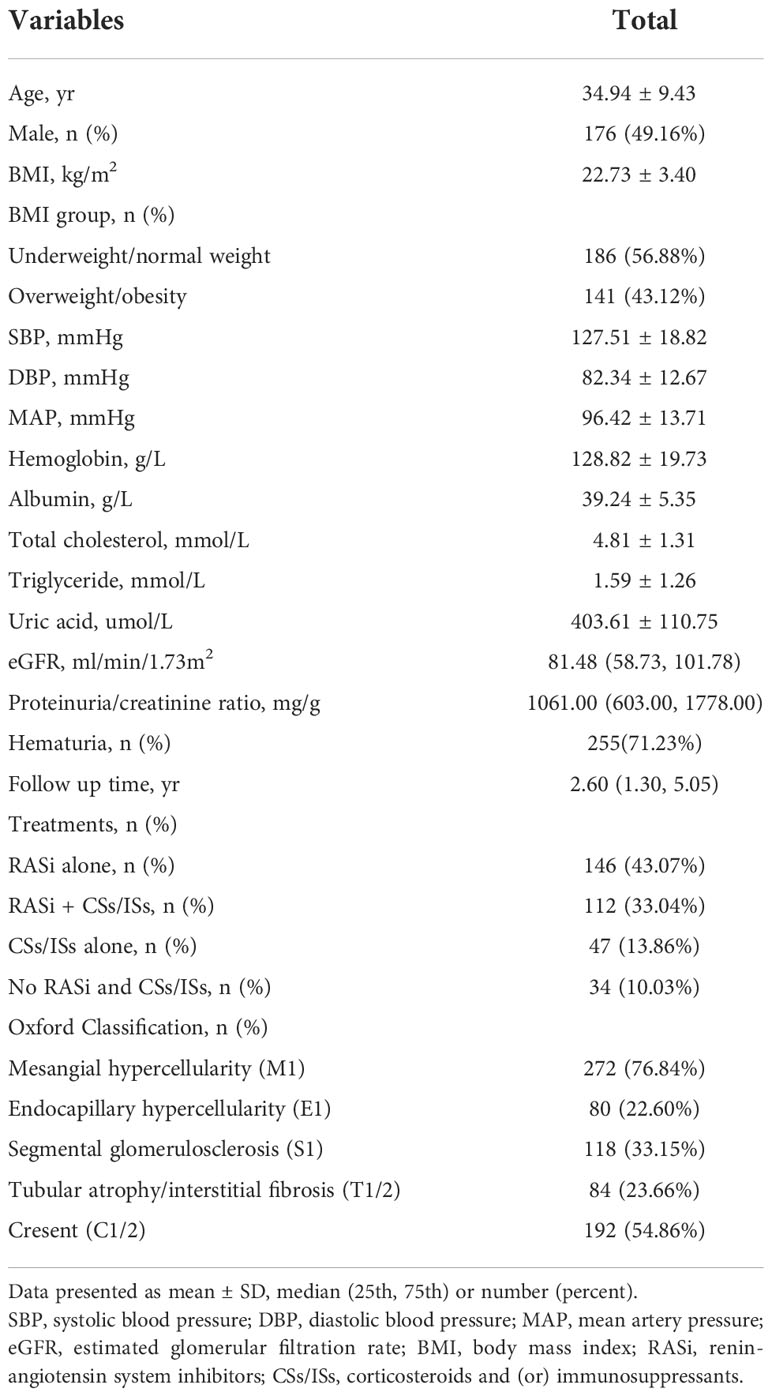
Table 1 Baseline characteristics and pathological features of IgAN patients.
The median eGFR was 81.48 ml/min/1.73 m2 (interquartile range [IQR], 58.73–101.78 ml/min/1.73 m2), the median proteinuria/creatinine ratio (PCR) was 1061 mg/g (IQR, 603–1778 mg/g). (Table 1) Using a two-piecewise linear regression model, after adjusting for age, gender, mean arterial pressure (MAP), body mass index (BMI) and the Oxford Classification MEST-C markers, we discovered that the relationship between eGFR and proteinuria was non-linear (Supplementary Figure 1), and an inflection point of 94.3ml/min/1.73m2 was found (Supplementary Table 6). On the left of the inflection point, eGFR was negatively associated with proteinuria [β -16.18, 95% CI (-32.22)-(-0.14), p=0.048]. On the right of the inflection point, the correlation between eGFR and proteinuria was not significant (p > 0.05).
After renal biopsy, 43.07% of the patients took renin-angiotensin system inhibitors (RASi) alone, 33.04% of them took RASi in combination with corticosteroids and (or) immunosuppressants (CSs/ISs), 13.86% of them took CSs/ISs alone, and 10.03% of patients took neither RASi or CSs/ISs. (Table 1) Treatments divided by different Oxford Classification scores were shown in Supplemental Tables 1–5 and Figure 2. Overall, patients with active lesions including E1 (E1, 64.93%; E0, 41.61%) and C1/2 (C1/2: 58.6%; C0, 32.03%) were more likely to be treated with CSs/ISs.
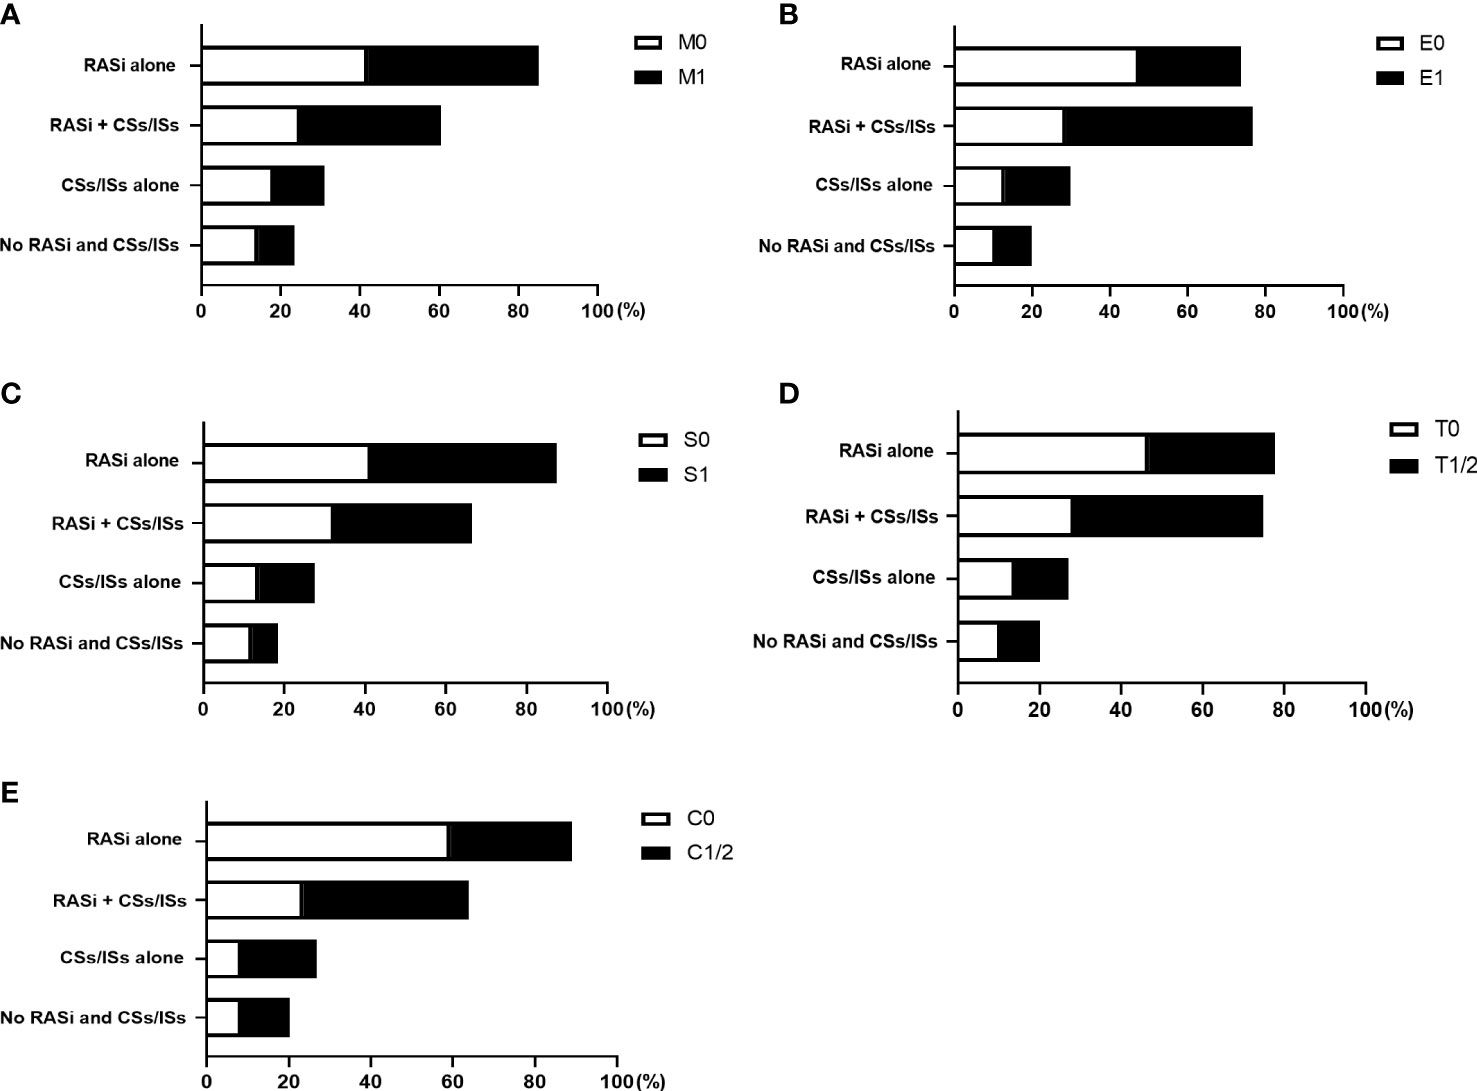
Figure 2 Treatments of patients with different Oxford Classification MEST-C scores. The proportion of patients took renin-angiotensin system inhibitors (RASi) alone, RASi in combination with corticosteroids and (or) immunosuppressants (CSs/ISs), CSs/ISs alone, as well as no RASi and CSs/ISs, in patients with and without M (A), E (B), S (C), T (D), C (E) lesions were shown.
At the time of renal biopsy, patients with E1, S1, T1/2, C1/2 lesions exhibited higher levels of proteinuria than patients without relative lesions (p<0.05, Supplementary Tables 1–5). In order to investigate the effect of different Oxford Classification scores on baseline proteinuria, multivariate linear regression was used. In patients with renal insufficiency (30≤eGFR<60 ml/min/1.73m2), after adjusting for covariates including age, gender, MAP, eGFR, BMI and MEST-C score, we found E1 (1153.44; 95% CI, 188.99–2117.89 mg/g; p = 0.022) and C1/2 (1063.58; 95% CI, 185.25–1941.90 mg/g; p = 0.020) lesions were independently associated with a rise of PCR at the time of renal biopsy. However, no associations were found between M1, S1, T1/2 and PCR in the adjusted models (p > 0.05). To clarify whether these relationships existed in patients with normal kidney function (eGFR ≥60 ml/min/1.73 m2), subgroup analysis was performed, but the associations were not significant (p > 0.05) (Table 2).
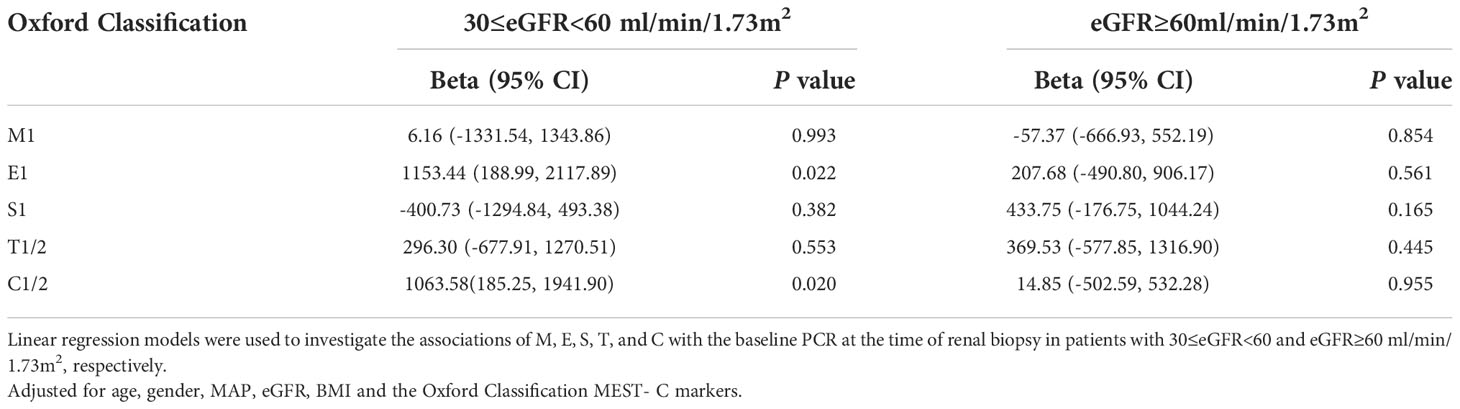
Table 2 Association of the Oxford Classification score MEST-C with baseline PCR at the time of renal biopsy according to 30≤eGFR<60 and eGFR ≥60 ml/min/1.73m2.
The median duration of follow-up starting from renal biopsy was 2.60 years (IQR, 1.30–5.05 years). A total of 1,479 PCR measurements, taken from the 358 patients, were available for further analysis. Generalized additive mixed models (GAMMs) were used to evaluate the associations of the MEST-C scores and longitudinal changes in PCR. After adjusting for covariates including age, gender, MAP, eGFR, BMI, MEST-C score, and treatments (RASi alone, RASi in combination with CSs/ISs, CSs/ISs alone, no RASi and CSs/ISs) in the models, it was found that for every additional year, the PCR increased by 68.82 mg/g (95% confidence interval [CI], 44.63–93.02 mg/g; p < 0.001) on average in the entire cohort (Figure 3). In patients with renal insufficiency, compared with those without relative lesions, S1 (194.96; 95% CI, 54.50–335.43 mg/g per year; p = 0.007) was associated with the fastest PCR increase. Additionally, C1/2 (147.59; 95% CI, 8.32–286.86 mg/g per year; p = 0.038), and T1/2 (77.04; 95% CI, 7.18–146.89 mg/g per year; p = 0.031) demonstrated a more rapid PCR rise. However, no associations were found between M1, E1 and elevated PCR in the adjusted models (p > 0.05). Among patients with normal kidney function, similar results were found in those with S1 (55.46; 95% CI, 8.93–101.99 mg/g per year; p = 0.020) and E1 (94.02; 95% CI, 21.47–166.58 mg/g per year; p = 0.011) lesions, but not in those with M1, T1/2 and C1/2 lesions (p > 0.05) (Table 3; Figure 4A).
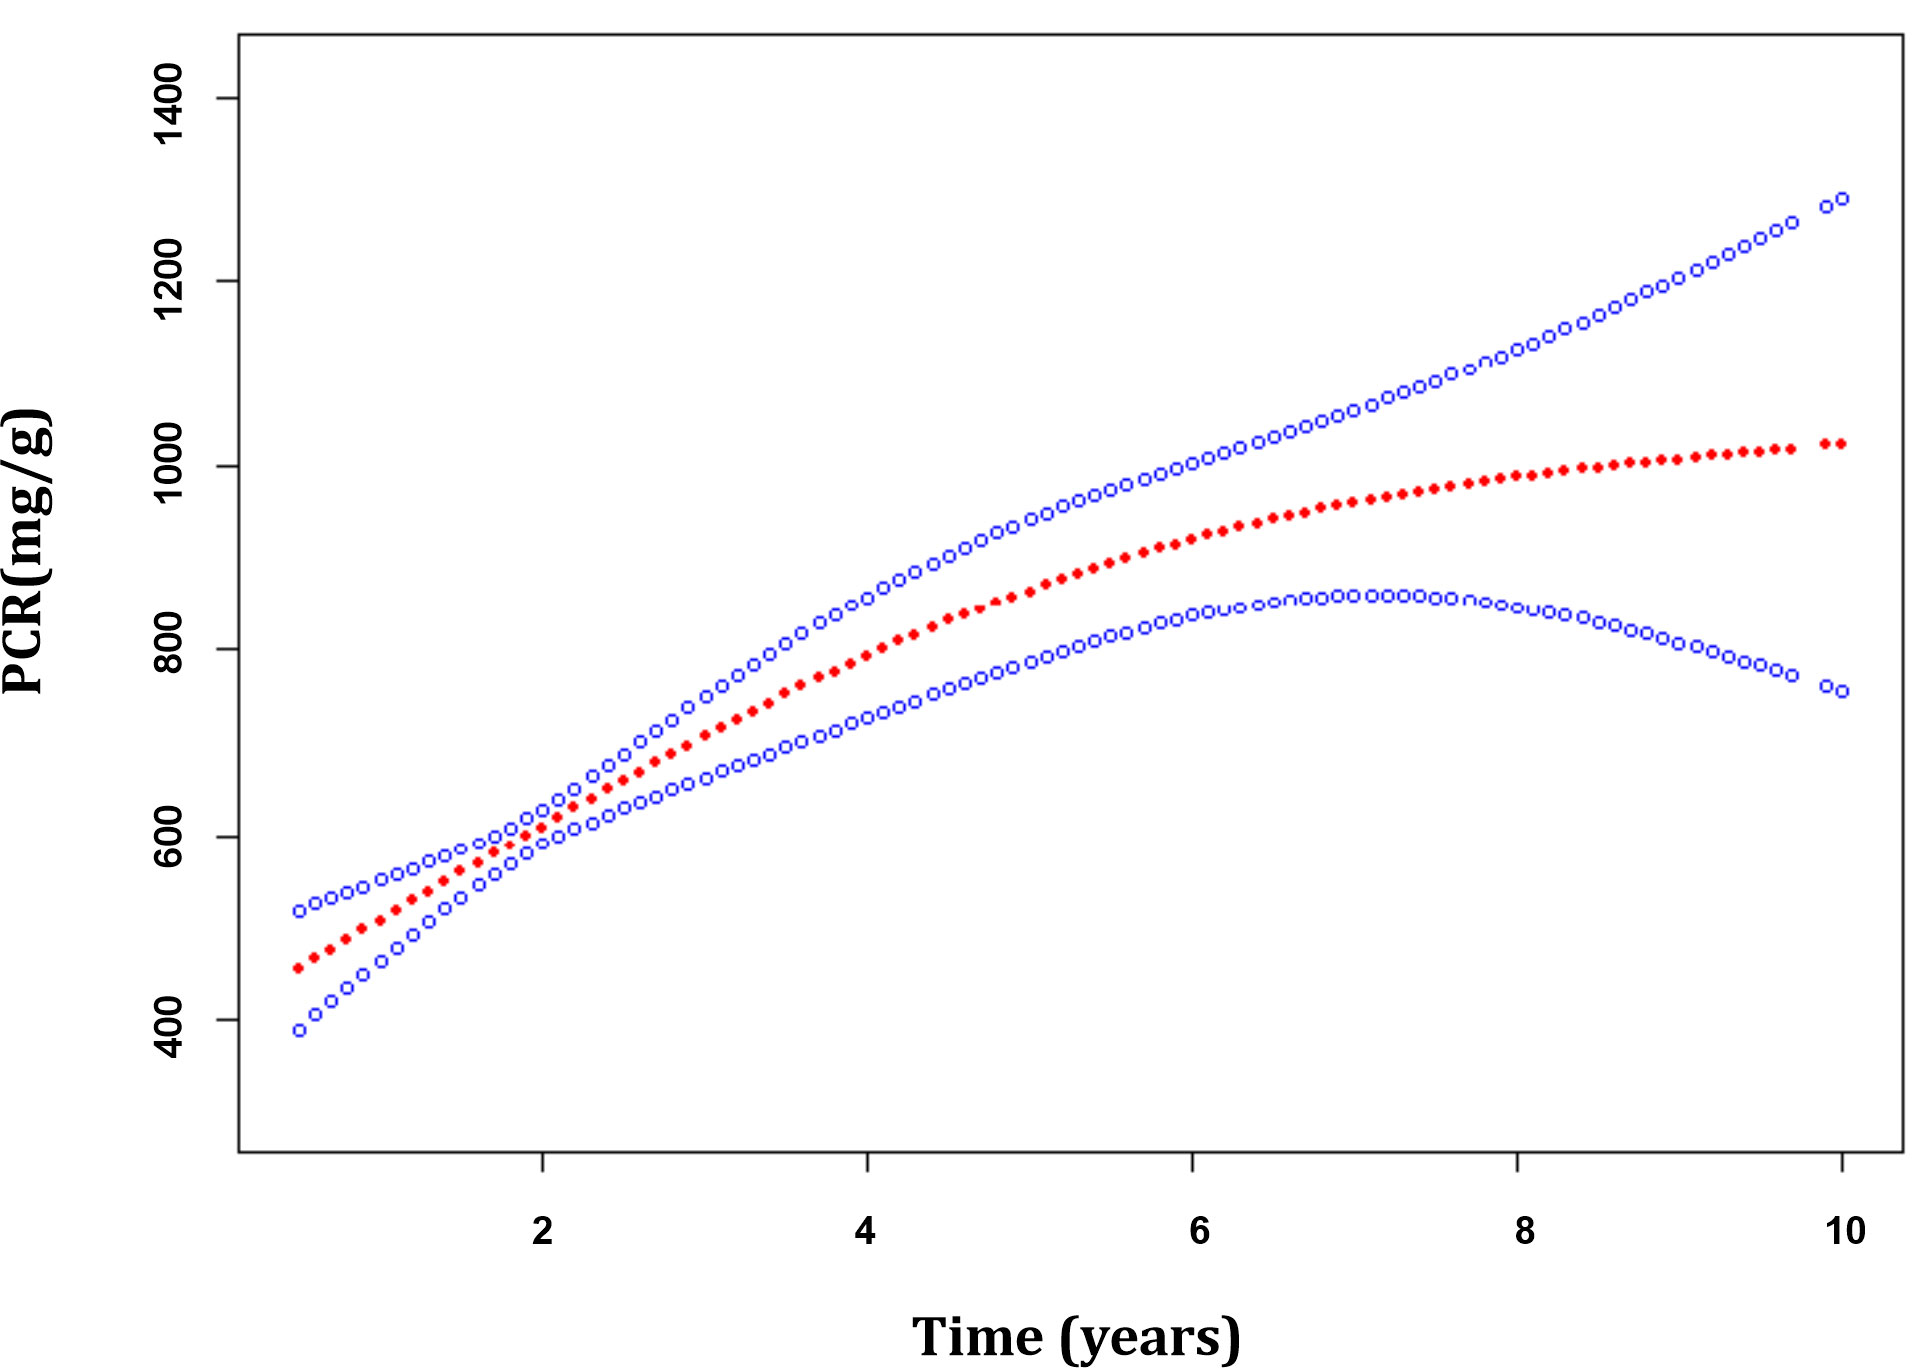
Figure 3 The trajectories of the proteinuria/creatinine ratio in patients with immunoglobulin A nephropathy. Estimates were made from mixed-effect models adjusted for age, gender, MEST-C score, mean arterial pressure, estimated glomerular filtration rate, body mass index and treatments. The red line indicates the estimated value of the proteinuria/creatinine ratio, and the blue line represents the 95% confidence interval for the mean.
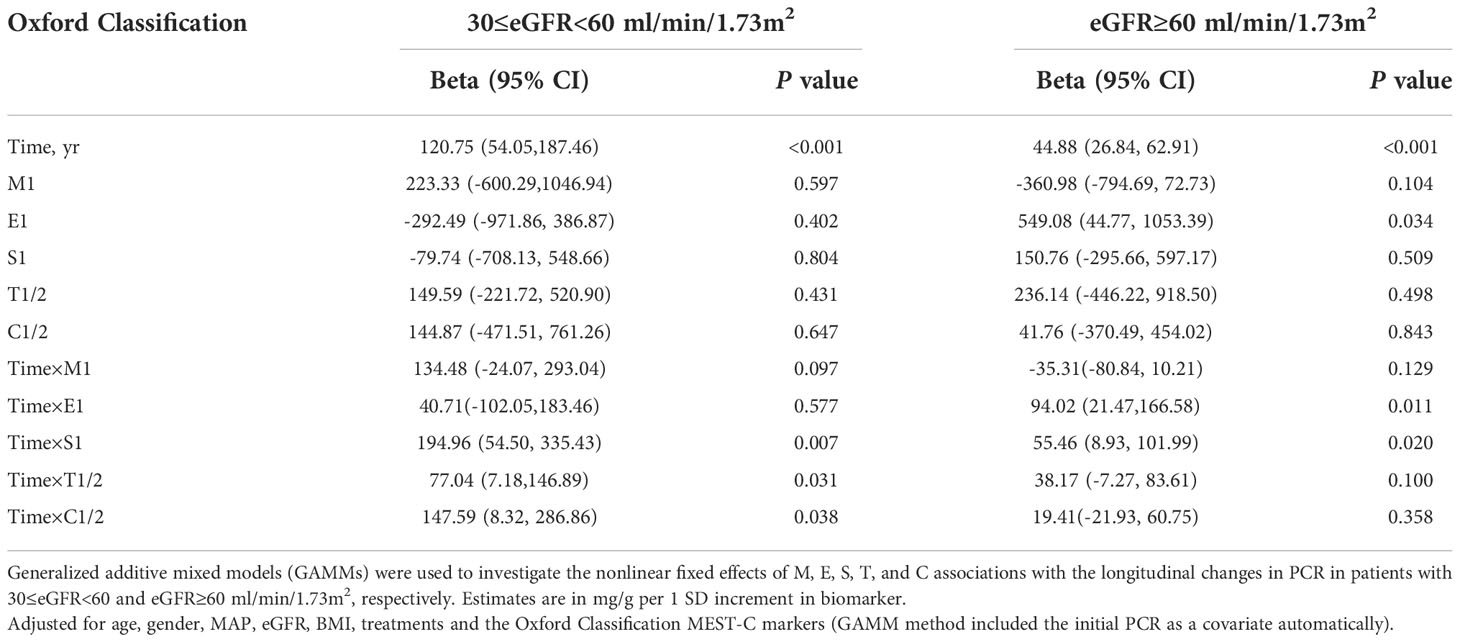
Table 3 Association of the Oxford Classification score MEST-C with the changes in PCR according to 30≤eGFR<60 and eGFR ≥60 ml/min/1.73m2.

Figure 4 Correlation between the Oxford Classification MEST-C score and the annual changes in proteinuria/creatinine ratio in immunoglobulin A nephropathy patients with estimated glomerular filtration rate ≥30, <60, and ≥60 ml/min/1.73m2 (A), body mass index <23 and ≥23kg/m2 (B), respectively. Estimates were made from mixed-effect models adjusted for age, gender, MEST-C score, mean arterial pressure, estimated glomerular filtration rate, body mass index and treatments. Estimates (95% confidence interval) are shown in mg/g per year for each Oxford Classification score.
In order to examine the impact of body size on proteinuria, we then classified patients into underweight/normal weight and overweight/obesity groups based on whether their BMI was greater than 23 kg/m2. The results indicated that, in patients with underweight/normal weight, those with E1 [-79.67; 95% CI, (-143.68) – (-15.66) mg/g per year; p = 0.015] were associated with a greater PCR declined, while those with S1(67.02; 95% CI, 12.23 – 121.81 mg/g per year; p = 0.017) lesions were correlated with faster PCR increase. However, no correlations between M1, T1/2, C1/2, and PCR change were discovered in the adjusted models (p > 0.05). In patients with overweight/obesity, E1 (143.34; 95% CI, 35.30–251.38 mg/g per year; p = 0.010), S1 (156.09; 95% CI, 52.41–259.77 mg/g per year; p = 0.003), T1/2 (116.04; 95% CI, 22.58–209.51 mg/g per year; p = 0.015), and C1/2 (134.03; 95% CI, 41.73–226.32 mg/g per year; p = 0.005) lesions were associated with noticeably quicker PCR increase, but not in individuals who had M1 lesions. (Table 4; Figure 4B).

Table 4 Association of the Oxford Classification score MEST-C with the changes in PCR according to BMI<23kg/m2 and BMI≥23kg/m2.
Methods
Study design and patients
This was a single-center retrospective cohort study that included patients with biopsy-proven primary IgAN as recorded in the IgAN Database of Shenzhen Second People’s Hospital between January 1, 2011, and May 31, 2021. Patients with a secondary cause of IgAN, such as Henoch–Schönlein purpura, systemic lupus erythematosus, or chronic liver disease, were excluded, as were those with missing baseline PCR or renal pathology data for the Oxford Classification, a baseline eGFR <30 ml/min/1.73 m2, missing follow-up PCR measurements, or a follow-up time <0.5 years (Figure 1).
This study was approved by the Medical Ethics Committee of Shenzhen Second People’s Hospital (No. 20211108001-FS01) and conducted ethically in accordance with the World Medical Association Declaration of Helsinki.
Outcomes
The outcomes consisted of estimated annual changes in PCR after renal biopsy. If patients developed eGFR <15 ml/min/1.73 m2, underwent kidney transplantation, hemodialysis, or peritoneal dialysis, or transferred to another center, these were considered to be censored events. The remaining patients were followed up with until December 31, 2021.
Covariates
The demographic and clinicopathologic data at biopsy were gathered from the hospital’s IgAN database. The baseline covariates analyzed in the multivariate linear regression models included age, gender, MAP (calculated as 1/3 × systolic blood pressure + 2/3 × diastolic blood pressure), BMI, eGFR (the 2009 Chronic Kidney Disease Epidemiology Collaboration creatinine equation (28) was used for calculation), the Oxford Classification MEST-C score. Except for the covariates adjusted in the multivariate linear regression models, the treatments (RASi alone, RASi in combination with CSs/ISs, CSs/ISs alone, no RASi and CSs/ISs) were also included in the multivariable mixed models (the GAMM (29) automatically included the initial PCR as a covariate). As the numbers of patients with C2 (N = 22) and T2 (N = 9) lesions were low, patients with C present ≥1 glomerulus (C1) (N = 170) and C2 lesions were combined into a C1/2 group (N = 192), and those with T 26%–50% (T1) (N = 75) and T2 lesions were also grouped together for analysis as a T1/2 group (N = 84). According to the World Health Organization classification for Asian population, patients were categorized as underweight, normal weight, overweight, and obesity, using the thresholds of <18.5, 18.5–22.9, 23.0–24.9, and ≥25.0 kg/m2, respectively. In order to investigate the impact of body size on proteinuria, we categorized patients into underweight/normal weight and overweight/obesity groups based on whether their BMI was greater than 23 kg/m2.
Light immunofluorescence and electron microscopy were used for renal biopsy specimen examination, and the histopathology was graded based on the revised Oxford Classification system as follows: M <0.5 (M0) or M1; E absent (E0) or E1; S absent (S0) or S1; T ≤25% (T0), T1, or T2; and C absent (C0), C1, or C2 (2). The renal biopsy results were reviewed independently by two renal pathologists from Guangzhou Kingmed Center for Clinical Laboratory, and if there was a difference of opinion, a final pathological diagnosis was made by a third senior pathologist.
Statistical analyses
Quantitative variables with normal distribution were expressed as the mean ± standard deviation, and variables with skewed distribution were expressed as the median (quartile), and compared using the t-test or Mann-Whitney test. Categorical variables were expressed as the frequency (percentage) and compared using the chi-squared test or Fisher’s exact test. In addition, a generalized additive model (GAM) and a two-piecewise linear regression model were applied to identify the non-linear relationship and calculate the threshold effect between eGFR and proteinuria.
Multivariate linear regression was applied to identify the associations of the Oxford Classification of MEST-C scores and PCR in patients with 30≤eGFR<60 ml/min/1.73m2 and eGFR≥60 ml/min/1.73m2 respectively, the independent variables were the Oxford Classification of MEST-C scores, and baseline PCR at the time of renal biopsy was as dependent variable. Age, gender, MAP, BMI, eGFR, the Oxford Classification MEST-C scores were adjusted in the multivariable linear regression models.
Graphical examination of the PCR trajectories showed curvilinear changes in the results. Generalized additive mixed models were used to examine the fixed effects of the Oxford Classification of MEST-C associations with longitudinal changes in PCR (29) in patients with 30≤eGFR<60 ml/min/1.73m2 and eGFR≥60 ml/min/1.73m2, and in patients with BMI <23kg/m2 and BMI≥23kg/m2, respectively. The dependent variable (PCR) was analyzed at the baseline visit and during all follow-up visits, whereas the independent variables were only evaluated at the baseline visit in these models (Oxford Classification MEST-C score). Age, gender, MAP, BMI, eGFR, the Oxford Classification MEST-C score, and the treatments were adjusted in the multivariable models to determine whether the effects of MEST-C on the changes in PCR were independent. The interaction term between a fixed-effect variable (M, E, S, T, or C) and time in these mixed-effect regression models was used to assess whether the variable was associated with the longitudinal changes in PCR.
All analyses were performed using the statistical software packages R (the R Foundation, Vienna, Austria), EmpowerStats (X&Y Solutions, Inc., Boston, MA, U.S.A.), and GraphPad Prism 8 (GraphPad Software Inc, La Jolla, CA, U.S.A.). A p-value <0.05 was considered statistically significant.
Discussion
The Oxford Classification system has been well accepted as a means of evaluating the severity of kidney lesions and predicting renal outcomes in patients with IgAN (30). However, the relationships between Oxford Classification scores and clinical remission are still unclear, and this is the first study to comprehensively evaluate the relationship between Oxford Classification MEST-C scores and longitudinal changes in proteinuria. At the time of renal biopsy, it was found that the active lesions including E1 and C1/2 were independently associated with increased proteinuria in IgAN patients. Using repeated PCR measurement data, our results showed that patients with E1, S1, T1/2 and C1/2 lesions demonstrated faster proteinuria increases than patients without such lesions, and those with renal disfunction or overweight/obese patients with relative lesions experienced noticeably quicker PCR raise.
The S lesion has been well recognized for its predictive effect of renal outcomes in patients with IgAN (3, 4, 6–8, 13), and using repeated eGFR measurement data for analysis, a previous study also showed that patients with S lesions display steeper eGFR declines than patients without such lesions (19). In the present study, compared with patients without S lesions, those with S1 lesions were not demonstrated to be associated with increased proteinuria at the time of renal biopsy. However, in patients with renal insufficiency, those with S1 lesions had a notably faster PCR increase (194.96 mg/g per year) during follow-up period. The associations were also demonstrated in patients with normal kidney function although there was a decrease in growth (55.46 mg/g per year). This happened although 79.81% of patients with S1 lesions were treated with RASi, 47.7% of them were treated with CSs/ISs. These results suggested that the effect of segmental glomerular sclerosis on renal damage is persistent but might be partially modifiable by CSs/ISs and/or RASi, especially in patients with normal kidney function. Although it was seen that S lesions are risk factors modifiable by immunosuppressive treatment in the patients, there were differences in the eGFR between the treated and untreated patients (31, 32). A meta-analysis of five studies with 637 patients showed that S lesions significantly predict steroid resistance (33), and moreover, a re-evaluation of Oxford Classification scores on repeated biopsies showed that S lesions do not improve after immunosuppressive treatments (17, 34, 35). Coppo et al. (36) used the original cohort from the Validation Study of the Oxford Classification for IgAN (VALIGA) with an extended follow-up period of 35 years for analysis, and they found that S1 lesions are still independently correlated with renal outcomes. Thus, the results of this study as well as previous studies suggest that S1 lesions might be responding poorly to currently available treatments.
It has been shown that one of the strongest predictive factors for renal outcomes in patients with IgAN is T lesions (2), and it has been shown that compared with patients without such lesions, patients with T2 lesions experience a substantially faster eGFR decline per year (19). Similar to S lesions, the present study did not find significant association between T lesions and raised proteinuria levels at the time of renal biopsy. But we found that T lesions were moderately associated with longitudinal proteinuria increases in IgAN patients with renal disfunction. However, this relationship could not be verified in patients with normal kidney function. Although the correlations between tubulointerstitial lesions and proteinuria were not so strong as the correlations between glomerular lesions and proteinuria, one study noted that proteinuria in IgAN might not only result from active lesions but also from sclerotic glomerular lesions with hyperfiltration and tubular damage (37). Bellur et al. (38) used the cohort from VALIGA to investigate the use of the Oxford Classification of IgAN in 1,147 patients from 13 European countries. They found that all glomerular lesions (M, E, C, and S) were independently associated with the decision to administer CS/IS therapy, except tubulointerstitial lesions. However, in the VALIGA extended follow-up study (36), T1/2 lesions were found to have a predictive value decades after renal biopsy. It was also found that T lesions in association with proteinuria are valuable prognostic markers for the progression of IgAN (39, 40). From the analysis of the VALIGA propensity score-matched cohort (31), the percentage of patients with T1 lesions who ended the follow-up with proteinuria <1 g/day was significantly higher in the group treated with CSs/ISs than in that receiving ACEIs/ARBs alone. Although studies have shown that T1/2 lesions seem to persist and even deteriorate, some T1 lesions improve and change to T0 after treatments (34, 35). Moreover, T1/2 lesions involving >25% of the renal biopsy area represent medium to severe damage, and they are more common in patients with a marked decline in renal function. In this study, T1/2 lesions accounted for 24.3% and 6.7% of patients with eGFR <60 ml/min/1.73m2 and eGFR ≥60 ml/min/1.73m2, respectively. And 77.38% of patients with T1/2 lesions took RASi and 59.53% of them took CSs/ISs after renal biopsy. The insignificant results in patients with normal kidney function may largely have been due to the small number of patients with T1/2 lesions in this sample, and further studies are still needed to confirm this hypothesis. For patients with eGFR ≥30 ml/min/1.73 m2 who have T lesions, especially T1 lesions in the early stages, the disease might be partially reversible, and more effective therapies targeted toward these lesions might help improve the renal prognosis.
Unlike S and T lesions, E lesions are known to be active, and inconsistent results for their predictive role in renal outcomes have been reported (3, 5–18, 41, 42). The differences are regarded to be confounded by an immunosuppressant bias (17, 31, 33, 35, 43). The present study showed that patients with E1 lesions were associated with increased proteinuria at the time of renal biopsy. Moreover, the patients with E1 lesions exhibited a faster proteinuria rise (94.02 mg/g per year) than those without such lesions in patients with normal kidney function, but not in those with kidney function impairment. Among the study patients, 74.02% of those with E1 lesions took RASi, and 64.93% of them took CSs/ISs, and a lower proportion of patients without E receiving CSs/ISs (41.61%). It’s probable that the results were viewed as negligible in part due to the small number of individuals with renal insufficiency and E1 lesions in our sample, and this idea still needs to be tested in more studies. A study conducted by Coppo et al., in which the original VALIGA cohort was used for analysis, with a median follow-up of 4.7 years. It was concluded that an E lesion is a risk factor for developing higher proteinuria levels (4). In a single-center European study investigating patients with IgAN who did not undergo CS/IS treatment, irrespective of the clinical features at renal biopsy, E1 was the best predictor of poor renal survival at the six-year follow-up (44). Jullien et al. examined repeated kidney biopsies and found that E1 lesions discovered in the first renal biopsy were persistent in 62% of patients in the second renal biopsy after a median time of 5.4 years and that the persistent E1 lesions were associated with poor renal survival (35). Thus, further studies are still needed to confirm whether E1 lesions are satisfactorily treatable with current therapies, especially immunosuppressants.
The prognostic role of C lesions in renal decline progression was less concordant and reproducible and were not included in the original Oxford Classification score system. A working subgroup of the IgAN Classification Working Group addressed crescents as a potential predictor for renal outcomes in 3,096 patients with IgAN, who were assembled from four retrospective studies (Haas et al. (18), Oxford (3, 45), and VALIGA (4)) and two large Asian databases (5, 11). They discovered that C1 lesions only predicted renal outcomes in individuals not receiving immunosuppressive therapy, whereas C2 lesions indicated poor renal outcomes in both immunosuppressed patients and those who were not. In this study, we discovered that patients with C1/2 lesions had higher proteinuria at the time of renal biopsy and that they also experienced a faster rise in proteinuria (147.59 mg/g per year) than patients without such lesions. These correlations were not observed in patients with normal kidney function. In the current study, 58.6% of patients with C1/2 and 32.03% of patients without related lesions took CSs/ISs, respectively. In our clinical practice, C lesions have been acknowledged as active injuries and are more likely to be treated with immunosuppressive medications. These findings would suggest that current therapies, particularly immunosuppressants, may work better on patients with normal renal function than on those with impaired renal function for treating C lesions. Two studies of repeated biopsies showed that patients with cellular/fibrocellular crescents displayed significant improvement after immunosuppressant use (17, 43). Of these two studies, Shen et al. found that after immunosuppressive therapy, 10% of patients with C lesions on the first biopsy had vanished, 5% had gotten worse, 65% had reversed, and 20% had remained in the second biopsy (17). Another study found no statistically significant changes between the first and second biopsy with respect to C lesions (16% vs. 11%) (35). However, neither the difference in renal function nor the severity of the crescents (i.e., C1 or C2), which might influence the treatment response in IgAN patients, were examined in these trials. Therefore, further research is still needed to confirm the effectiveness of the present medicines for treating C lesions.
Overweight/obese is considered as a strong predictor of new onset of chronic kidney disease and progression of ESRD (46). Although the exact mechanism is still unclear, overweight/obese have been linked to the induction of proteinuria, which might be through physical compression of the kidney or alteration of glomerular hyperfiltration, along with inflammation, oxidative stress, lipotoxicity, as well as activation of the renin-angiotensin-aldosterone system (RAAS) and mineralocorticoid receptor (47–49). Similarly, the current study demonstrated a correlation between overweight/obese patients with lesions on the E1 (143.34 mg/g per year), S1 (156.09 mg/g per year), T1/2 (116.04 mg/g per year), and C1/2 (134.03 mg/g per year) and considerably quicker PCR rise. Interestingly, for patients who were underweight/normal weight, E1 (-79.67 mg/g per year) lesions were associated with faster proteinuria decline during the follow-up period, indicating a better treatment response for these patients. A RCT recruiting of patients with nephropathy of diabetic or nondiabetic cause showed that weight loss of 4%, there was a 30% decrease in proteinuria, and with further 6–10% reduction in weight the proteinuria decreased by > 70% (50, 51). These findings imply that weight loss may improve renal prognosis in overweight/obese patients by lowering urine protein and/or by other mechanisms. However, as IgAN patients were not included in the previous study, the effects of weight loss on long-term urine protein levels and renal function in IgAN patients who are overweight/obese, is still need to be further investigated.
The greatest strength of the current study was the use of repeated PCR measurements, which made it possible to track longitudinal changes in proteinuria according to the Oxford Classification score. However, this study also had some limitations. As a retrospective study, it was only possible to obtain the treated and untreated data from the electronic medical records, and it was not possible to preclude patients with poor medicine compliance who claimed to comply with the medical advice. In addition, this study only separately analyzed patients with one of the MEST-C lesions, but patients often have more than two pathological changes. Further studies with a larger sample and subgroup analysis with different combinations of Oxford Classification scores are needed. Moreover, research on microangiopathic lesions, which have been proven to predict renal failure progression, needs to be included (52). Finally, the follow-up time of this study was relatively short, and only data from one center were analyzed. Thus, these results must be verified in other centers and among other ethnic groups and with longer follow-up times.
Conclusion
In summary, Oxford Classification scores E1 and C1/2 were associated with increased proteinuria at the time of renal biopsy, using repeated PCR measurement data during follow-up visits for analysis, it was found that S1, E1, T1/2, and C1/2 were associated with faster proteinuria increases in patients with IgAN, especially in those with renal insufficiency or overweight/obesity. Thus, the Oxford Classification score might be valuable for developing individual treatment therapies since the findings suggest that currently available treatments are unsatisfactory for treating these lesions successfully, and weight loss may be helpful for lowering urine protein in overweight/obese patients.
Data availability statement
The original contributions presented in the study are included in the article/Supplementary Material. Further inquiries can be directed to the corresponding author.
Ethics statement
The studies involving human participants were reviewed and approved by The Second People’s Hospital of Shenzhen. The patients/participants provided their written informed consent to participate in this study.
Author contributions
Conception and design of the research: R-CX and Q-JW. Acquisition of data: YL, Y-NC, FT and QX. Analysis and interpretation of the data: J-YG, TC and YX. Statistical analysis: H-YS, X-JC and M-JG. Obtaining financing: R-CX, Q-JW and YX. Writing of the manuscript: R-CX and J-YG. Critical revision of the manuscript for intellectual content: X-LC and Q-JW. All authors contributed to the article and approved the submitted version.
Funding
This work was supported by a grant from the National Natural Science Foundation of China (R.C.X., 81900639), the Basic Research Program of the Shenzhen Science and Technology R & D Fund (R.C.X., JCYJ20190806162807125), Shenzhen Second People’s Hospital Clinical Research Fund of Guangdong Province High-level Hospital Construction Project (R.C.X., 20223357009), ProgramShenzhen Key Medical Discipline Construction Fund, Shenzhen Second People’s Hospital Clinical Research Program (Y. X., 20193357002), Shenzhen Key Medical Discipline Construction Fund (SZXK009)
Acknowledgments
We thank all of the subjects who have been included in this work. We thank the staff of the Second People’s Hospital of Shenzhen for help with the data collection and recording. We also thank Hao-fei Hu for reviewing the manuscript and providing constructive suggestions.
Conflict of interest
Author X-LC is employed by Empower U, X&Y solutions Inc.
The remaining authors declare that the research was conducted in the absence of any commercial or financial relationships that could be construed as a potential conflict of interest.
Publisher’s note
All claims expressed in this article are solely those of the authors and do not necessarily represent those of their affiliated organizations, or those of the publisher, the editors and the reviewers. Any product that may be evaluated in this article, or claim that may be made by its manufacturer, is not guaranteed or endorsed by the publisher.
Supplementary material
The Supplementary Material for this article can be found online at: https://www.frontiersin.org/articles/10.3389/fendo.2022.890900/full#supplementary-material
Supplementary Figure 1 | The relationship between estimated glomerular filtration rate and proteinuria/creatinine ratio in patients with immunoglobulin A nephropathy. A non-linear relationship between estimated glomerular filtration rate and proteinuria/creatinine ratio was detected after adjusting for age, gender, mean arterial pressure, body mass index and the Oxford Classification MEST-C score.
References
1. Hou JH, Zhu HX, Zhou ML, Le WB, Zeng CH, Liang SS, et al. Changes in the spectrum of kidney diseases: An analysis of 40,759 biopsy-proven cases from 2003 to 2014 in China. Kidney Dis (Basel) (2018) 4(1):10–9. doi: 10.1159/000484717
2. Trimarchi H, Barratt J, Cattran DC, Cook HT, Coppo R, Haas M, et al. Conference participants. Oxford classification of IgA nephropathy 2016: An update from the IgA nephropathy classification working group. Kidney Int (2017) 91(5):1014–21. doi: 10.1016/j.kint.2017.02.003
3. Working Group of the International IgA Nephropathy Network and the Renal Pathology Society, Cattran DC, Coppo R, Cook HT, Feehally J, Roberts ISD, et al. The Oxford classification of IgA nephropathy: Rationale, clinicopathological correlations, and classification. Kidney Int (2009) 76(5):534–45. doi: 10.1038/ki.2009.243
4. Coppo R, Troyanov S, Bellur S, Cattran D, Cook HT, Feehally J, et al. Validation of the Oxford classification of IgA nephropathy in cohorts with different presentations and treatments. Kidney Int (2014) 86(4):828–36. doi: 10.1038/ki.2014.63
5. Katafuchi R, Ninomiya T, Nagata M, Mitsuiki K, Hirakata H. Validation study of oxford classification of IgA nephropathy: The significance of extracapillary proliferation. Clin J Am Soc Nephrol (2011) 6(12):2806–13. doi: 10.2215/CJN.02890311
6. Herzenberg AM, Fogo AB, Reich HN, Troyanov S, Bavbek N, Massat AE, et al. Validation of the Oxford classification of IgA nephropathy. Kidney Int (2011) 80(3):310–7. doi: 10.1038/ki.2011.126
7. El Karoui K, Hill GS, Karras A, Jacquot C, Moulonguet L, Kourilsky O, et al. A clinicopathologic study of thrombotic microangiopathy in IgA nephropathy. J Am Soc Nephrol (2012) 23(1):137–48. doi: 10.1681/ASN.2010111130
8. Shi SF, Wang SX, Jiang L, Lv JC, Liu LJ, Chen YQ, et al. Pathologic predictors of renal outcome and therapeutic efficacy in IgA nephropathy: validation of the oxford classification. Clin J Am Soc Nephrol (2011) 6(9):2175–84. doi: 10.2215/CJN.11521210
9. Shima Y, Nakanishi K, Hama T, Mukaiyama H, Togawa H, Hashimura Y, et al. Validity of the Oxford classification of IgA nephropathy in children. Pediatr Nephrol (2012) 27(5):783–92. doi: 10.1007/s00467-011-2061-0
10. Le W, Zeng CH, Liu Z, Liu D, Yang Q, Lin RX, et al. Validation of the Oxford classification of IgA nephropathy for pediatric patients from China. BMC Nephrol (2012) 13:158. doi: 10.1186/1471-2369-13-158
11. Zeng CH, Le W, Ni Z, Zhang MF, Miao LN, Luo P, et al. A multicenter application and evaluation of the oxford classification of IgA nephropathy in adult Chinese patients. Am J Kidney Dis (2012) 60(5):812–20. doi: 10.1053/j.ajkd.2012.06.011
12. Kang SH, Choi SR, Park HS, Lee JY, Sun IO, Hwang HS, et al. The Oxford classification as a predictor of prognosis in patients with IgA nephropathy. Nephrol Dial Transplant (2012) 27(1):252–8. doi: 10.1093/ndt/gfr295
13. Espinosa M, Ortega R, Sánchez M, Segarra A, Salcedo MT, González F, et al. Spanish Group for study of glomerular diseases (GLOSEN): Association of C4d deposition with clinical outcomes in IgA nephropathy. Clin J Am Soc Nephrol (2014) 9(5):897–904. doi: 10.2215/CJN.09710913
14. Park KS, Han SH, Kie JH, Nam KH, Lee MJ, Lim BJ, et al. Comparison of the haas and the Oxford classifications for prediction of renal outcome in patients with IgA nephropathy. Hum Pathol (2014) 45(2):236–43. doi: 10.1016/j.humpath.2013.08.019
15. Working Group of the International IgA Nephropathy Network and the Renal Pathology Society, Coppo R, Troyanov S, Camilla R, Hogg RJ, Cattran DC, et al. The Oxford IgA nephropathy clinicopathological classification is valid for children as well as adults. Kidney Int (2010) 77(10):921–7. doi: 10.1038/ki.2010.43
16. Lee H, Yi SH, Seo MS, Hyun JN, Jeon JS, Noh H, et al. Validation of the Oxford classification of IgA nephropathy: A single-center study in Korean adults. Korean J Intern Med (2012) 27(3):293–300. doi: 10.3904/kjim.2012.27.3.293
17. Shen XH, Liang SS, Chen HM, Le WB, Jiang S, Zeng CH, et al. Reversal of active glomerular lesions after immunosuppressive therapy in patients with IgA nephropathy: a repeat-biopsy based observation. J Nephrol (2015) 28(4):441–9. doi: 10.1007/s40620-014-0165-x
18. Haas M, Verhave JC, Liu ZH, Alpers CE, Barratt J, Becker JU, et al. A multicenter study of the predictive value of crescents in IgA nephropathy. J Am Soc Nephrol (2017) 28(2):691–701. doi: 10.1681/ASN.2016040433
19. Xu R, Li Z, Cao T, Xu Y, Liao Y, Song H, et al. The association of the Oxford classification score with longitudinal estimated glomerular filtration rate decline in patients with immunoglobulin a nephropathy: A mixed-method study. Int J Gen Med (2021) 14:2655–63. doi: 10.2147/IJGM.S313333
20. Le W, Liang S, Hu Y, Deng K, Bao H, Zeng C, et al. Long-term renal survival and related risk factors in patients with IgA nephropathy: Results from a cohort of 1155 cases in a Chinese adult population. Nephrol Dial Transplant (2012) 27(4):1479–85. doi: 10.1093/ndt/gfr527
21. Moriyama T, Tanaka K, Iwasaki C, Oshima Y, Ochi A, Kataoka H, et al. Prognosis in IgA nephropathy: 30-year analysis of 1,012 patients at a single center in Japan. PloS One (2014) 9(3):e91756. doi: 10.1371/journal.pone.0091756
22. Liu Y, Hu Q, Shen P, Tang L, Yuan G, Zhou Y, et al. Clinical and pathological analysis of IgA nephropathy with chronic renal failure. Ren Fail (2016) 38(9):1347–52. doi: 10.1080/0886022X.2016.1214051
23. Kidney Disease: Improving Global Outcomes (KDIGO) Glomerular Diseases Work Group. KDIGO 2021 clinical practice guideline for the management of glomerular diseases. Kidney Int (2021) 100(4S):S1–S276. doi: 10.1016/j.kint.2021.05.021
24. Rauen T, Eitner F, Fitzner C, Sommerer C, Zeier M, Otte B, et al. STOP-IgAN investigators. intensive supportive care plus immunosuppression in IgA nephropathy. N Engl J Med (2015) 373(23):2225–36. doi: 10.1056/NEJMoa1415463
25. Lv J, Zhang H, Wong MG, Jardine MJ, Hladunewich M, Jha V, et al. Effect of oral methylprednisolone on clinical outcomes in patients with IgA nephropathy: The TESTING randomized clinical trial. JAMA (2017) 318(5):432–42. doi: 10.1001/jama.2017.9362
26. Lafayette RA, Canetta PA, Rovin BH, Appel GB, Novak J, Nath KA, et al. A randomized, controlled trial of rituximab in IgA nephropathy with proteinuria and renal dysfunction. J Am Soc Nephrol (2017) 28(4):1306–13. doi: 10.1681/ASN.2016060640
27. Fellström BC, Barratt J, Cook H, Coppo R, Feehally J, de Fijter JW, et al. Targeted-release budesonide versus placebo in patients with IgA nephropathy (NEFIGAN): a double-blind, randomised, placebo-controlled phase 2b trial. Lancet (2017) 389(10084):2117–27. doi: 10.1016/S0140-6736(17)30550-0
28. Levey AS, Stevens LA, Schmid CH, Zhang YL, Castro AF, Feldman HI, et al. CKD-EPI (Chronic kidney disease epidemiology collaboration): A new equation to estimate glomerular filtration rate. Ann Intern Med (2009) 150(9):604–12. doi: 10.7326/0003-4819-150-9-200905050-00006
29. Passafaro TL, Van de Stroet D, Bello NM, Williams NH, Rosa GJM. Generalized additive mixed model on the analysis of total transport losses of market-weight pigs1. J Anim Sci (2019) 97(5):2025–34. doi: 10.1093/jas/skz087
30. Barbour SJ, Coppo R, Zhang H, Liu ZH, Suzuki Y, Matsuzaki K, et al. International IgA nephropathy network. Evaluating a new international risk-prediction tool in IgA nephropathy. JAMA Intern Med (2019) 179(7):942–52. doi: 10.1001/jamainternmed.2019.0600
31. Tesar V, Troyanov S, Bellur S, Verhave JC, Cook HT, Feehally J, et al. Corticosteroids in IgA nephropathy: A retrospective analysis from the VALIGA study. J Am Soc Nephrol (2015) 26(9):2248–58. doi: 10.1681/ASN.2014070697
32. Cheng YQ, Li J, Qu HS, Zhang XZ, Zhang HL, Zhang J, et al. Clinical effect of tripterygium glycosides combined with glucocorticoids in the treatment of refractory nephrotic syndrome patients: A systematic review and meta-analysis. World J Tradit Chin Med (2020) 6:249–59. doi: 10.4103/wjtcm.wjtcm_20_20
33. Yang P, Chen X, Zeng L, Hao H, Xu G. The response of the Oxford classification to steroid in IgA nephropathy: A systematic review and meta-analysis. Oncotarget (2017) 8(35):59748–56. doi: 10.18632/oncotarget.19574
34. Beckwith H, Medjeral-Thomas N, Galliford J, Griffith M, Levy J, Lightstone L, et al. Mycophenolate mofetil therapy in immunoglobulin a nephropathy: histological changes after treatment. Nephrol Dial Transplant (2017) 32(suppl_1):i123–8. doi: 10.1093/ndt/gfw326
35. Jullien P, Laurent B, Berthoux F, Masson I, Dinic M, Claisse G, et al. Repeat renal biopsy improves the Oxford classification-based prediction of immunoglobulin a nephropathy outcome. Nephrol Dial Transplant (2020) 35(7):1179–86. doi: 10.1093/ndt/gfy341
36. Coppo R, D'Arrigo G, Tripepi G, Russo ML, Roberts ISD, Bellur S, et al. Is there long-term value of pathology scoring in immunoglobulin a nephropathy? a validation study of the Oxford classification for IgA nephropathy (VALIGA) update. Nephrol Dial Transplant (2020) 35(6):1002–9. doi: 10.1093/ndt/gfy302
37. Coppo R. Clinical and histological risk factors for progression of IgA nephropathy: an update in children, young and adult patients. J Nephrol (2017) 30(3):339–46. doi: 10.1007/s40620-016-0360-z
38. Bellur SS, Roberts ISD, Troyanov S, Royal V, Coppo R, Cook HT, et al. Reproducibility of the Oxford classification of immunoglobulin a nephropathy, impact of biopsy scoring on treatment allocation and clinical relevance of disagreements: evidence from the VALidation of IGA study cohort. Nephrol Dial Transplant (2019) 34(10):1681–90. doi: 10.1093/ndt/gfy337
39. Zhu X, Li H, Liu Y, You J, Qu Z, Yuan S, et al. Tubular atrophy/interstitial fibrosis scores of Oxford classification combinded with proteinuria level at biopsy provides earlier risk prediction in lgA nephropathy. Sci Rep (2017) 7(1):1100. doi: 10.1038/s41598-017-01223-3
40. Coppo R. Towards a personalized treatment for IgA nephropathy considering pathology and pathogenesis. Nephrol Dial Transplant (2019) 34(11):1832–8. doi: 10.1093/ndt/gfy338
41. Gutiérrez E, Zamora I, Ballarín JA, Arce Y, Jiménez S, Quereda C, et al. Long-term outcomes of IgA nephropathy presenting with minimal or no proteinuria. J Am Soc Nephrol (2012) 23(10):1753–60. doi: 10.1681/ASN.2012010063
42. Edström Halling S, Söderberg MP, Berg UB. Predictors of outcome in paediatric IgA nephropathy with regard to clinical and histopathological variables (Oxford classification). Nephrol Dial Transplant (2012) 27(2):715–22. doi: 10.1093/ndt/gfr339
43. Hou JH, Le WB, Chen N, Wang WM, Liu ZS, Liu D, et al. Mycophenolate mofetil combined with prednisone versus full-dose prednisone in IgA nephropathy with active proliferative lesions: A randomized controlled trial. Am J Kidney Dis (2017) 69(6):788–95. doi: 10.1053/j.ajkd.2016.11.027
44. Chakera A, MacEwen C, Bellur SS, Chompuk LO, Lunn D, Roberts ISD. Prognostic value of endocapillary hypercellularity in IgA nephropathy patients with no immunosuppression. J Nephrol (2016) 29(3):367–75. doi: 10.1007/s40620-015-0227-8
45. Working Group of the International IgA Nephropathy Network and the Renal Pathology Society, Roberts IS, Cook HT, Troyanov S, Alpers CE, Amore A, et al. The Oxford classification of IgA nephropathy: Pathology definitions, correlations, and reproducibility. Kidney Int (2009) 76(5):546–56. doi: 10.1038/ki.2009.168
46. Kovesdy CP, Furth SL, Zoccali C, World Kidney Day Steering Committee. Electronic address: myriam@worldkidneyday.org; world kidney day steering committee. obesity and kidney disease: Hidden consequences of the epidemic. Kidney Int (2017) 91(2):260–2. doi: 10.1016/j.kint.2016.10.019
47. Whaley-Connell A, Sowers JR. Obesity and kidney disease: from population to basic science and the search for new therapeutic targets. Kidney Int (2017) 92(2):313–23. doi: 10.1016/j.kint.2016.12.034
48. Hall ME, do Carmo JM, da Silva AA, Juncos LA, Wang Z, Hall JE. Obesity, hypertension, and chronic kidney disease. Int J Nephrol Renovasc Dis (2014) 7:75–88. doi: 10.2147/IJNRD.S39739
49. Aroor AR, Habibi J, Nistala R, Ramirez-Perez FI, Martinez-Lemus LA, Jaffe IZ, et al. Diet-induced obesity promotes kidney endothelial stiffening and fibrosis dependent on the endothelial mineralocorticoid receptor. Hypertension (2019) 73(4):849–58. doi: 10.1161/HYPERTENSIONAHA.118.12198
50. Morales E, Valero MA, León M, Hernández E, Praga M. Beneficial effects of weight loss in overweight patients with chronic proteinuric nephropathies. Am J Kidney Dis (2003) 41(2):319–27. doi: 10.1053/ajkd.2003.50039
51. Sharma I, Liao Y, Zheng X, Kanwar YS. New pandemic: Obesity and associated nephropathy. Front Med (Lausanne) (2021) 8:673556. doi: 10.3389/fmed.2021.673556
Keywords: IgA nephropathy, Oxford classification, proteinuria/creatinine ratio, mixed methods, renal function
Citation: Xu R-C, Guo J-Y, Cao T, Xu Y, Liao Y, Chen Y-N, Song H-Y, Chen X-J, Guan M-J, Tang F, Xiang Q, Chen X-L and Wan Q-J (2023) A mixed-method evaluation of the relationship between Oxford classification scores and longitudinal changes in proteinuria in patients with immunoglobulin A nephropathy. Front. Endocrinol. 13:890900. doi: 10.3389/fendo.2022.890900
Received: 06 May 2022; Accepted: 25 October 2022;
Published: 10 January 2023.
Edited by:
Akira Sugawara, Tohoku University, JapanReviewed by:
Francesco Paolo Schena, University of Bari Aldo Moro, ItalySergey Brodsky, Ohio State University Hospital, United States
Copyright © 2023 Xu, Guo, Cao, Xu, Liao, Chen, Song, Chen, Guan, Tang, Xiang, Chen and Wan. This is an open-access article distributed under the terms of the Creative Commons Attribution License (CC BY). The use, distribution or reproduction in other forums is permitted, provided the original author(s) and the copyright owner(s) are credited and that the original publication in this journal is cited, in accordance with accepted academic practice. No use, distribution or reproduction is permitted which does not comply with these terms.
*Correspondence: Qi-Jun Wan, wanqj8964@163.com
†These authors share first authorship