 Yu-Ming Huang1,2,3
 Tsang-En Wang2,4,5Ming-Jen Chen2,4,5Ching-Chung Lin2,4,5Ching-Wei Chang2,4,5Hung-Chi Tai3,6
 Shih-Ming Hsu3*
 Yu-Jen Chen2,5,6,7,8*
- 1Department of Radiation Oncology, Taipei Hospital, Ministry of Health and Welfare, New Taipei City, Taiwan
- 2Department of Medicine, MacKay Medical College, New Taipei City, Taiwan
- 3Department of Biomedical Imaging and Radiological Sciences, National Yang Ming Chiao Tung University, Taipei, Taiwan
- 4Division of Gastroenterology, Department of Internal Medicine, MacKay Memorial Hospital, Taipei, Taiwan
- 5Department of Artificial Intelligence and Medical Application, MacKay Junior College of Medicine, Nursing, and Management, New Taipei City, Taiwan
- 6Department of Radiation Oncology, MacKay Memorial Hospital, Taipei, Taiwan
- 7Department of Medical Research, MacKay Memorial Hospital, Taipei, Taiwan
- 8Department of Medical Research, China Medical University Hospital, Taichung, Taiwan
Background: This study aims to establish and validate a predictive model based on radiomics features, clinical features, and radiation therapy (RT) dosimetric parameters for overall survival (OS) in hepatocellular carcinoma (HCC) patients treated with RT for portal vein tumor thrombosis (PVTT).
Methods: We retrospectively reviewed 131 patients. Patients were randomly divided into the training (n = 105) and validation (n = 26) cohorts. The clinical target volume was contoured on pre-RT computed tomography images and 48 textural features were extracted. The least absolute shrinkage and selection operator regression was used to determine the radiomics score (rad-score). A nomogram based on rad-score, clinical features, and dosimetric parameters was developed using the results of multivariate regression analysis. The predictive nomogram was evaluated using Harrell’s concordance index (C-index), area under the curve (AUC), and calibration curve.
Results: Two radiomics features were extracted to calculate the rad-score for the prediction of OS. The radiomics-based nomogram had better performance than the clinical nomogram for the prediction of OS, with a C-index of 0.73 (95% CI, 0.67–0.79) and an AUC of 0.71 (95% CI, 0.62–0.79). The predictive accuracy was assessed by a calibration curve.
Conclusion: The radiomics-based predictive model significantly improved OS prediction in HCC patients treated with RT for PVTT.
Introduction
Hepatocellular carcinoma (HCC) is the sixth most common cancer and the third leading cause of cancer death worldwide. The prognosis of HCC is poor, with a 5-year survival rate of 5%–18% (1–4). Approximately 70% of newly diagnosed HCC patients are not suitable for curative local treatment (5). The major cause is macrovascular invasion, in which tumor cells invade the portal vein, hepatic vein, or the inferior vena cava in the liver (6). Portal vein tumor thrombosis (PVTT) is a common complication of HCC and is related to poor prognosis and poor response to local treatment. The incidence of PVTT in HCC ranges from 44% to 62% (7). PVTT can interfere with the portal blood supply in the normal liver and deteriorate liver function. It may contribute to intrahepatic or extrahepatic metastasis (8). This locally advanced and mostly unresectable disease is associated with rapid cancer progression and deterioration of liver function. Patients with PVTT have a median survival rate of only 3 months without treatment (9). Current treatments for HCC with PVTT include targeted therapy with sorafenib and lenvatinib and locoregional treatments such as operation (OP), radiation therapy (RT), transarterial chemoembolization (TACE), and transarterial radioembolization (TARE) (10–13). However, there is no consensus on the best forms of treatment for HCC patients with PVTT. Several clinical studies have reported that RT alone or combined with TACE is an effective treatment for HCC with PVTT (14–17). The clinical target volume (CTV) of RT for PVTT usually encompasses the area of PVTT and/or visible tumor with a 5–10–mm margin to cover the involved portal vein region (18). The advantages of RT for HCC with PVTT are local tumor control, portal vein patency, and survival benefit (19). No universal marker or method of clinical utility that can predict the survival of HCC patients treated with RT for PVTT is known. An effective predictive model that may guide precision medicine for these patients with generally poor survival is required.
HCC can be diagnosed on contrast-enhanced computed tomography (CT) or magnetic resonance imaging (MRI) (20). Therefore, HCC is frequently diagnosed on images alone, precluding the requirement for tissue proof. Currently, CT is routinely used by physicians for diagnosis, staging, and RT planning for HCC. Radiomics is an emerging and promising methodology for medical image analysis that converts medical images into high-dimensional quantitative features using machine learning algorithms and statistical analysis software. Thus, it may facilitate the detection of lesions (21, 22), improve diagnostic accuracy (23–25), predict disease risk and prognosis (26–32), evaluate the risk of treatment and treatment-related toxicities (33–37), and guide treatment strategies (38, 39) in different types of diseases, especially malignancies. Several studies have been published on the use of radiomics in HCC (40–43). Wang et al. analyzed the prognostic value of MRI textural features in HCC in 201 patients who underwent OP (44). Meng et al. integrated intratumoral and peritumoral CT radiomics features and clinical features to develop and validate a radiomics-based predictive nomogram to predict overall survival (OS) in HCC patients undergoing TACE (45). Cozzi et al. appraised the ability of a radiomics-based analysis to predict local response and OS in HCC patients who were eligible for curative or palliative RT (46). To the best of our knowledge, relatively limited data and few studies focused on prognosis estimation in HCC patients treated with RT for PVTT with radiomics analysis are available. This study uses radiomics features of CTV, which are derived from the pre-RT CT of HCC patients with PVTT, in combination with clinical features and RT dosimetric parameters to develop a predictive model for HCC with PVTT.
Material and methods
Patients
We retrospectively reviewed HCC patients newly diagnosed with PVTT between December 2007 and December 2019 in one institution. A contrast-enhanced CT or MRI was performed for diagnosis and staging. According to the 7th edition American Joint Committee on Cancer/American Joint Committee on Cancer staging system, all patients were staged IIIB (patients with a single tumor or multiple tumors of any size involving a major branch of the portal vein or hepatic vein, Vp4 in Liver Cancer Study Group of Japan classification). All patients had an Eastern Cooperative Oncology Group (ECOG) performance status of 0 to 2. In this study, patients were either inoperable or not eligible for TACE or TARE. The primary treatments were RT and/or targeted therapy. Patients with a history of OP, RT, TACE, or TARE were excluded. A total of 131 patients were enrolled and randomly divided into the training cohort (n = 105) and validation cohort (n = 26), with a ratio of 4:1.
RT protocol
Patients underwent CT simulation in the supine position and were immobilized with an alpha cradle. Planning CT images with a slice thickness of 3 mm were acquired through the entire upper abdomen. Contrast-enhanced CT was used to localize the PVTT along with the primary tumor and to assess the enhancement patterns of lesions. The gross tumor volume (GTV) was delineated using the diagnostic and simulation images of the PVTT with or without the primary liver tumor. The CTV was determined by expanding the GTV margin by 5–10 mm to consider areas at significant risk of microscopic disease. The planning target volume (PTV) was generated by adding a 5–10–mm margin to the CTV in all directions for a setup error. RT was delivered using either three-dimensional conformal radiotherapy or intensity-modulated radiation therapy (IMRT) based on physician preference. The treatment plans were designed using 6- or 10-MV photons. All patients were treated with linear accelerators. Dosimetric parameters such as the dose of the CTV and normal organs were extracted from RT planning systems (Eclipse Treatment Planning System; Varian Medical Systems Inc., Palo Alto, CA, USA). The prescribed dose was 45, 50, or 60 Gy delivered in 1.8–2 Gy per fraction (BED10: 53.1–72.0 Gy). The goals were to deliver the prescribed dose to ≥95% of the PTV and 95% of the prescribed dose to ≥99% of the PTV. The dosimetric parameters were recorded for evaluation. After RT, abdominal CT or MRI was performed for response assessment. Most patients underwent abdominal CT or MRI 1 month after RT. The patency status of the portal vein area was evaluated by experienced radiologists.
Acquisition of CT images
Contrast-enhanced CT was performed using Philips MRC 800 (Philips Medical Systems, Amsterdam, Netherlands) with a peak tube voltage of 120 kVp, tube current of 325 mA, rotation time of 0.75 s, matrix of 512 × 512, field of view of 50 cm, and slice thickness of 3 mm for RT planning and radiomics analysis.
Texture analysis
The CTV, the region of interest (ROI), was contoured by experienced radiation oncologists on all axial CT images. Segmentation was performed using the Eclipse system. Three-dimension ROI was visualized using Local Image Features Extraction (LIFEx) version 5.10 (http://www.lifexsoft.org; Orsay, France) (47). The LIFEx software was used to extract the textural features of the ROI. A total of 48 textural features of the images were extracted, including features of a histogram-based matrix, gray-level co-occurrence matrix (GLCM), gray-level run length matrix (GLRLM), neighborhood gray-level dependence matrix (NGLDM), and gray-level zone length matrix (GLZLM) (Figure 1).
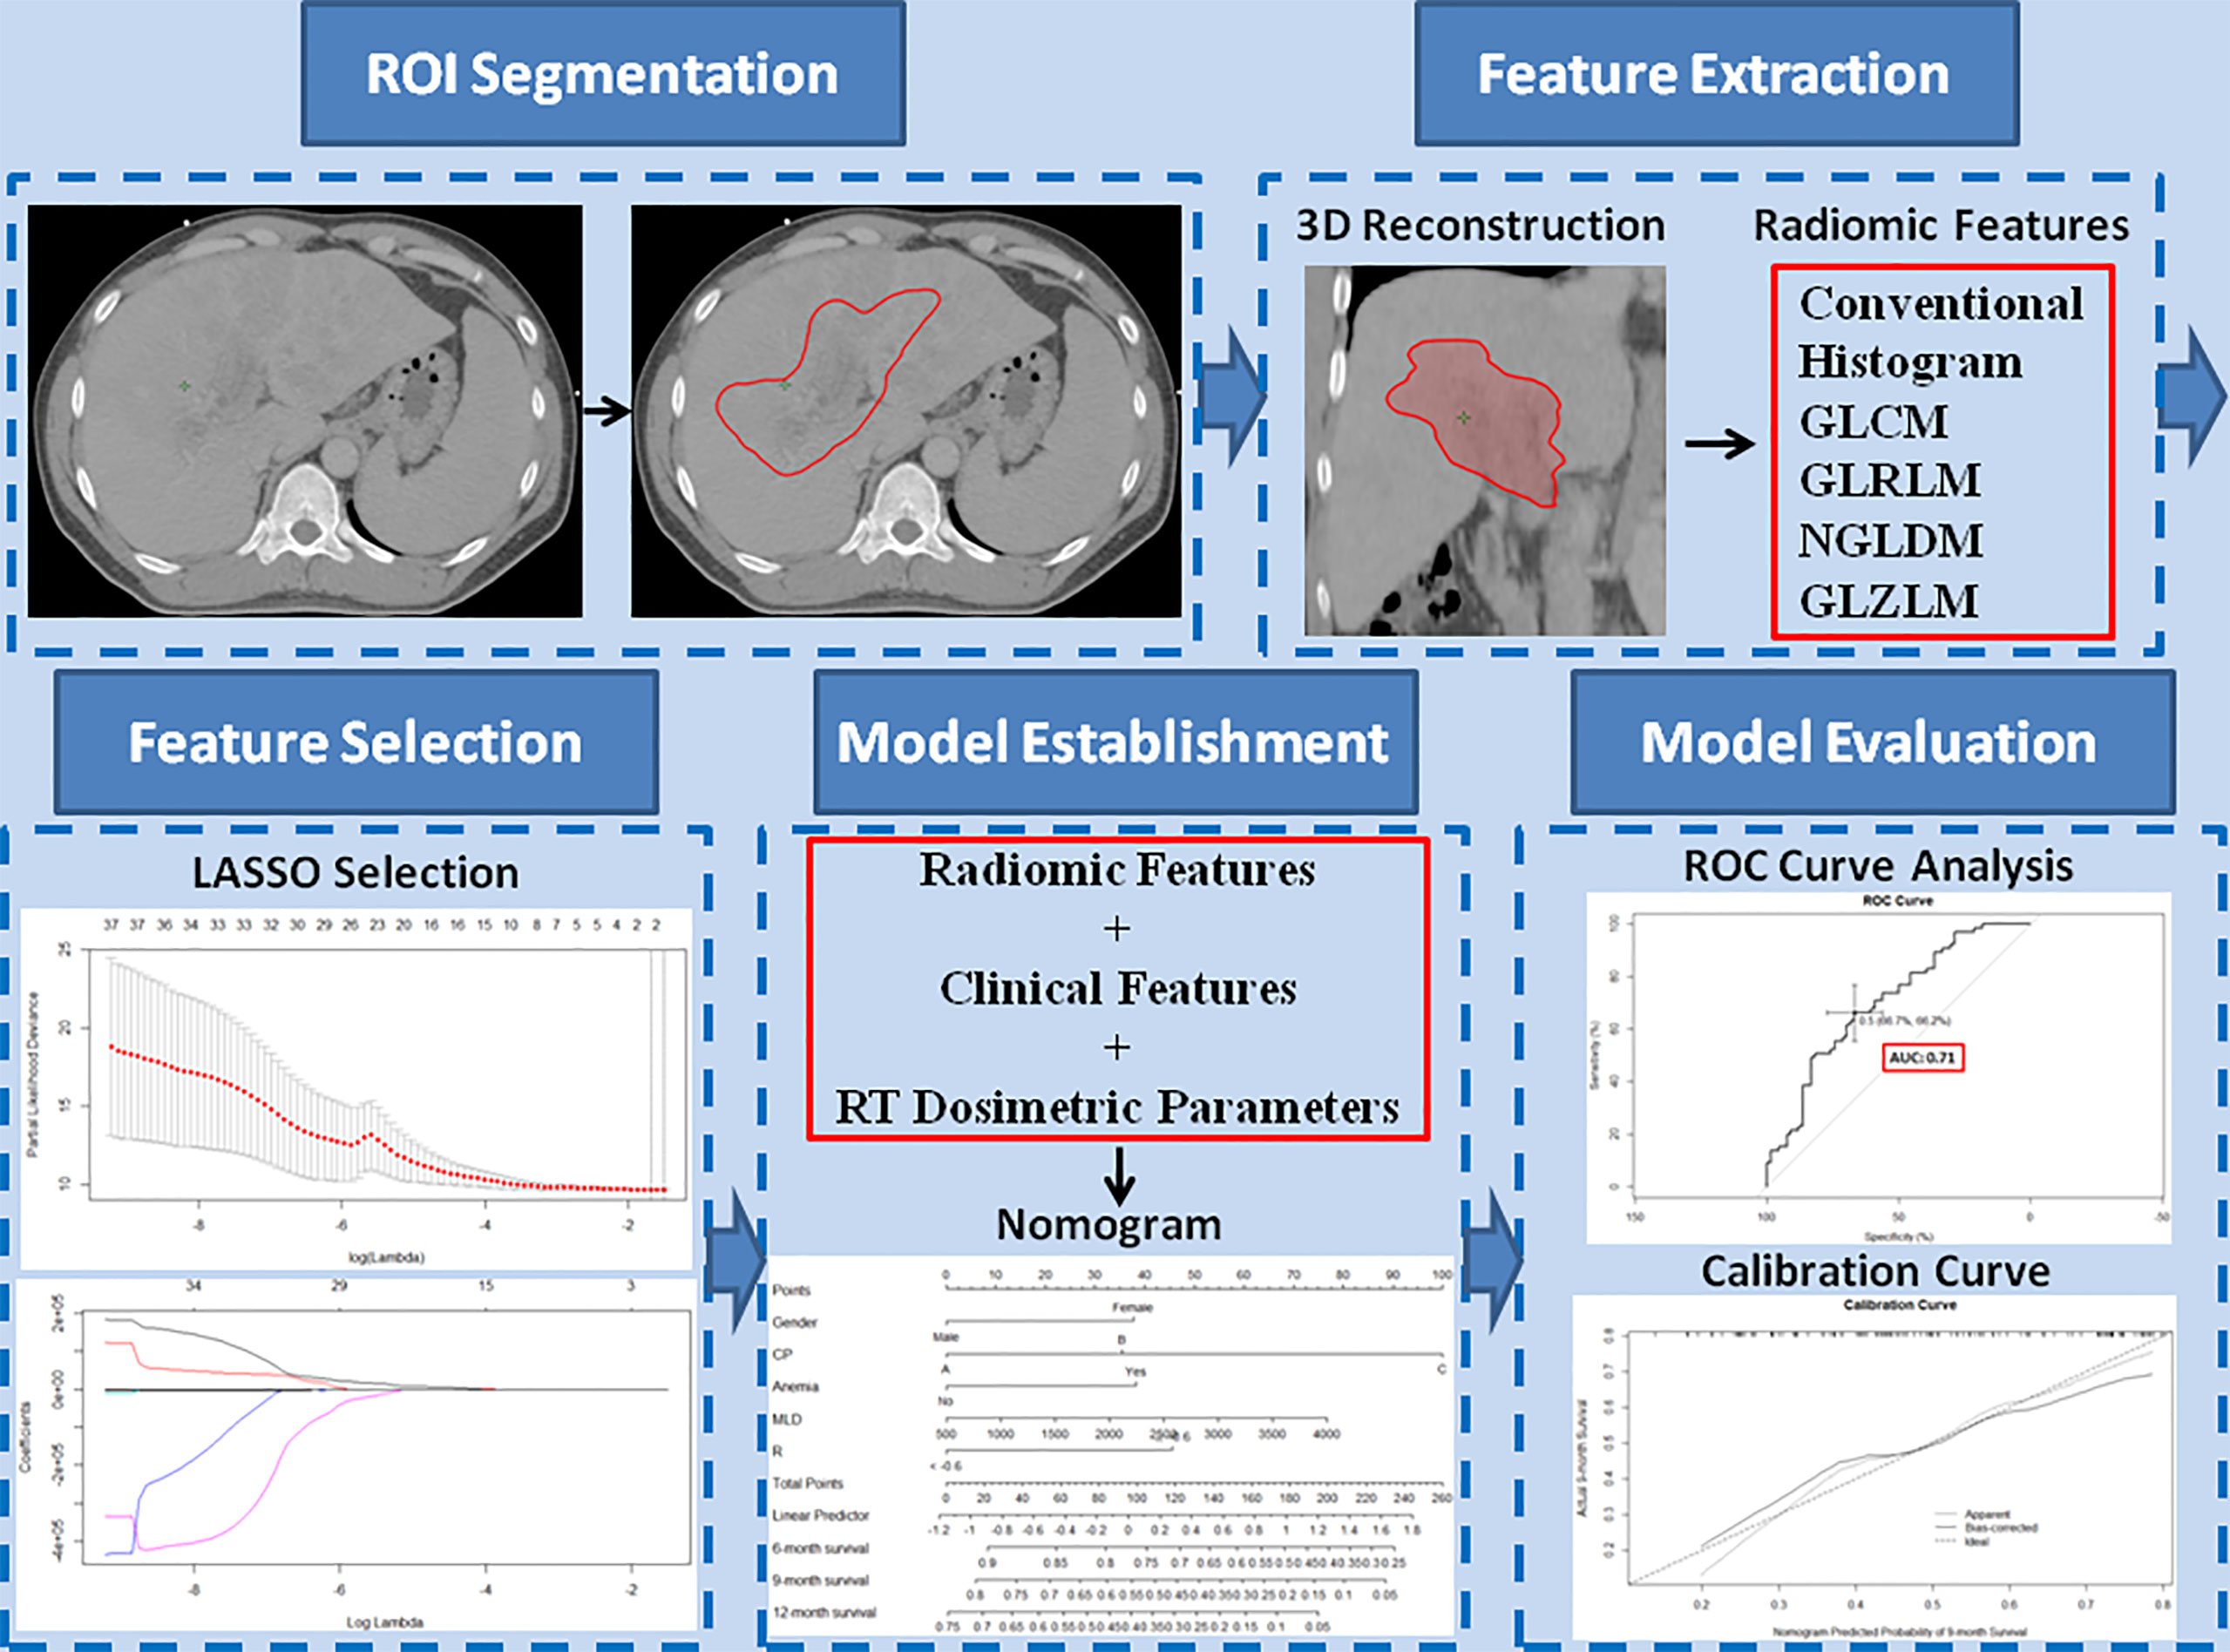
Figure 1 Study workflow. The region of interest (ROI) was segmented on all transverse contrast-enhanced computed tomography images by experienced radiation oncologists using the Eclipse system. After a three-dimensional reconstruction of the ROI, 48 textural features, including conventional features, histogram features, gray-level co-occurrence matrix, gray-level run-length matrix, neighborhood gray-level dependence matrix, and gray-level zone length matrix, were extracted. The extracted features were selected by least absolute shrinkage and selection operator regression. Based on the selected radiomics features, clinical features, and radiation therapy dosimetric parameters, a nomogram model was established to predict overall survival. The performance of the predictive model was evaluated with concordance index, area under the curve of the receiver operating characteristic curve, and calibration curve.
Extraction of radiomics features
The study population was divided into the training and validation cohorts in a ratio of 4:1 using the sample function of R (version 3.6.1) software (https://www.r-project.org; Vienna, Austria) to make randomization. The least absolute shrinkage and selection operator (LASSO) Cox regression was performed to determine the radiomics features that can predict OS in the training cohort. We performed the 10-fold cross-validation 20 times. The final value of lambda (penalized parameter) was determined with the minimized mean deviance and the corresponding subset of covariates with non-zero coefficients. Features were selected by the total times of non-zero coefficient in 20 randomized 10-fold cross-validations. The Cox proportional-hazard model was fitted with the selected features, and the radiomics score (rad-score) predicting OS could be calculated linearly.
Clinical feature extraction
The following 17 clinical features were selected: age, gender, etiology of viral hepatitis, drinking history, ECOG performance status, Child-Pugh class, tumor size, anemia status, serum levels of alpha-fetoprotein (AFP), white blood cell, platelet, albumin, alanine aminotransferase, aspartate aminotransferase (AST), total bilirubin, creatinine, and prothrombin time.
RT dosimetric parameters
The prescribed RT doses, RT fields as involved PVTT with or without primary liver tumors, CTV, normal liver volume (NLV), and mean liver doses (MLDs) of all patients were recorded (Figure 2).
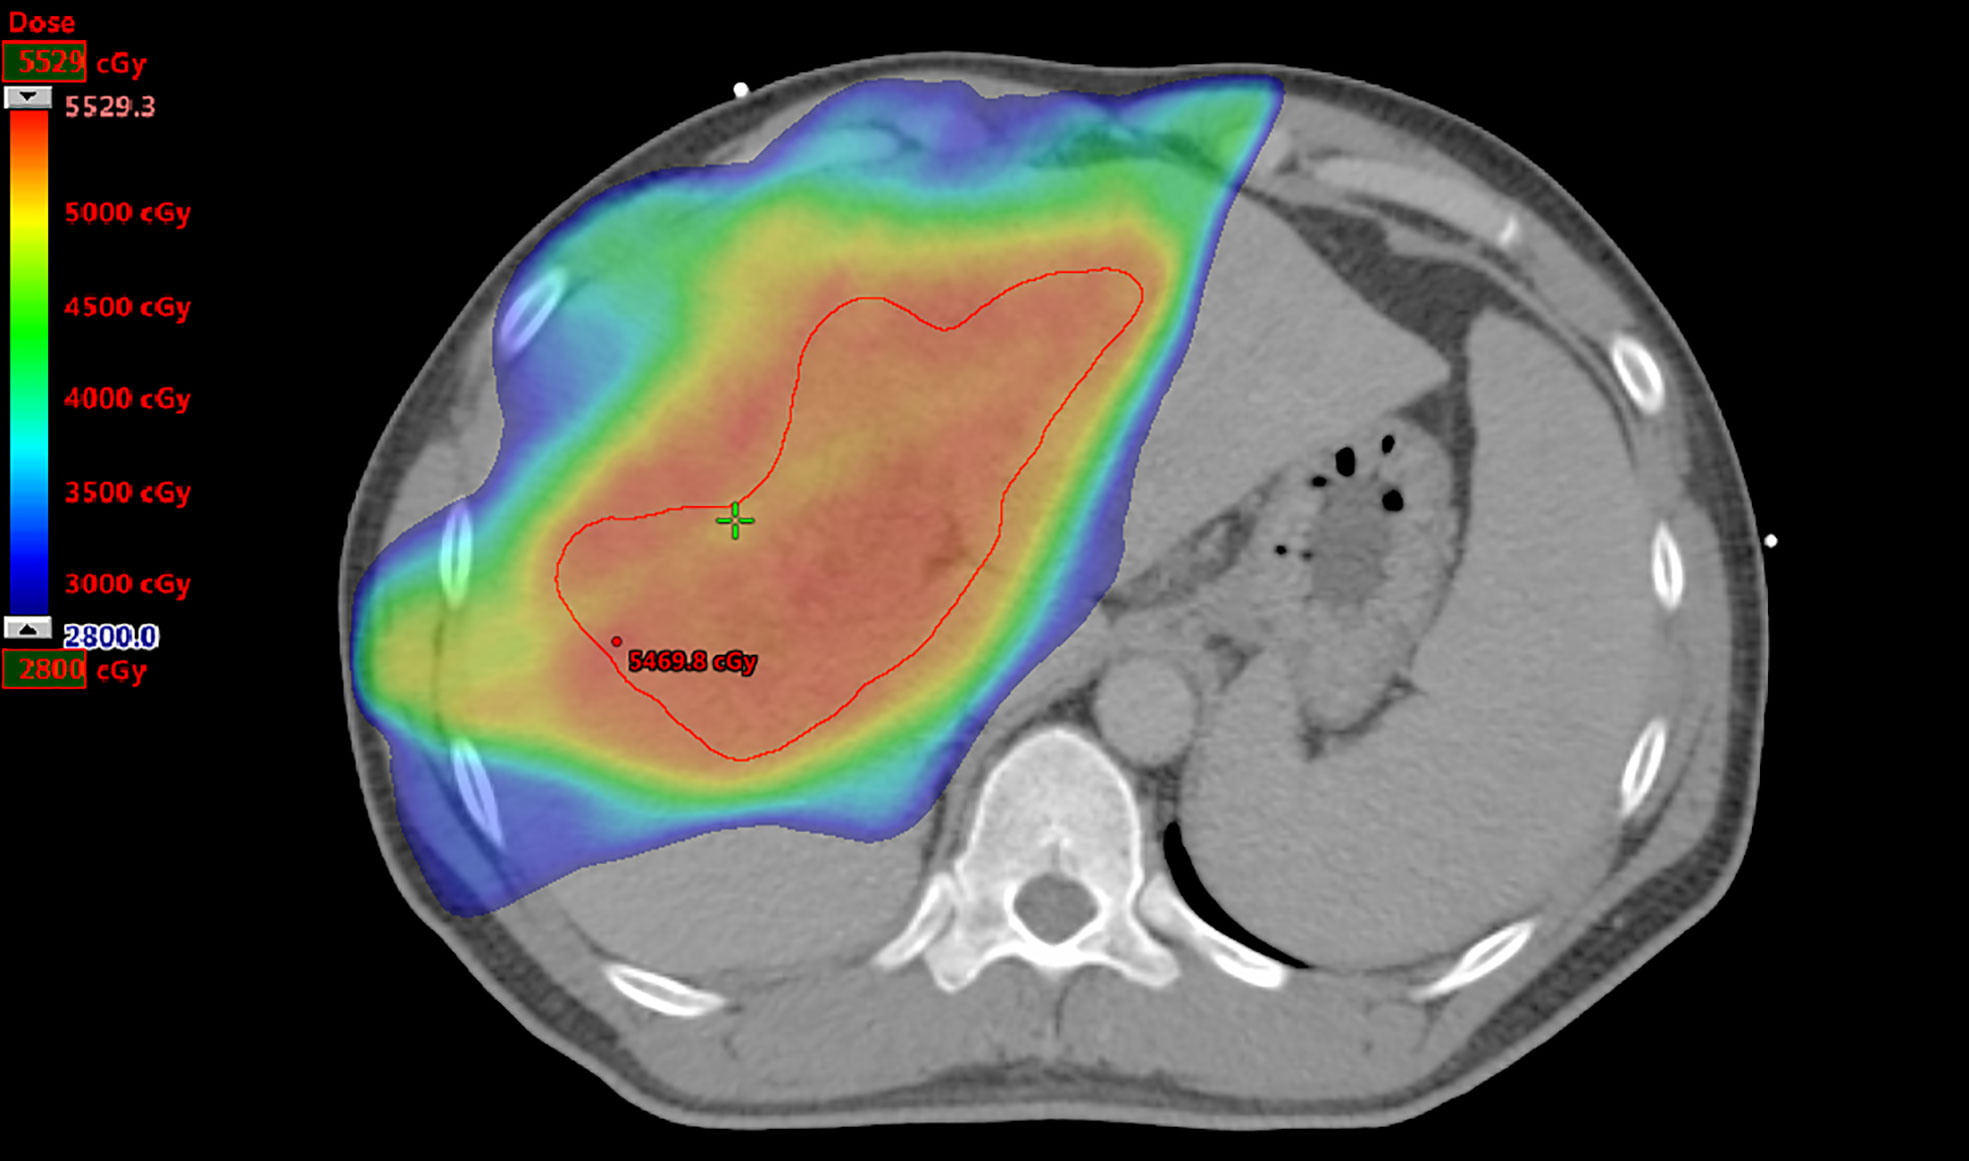
Figure 2 Radiation therapy plan for a patient. The prescribed dose to treat portal vein tumor thrombosis only is 50 Gy. The clinical target volume as the region of interest is contoured in red, and the volume is 280.7 cm3. The normal liver volume is 1,769.0 cm3, and the mean liver dose is 2,189.4 cGy.
Statistical analysis
Statistical analysis was performed using R (version 3.6.1) and SPSS version 24.0 (IBM Corporation, Armonk, NY, USA). Numerical data are presented as mean ± standard deviation. LASSO regression analysis was performed using the “glmnet” package to select the radiomics features for rad-score to predict OS. The optimal cutoff value of the rad-score was determined using X-tile software (Yale University, New Haven, CT, USA). The survival curves were plotted using the Kaplan–Meier method and assessed using the log-rank test. The Chi-square test was used to assess categorical variables, and the Mann–Whitney U test was used to assess continuous variables. Univariate Cox regression analysis was performed to determine the predictors of OS from rad-score, clinical features, and RT dosimetric parameters. Thereafter, multivariate Cox regression analysis was used to select prognostic factors for the establishment of predictive nomogram models. The “survival” and “rms” packages were used for survival analysis, nomogram model construction, Harrell’s concordance index (C-index) calculation, and calibration curve. The C-index was a measure of goodness-of-fit for outcomes in a regression model, ranging from 0.5 to 1. A C-index value of 0.5 indicated that the predictive ability of the model was no better than a random chance, whereas C-index values of >0.7 and >0.8 indicated that the model was good and strong, respectively. A value of 1 implied that the model perfectly predicted the outcome. The “survivalROC” package was used for calculation and comparison of the area under the curve (AUC) of the receiver operating characteristic (ROC) curve for evaluation of the nomogram. The AUC ranged from 0.5 to 1. The discrimination potent of the model based on the value of AUC was as follows: 0.5, no discrimination potent; 0.7–0.8, acceptable; 0.8–0.9, excellent; and >0.9, outstanding. Differences were considered significant at p < 0.05.
Establishment of predictive models
Based on the results of multivariate Cox regression analysis, the nomogram models with significant clinical features, RT dosimetric parameters, and/or rad-score were constructed to predict OS in HCC patients treated with RT for PVTT. The confirmation of nomograms was subjected to a 1,000 resampling bootstrap analysis for validation. The predictive models were evaluated with C-indexes, AUC of ROC curves, and calibration curves (Figure 1).
Ethical statement
This study was approved by the Institutional Review Board of our institution (IRB number: 20MMHIS215e).
Results
Patient characteristics
A summary of the baseline characteristics of the 131 patients is presented in Table 1. The median age at diagnosis was 61 years (range: 36–87 years), and 108 (82.4%) of the patients were men. A total of 110 (84.0%) patients had hepatitis B/C virus infection, and 93 (71.0%) patients had a drinking history. In this study, 83, 44, and 4 patients had Child–Pugh classes A, B, and C, respectively. The pre-RT tumor size was 9.5 ± 5.2 cm. Before RT, 59 (45.0%) patients had anemia, and the median serum AFP level was 149.3 ng/ml (range: 1.2–515,800.0 ng/ml). The baseline characteristics of the training and validation cohorts are summarized in Table 2. No significant differences were found in the baseline characteristics of the two cohorts.
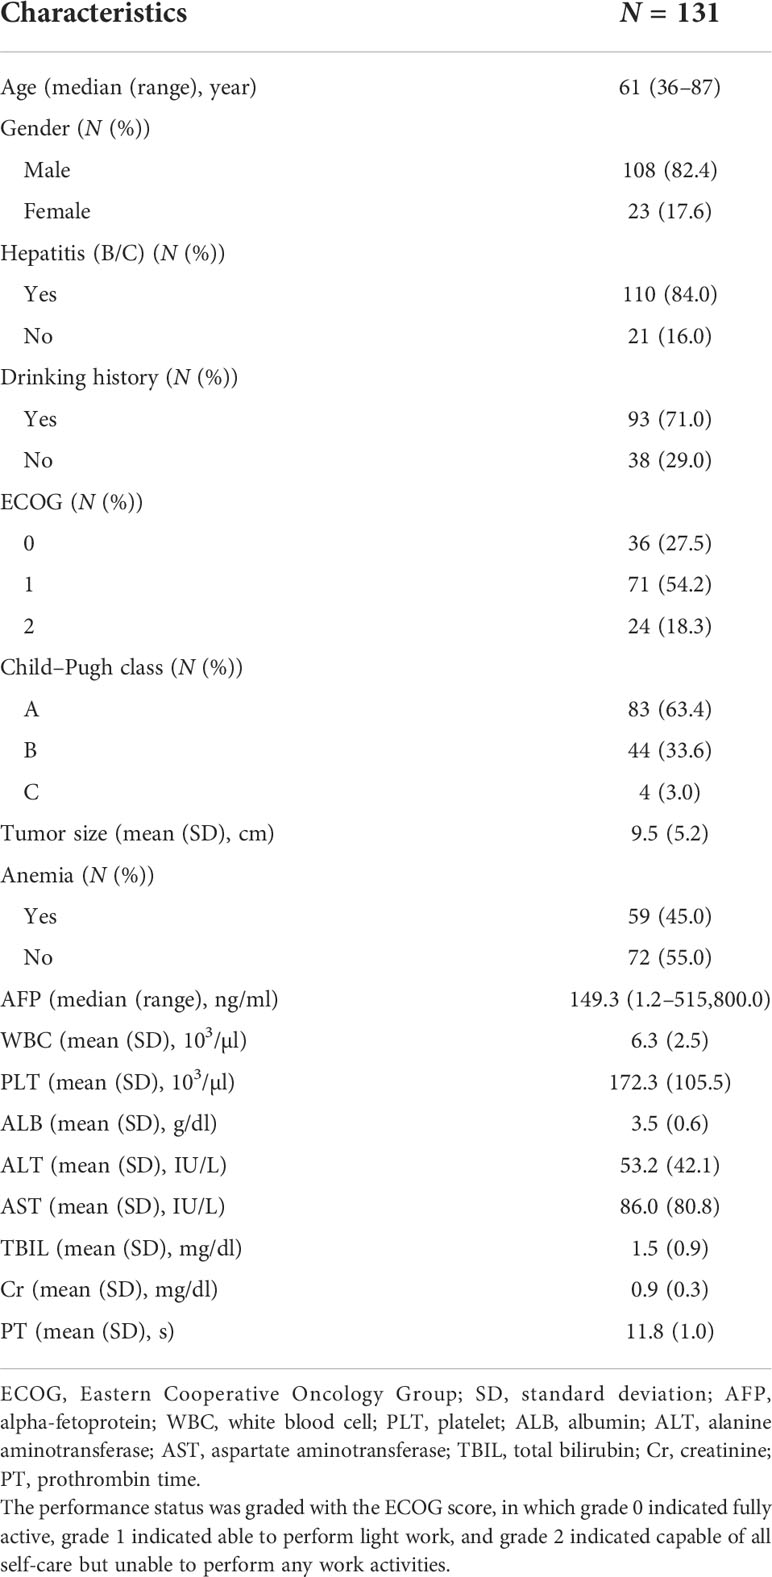
Table 1 Baseline characteristics of all patients.
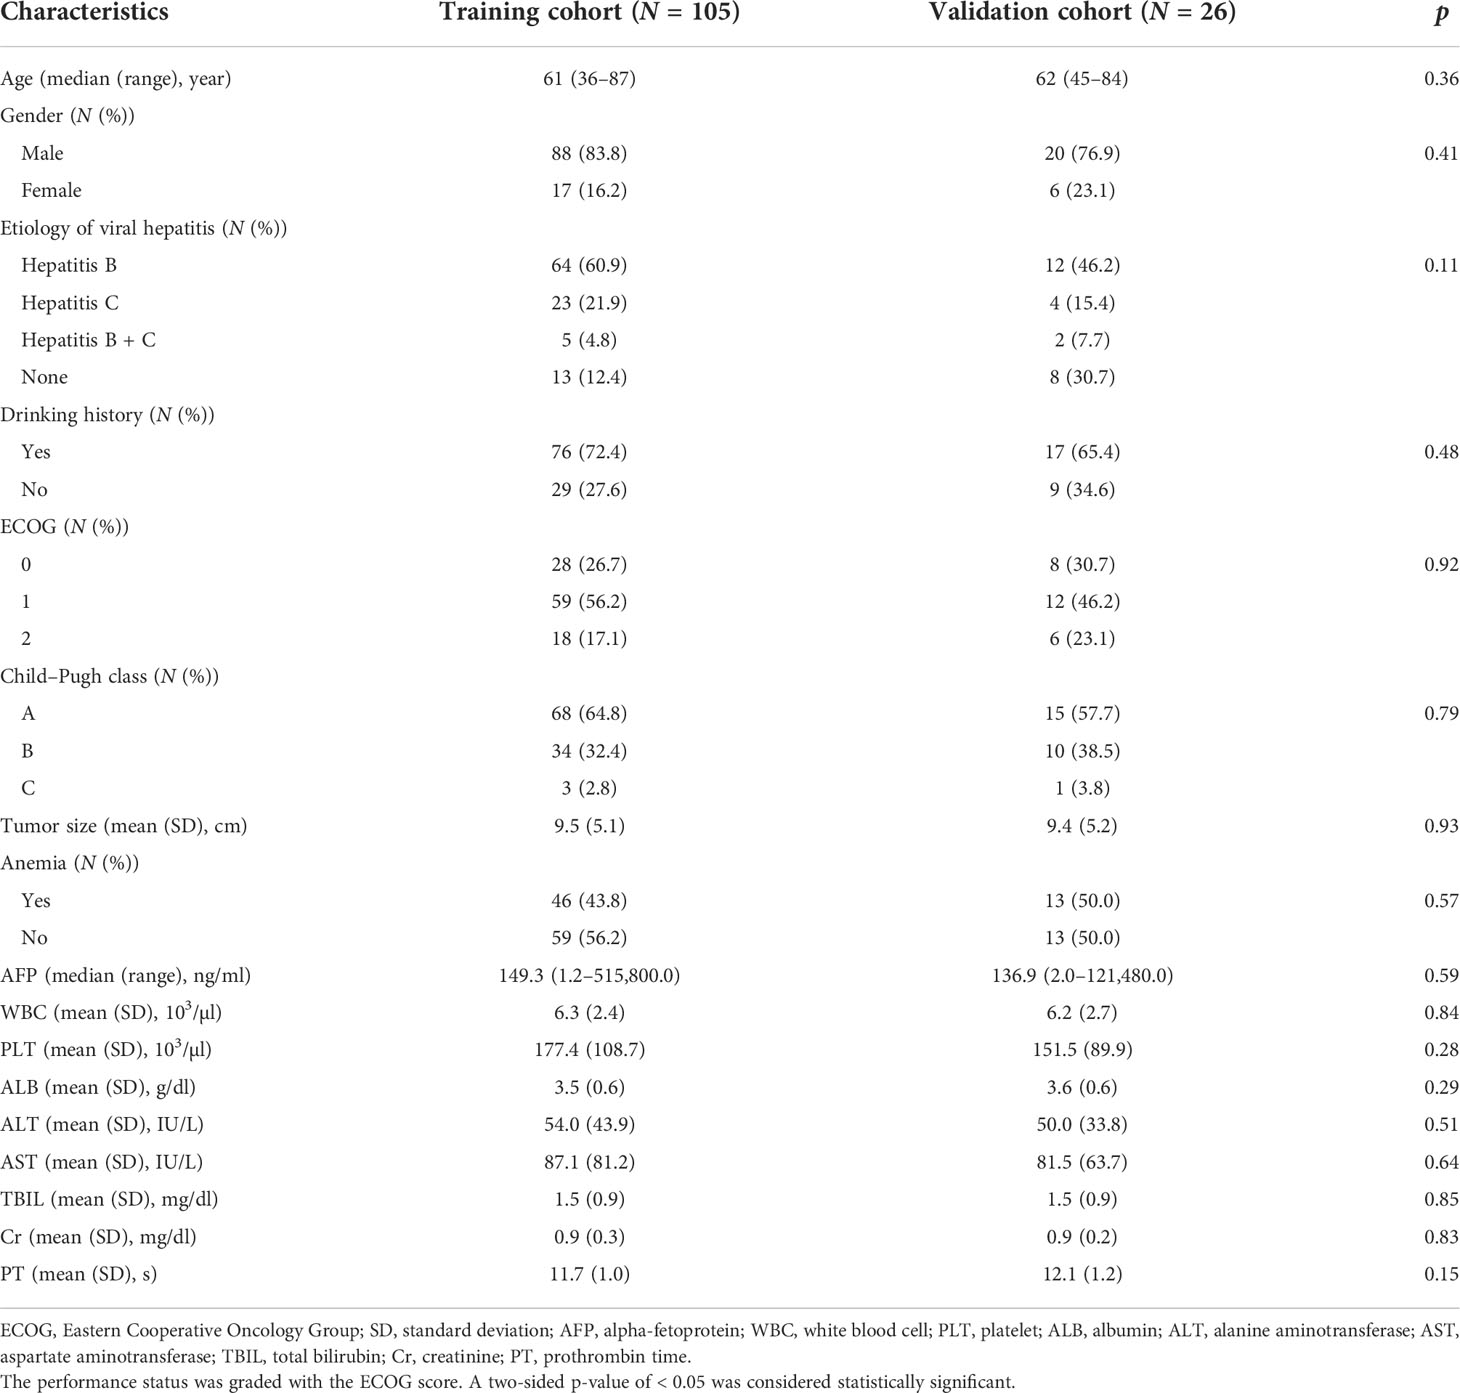
Table 2 Baseline characteristics of the training and validation cohorts.
RT dosimetric parameters
The RT dosimetric parameters for 131 patients are presented in Table 3. A total of 25, 101, and 5 patients were treated with an RT dose of 45, 50, and 60 Gy, respectively. The RT field in 88 (67.2%) patients involved PVTT only and that in 43 (32.8%) patients involved PVTT and primary liver tumors. The median CTV was 164.6 cm3 (range: 19.5–2,189.0 cm3). The NLV was 1,140.7 ± 480.8 cm3, and the MLD was 1891.3 ± 651.5 cGy. The RT dosimetric parameters for the training and validation cohorts are summarized in Table 4. No significant differences were found between the two cohorts for RT dosimetric parameters.
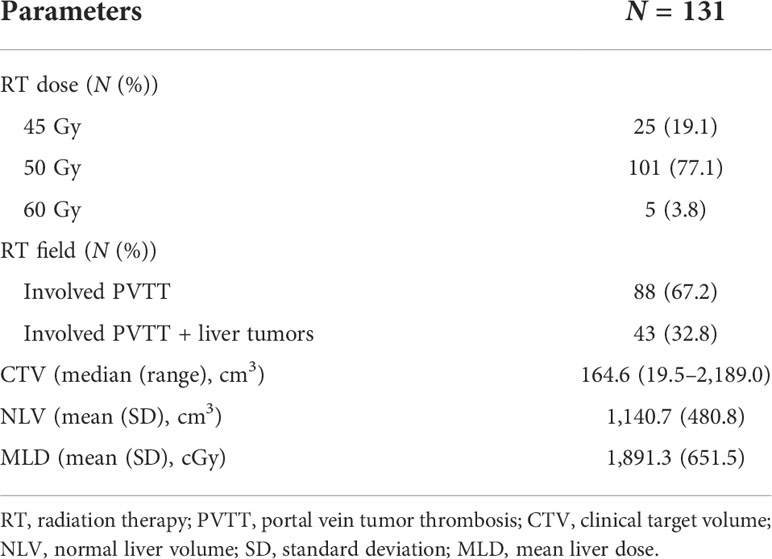
Table 3 RT dosimetric parameters of all patients.
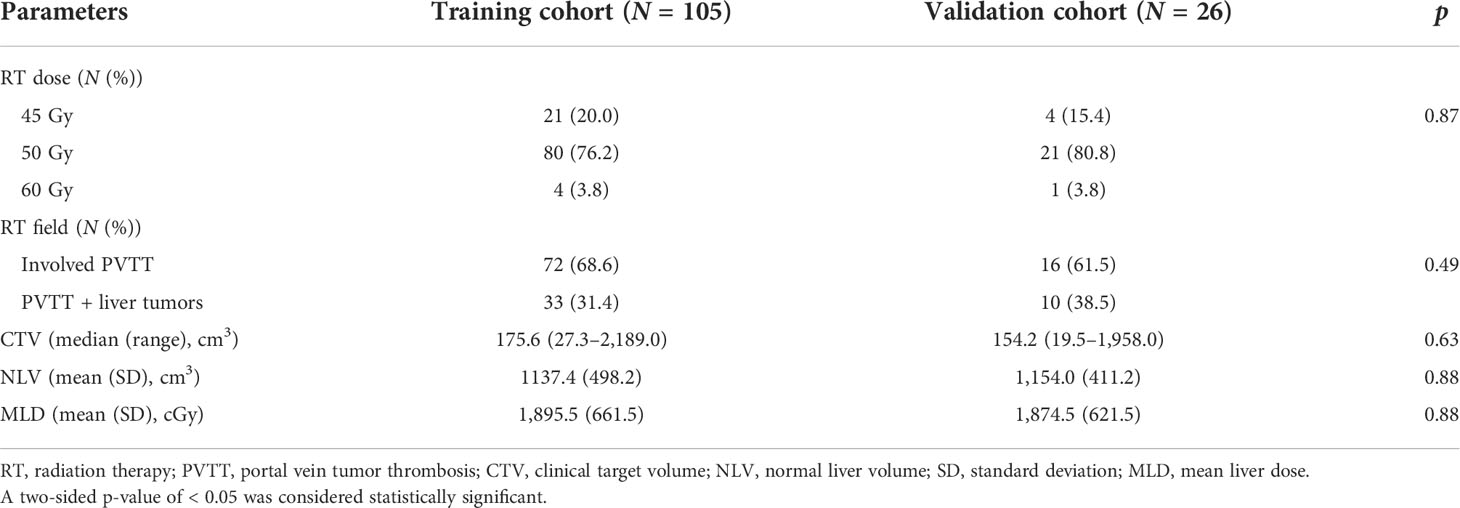
Table 4 RT dosimetric parameters of the training and validation cohorts.
Treatment outcome
The treatment outcomes of the patients are presented in Table 5. The median follow-up time was 9.8 months (range, 1.6–57.9 months), and 101 (77.1%) patients underwent abdominal CT or MRI images for response assessment. Three (2.3%) patients were alive at the time of the current analysis. Sixteen (15.8%) patients had patent portal veins after RT. The median OS was 9.8 months (95% CI, 8.0–11.6 months), and the median progression-free survival (PFS) was 5.6 months (95% CI, 4.8–6.4 months). Distant metastases were found in 22 (16.8%) patients. The treatment outcomes of the training and validation cohorts are summarized in Table 6. No significant differences in treatment outcomes were found between the two cohorts.
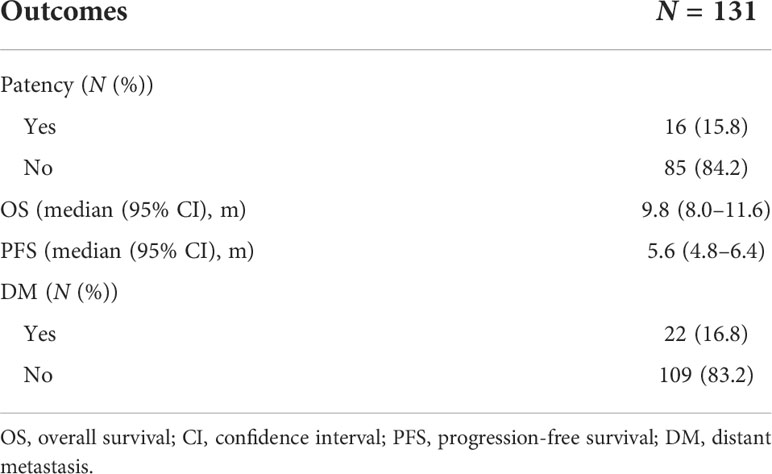
Table 5 Treatment outcomes of all patients.
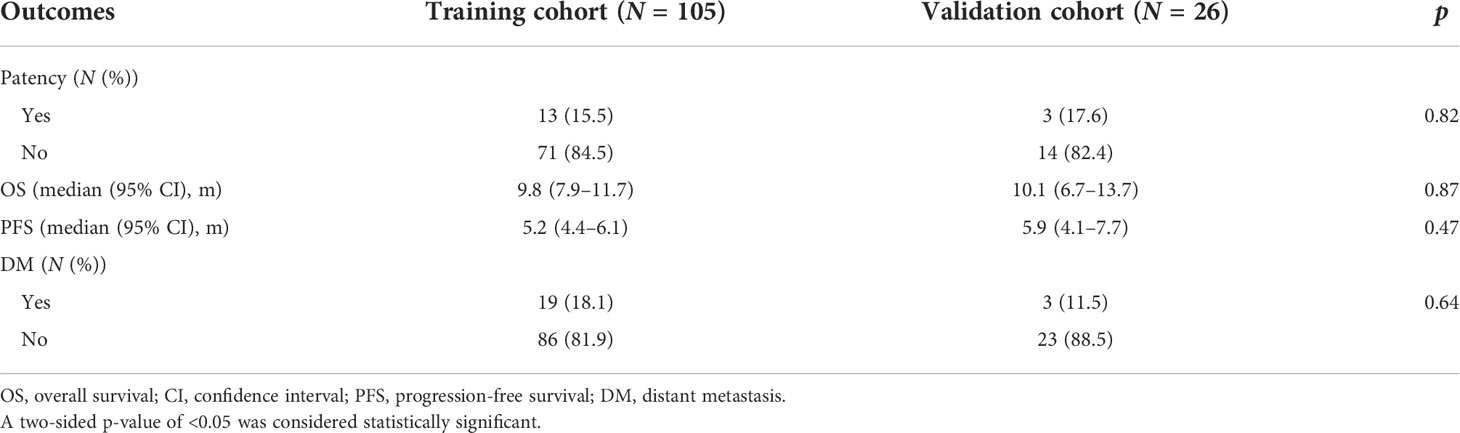
Table 6 Treatment outcomes of the training and validation cohorts.
Radiomics feature extraction and development of the rad-score
A total of 48 radiomics features were extracted from the imaging data of all patients. Two features were selected by LASSO Cox regression analysis to predict the OS in the training cohort (Figure 3). The rad-score formula was GLRLM_HGRE × −2.973897e−05 + GLRLM_SRHGE × −2.504878e−05.
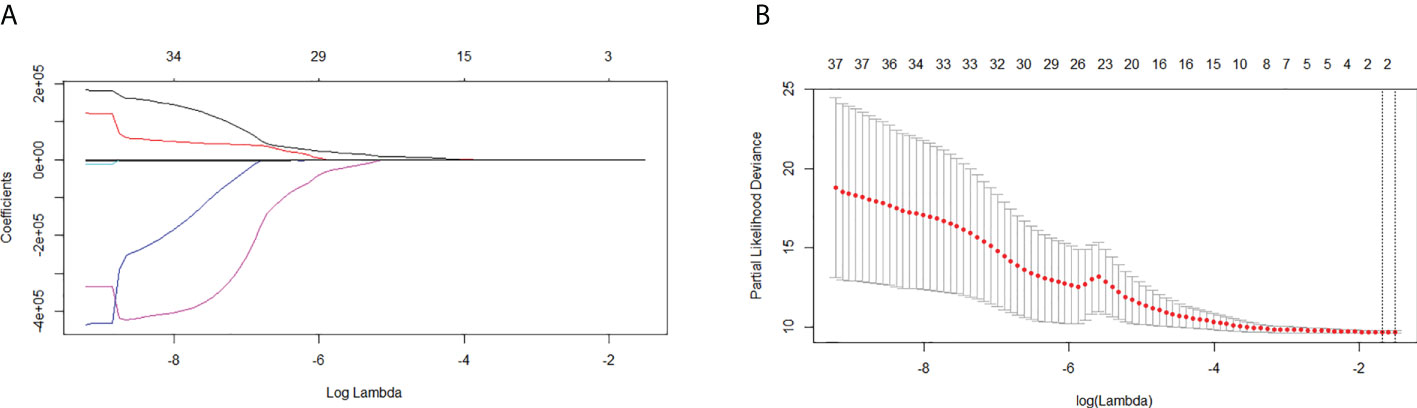
Figure 3 Least absolute shrinkage and selection operator (LASSO) regression analysis for the selection of significant radiomics features from the 48 textural features. (A) Coefficient profile of the LASSO model. (B) Optimal tuning parameter (lambda) selection using 10-fold cross-validation with minimum criteria. Two significant radiomics features were extracted.
Rad-score and correlation with OS
The optimal cutoff value of the rad-score, as determined by X-tile software, was −0.6. The patients were divided into the high- (≧−0.6) and low-risk (<−0.6) groups based on the cutoff value of the rad-score. The median OS rates in the high- and low-risk groups were 7.4 months (95% CI, 6.5–10.7) and 12.4 months (95% CI, 10.0–16.8), respectively (p = 0.007). Considering the training cohort, the median OS rates in the high- and low-risk groups were 7.5 months (95% CI, 6.5–11.2) and 11.8 months (95% CI, 9.6–16.8), respectively (p = 0.038). In the validation cohort, the median OS rates in the high- and low-risk groups were 6.8 months (95% CI, 4.3–NA) and 12.6 months (95% CI, 10.7–NA), respectively (p = 0.033). The median OS rates were significantly lower in the high-risk groups than in the low-risk groups in both the training and validation cohorts (Figure 4).
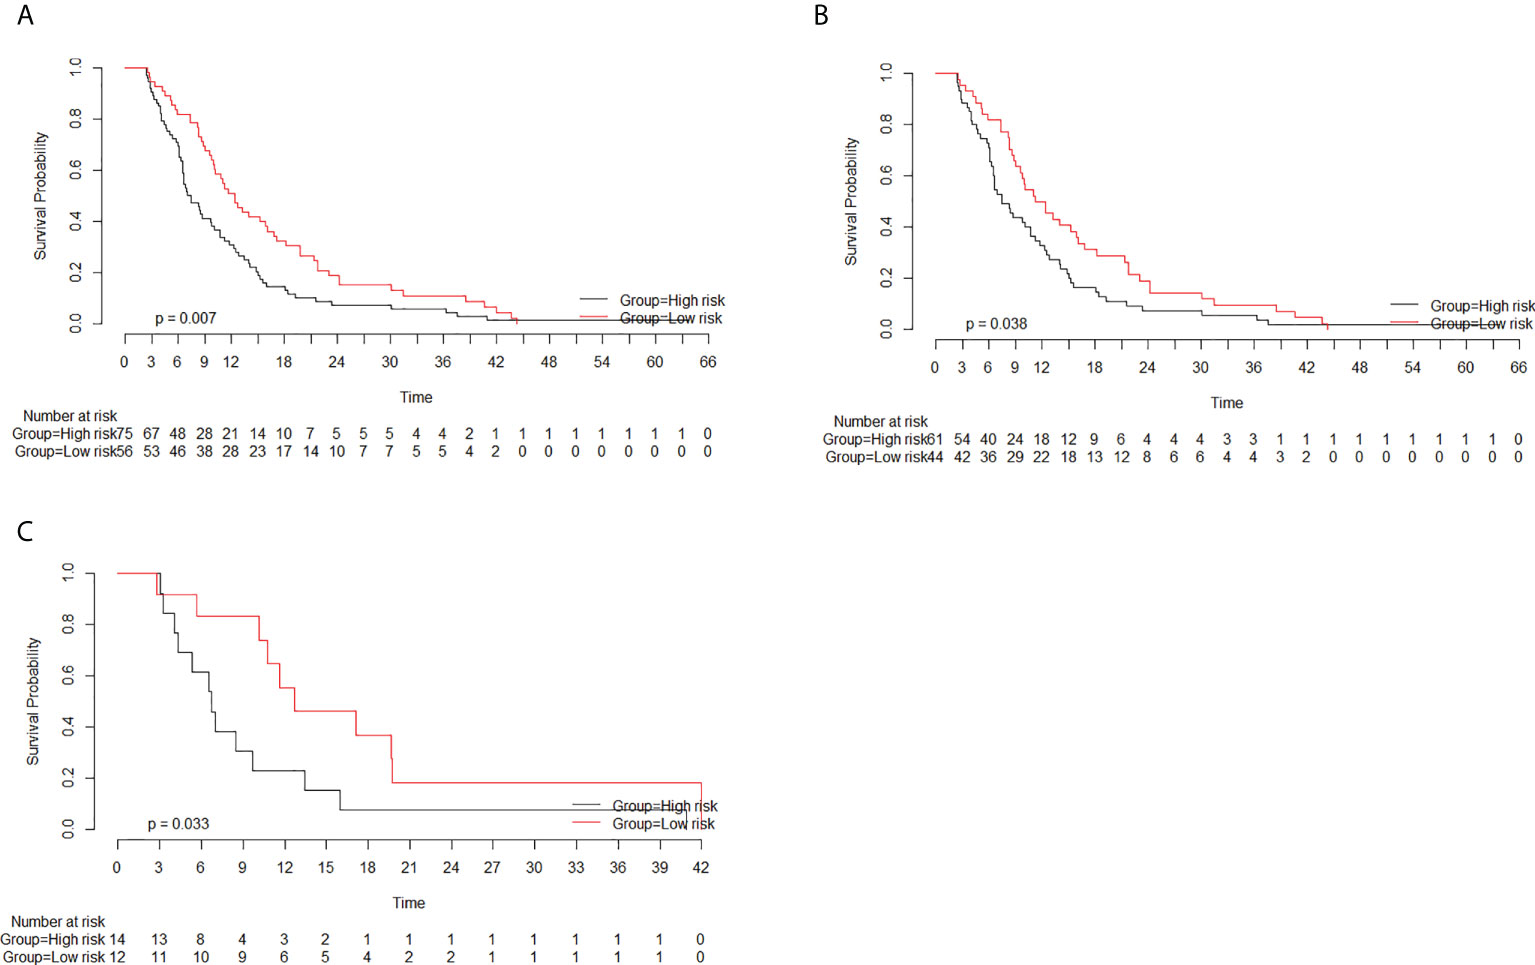
Figure 4 Survival curves of the high- and low-risk groups based on the radiomics score (rad-score) classification. The rad-scores in the high- and low-risk groups were more than −0.6 and less than −0.6, respectively. (A) Considering all patients, the median overall survival (OS) rates in the high- and low-risk groups were 7.4 months (95% CI, 6.5–10.7) and 12.4 months (95% CI, 10.0–16.8), respectively (p = 0.007). (B) Considering the training cohort, the median OS rates in the high- and low-risk groups were 7.5 months (95% CI, 6.5–11.2) and 11.8 months (95% CI, 9.6–16.8), respectively (p = 0.038). (C) Considering the validation cohort, the median OS rates in the high- and low-risk groups were 6.8 months (95% CI, 4.3–NA) and 12.6 months (95% CI, 10.7–NA), respectively (p = 0.033).
Extraction of significant features
Univariate and multivariate Cox regression analyses were performed to determine the predictors of OS from rad-score, clinical features, and RT dosimetric parameters. Univariate analysis revealed seven predictors, namely gender, Child–Pugh class, anemia status, rad-score, MLD, tumor size, and AST, for OS prediction. Gender, Child–Pugh class, anemia status, rad-score, and MLD were found to be independent predictors in multivariate analysis (Table 7).
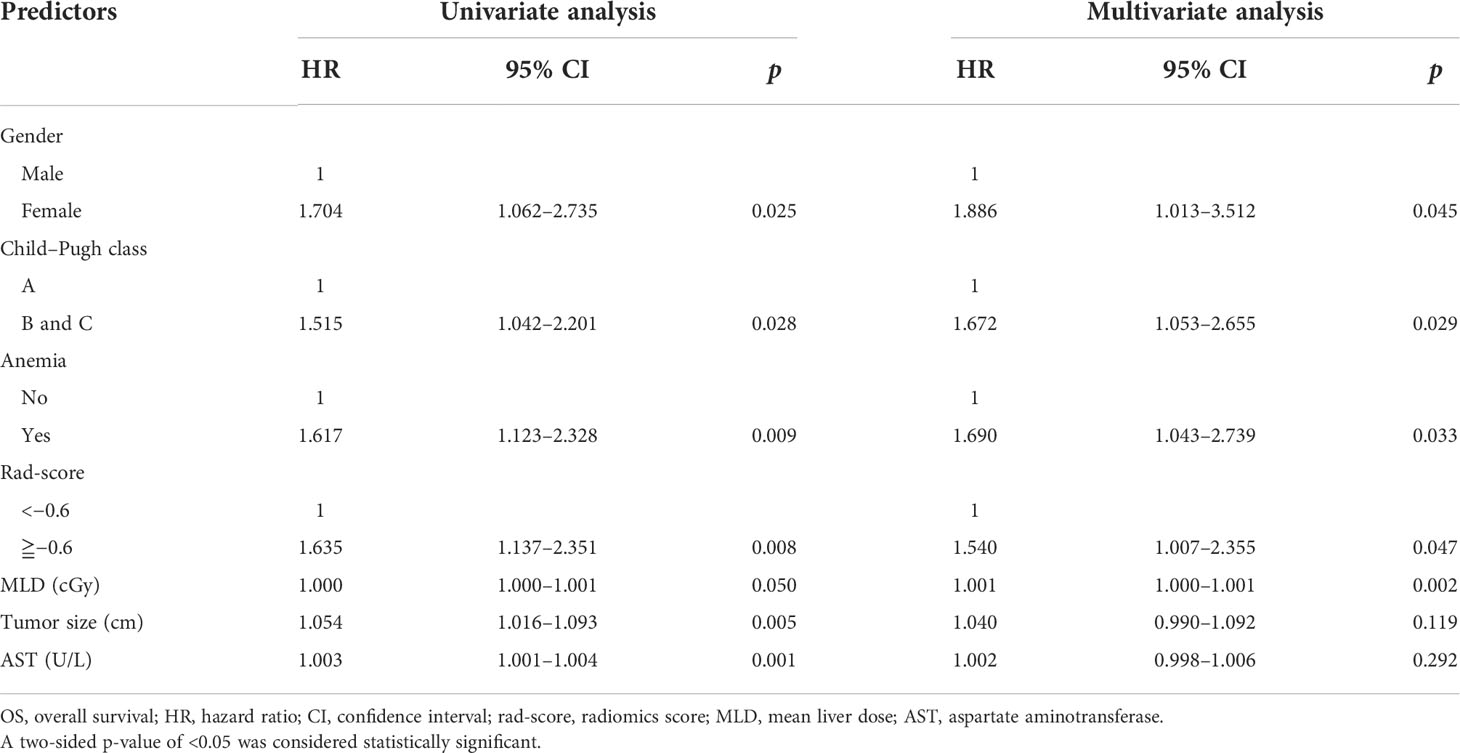
Table 7 Univariate and multivariate analyses for predictors of OS.
Establishment of the predictive model
Based on the result of multivariate Cox regression analysis, a radiomics-based nomogram with significant clinical features, RT dosimetric parameters, and rad-score was developed to predict OS. A clinical nomogram with selected clinical features and RT dosimetric parameters was developed for OS prediction (Figure 5).
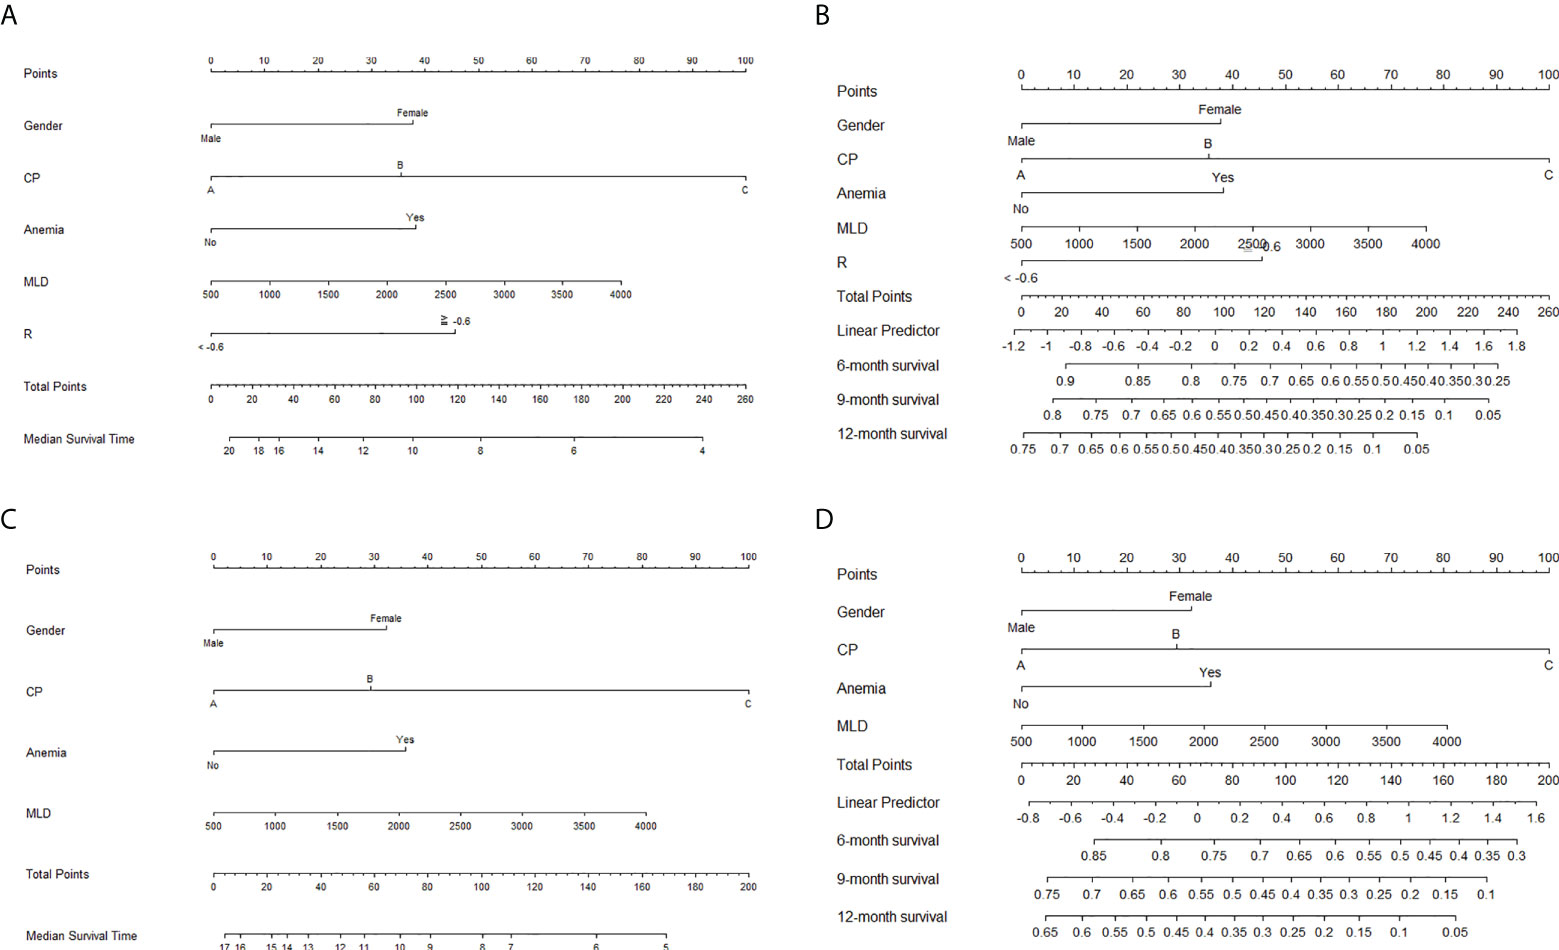
Figure 5 Nomograms for the prediction of overall survival. Nomograms with radiomics score, significant clinical features, and radiation therapy (RT) dosimetric parameters for the prediction of (A) median survival time and (B) 6-, 9-, and 12-month survival rates. Nomograms with selected clinical features and RT dosimetric parameters for the prediction of (C) median survival time and (D) 6-, 9-, and 12-month survival rates.
Performances of different predictive nomograms and significant features
C-indexes were used to evaluate the discrimination power of significant features, clinical nomogram, and radiomics-based nomogram. The C-index profiles are presented in Table 8. In this study, the radiomics-based nomogram showed the best discrimination power, which was examined by internal validation. ROC analyses for 9-month survival, the AUCs for the radiomics-based nomogram and clinical nomogram were 0.71 (95% CI, 0.63–0.79) and 0.61 (95% CI, 0.51–0.71), respectively (Figure 6). The calibration curves of the radiomics-based nomogram and clinical nomogram are presented in Figure 7. The radiomics-based nomogram exhibited better predictive accuracy than the clinical nomogram for the prediction of 9-month survival.

Table 8 C-indexes of significant features, clinical nomogram, and radiomics-based nomogram.
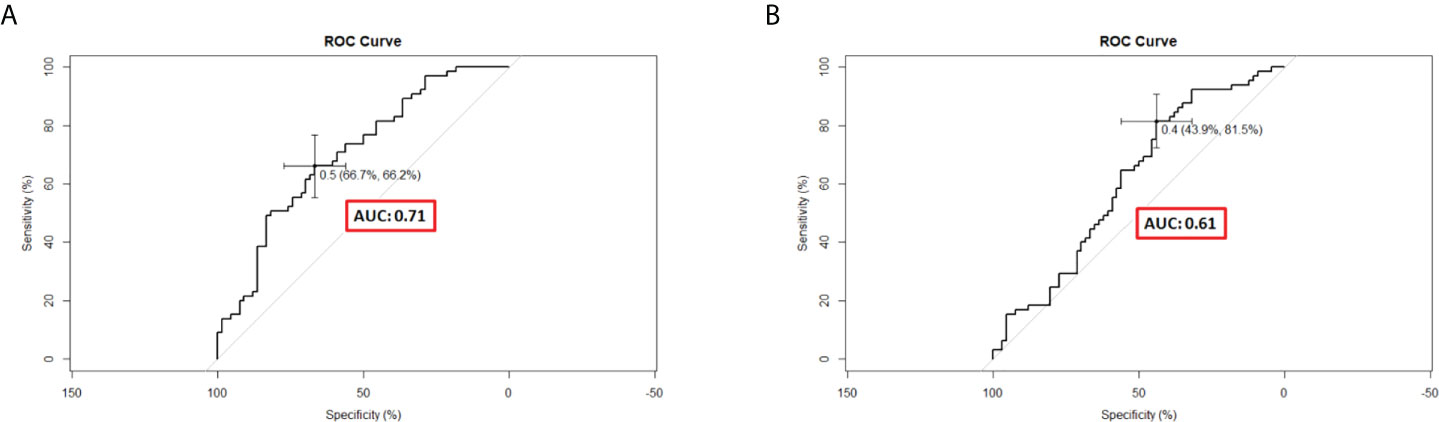
Figure 6 Receiver operating characteristic curves of different predictive nomograms for 9-month survival. (A) The area under the curve (AUC) was 0.71 (95% CI, 0.62–0.79) in the radiomics-based nomogram. (B) The AUC was 0.61 (95% CI, 0.51–0.71) in the clinical nomogram.
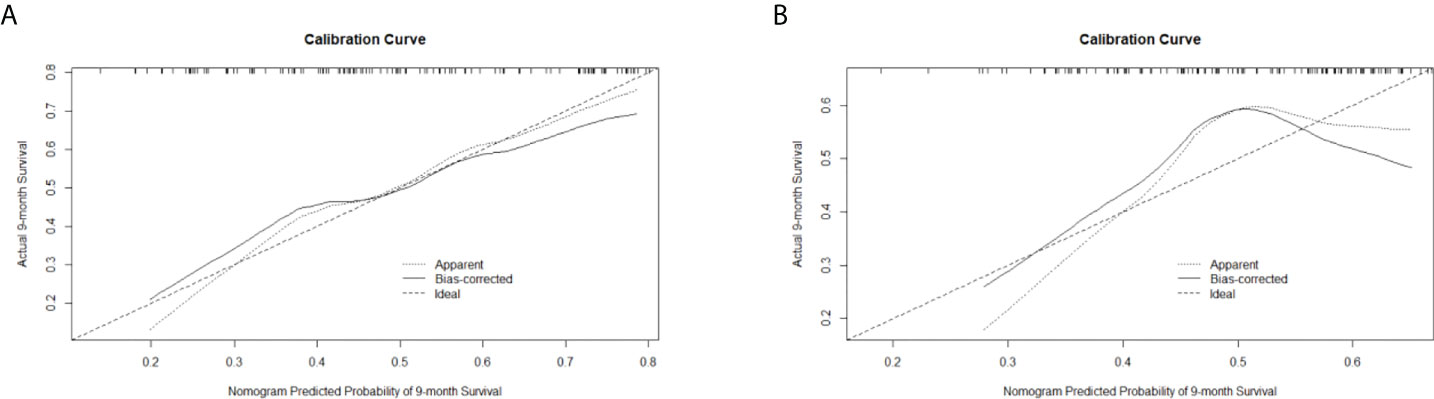
Figure 7 Calibration curves of (A) the radiomics-based nomogram and (B) clinical nomogram for the prediction of 9-month survival.
Discussion
In this study, we intended to develop a radiomics-based nomogram using pre-RT CT data. Univariate and multivariate analyses revealed that the rad-score significantly influenced OS. The performance of the radiomics-based nomogram was better than the clinical nomogram, and the predictive accuracy of each significant feature in the C-index and ROC analysis was examined by the calibration curve.
This study was conducted in the Department of Radiation Oncology in a medical center. All HCC patients were treated with the same RT protocol to ensure the standardization of the treatment and CT quality. CT was performed according to the American Association of Physicists in Medicine (AAPM) and American College of Radiology (ACR) guidelines (AAPM report #74 and #96 and ACR CT QC manual) and standard quality assurance measures.
Few studies have reported the application of radiomics and clinical features to predict treatment outcomes and prognosis in different types of cancers treated with RT. Hou et al. established an integrated model that combined posttreatment CT radiomics features and clinical features for response and OS prediction in esophageal cancer patients undergoing neoadjuvant chemoradiotherapy (48). Wu et al. developed a nomogram using radiomics and clinical features to predict OS in HCC patients treated with stereotactic body radiotherapy (SBRT) for PVTT (49). Parr et al. indicated that a radiomics-based predictive model combined with clinical features is better than an analysis of clinical features alone for predicting OS in pancreatic cancer patients treated with SBRT (50). Thus, radiomics combined with clinical features may have a better performance than analysis with clinical features alone for treatment response and OS prediction.
This study has several limitations. First, MRI is the preferred imaging modality for the evaluation of liver lesions. The technique of MRI-guided RT with MRI simulation and planning is rapidly developing (51). However, contrast-enhanced CT is still the main imaging methodology for diagnosis, staging, and RT planning for HCC, with acceptable sensitivity and high specificity. It is noninvasive, well-developed in current clinical practice, and not time-consuming or labor-consuming. Second, sorafenib has been used as the standard systemic treatment of advanced HCC during the investigation period of our study population. Currently, different agents such as lenvatinib, checkpoint inhibitors, and antivascular endothelial growth factor receptor antibodies have demonstrated efficacy in the treatment of advanced HCC. The effects of different systemic treatments should be examined in the future. Third, this study included 30 patients without CT or MRI follow-up data. Fourth, the small number of patients from a single institute could not draw a firm conclusion for application in other hospitals. In this retrospective review study, the standardization of CT simulation protocol, RT dose to PTV, and follow-up schedule lasted for 12 years, which might provide an informative database for analyzing radiomics and clinical outcomes. The current results may provide proof-of-concept information and practical procedures for other hospitals trying to apply radiomics in each institute. A prospective large-scale and multicenter study is required. Finally, the data in this study are derived from one hospital. Although internal validation was conducted for verification, further multicenter analysis is required for external validation.
Conclusion
Radiomics features combined with clinical features and dosimetric parameters have better performance than each significant feature and clinical nomogram. This study recommends the development of a predictive model with significant clinical features, radiomics features, and dosimetric parameters. The multicenter analysis is warranted after the standardization of treatment protocol, radiology imaging, and radiomics data in all hospitals for external validation to ensure the accuracy of the universal predictive model.
Data availability statement
The original contributions presented in the study are included in the article/supplementary material. Further inquiries can be directed to the corresponding authors.
Ethics statement
The studies involving human participants were reviewed and approved by MacKay Memorial Hospital. The patients/participants provided their written informed consent to participate in this study.
Author contributions
Conceptualization: Y-MH and Y-JC. Methodology: Y-MH, H-CT, S-MH, and Y-JC. Software: Y-MH Validation: Y-MH, S-MH, and Y-JC. Formal analysis: Y-MH. Investigation: Y-MH. Resources: Y-MH, T-EW, M-JC, C-CL, C-WC, and Y-JC. Data curation: Y-MH. Writing—original draft preparation: Y-MH. Writing—review and editing: Y-MH, S-MH, and Y-JC. Visualization: Y-MH. Supervision: Y-JC. Project administration: Y-JC. Funding acquisition: Y-JC. All authors have read and agreed to the published version of the manuscript.
Funding
This research was funded by MacKay Memorial Hospital (Grant numbers MMH-E-109-13 and MMH-E-110-13) and the Ministry of Science and Technology of Taiwan (Grant number MOST 109-2314-B-195-003-MY3).
Acknowledgments
We would like to thank Editage for providing their editing services.
Conflict of interest
The authors declare that the research was conducted in the absence of any commercial or financial relationships that could be construed as a potential conflict of interest.
Publisher’s note
All claims expressed in this article are solely those of the authors and do not necessarily represent those of their affiliated organizations, or those of the publisher, the editors and the reviewers. Any product that may be evaluated in this article, or claim that may be made by its manufacturer, is not guaranteed or endorsed by the publisher.
References
1. Sung H, Ferlay J, Siegel RL, Laversanne M, Soerjomataram I, Jemal A, et al. Global cancer statistics 2020: globocan estimates of incidence and mortality worldwide for 36 cancers in 185 countries. CA Cancer J Clin (2021) 71(3):209–49. doi: 10.3322/caac.21660
2. Villanueva A, Longo DL. Hepatocellular carcinoma. N Engl J Med (2019) 380(15):1450–62. doi: 10.1056/NEJMra1713263
3. Jemal A, Ward EM, Johnson CJ, Cronin KA, Ma J, Ryerson AB, et al. Annual report to the nation on the status of cancer, 1975–2014, featuring survival. J Natl Cancer Inst (2017) 109(9):djx030. doi: 10.1093/jnci/djx030
4. Llovet JM, Kelley RK, Villanueva A, Singal AG, Pikarsky E, Roayaie S, et al. Hepatocellular carcinoma. Nat Rev Dis Primers (2021) 7(1):6. doi: 10.1038/s41572-020-00240-3
5. Vilarinho S, Calvisi DF. New advances in precision medicine for hepatocellular carcinoma recurrence prediction and treatment. Hepatology (2014) 60(6):1812–4. doi: 10.1002/hep.27311
6. Costentin CE, Ferrone CR, Arellano RS, Ganguli S, Hong TS, Zhu AX. Hepatocellular carcinoma with macrovascular invasion: defining the optimal treatment strategy. Liver Cancer (2017) 6(4):360–74. doi: 10.1159/000481315
7. Zhang ZM, Lai ECH, Zhang C, Yu HW, Liu Z, Wan BJ, et al. The strategies for treating primary hepatocellular carcinoma with portal vein tumor thrombus. Int J Surg (2015) 20:8–16. doi: 10.1016/j.ijsu.2015.05.009
8. Addario L, Tritto G, Cavaglià E, Amodio F, Giannelli E, Di Costanzo GG. Preserved liver function, portal thrombosis and absence of oesophageal varices are risk factors for metastasis of hepatocellular carcinoma. Dig Liver Dis (2011) 43(4):319–24. doi: 10.1016/j.dld.2010.09.003
9. Cabibbo G, Enea M, Attanasio M, Bruix J, Craxì A, Cammà C. A meta-analysis of survival rates of untreated patients in randomized clinical trials of hepatocellular carcinoma. Hepatology (2010) 51(4):1274–83. doi: 10.1002/hep.23485
10. Tiao G, Mähringer-Kunz A, Steinle V, Kloeckner R, Schotten S, Hahn F, et al. The impact of portal vein tumor thrombosis on survival in patients with hepatocellular carcinoma treated with different therapies: a cohort study. PloS One (2021) 16(5):e0249426. doi: 10.1371/journal.pone.0249426
11. Faivre S, Rimassa L, Finn RS. Molecular therapies for HCC: looking outside the box. J Hepatol (2020) 72(2):342–52. doi: 10.1016/j.jhep.2019.09.010
12. Zhang ZY, Dong KS, Zhang EL, Zhang LW, Chen XP, Dong HH. Resection might be a meaningful choice for hepatocellular carcinoma with portal vein thrombosis. Med (Baltimore) (2019) 98(50):e18362. doi: 10.1097/md.0000000000018362
13. Woloschak GE, Somma F, Stoia V, Serra N, D’Angelo R, Gatta G, et al. Yttrium-90 trans-arterial radioembolization in advanced-stage HCC: the impact of portal vein thrombosis on survival. PloS One (2019) 14(5):e0216935. doi: 10.1371/journal.pone.0216935
14. Holliday EB, Tao R, Brownlee Z, Das P, Krishnan S, Taniguchi C, et al. Definitive radiation therapy for hepatocellular carcinoma with portal vein tumor thrombus. Clin Transl Radiat Oncol (2017) 4:39–45. doi: 10.1016/j.ctro.2017.04.003
15. Rim CH, Kim CY, Yang DS, Yoon WS. Comparison of radiation therapy modalities for hepatocellular carcinoma with portal vein thrombosis: a meta-analysis and systematic review. Radiother Oncol (2018) 129(1):112–22. doi: 10.1016/j.radonc.2017.11.013
16. Yu JI, Park HC. Radiotherapy as valid modality for hepatocellular carcinoma with portal vein tumor thrombosis. World J Gastroenterol (2016) 22(30):6851–63. doi: 10.3748/wjg.v22.i30.6851
17. Yoon SM, Ryoo BY, Lee SJ, Kim JH, Shin JH, An JH, et al. Efficacy and safety of transarterial chemoembolization plus external beam radiotherapy vs sorafenib in hepatocellular carcinoma with macroscopic vascular invasion. JAMA Oncol (2018) 4(5):661–9. doi: 10.1001/jamaoncol.2017.5847
18. Hong TS, Bosch WR, Krishnan S, Kim TK, Mamon HJ, Shyn P, et al. Interobserver variability in target definition for hepatocellular carcinoma with and without portal vein thrombus: radiation therapy oncology group consensus guidelines. Int J Radiat Oncol Biol Phys (2014) 89(4):804–13. doi: 10.1016/j.ijrobp.2014.03.041
19. Lin CS, Jen YM, Chiu SY, Hwang JM, Chao HL, Lin HY, et al. Treatment of portal vein tumor thrombosis of hepatoma patients with either stereotactic radiotherapy or three-dimensional conformal radiotherapy. Jpn J Clin Oncol (2006) 36(4):212–7. doi: 10.1093/jjco/hyl006
20. Wang G, Zhu S, Li X. Comparison of values of CT and MRI imaging in the diagnosis of hepatocellular carcinoma and analysis of prognostic factors. Oncol Lett (2019) 17(1):1184–8. doi: 10.3892/ol.2018.9690
21. Yu NC, Chaudhari V, Raman SS, Lassman C, Tong MJ, Busuttil RW, et al. CT and MRI improve detection of hepatocellular carcinoma, compared with ultrasound alone, in patients with cirrhosis. Clin Gastroenterol Hepatol (2011) 9(2):161–7. doi: 10.1016/j.cgh.2010.09.017
22. Mayerhoefer ME, Riedl CC, Kumar A, Dogan A, Gibbs P, Weber M, et al. [18F]FDG-PET/CT radiomics for prediction of bone marrow involvement in mantle cell lymphoma: a retrospective study in 97 patients. Cancers (Basel) (2020) 12(5):1138. doi: 10.3390/cancers12051138
23. Yang J, Guo X, Ou X, Zhang W, Ma X. Discrimination of pancreatic serous cystadenomas from mucinous cystadenomas with CT textural features: based on machine learning. Front Oncol (2019) 9:494. doi: 10.3389/fonc.2019.00494
24. Wu J, Liu A, Cui J, Chen A, Song Q, Xie L. Radiomics-based classification of hepatocellular carcinoma and hepatic haemangioma on precontrast magnetic resonance images. BMC Med Imaging (2019) 19(1):23. doi: 10.1186/s12880-019-0321-9
25. Zhang T, Zhang Y, Liu X, Xu H, Chen C, Zhou X, et al. Application of radiomics analysis based on CT combined with machine learning in diagnostic of pancreatic neuroendocrine tumors patient’s pathological grades. Front Oncol (2021) 10:521831. doi: 10.3389/fonc.2020.521831
26. Liu Z, Zhu G, Jiang X, Zhao Y, Zeng H, Jing J, et al. Survival prediction in gallbladder cancer using CT based machine learning. Front Oncol (2020) 10:604288. doi: 10.3389/fonc.2020.604288
27. Peng H, Dong D, Fang MJ, Li L, Tang LL, Chen L, et al. Prognostic value of deep learning PET/CT-based radiomics: potential role for future individual induction chemotherapy in advanced nasopharyngeal carcinoma. Clin Cancer Res (2019) 25(14):4271–9. doi: 10.1158/1078-0432.ccr-18-3065
28. Zhao Y, Yang J, Luo M, Yang Y, Guo X, Zhang T, et al. Contrast-enhanced CT-based textural parameters as potential prognostic factors of survival for colorectal cancer patients receiving targeted therapy. Mol Imaging Biol (2020) 23(3):427–35. doi: 10.1007/s11307-020-01552-2
29. Bourbonne V, Fournier G, Vallières M, Lucia F, Doucet L, Tissot V, et al. External validation of an MRI-derived radiomics model to predict biochemical recurrence after surgery for high-risk prostate cancer. Cancers (Basel) (2020) 12(4):814. doi: 10.3390/cancers12040814
30. Botta F, Raimondi S, Rinaldi L, Bellerba F, Corso F, Bagnardi V, et al. Association of a CT-based clinical and radiomics score of non-small cell lung cancer (NSCLC) with lymph node status and overall survival. Cancers (Basel) (2020) 12(6):1432. doi: 10.3390/cancers12061432
31. Kocher M, Ruge MI, Galldiks N, Lohmann P. Applications of radiomics and machine learning for radiotherapy of malignant brain tumors. Strahlenther Onkol (2020) 196(10):856–67. doi: 10.1007/s00066-020-01626-8
32. Dissaux G, Visvikis D, Da-Ano R, Pradier O, Chajon E, Barillot I, et al. Pretreatment 18F-FDG PET/CT radiomics predict local recurrence in patients treated with stereotactic body radiotherapy for early-stage non-small cell lung cancer: a multicentric study. J Nucl Med (2020) 61(6):814–20. doi: 10.2967/jnumed.119.228106
33. Yan M, Wang W. A radiomics model of predicting tumor volume change of patients with stage III non-small cell lung cancer after radiotherapy. Sci Prog (2021) 104(1):3685042199729. doi: 10.1177/0036850421997295
34. Sun R, Limkin EJ, Vakalopoulou M, Dercle L, Champiat S, Han SR, et al. A radiomics approach to assess tumour-infiltrating CD8 cells and response to anti-PD-1 or anti-PD-L1 immunotherapy: an imaging biomarker, retrospective multicohort study. Lancet Oncol (2018) 19(9):1180–91. doi: 10.1016/s1470-2045(18)30413-3
35. Nardone V, Tini P, Pastina P, Botta C, Reginelli A, Carbone S, et al. Radiomics predicts survival of patients with advanced non−small cell lung cancer undergoing PD−1 blockade using nivolumab. Oncol Lett (2020) 19(2):1559–66. doi: 10.3892/ol.2019.11220
36. Nardone V, Tini P, Nioche C, Mazzei MA, Carfagno T, Battaglia G, et al. Texture analysis as a predictor of radiation-induced xerostomia in head and neck patients undergoing IMRT. Radiol Med (2018) 123(6):415–23. doi: 10.1007/s11547-017-0850-7
37. Ekert K, Hinterleitner C, Baumgartner K, Fritz J, Horger M. Extended texture analysis of non-enhanced whole-body MRI image data for response assessment in multiple myeloma patients undergoing systemic therapy. Cancers (Basel) (2020) 12(3):761. doi: 10.3390/cancers12030761
38. Yang B, Ji H, Zhong J, Ma L, Zhong J, Dong H, et al. Value of 18F-FDG PET/CT-based radiomics nomogram to predict survival outcomes and guide personalized targeted therapy in lung adenocarcinoma with EGFR mutations. Front Oncol (2020) 10:567160. doi: 10.3389/fonc.2020.567160
39. Tran WT, Jerzak K, Lu FI, Klein J, Tabbarah S, Lagree A, et al. Personalized breast cancer treatments using artificial intelligence in radiomics and pathomics. J Med Imaging Radiat Sci (2019) 50(4):S32–41. doi: 10.1016/j.jmir.2019.07.010
40. He M, Zhang P, Ma X, He B, Fang C, Jia F. Radiomic feature-based predictive model for microvascular invasion in patients with hepatocellular carcinoma. Front Oncol (2020) 10:574228. doi: 10.3389/fonc.2020.574228
41. Zheng BH, Liu LZ, Zhang ZZ, Shi JY, Dong LQ, Tian LY, et al. Radiomics score: a potential prognostic imaging feature for postoperative survival of solitary HCC patients. BMC Cancer (2018) 18(1):1148. doi: 10.1186/s12885-018-5024-z
42. Zhou Y, Ding J, Qin Z, Wang Y, Zhang J, Jia K, et al. Predicting the survival rate of patients with hepatocellular carcinoma after thermal ablation by nomograms. Ann Transl Med (2020) 8(18):1159. doi: 10.21037/atm-20-6116
43. Song W, Yu X, Guo D, Liu H, Tang Z, Liu X, et al. MRI-Based radiomics: associations with the recurrence-free survival of patients with hepatocellular carcinoma treated with conventional transcatheter arterial chemoembolization. J Magn Reson Imaging (2019) 52(2):461–73. doi: 10.1002/jmri.26977
44. Wang XH, Long LH, Cui Y, Jia AY, Zhu XG, Wang HZ, et al. MRI-Based radiomics model for preoperative prediction of 5-year survival in patients with hepatocellular carcinoma. Br J Cancer (2020) 122(7):978–85. doi: 10.1038/s41416-019-0706-0
45. Meng XP, Wang YC, Ju S, Lu CQ, Zhong BY, Ni CF, et al. Radiomics analysis on multiphase contrast-enhanced CT: a survival prediction tool in patients with hepatocellular carcinoma undergoing transarterial chemoembolization. Front Oncol (2020) 10:1196. doi: 10.3389/fonc.2020.01196
46. Cozzi L, Dinapoli N, Fogliata A, Hsu WC, Reggiori G, Lobefalo F, et al. Radiomics based analysis to predict local control and survival in hepatocellular carcinoma patients treated with volumetric modulated arc therapy. BMC Cancer (2017) 17(1):829. doi: 10.1186/s12885-017-3847-7
47. Nioche C, Orlhac F, Boughdad S, Reuzé S, Goya-Outi J, Robert C, et al. LIFEx: a freeware for radiomic feature calculation in multimodality imaging to accelerate advances in the characterization of tumor heterogeneity. Cancer Res (2018) 78(16):4786–9. doi: 10.1158/0008-5472.can-18-0125
48. Hou TC, Huang WC, Tai HC, Chen YJ. Integrated radiomic model for predicting the prognosis of esophageal squamous cell carcinoma patients undergoing neoadjuvant chemoradiation. Ther Radiol Oncol (2019) 3:28. doi: 10.21037/tro.2019.07.03
49. Wu K, Shui Y, Sun W, Lin S, Pang H. Utility of radiomics for predicting patient survival in hepatocellular carcinoma with portal vein tumor thrombosis treated with stereotactic body radiotherapy. Front Oncol (2020) 10:569435. doi: 10.3389/fonc.2020.569435
50. Parr E, Du Q, Zhang C, Lin C, Kamal A, McAlister J, et al. Radiomics-based outcome prediction for pancreatic cancer following stereotactic body radiotherapy. Cancers (Basel) (2020) 12(4):1051. doi: 10.3390/cancers12041051
Keywords: hepatocellular carcinoma, portal vein tumor thrombosis, radiation therapy, radiomics, predictive model
Citation: Huang Y-M, Wang T-E, Chen M-J, Lin C-C, Chang C-W, Tai H-C, Hsu S-M and Chen Y-J (2022) Radiomics-based nomogram as predictive model for prognosis of hepatocellular carcinoma with portal vein tumor thrombosis receiving radiotherapy. Front. Oncol. 12:906498. doi: 10.3389/fonc.2022.906498
Received: 28 March 2022; Accepted: 26 August 2022;
Published: 20 September 2022.
Edited by:
Nanna Maria Sijtsema, University Medical Center Groningen, NetherlandsReviewed by:
Wen-Yen Huang, Tri-Service General Hospital, TaiwanShixiong Liang, Guangxi Medical University Cancer Hospital, China
Copyright © 2022 Huang, Wang, Chen, Lin, Chang, Tai, Hsu and Chen. This is an open-access article distributed under the terms of the Creative Commons Attribution License (CC BY). The use, distribution or reproduction in other forums is permitted, provided the original author(s) and the copyright owner(s) are credited and that the original publication in this journal is cited, in accordance with accepted academic practice. No use, distribution or reproduction is permitted which does not comply with these terms.
*Correspondence: Yu-Jen Chen, chenmdphd@gmail.com; Shih-Ming Hsu, smhsu@ym.edu.tw