 Chenxi Xiang1,2†
 Wanna Wu3†
 Meiting Fan2†Zhen Wang4
 Xiaoli Feng5Cuiling Liu6
 Jia Liu1Guangzhen Liu1Lei Xia1Haipeng Si7
 Ying Gu2
 Nian Liu2Dan Luo2Yubo Wang2
 Dongshen Ma1,2Shimin Hu8
 Hui Liu1,2*
- 1Department of Pathology, The Affiliated Hospital of Xuzhou Medical University, Xuzhou, China
- 2Department of Pathology, Xuzhou Medical University, Xuzhou, China
- 3Department of Pathology, The First Affiliated Hospital and School of Clinical Medicine of Guangdong Pharmaceutical University, Guangzhou, China
- 4Department of Pathology, The First Affiliated Hospital of Nanjing Medical University, Nanjing, China
- 5Department of Pathology, National Cancer Center and National Clinical Research Center For Cancer and Cancer Hospital, Chinese Academy of Medical Sciences and Peking Union Medical College, Beijing, China
- 6Department of Pathology, School of Basic Medical Sciences and Third Hospital, Pekin University Health Science Center, Beijing, China
- 7Department of Pathology, The Affiliated Hospital of Nanjing University of Chinese Medicine, Nanjing, China
- 8Department of Hematopathology, The University of Texas MD Anderson Cancer Center, Houston, TX, United States
Aims: The differential diagnosis between ALK-negative anaplastic large cell lymphoma (ALK- ALCL) and peripheral T-cell lymphoma, not otherwise specified (PTCL, NOS) with high expression of CD30 (CD30high) are essential. However, no reliable biomarker is available in daily practice except CD30. STAT3 is characteristically activated in ALCL. We aimed to investigate whether the status of STAT3 phosphorylation could help the differential diagnosis.
Methods: The status of phosphorylation of STAT3 was examined using two antibodies against pSTAT3-Y705 and pSTAT3-S727 by immunohistochemistry in ALK+ ALCL (n=33), ALK- ALCL (n=22) and PTCL, NOS (n=34). Ten PTCL, NOS with diffuse CD30 expression were defined as CD30high PTCL, NOS. Flowcytometric analysis were performed to evaluate the expression of pSTAT3-Y705/S727 in PTCL, NOS (n=3).
Results: The median H-scores of pSTAT3-Y705 and S727 were 280 and 260 in ALK+ ALCL, 250 and 240 in ALK- ALCL, and 45 and 75 in CD30high subgroup, respectively. Using H score of 145 as the cutoff value, pSTAT3-S727 alone distinguished between ALK- ALCL and CD30high PTCL, NOS with a sensitivity of 100% and specificity of 83%. Additionally, pSTAT3-S727, but not pSTAT3-Y705, was also expressed by background tumor-infiltrating lymphocytes (S727TILs) in PTCL, NOS. PTCL, NOS patients with high S727TILs H score had a favorable prognosis than those with no TILs (3-year OS rate: 43% vs. 0, p=0.013) or low S727TILs (3-year OS rate: 43% vs. 0, p=0.099). Flowcytometric analysis revealed that of the three patients investigated, two had enhanced pSTAT-S727 signals in neoplastic cell populations, and all three patients were negative for pSTAT3-Y705 expression in both tumor cells and background lymphocytes.
Conclusions: pSTAT3-Y705/S727 can be used to help distinguish ALK- ALCL from CD30high PTCL, NOS and pSTAT3-S727 expression by TILs predicts the prognosis of a subset of PTCL, NOS.
Introduction
Anaplastic large cell lymphoma (ALCL), is a type of lymphoma that can be classified into two subtypes: ALK+ and ALK-. Both subtypes are characterized by the presence of large anaplastic cells with diffuse and strong expression of CD30 on the cell membrane and in the Golgi region (1, 2). The diagnosis of ALK+ ALCL is usually straightforward. However, for most cases of ALK- ALCL, no unifying genetic abnormality has been identified, making the diagnosis more reliant on morphology features and CD30 expression (3).
Despite its strong expression on anaplastic cells in ALK+ and ALK- ALCL, CD30 is not a specific marker for these malignancies. In fact, a variety of T- or B-cell lymphomas, as well as reactive lymphoproliferative disorders, and non-hematopoietic lesions, may also express CD30 to varying degrees. Among these entities, peripheral T-cell lymphoma, not otherwise specified (PTCL, NOS) with CD30 expression can be particularly difficulty to distinguish from ALK- ALCL. Although most cases of PTCL, NOS are negative or only weakly positive for CD30 in only a minority of tumor cells (4–6), a small subset exhibit diffuse and strong CD30 expression(CD30high PTCL, NOS). In such cases, the distinction between ALK- ALCL and PTCL, NOS becomes ambiguous, and the diagnosis may be subjective (5, 7).
Differentiating between these two conditions is clinically important since patients with ALK- ALCL typically have better overall survival and respond more favorably to Brentuximab vedotin compared to those with PTCL, NOS (8). Unfortunately, due to the lack of widely accepted diagnostic criteria or reliable biomarkers to differentiate between ALK- ALCL and CD30high PTCL, NOS, accurately diagnosing these two conditions remains a challenge and requires careful consideration of clinical, morphological, and immunophenotypic features by an experienced pathologist.
Aberrant activation of the signal transducer and activator of transcription 3 (STAT3) has been identified as a key oncogenic event in both ALK+ and ALK- ALCL (9–15). In ALK+ ALCL, the NPM::ALK fusion protein drives STAT3 activation by promoting the phosphorylation of STAT3 (15). In ALK- ALCL, the STAT3 pathway can be activated by alternative upstream signals, such as JAK1/STAT3 mutations (5, 16), NFkB2::ROS1 and NFkB::TYK2 fusions (9). However, JAK1/STAT3 mutations are not commonly observed in PTCL, NOS (9). These findings raised the question of whether the activation status of STAT3 could be used to distinguish ALK- ALCL from CD30high PTCL, NOS. Notably, phosphorylation of STAT3 at tyrosine 705 (Y705) was found to be positive in 84-93% of ALK+ ALCL and 47-57% of ALK- ALCL (17, 18). The phosphorylation status of STAT3 in PTCL, NOS remains largely unknown, and the phosphorylation of STAT3 at another activation site, serine 727 (S727) has not been well studied, in contrast to the frequent observation of positive phosphorylation at Y705 in both ALK+ and ALK- ALCL.
This study aimed to develop an immunohistochemistry (IHC)-based classifier using two commercially available antibodies targeting different phosphorylation sites of STAT3, namely Y705 and S727. The goal was to determine whether the phosphorylation status of these residues could serve as a biomarker for distinguishing between ALK- ALCL and CD30high PTCL, NOS. Furthermore, the study investigated whether the presence of phosphorylated STAT3 (pSTAT3) could predict clinical outcomes in patients with ALCL or PTCL, NOS.
Materials and methods
Patient selection
CD30 expression was retrospectively investigated in cases diagnosed with ALK+ ALCL, ALK- ALCL, and PTCL, NOS from five different institutions. Two hematologists independently reviewed the diagnosis of each case based on 2017 WHO classification criteria and finally included 89 patients from four different medical centers (The Affiliated Hospital of Xuzhou Medical University, The First Affiliated Hospital of Nanjing Medical University, Chinese Academy of Medical Sciences Cancer Hospital, Third Hospital of Pekin University Health Science Center), comprising 33 cases of ALK+ ALCL, 22 cases of ALK- ALCL, and 34 cases of PTCL, NOS (4). Clinicopathologic data and follow-up information were collected for each case.
Immunohistochemistry and pSTAT3-Y705 and pSTAT3-S727 semi-quantification
The antibodies used to detect pSTAT3-Y705 (ab171358) and pSTAT3-S727 (ab32143) were from Abcam (Cambridge, UK). Positive IHC staining for pSTAT3-Y705 and pSTAT3-S727 was defined as clear nuclear staining with a distinct background. The secondary antibody was Polymer HRP-Goat anti-Rabbit/Mouse Secondary Antibody (PV-8000) from ZSGB-BIO (Beijing, China). The extent of staining was categorized into three grades based on the percentage of positive cells (<30%, 30-70%, and >70%). The intensity of staining was evaluated as weak (1+), moderate (2+), or strong (3+). Semi-quantitative evaluation of IHC was performed using the H-score, which is calculated as 300 × (% cells 3+) + 200 × (% cells 2+) + 100 × (% cells 1+). Tumor-infiltrating lymphocytes (TILs) was defined as lymphocytes interspersing within the tumor area. The expression of pSTAT3-S727 in TILs (S727TILs) was evaluated by multiplying the H-score of S727 in TILs by the percent of TILs in the tumor area: H-score × TILs % × 100.
Flowcytometric assay
Flowcytometric assay was performed on three PTCL, NOS cases, using one excised tonsil case as control. All PTCL, NOS cases were diagnosed in our laboratory using a T-cell lymphoma panel recommended by Euroflow and excluded from PTCL of T follicular helper (Tfh) cell phenotype (19) on a Cytek Spectrum Flowcytometer (NL-CLC, V16-B14). The detection of pSTAT3-Y705 was by using commercially available antibody (Catalog No: 612569) from BD Pharmingen (BD Bioscience, USA) and pSTAT3-S727 by conjugating fluorescence tag (FlexAble Coralite V405 Antibod Labeling Kit For Rabbit IgG, Cat No: KFA006) with pSTAT3-S727 (ab32143, Abcam) from Abcam (Cambridge, UK), in an 8-color panel consisting of pSTAT3-Y705-FITC, pSTAT3-S727-Corolite V405, CD3-ECD (Catlog No: A07748, Beckman Coulter), CD8-PE-Cy7 (Catlog No: 6607102, Beckman Coulter), CD10-PE-Cy5 (Catlog No: A07761, Beckman Coulter), CD19-PE-Cy5.5 (Catlog No: A66328, Beckman Coulter), CD45-cFlourV547 (Catlog No: R7-10011, Cytek), CD4-cFlourV610 (Catlog No: R7-20073, Cytek) and PD-1-BV750 (Catlog No: 329966, Biolegend).
DNA sequencing
The DNA sequencing was performed as described (20). Specifically, probes targeting at 103 genes (Table S2) related with T/NK cell lymphoma were used to capture the target genes for DNA sequencing. GENESEEQ Technology Inc. (Nanjing, China) performed the bioinformatics analysis.
Statistical analysis
All tests were two-sided, and p values <0.05 were considered significant. Receiver operating characteristic (ROC) curves were plotted by using the “roc” function in the pROC package (RMS R package). The optimal cutoff of pSTAT3-Y705 and -S727 was derived by calculating the Youden index (sensitivity + specificity - 1). The significance of the associations of pSTAT3-Y705 and -S727 with other categorical variables were evaluated using Fisher’s exact test, Mann-Whitney U test, or the Kruskal-Wallis test. The correlation between two continuous quantitative variables was assessed using Spearman’s rank correlation coefficient. Kaplan-Meier curves were plotted using the “survival” and “survminer” packages of the RMS R package to compare survival data, and significance was assessed using the log-rank test.
Results
Baseline clinical characteristics of the study cohort
The study cohort comprised 89 patients, with 33 diagnosed with ALK+ ALCL, 22 with ALK- ALCL, and 34 with PTCL, NOS (Table 1). Of the PTCL, NOS cases, 10 with CD30 expression in 80% tumor cells were classified as CD30high PTCL, NOS (10/34, 29%). The remaining PTCL, NOS cases (24/34, 71%) were classified as CD30-/low PTCL, NOS. The clinicopathological features of CD30high PTCL, NOS patients were similar to those of ALK- ALCL patients, although CD30high PTCL, NOS patients tended to have lower platelet counts (p=0.0913) and to have a lower rate of complete or partial remission (CR/PR) (p=0.0873) (Table 2). Within the PTCL, NOS group, there was no significant difference in these clinicopathological parameters between CD30high and CD30-/low subgroups (Table 2). Additionally, PTCL, NOS (n=5) and ALK- ALCL (n=1) cases which were challenging to make a definite diagnosis based on only morphologic features and immunophenotypes were subjected to DNA sequencing using a 103-gene panel that covers genes associated with the oncogenesis and treatment of T/NK lymphoma, and the results were provided in Table S1. The whole exosome of JAK1 and STAT3 were investigated and none of six patients tested positive for JAK1 and STAT3 mutations. Of the five PTCL, NOS patients, three had high expression of pSTAT3-Y705 and four had high expression of pSTAT3-S727, and none of them tested positive for JAK1/STAT3 mutations (Table S1).
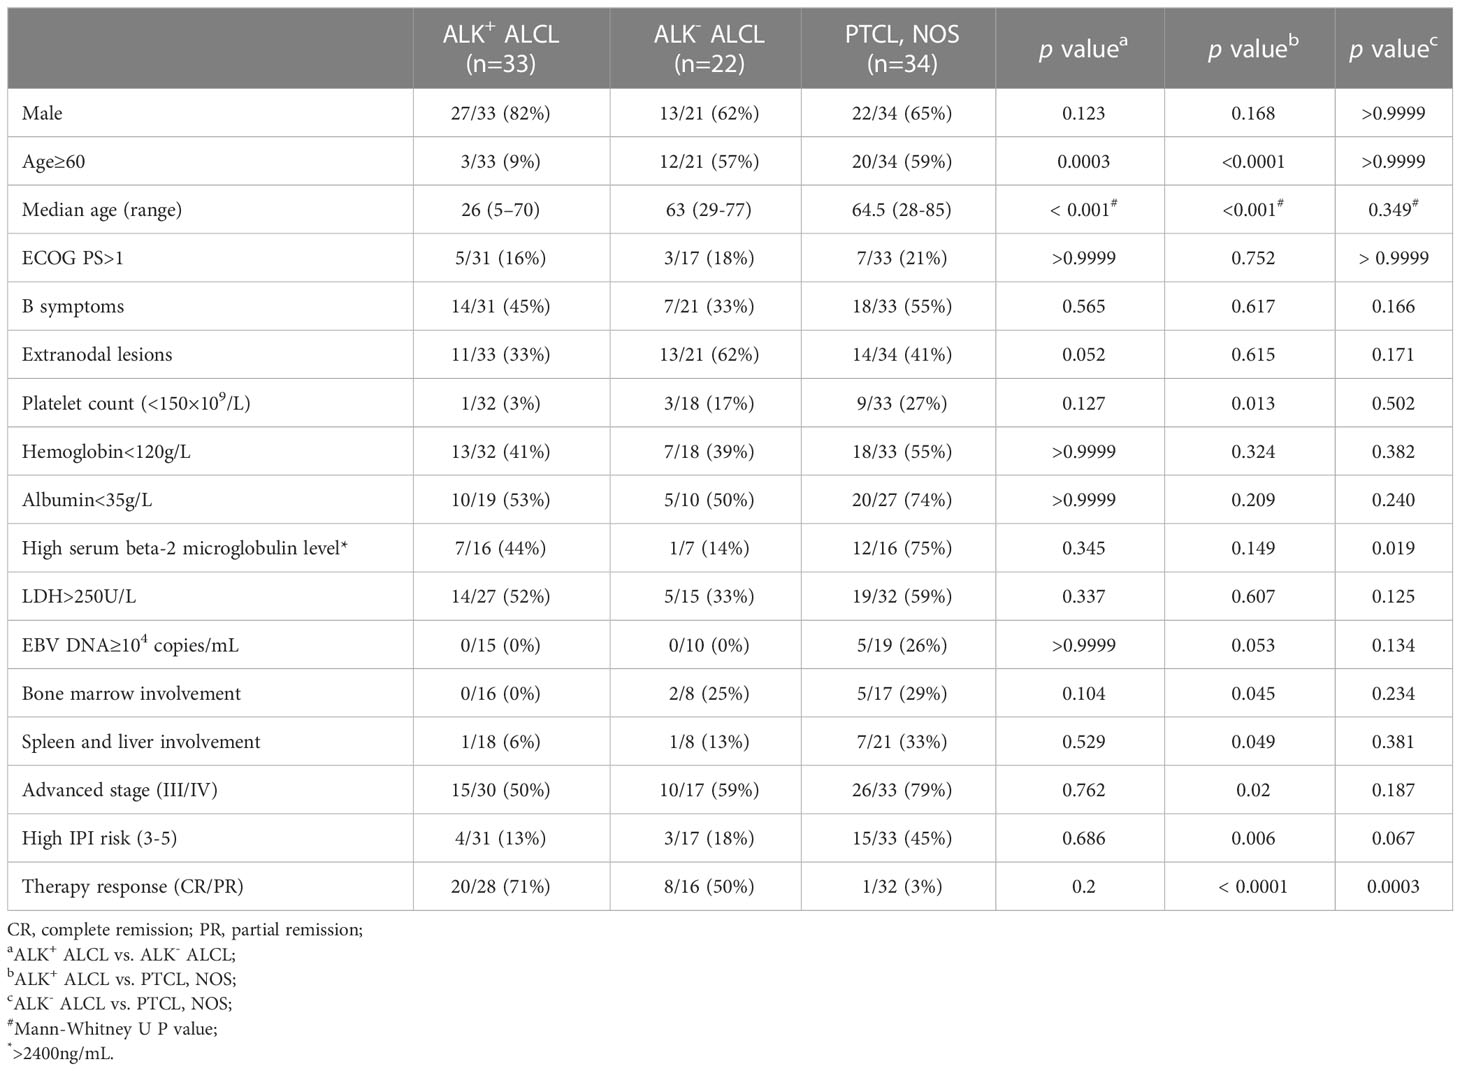
Table 1 Summary of clinicopathological information of the included patients.
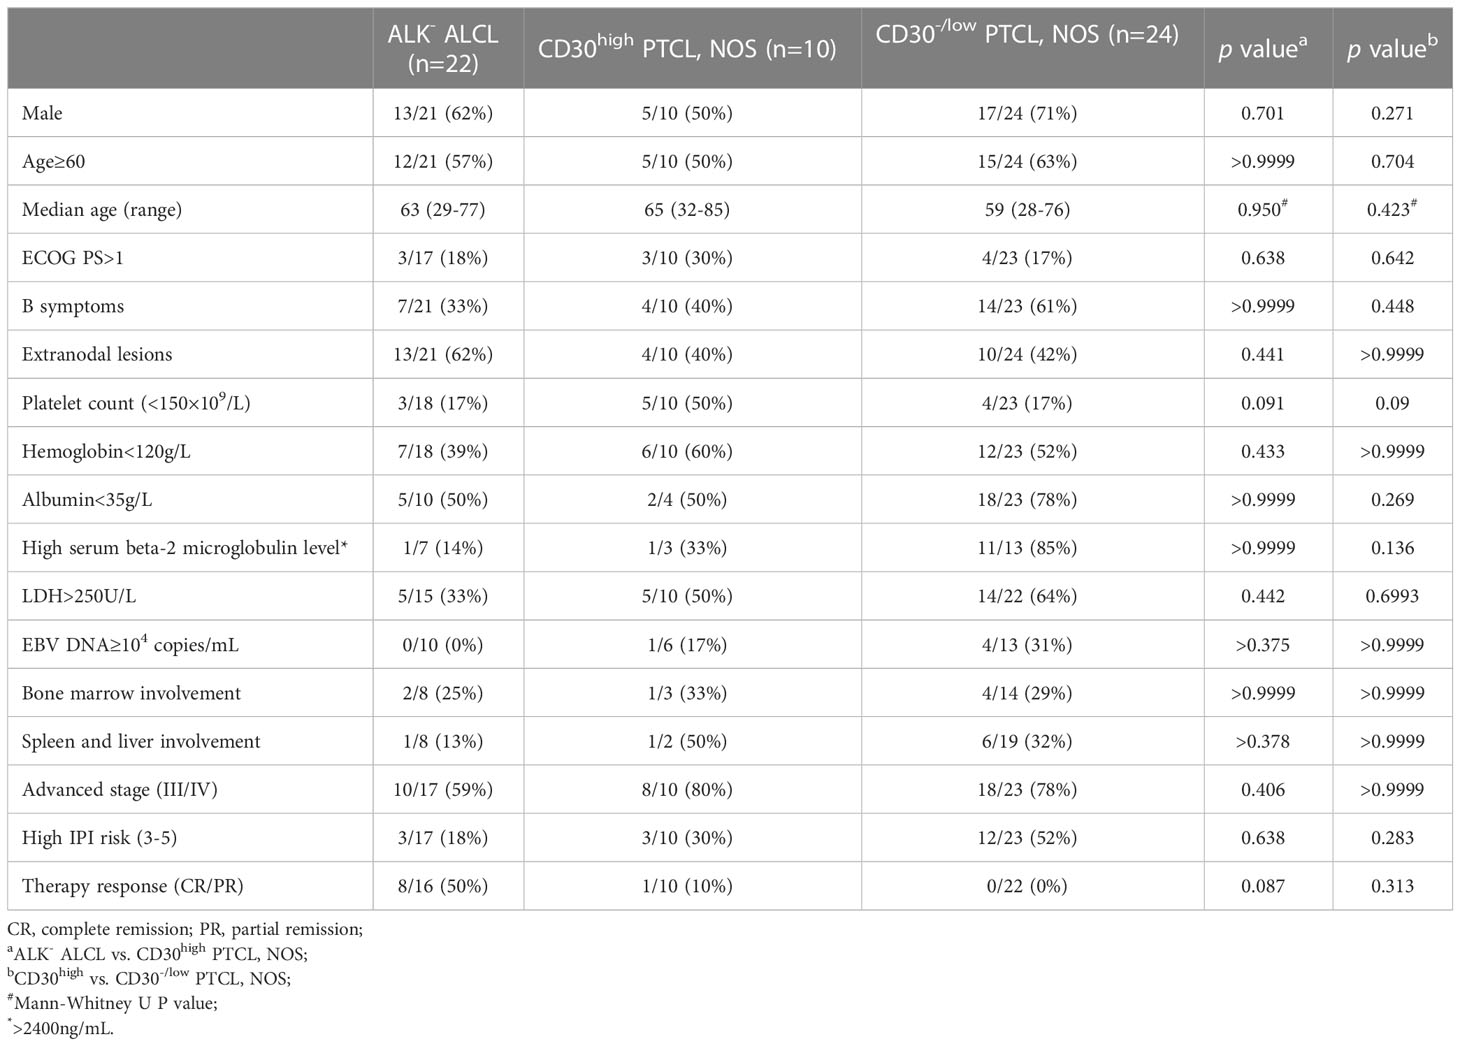
Table 2 Summary of clinicopathological information of ALCL- ALCL and CD30-/low PTCL, NOS patient.
pSTAT3-Y705 and -S727 as a diagnostic biomarker
Immunohistochemistry staining showed that both pSTAT3-Y705 and -S727 were highly expressed in the nuclei of tumor cells in both ALK+ and ALK- ALCL, with diffuse and intense staining (Figures 1A, B). The majority of ALK+ ALCL cases (29/33, 88% for pSTAT3-Y705 and 30/33, 91% for pSTAT3-S727) and ALK- ALCL cases (14/22, 64% for pSTAT-Y705 and 19/22, 86% for pSTAT3-S727) expressed pSTAT3-Y705 and pSTAT3-S727 in more than 70% of tumor cells. The median H-score of pSTAT3-Y705/S727 was 280/260 in ALK+ ALCL and 250/240 in ALK- ALCL, respectively.
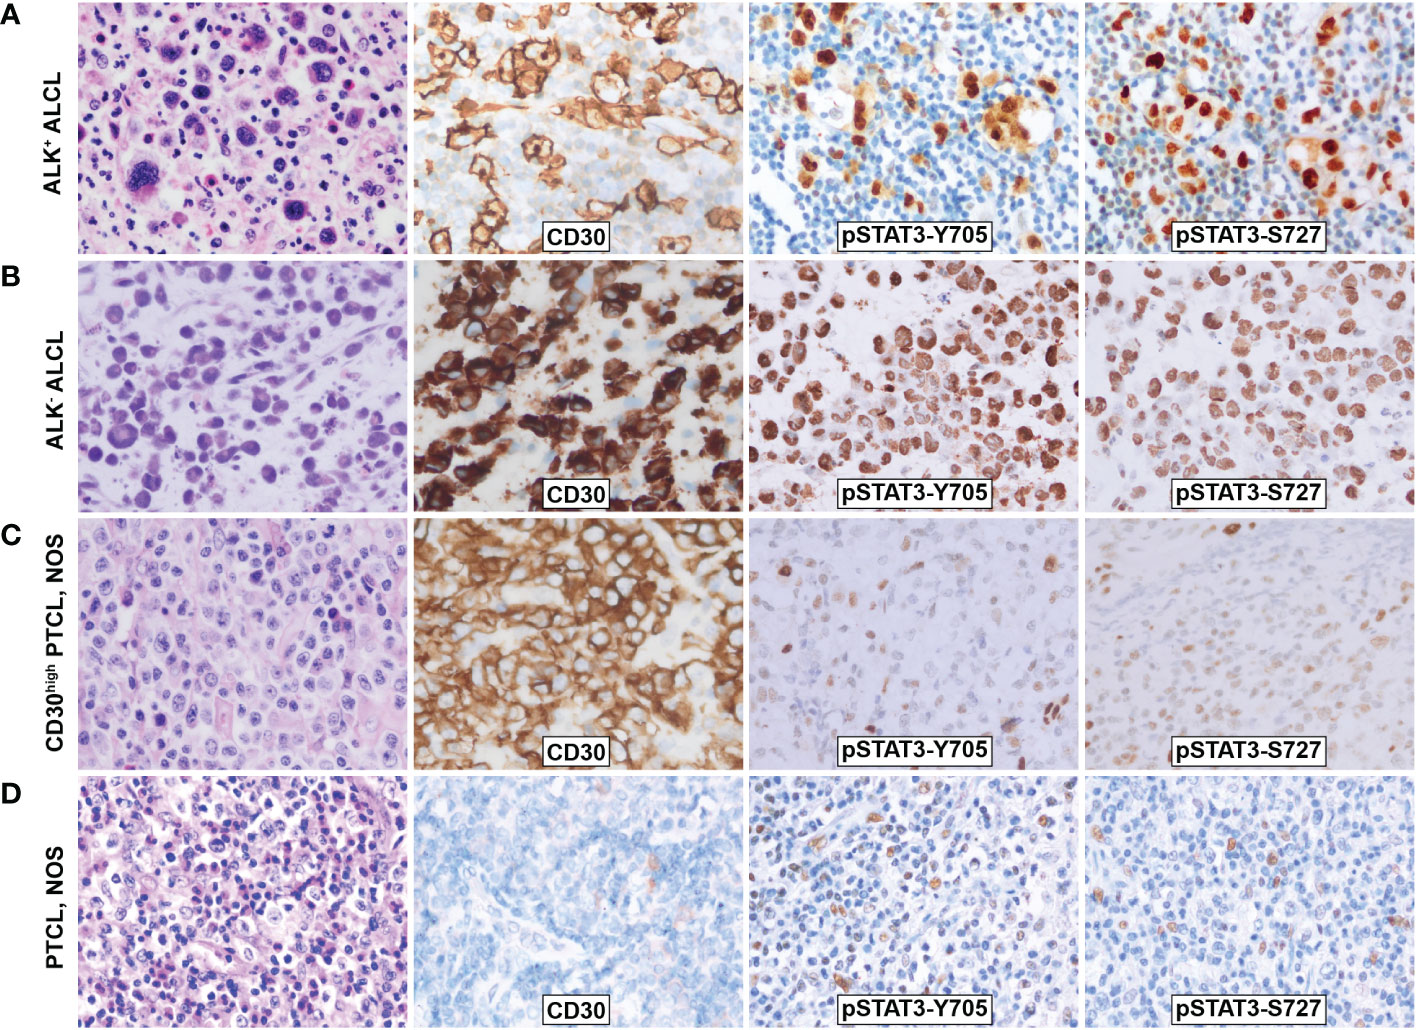
Figure 1 Morphology and phosphorylation of pSTAT3-Y705 and pSTAT3-S727 in ALCL and PTCL, NOS. (A)ALK+ ALCL; (B) ALK- ALCL; (C) PTCL, NOS; (D) CD30high PTCL, NOS. Original magnification: 400X.
In contrast, PTCL, NOS cases had weak and limited expressin of pSTAT3-Y705 and pSTAT3-S727 in a subset of cells (Figures 1C, D). Only a proportion of PTCL, NOS cases expressed pSTAT3-Y705 (5/34, 15%) and pSTAT3-S727 (16/34, 47%) in more than 70% tumor cells (p<0.001 compared to ALK+ and ALK- ALCL, Figures 2A, B). The median H-score of pSTAT3-Y705/S727 in PTCL, NOS was 60/100, significantly lower than that of ALK+ and ALK- ALCL (p<0.001). Notably, CD30high PTCL, NOS showed a similar pattern of pSTAT3-Y705/S727 positivity compared to other PTCL, NOS, with a median H-score of 45/75, significantly lower than that observed in ALK+ and ALK- ALCL (p<0.001) (Figures 2C, D).
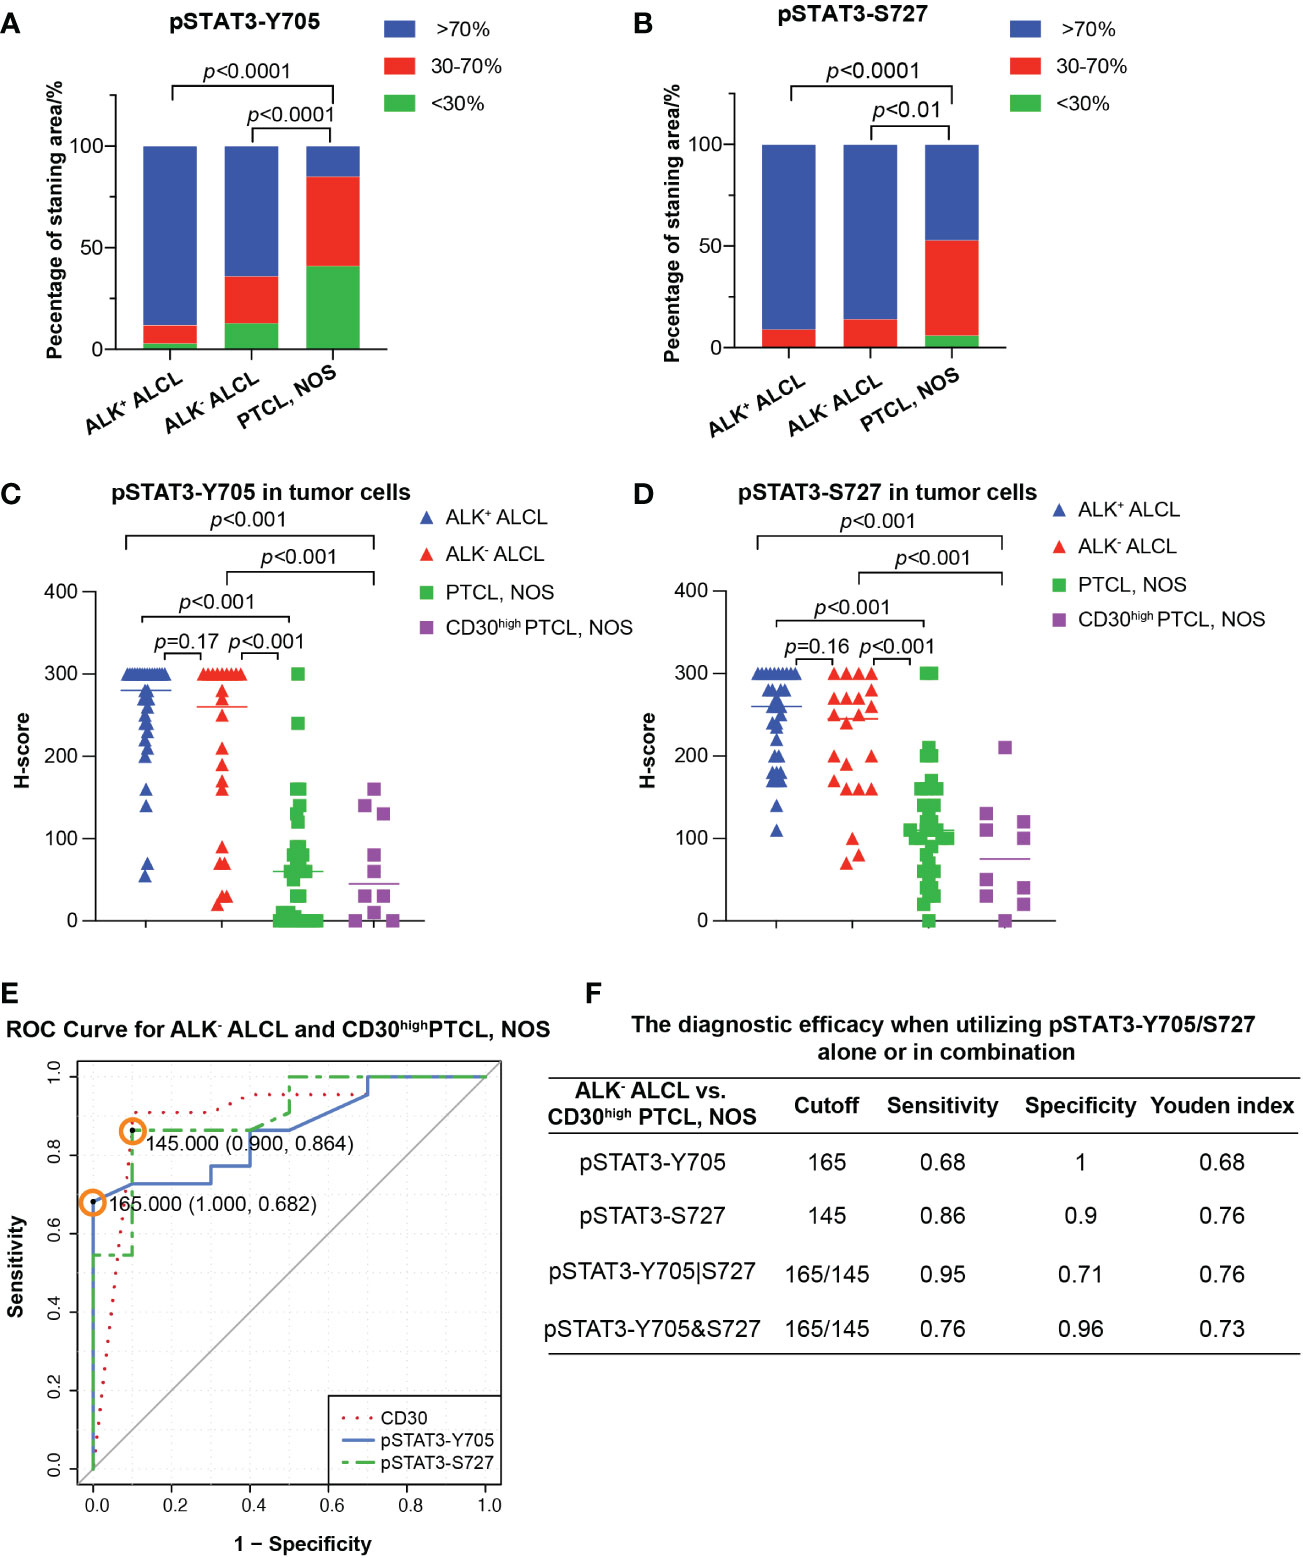
Figure 2 Differential diagnosis in ALCL vs. PTCL, NOS using pSAT3-Y705/S727. (A, B) Box plot demonstrating the proportion of staining area <30%, 30-70%, and High >70% for pSTAT3-Y705 (A) and pSTAT3-S727 (B) in ALK+/- ALCL and PTCL, NOS. (C, D) Box plot for H-score of pSTAT3-Y705 (C) and pSTAT3-S727 (D) in tumor cells of ALK+/- ALCL and PTCL, NOS, as well as in CD30high PTCL, NOS. (E) Receiver operating characteristic (ROC) curves of using pSTAT3-Y705/S727 and CD30 to distinguish ALK- ALCL and CD30high PTCL, NOS; the point with the highest Youden index was marked in the ROC curve of pSTAT3-Y705/S727. (F) The diagnostic efficacy when utilizing pSTAT3-Y705/S727 alone or in combination. (Cutoff: the cutoff value was the H-score of pSTAT3-Y705/S727 which yielded the highest youden index (Sensitivity+Specificity-1); pSTAT3-Y705|S727: the parallel utilization of pSTAT3-Y705/S727, which indicates that if the neoplastic cells are positive for either pSTAT3-Y705 or pSTAT3-S727, the case is considered as positive; pSTAT3-Y705&S727: the serial utilization of pSTAT3-Y705/S727, which indicates that only when neoplastic cells are positive for both pSTAT3-Y705 and pSTAT3-S727, the case is considered as positive).
Next we investigated the potential use of pSTAT3-Y705 and pSTAT3-S727 in differentiating between ALK- ALCL and CD30high PTCL, NOS. Our results showed that all three markers had comparable diagnostic efficacy, with an AUC of 0.8614, 0.9023, and 0.9045 for pSTAT3-Y705, pSTAT3-S727, and CD30, respectively (pSTAT3-Y705 vs. CD30, p=0.67; pSTAT3-S727 vs. CD30, p=0.98; Figure 2E).To determine the optimal cutoff H-score values of pSTAT3-Y705 and pSTAT3-S727, we plotted ROC curves and calculated the Youden index. The cutoff H-score value for pSTAT3-Y705 was determined to be 165, while the cutoff H-score value for pSTAT3-S727 was determined to be 145 (Figure 2E). When the H-score value was above the cutoff value, a diagnosis of ALK- ALCL was more likely than CD30high PTCL, NOS.
Our analysis of the specificity and sensitivity of using pSTAT3-Y705 and pSTAT3-S727 alone or in combination for the differential diagnosis of ALK- ALCL vs. CD30high PTCL, NOS is presented in Figure 2F. When used alone, pSTAT3-Y705 demonstrated better specificity, while pSTAT3-S727 demonstrated better sensitivity. When used in combination, parallel utilization of pSTAT3-Y705 and pSTAT3-S727 (Youden index, 0.76) could achieve equal diagnostic efficiency as pSTAT3-Y727 alone, with a higher sensitivity of 0.95, but a lower specificity of 0.71. Notably, pSTAT3-S727 alone demonstrated good diagnostic performance with balanced sensitivity and specificity (0.86 and 0.9, respectively, Figure 2F).
The prognostic significance of pSTAT3-S727 as a biomarker
In our cohort, the median OS of both patients with ALK+ ALCL and patients with ALK- ALCL was unreached. In contrast, patients with PTCL, NOS had a median OS of only 5.0 months (Figure 3A). We observed no significant difference in OS between patients with CD30high and CD30-/low PTCL, NOS (p=0.78, Figure S1).
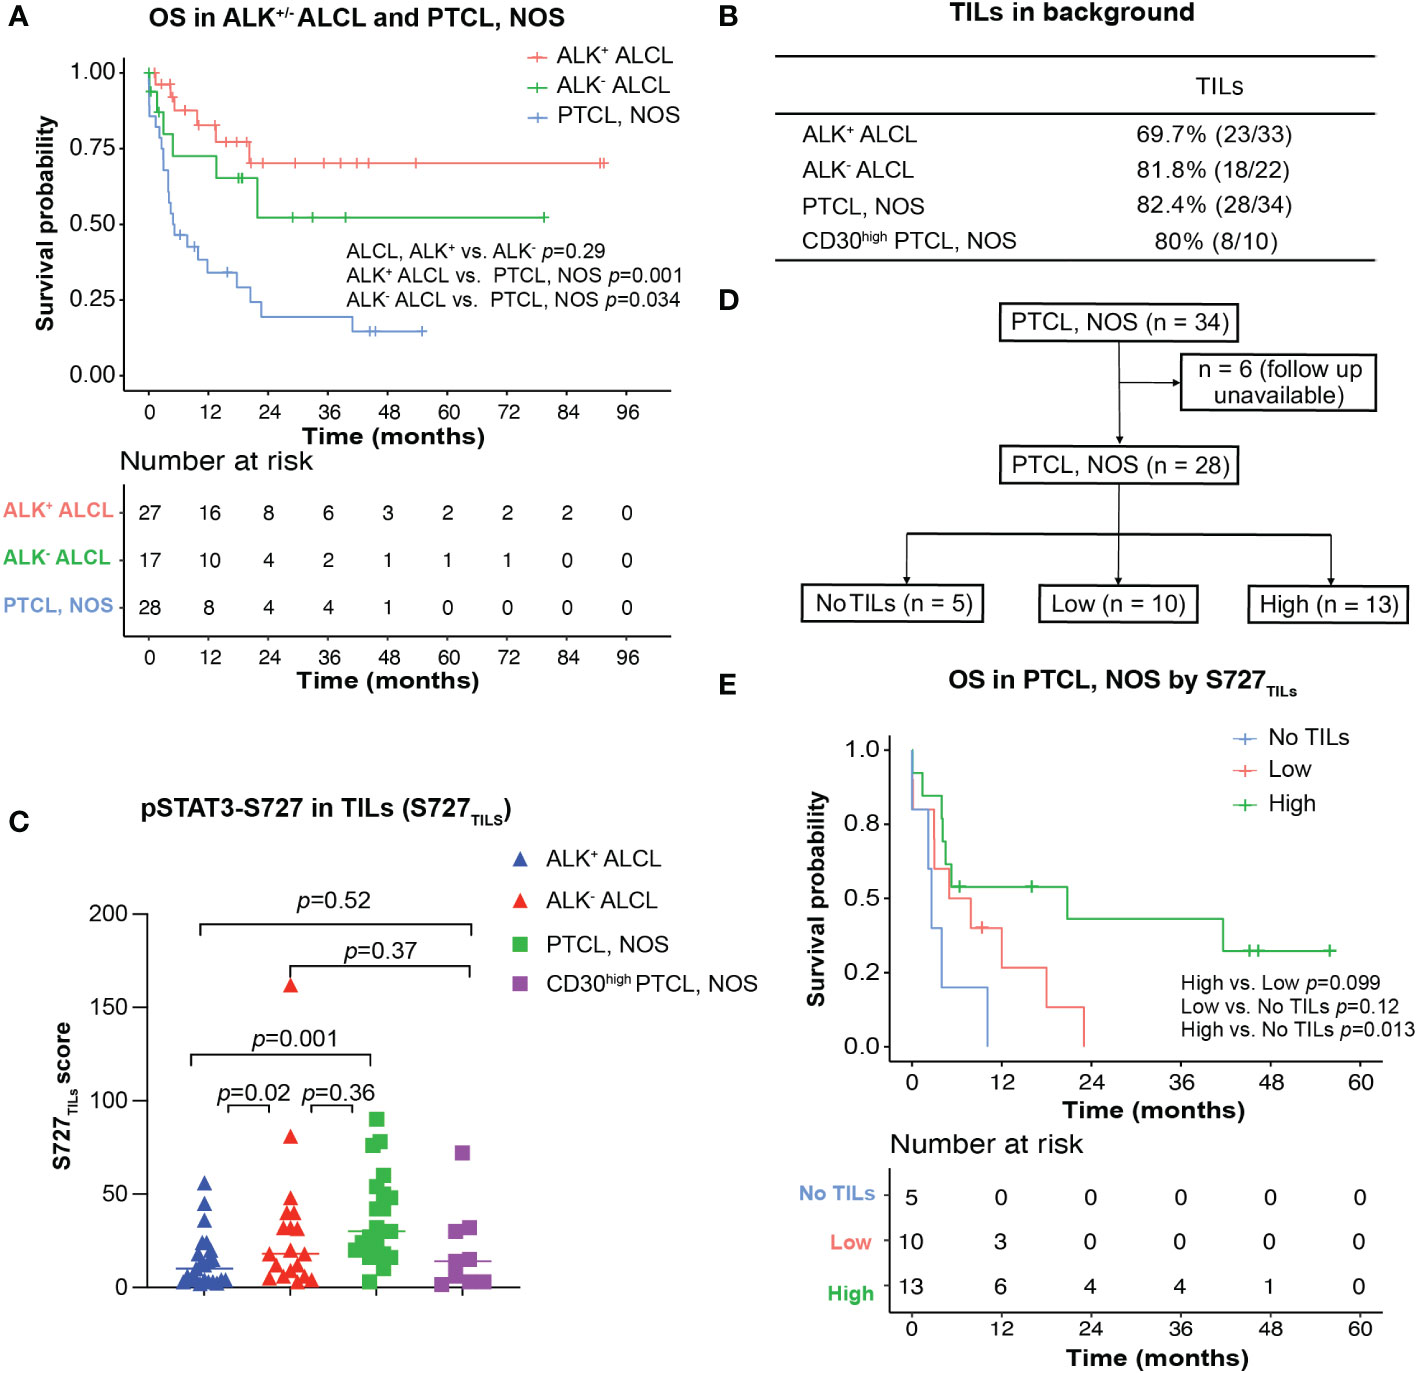
Figure 3 Survival analysis for ALK+/- ALCL and PTCL, NOS patients. (A) Overall survival analysis of patients with ALK+/-ALCL and PTCL, NOS; (B) TILs could be observed in most ALK+ ALCL, ALK- ALCL and PTCL, NOS cases; (C) Box plot for S727TILs of ALK+/- ALCL, PTCL, NOS, and CD30high PTCL, NOS; (D) Flow chart illustrating the PTCL, NOS cases included in survival analysis in (D); (E) Kaplan-Meier plot for PTCL, NOS patients with no TILs infiltration (“No TILs” group), with TILs expressing pSTAT3-S727 at a low level (“Low” group) and with TILs expressing pSTAT3-S727 at a high level (“High” group).
We then investigated whether any clinicopathological parameters could explain the poor prognosis of PTCL, NOS. Expression of CD30, pSTAT3-Y705, and pSTAT3-S727 in tumor cells, as well as various clinical and laboratory parameters, including bone marrow involvement, beta-2-microglobulin, platelets count, serum EBV DNA positivity, and decreased albumin, were not found to be predictive of prognosis in this study. However, the small sample size may have affected these results. We also analyzed whether known prognostic indices for PTCL, NOS, including the IPI, IPTCLP [International PTCL Project (21)], PIT [Prognostic Index for PTCL-U (22)], and MPIT [Modified prognostic index for PTCL, NOS (23)], could predict prognosis in our cohort. Only the PIT and M-PIT scores were found to be predictive (PIT, p=0.017, Figure S2; MPIT, p=0.042, Figure 4A).
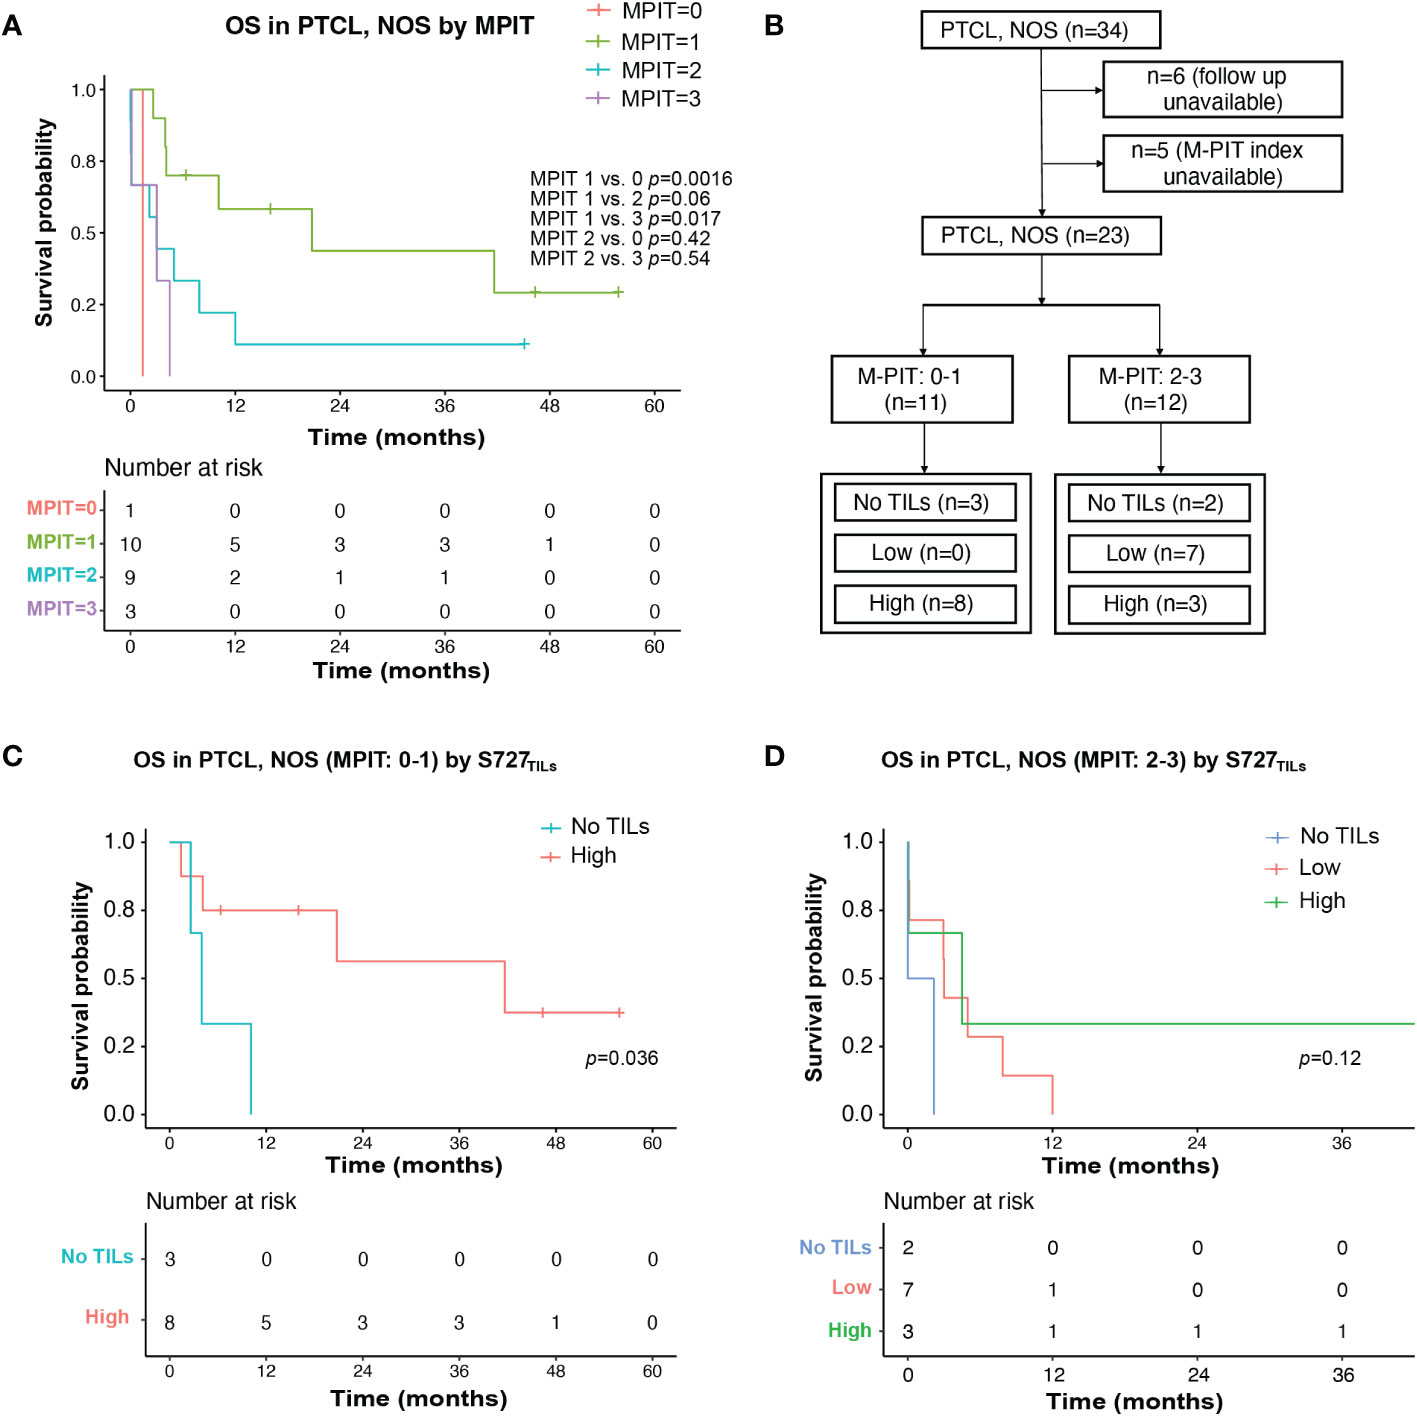
Figure 4 TILs expression level of pSTAT3-S727 (S727TILs) predicted PTCL, NOS patients’ prognosis independently of the M-PIT index. (A) Kaplan-Meier plot for PTCL, NOS patients with different M-PIT indexes; (B) Flow chart illustrating the PTCL, NOS cases included in survival analysis in (C, D); (C) In PTCL, NOS patients of low risk (M-PIT: 0-1) patients with TILs expressing pSTAT3-S727 at a high level (“High”) had a better prognosis. (D) Kaplan-Meier plot for PTCL, NOS patients of high risk (M-PIT: 2-3) stratified by TILs appearance and their expression of pSTAT3-S727.
Notably, while pSTAT3-Y705 was expressed primarily by lymphoma cells, we observed that pSTAT3-S727 was also present in background TILs, in addition to lymphoma cells (Figures 1C, D). As the infiltration of inflammatory cells in the background has been previously associated with poor prognosis in PTCL, NOS (24, 25), we evaluated the phosphorylation status of STAT3-S727 (S727TILs) and its significance in TILs (Figures 3B, C). Compared with ALK+ ALCL, the H score of S727TILs was significantly higher in ALK- ALCL (median: 18 vs. 10, p=0.02) and PTCL, NOS (median: 28.5 vs. 10, p=0.001). Additionally, the H score of S727TILs was lower in CD30high PTCL, NOS compared to CD30-/low PTCL, NOS (median: 14.5 vs. 31; p=0.038; data not shown), and similar to that of both ALK+ (median: 14.5 vs. 10, p=0.52) and ALK- ALCL (median: 14.5 vs. 19, p=0.37).
Next, we stratified PTCL, NOS patients into three subgroups based on the median H score of S727TILs in PTCL, NOS (n=28, six patients were excluded due to loss of follow-up): those with no TILs (n=5), those with low S727TILs (<28.5, n=10), and those with high S727TILs (28.5, n=13) (Figure 3D). Patients with high S727TILs H score had a significantly better OS compared to those with no TILs (Figure 3E); the 3-year OS rate was 43% vs. 0% (p=0.013), and there was a strong trend toward better OS than patients with low S727TILs H score (p=0.099).
We investigated whether the prognostic impact of S727TILs H score in PTCL, NOS patients was independent of the M-PIT index. To do this, we stratified patients into M-PIT low-risk group (0 or 1) and high-risk group (2 or 3) (Figure 4B). Among patients in the low-risk M-PIT group, those with high S727TILs H score had a significantly better survival outcome than those with no TILs, with a median OS of 20.8 vs. 3.0 months and a 3-year OS of 39.8% vs. 0% (p=0.036, Figure 4C). However, the number of patients in the high-risk M-PIT group was too small for statistical analysis (Figure 4D).
Flowcytometric analysis of pSTAT3-Y705/S727 in PTCL, NOS patients
We managed to investigate the difference of expression pattern between pSTAT3-Y705 and pSTAT3-S727 in three PTCL, NOS patients, by multiparametric flowcytometric analysis. The gating strategy was demonstrated in Figure S3 with reference to the immunophenotypes at the time of diagnosing. Patient 1 and Patient 3 were CD3-, CD4+ and Patient 2 was CD3 bright with upregulated FSC/SSC signals. All three patients met the diagnosis criteria of PTCL, NOS without the expression of any Tfh marker. As shown in Figure 5, over half of B cells and nearly all CD4+ and CD8+ T cells in the tonsil sample were positive for pSTAT3-S727, with none of them positive for pSTAT3-Y705 (Figure 5A). The neoplastic cells of Patient 1 and Patient 2, but not Patient 3 had enhanced pSTAT-S727 signals and all three patients were negative for pSTAT3-Y705 expression by flowcytometric assay (Figures 5B–D). From the result of flowcytometric analysis, pSTAT3-S727 were constitutively positive in most T/B lymphocytes of normal tonsil and PTCL, NOS samples, and pSTAT3-Y705 were absent in all cell populations.
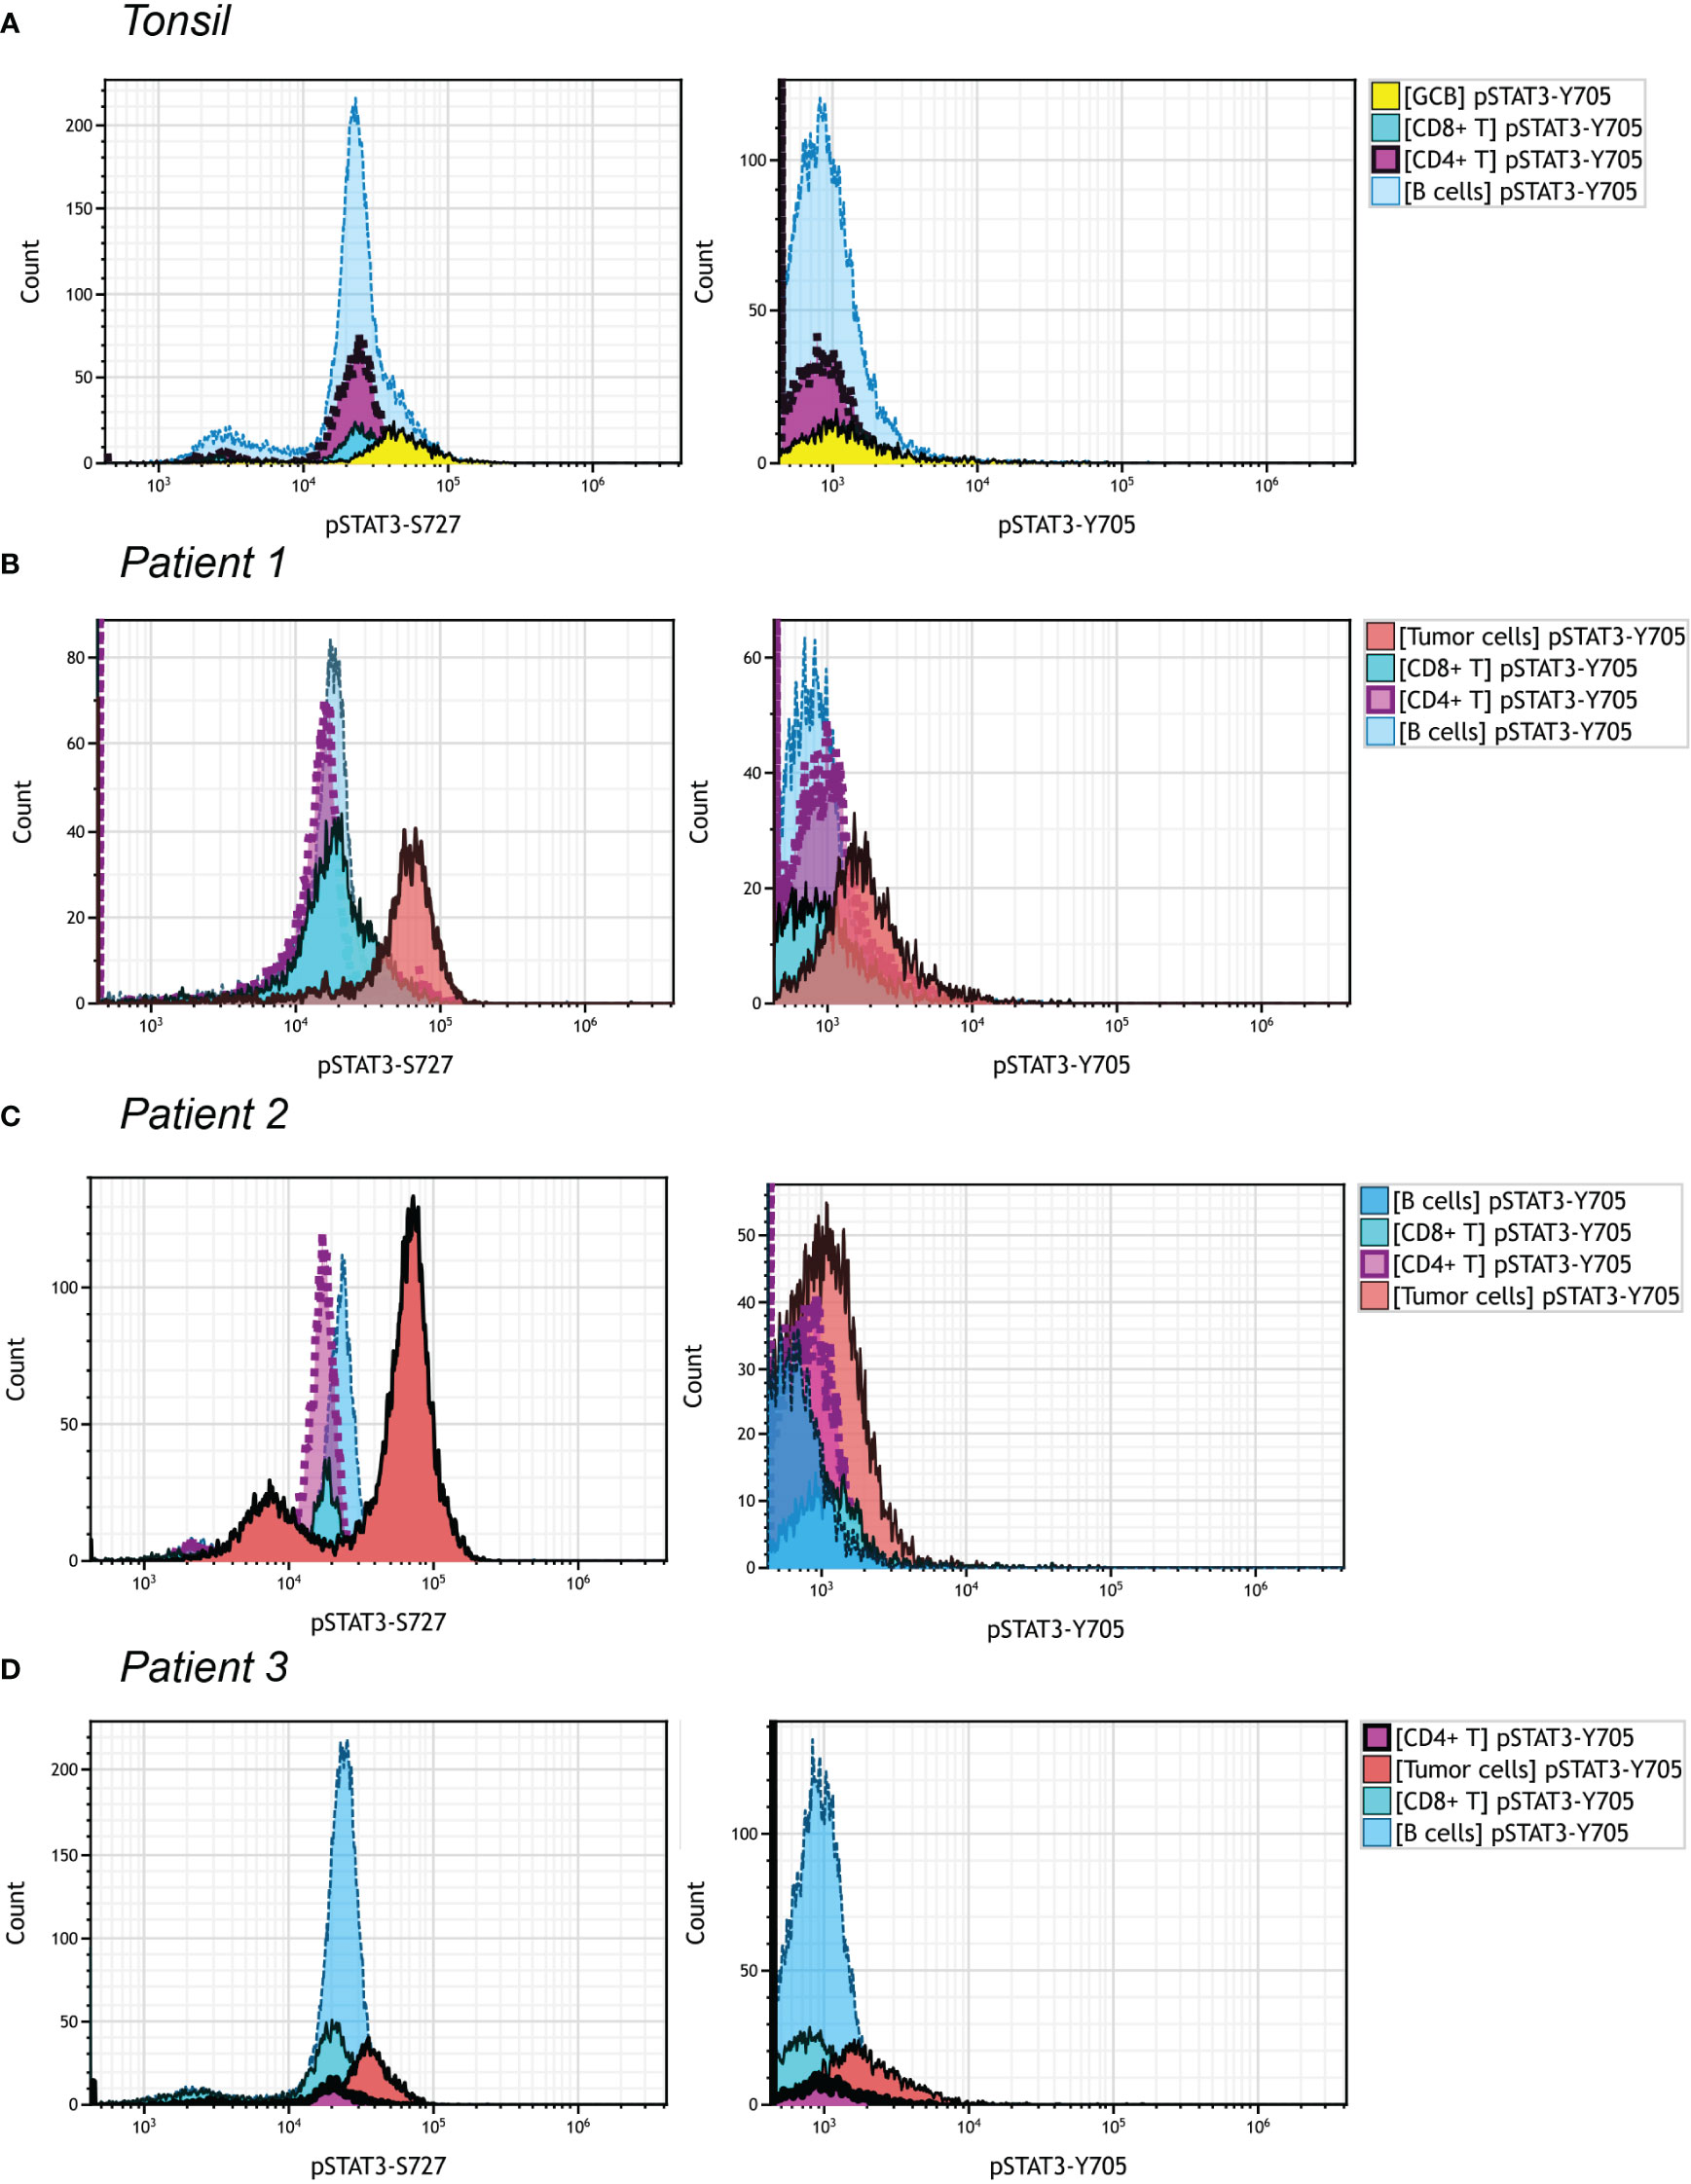
Figure 5 pSTAT3-Y705/S727 expression in PTCL, NOS by flowcytometric analysis. Different cell population was gated out as shown in Figure S3. The gate strategy of neoplastic cells in three PTCL, NOS patients was with reference to the initial immunophenotype at the time of diagnosis. (A) Histograms of pSTAT3-S727 (left) and pSTAT3-Y705 (right) expression of a tonsil sample; (B–D) Histograms of pSTAT3-S727 (left) and pSTAT3-Y705 (right) expression of Patient 1 (B), with neoplastic cell population being CD3- and CD4+, Patient 2 (C), with that being CD3bri and having enhanced FSC/SSC signals, and Patient (D), with that being CD3- and CD4+.
Discussion
The diagnostic dilemma of ALK- ALCL vs. CD30high PTCL, NOS is one of the most challenging scenarios in the daily pathology practice. Although CD30 expression in PTCL, NOS is mostly weak and heterogeneous, some cases do express CD30 diffusely (80%) and strongly. Given the morphological and immunophenotypic overlap between ALK- ALCL and PTCL, NOS, and no clinically available biomarker to differentiate them, the diagnosis between ALK- ALCL and CD30high PTCL, NOS could be challenging. We investigated whether phosphorylated STAT3 could help with the differential diagnosis and serve as a predictive biomarker by studying the expression of pSTAT3-Y705 and -S727 in 89 cases of ALK+/- ALCL and PTCL, NOS, including 10 cases of CD30high PTCL, NOS. Our results showed that pSTAT3-Y705 was more specific while pSTAT3-S727 was more sensitive in the differential diagnosis between ALK- ALCL vs. CD30high PTCL, NOS, with a relatively balanced sensitivity and specificity. Furthermore, the higher expression of pSTAT3-S727 in the TILs of PTCL, NOS was associated with a better prognosis.
Given the significance of STAT3 activation in tumorigenesis, researchers have undertaken different scoring strategies to evaluate pSTAT3 expression. However no cutoff value or scoring system has been widely accepted for the IHC staining of pSTAT3. In the present study, we used H-score, a well-established scoring system taking both staining extent and intensity into account, to assess pSTAT3-Y705 and -S727 expression. When studying the prognostic significance of pSTAT3-S727, considering the proportion of TILs in tumor areas might also affect patient prognosis, we scored S727TILs by multiplying the H-score of S727TILs by the percentage of TILs in tumor areas. However, a more concise and applicable semiquantitative scale may be needed in future clinical practice.
Despite differences in gene alterations between ALK+ ALCL and ALK- ALCL, they share some deregulated transcription factors programs like STAT3 and NOTCH1 activation, IRF4, and c-MYC overexpression (9, 26–29). STAT3 activation has been reported in ALK+ ALCL and ALK- ALCL as a well-defined oncogenic driver through different machanisms (9, 12–14, 29–31). In the present study, we found that both pSTAT3-Y705 and -S727 were diffusely expressed by tumor cells in ALCL, irrespective of ALK status; though pSTAT3-Y705 was more specific and pSTAT3-S727 is more sensitive. However, they were less frequently and variably expressed in PTCL, NOS, implying they could be reliable differential biomarkers between ALCL vs. PTCL, NOS. When narrowing down to differential diagnosis between ALK- ALCL and CD30high PTCL, NOS, considering a minority (13%) of ALK- ALCL expressing pSTAT3-Y705 in a very low level (<30%), pSTAT3-S727 appears to be a better choice, with a sensitivity of 0.86 and specificity of 0.9. Our results suggest that pSTAT3-S727 IHC staining could help distinguish ALK- ALCL from PTCL, NOS, even when CD30 is diffusely positive: if the H-score of pSTAT3-S727 expression surpasses 145, a diagnosis of ALK- ALCL is favorable. This IHC-based classifier guides the differential diagnosis between ALK- ALCL and CD30high PTCL, NOS with a sensitivity of 0.86 and specificity of 0.9, suggesting pSTAT3-S727 is a promising differential biomarker for ALK- ALCL vs. CD30high PTCL, NOS.
For what reason the STAT3 phosphorylation status in PTCL, NOS differs from ALK- ALCL remains unclear. In ALK+ ALCL, ALK kinase constitutively drives STAT3 phosphorylation (30). However, in ALK- ALCL, only ~20% of ALK- ALCLs have activate mutations of JAK1 and/or STAT3 genes (9), which could not explain the high rate of pSTAT3 positivity both in our study and other researchers’ work (17, 18, 32). Additionally, compared with ALK+/- ALCL, a lower proportion of PTCL, NOS expresses pSTAT3, reported also by other researchers (14, 18). In line with this, the mutations JAK1 and/or STAT3 was a rare event in PTCL, NOS: M. Rodríguez et al. detected JAK1/STAT3 mutations in 0/14 PTCL, NOS patients (33). However, E. Andersson et al. reported a higher rate of STAT3 mutations in PTCL, NOS in comparison with ALK- ALCL (17% vs. 13%), and a lower rate of JAK1/3 mutations (0 vs. 15%) (14). In our study, five PTCL, NOS and one ALK- ALCL cases were subjected to DNA sequencing. All patients, including those who were positive for pSTAT3-Y705 and/or pSTAT3-S727 were negative for JAK1/STAT3 mutations. The low prevalence of JAK1/STAT3 mutations makes the positivity rate vary in different studies. As of now, there is still a lack of positive association between pSTAT3 expression and JAK1/STAT3 mutations. Other signaling pathway was suggested to contribute to phosphorylation of STAT3. For example, U. Rozovski et al. reported that in chronic lymphocytic leukemia (CLL), the constitutive phosphorylation of STAT3 was induced by CK2-BLNK-CD5 complex (34). Further studies are needed to explore the mechanisms of STAT3 phosphorylation other than JAK1/STAT3 mutations.
Our results showed that pSTAT3-Y705 and -S727 in tumor cells were not prognostically predictive in ALCL patients. For PTCL, NOS patients, only the expression of S727TILs was associated prognosis: those with higher S727TILs H score tended to have a higher 3-year OS rate than those with a lower S727TILs H score (43% vs. 0%, p=0.013). This result is plausible, given that PTCL, NOS is characterized by abundant background inflammatory cells including TILs. The interplay between tumor cells and the background immune cells mediated by cytokines release or exosome intake might contribute to the poor prognosis of PTCL, NOS patients. Our results suggested that the activation of STAT3 might contribute to the prognostic significance of TILs in PTCL, NOS patients. Furthermore, we found that high S727TILs H score was enriched in PTCL, NOS patients with low MPIT risk factors compared to the low S727TILs group (data not shown, p<0.05). MPIT model had a good performance in predicting patient prognosis in our study. This suggests that S727TILs could help stratify PTCL, NOS patients with low MPIT index. However, the small sample size of the study warrants cautious interpretation of the difference in OS between the subgroups based on S727TILs H score. Larger studies are needed to confirm findings and provide more robust evidence.
The discrepancy of pSTAT3-Y705 and pSTAT3-S727 was observed in our study, with pSTAT3-Y705 expressed mainly by lymphoma cells and pSTAT3-S727 also positive in background besides lymphoma cells. This was verified in our flowcytometric analysis, where pSTAT3-S727 were constitutively positive in most T/B lymphocytes of normal tonsil and PTCL, NOS samples, and pSTAT3-Y705 were absent in all cell populations. There was still a lack of knowledge about this phenomena. As we know, the canonical IL-6/JAK signaling pathway activates STAT3 at Y705 and S727 simultaneously, and S727 phosphorylation is indispensable for STAT3 activation to its fullest extent (35). However, unlike Y705, S727 was activated also by alternative upstream signaling pathways. For example, the TLR-4 recruited TBK-1 to phosphorylate STAT3 S727 in macrophage cells (36). Additionally, S727 was phosphorylated by MAPK in embryonic stem cells (37), correlated with YAP1 in glioma (38) and PIK3K-AKT-mTOR in colorectal cancer cells (38). In summary, unlike Y705, S727 was more frequently activated by alternative upstream signaling instead of IL-6/JAK signaling, and represented an non-canonical way of STAT3 activation. Furthermore, pSTAT3-Y705 and pSTAT3-S727 might play different roles in various conditions. Liang et al. reported that only STAT3 Y705 but not S727 promoted cancer cell EMT and metastasis through slug (39). Mandal et al. reported that overexpression of CK2 reduced Stat3 S727 phosphorylation enhanced tumorigenicity, but conversely phosphorylated Stat3 Y705 in similar conditions (40). The uncoupling of Y705 and S727 was observed in Kaposi sarcoma, in which case, the viral infection exclusively induced S727 phosphorylation to foster a unique chronic inflammatory environment by activating mitogen-activated kinase-activated protein (MAPKAP) kinase 2 (MK2) chronic inflammatory (41). We still have no evidence to explain the discrepancy of Y705 and S727 in our case, however we suggested the unique tumor microenvironment consisting of unknown released cytokines and microorganisms infection like Epstein-Barr virus (EBV), could be the reasons.
In summary, we found that ALCL and PTCL, NOS show different activation status of STAT3. Based on this difference, we established an IHC classifier to help differential diagnosis between ALK- ALCL and PTCL, NOS with diffuse CD30 expression. Furthermore, we found that a higher expression of pSTAT-S727 by TILs in PTCL, NOS predicts a better prognosis.
Data availability statement
The original contributions presented in the study are included in the article/Supplementary Material. Further inquiries can be directed to the corresponding author.
Ethics statement
The studies involving human participants were reviewed and approved by the ethics committee of Affiliated Hospital of Xuzhou Medical University. Written informed consent for participation was not required for this study in accordance with the national legislation and the institutional requirements.
Author contributions
HL designed the study. CX and WW designed the study, performed the experiments, analyzed the data and drafted this manuscript. ZW, XF, CL, and JL reviewed part of the slides. LX, GL, and HS performed the IHC assays. YG, NL, DL, MF, and YW collected the clinical information of the patients. SH helped to improve the manuscript. All authors contributed to the article and approved the submitted version.
Conflict of interest
The authors declare that the research was conducted in the absence of any commercial or financial relationships that could be construed as a potential conflict of interest.
Publisher’s note
All claims expressed in this article are solely those of the authors and do not necessarily represent those of their affiliated organizations, or those of the publisher, the editors and the reviewers. Any product that may be evaluated in this article, or claim that may be made by its manufacturer, is not guaranteed or endorsed by the publisher.
Supplementary material
The Supplementary Material for this article can be found online at: https://www.frontiersin.org/articles/10.3389/fimmu.2023.1132834/full#supplementary-material
Supplementary Figure 1 | Univariate survival analysis for PTCL, NOS patients with different clinical or pathological risk factors.
Supplementary Figure 2 | Kaplan-Meier plot for PTCL, NOS patients according to Ann Arbor staging system, International Prognostic Index (IPI), Prognostic Index for PTCL, NOS (PIT), and International PTCL Project (IPTCLP).
Supplementary Figure 3 | Gating strategy of the tonsil and three PTCL, NOS samples in .
References
1. Stein H, Mason DY, Gerdes J, O’Connor N, Wainscoat J, Pallesen G, et al. The expression of the hodgkin’s disease associated antigen ki-1 in reactive and neoplastic lymphoid tissue: evidence that reed-sternberg cells and histiocytic malignancies are derived from activated lymphoid cells. Blood (1985) 66:848–58. doi: 10.3390/cancers12030702
2. Thompson MA, Stumph J, Henrickson SE, Rosenwald A, Wang Q, Olson S, et al. Differential gene expression in anaplastic lymphoma kinase-positive and anaplastic lymphoma kinase-negative anaplastic large cell lymphomas. Hum Pathol (2005) 36:494–504. doi: 10.1016/j.humpath.2005.03.004
3. Amador C, Feldman AL. How I diagnose anaplastic Large cell lymphoma. Am J Clin Pathol (2021) 155:479–97. doi: 10.1093/ajcp/aqab012
4. Swerdlow SH, Campo E, Pileri SA, Harris NL, Stein H, Siebert R, et al. The 2016 revision of the world health organization classification of lymphoid neoplasms. Blood (2016) 127:2375–90. doi: 10.1182/blood-2016-01-643569
5. Vega F, Medeiros LJ. A suggested immunohistochemical algorithm for the classification of T-cell lymphomas involving lymph nodes. Hum Pathol (2020) 102:104–16. doi: 10.1016/j.humpath.2020.05.006
6. Piccaluga PP, Fuligni F, De Leo A, Bertuzzi C, Rossi M, Bacci F, et al. Molecular profiling improves classification and prognostication of nodal peripheral T-cell lymphomas: results of a phase III diagnostic accuracy study. J Clin Oncol Off J Am Soc Clin Oncol (2013) 31:3019–25. doi: 10.1200/JCO.2012.42.5611
7. Agnelli L, Mereu E, Pellegrino E, Limongi T, Kwee I, Bergaggio E, et al. Identification of a 3-gene model as a powerful diagnostic tool for the recognition of ALK-negative anaplastic large-cell lymphoma. Blood (2012) 120:1274–81. doi: 10.1182/blood-2012-01-405555
8. Savage KJ, Harris NL, Vose JM, Ullrich F, Jaffe ES, Connors JM, et al. ALK- anaplastic large-cell lymphoma is clinically and immunophenotypically different from both ALK+ ALCL and peripheral T-cell lymphoma, not otherwise specified: report from the international peripheral T-cell lymphoma project. Blood (2008) 111:5496–504. doi: 10.1182/blood-2008-01-134270
9. Crescenzo R, Abate F, Lasorsa E, Tabbo’ F, Gaudiano M, Chiesa N, et al. Convergent mutations and kinase fusions lead to oncogenic STAT3 activation in anaplastic large cell lymphoma. Cancer Cell (2015) 27:516–32. doi: 10.1016/j.ccell.2015.03.006
10. Zhang Y, Lee D, Brimer T, Hussaini M, Sokol L. Genomics of peripheral T-cell lymphoma and its implications for personalized medicine. Front Oncol (2020) 10:898. doi: 10.3389/fonc.2020.00898
11. Uchihara Y, Komori R, Tago K, Tamura H, Funakoshi-Tago M. Methotrexate significantly induces apoptosis by inhibiting STAT3 activation in NPM-ALK-positive ALCL cells. Biochem Pharmacol (2019) 170:113666. doi: 10.1016/j.bcp.2019.113666
12. Schiefer A-I, Vesely P, Hassler MR, Egger G, Kenner L. The role of AP-1 and epigenetics in ALCL. Front Biosci (Schol Ed) (2015) 7:226–35. doi: 10.2741/S436
13. Laurent C, Nicolae A, Laurent C, Le Bras F, Haioun C, Fataccioli V, et al. Gene alterations in epigenetic modifiers and JAK-STAT signaling are frequent in breast implant-associated ALCL. Blood (2020) 135:360–70. doi: 10.1182/blood.2019001904
14. Andersson EI, Brück O, Braun T, Mannisto S, Saikko L, Lagström S, et al. STAT3 mutation is associated with STAT3 activation in CD30(+) ALK(-) ALCL. Cancers (Basel) (2020) 12. doi: 10.3390/cancers12030702
15. Chiarle R, Voena C, Ambrogio C, Piva R, Inghirami G. The anaplastic lymphoma kinase in the pathogenesis of cancer. Nat Rev Cancer (2008) 8:11–23. doi: 10.1038/nrc2291
16. Schleussner N, Merkel O, Costanza M, Liang H-C, Hummel F, Romagnani C, et al. The AP-1-BATF and -BATF3 module is essential for growth, survival and TH17/ILC3 skewing of anaplastic large cell lymphoma. Leukemia (2018) 32:1994–2007. doi: 10.1038/s41375-018-0045-9
17. Khoury JD, Medeiros LJ, Rassidakis GZ, Yared MA, Tsioli P, Leventaki V, et al. Differential expression and clinical significance of tyrosine-phosphorylated STAT3 in ALK+ and ALK- anaplastic large cell lymphoma. Clin Cancer Res an Off J Am Assoc Cancer Res (2003) 9:3692–9.
18. Han JJ, O’byrne M, Stenson MJ, Maurer MJ, Wellik LE, Feldman AL, et al. Prognostic and therapeutic significance of phosphorylated STAT3 and protein tyrosine phosphatase-6 in peripheral-T cell lymphoma. Blood Cancer J (2018) 8:110. doi: 10.1038/s41408-018-0138-8
19. van Dongen JJM, Lhermitte L, Böttcher S, Almeida J, van der Velden VHJ, Flores-Montero J, et al. EuroFlow antibody panels for standardized n-dimensional flow cytometric immunophenotyping of normal, reactive and malignant leukocytes. Leukemia (2012) 26:1908–75. doi: 10.1038/leu.2012.120
20. Ma D, Ma Y, Ma Y, Liu J, Gu Y, Liu N, et al. Molecular subtyping of CD5+ diffuse large b-cell lymphoma based on DNA-targeted sequencing and Lymph2Cx. Front Oncol (2022) 12:941347. doi: 10.3389/fonc.2022.941347
21. Vose JM, Project TIP. International peripheral T-cell lymphoma (PTCL) clinical and pathologic review project: poor outcome by prognostic indices and lack of efficacy with anthracyclines. Blood (2005) 106:811. doi: 10.1182/blood.V106.11.811.811
22. Gallamini A, Stelitano C, Calvi R, Bellei M, Mattei D, Vitolo U, et al. Peripheral T-cell lymphoma unspecified (PTCL-u): a new prognostic model from a retrospective multicentric clinical study. Blood (2004) 103:2474–9. doi: 10.1182/blood-2003-09-3080
23. Went P, Agostinelli C, Gallamini A, Piccaluga PP, Ascani S, Sabattini E, et al. Marker expression in peripheral T-cell lymphoma: a proposed clinical-pathologic prognostic score. J Clin Oncol Off J Am Soc Clin Oncol (2006) 24:2472–9. doi: 10.1200/JCO.2005.03.6327
24. Sugio T, Miyawaki K, Kato K, Sasaki K, Yamada K, Iqbal J, et al. Microenvironmental immune cell signatures dictate clinical outcomes for PTCL-NOS. Blood Adv (2018) 2:2242–52. doi: 10.1182/bloodadvances.2018018754
25. Amador C, Greiner TC, Heavican TB, Smith LM, Galvis KT, Lone W, et al. Reproducing the molecular subclassification of peripheral T-cell lymphoma-NOS by immunohistochemistry. Blood (2019) 134:2159–70. doi: 10.1182/blood.2019000779
26. Weilemann A, Grau M, Erdmann T, Merkel O, Sobhiafshar U, Anagnostopoulos I, et al. Essential role of IRF4 and MYC signaling for survival of anaplastic large cell lymphoma. Blood (2015) 125:124–32. doi: 10.1182/blood-2014-08-594507
27. Falini B, Fizzotti M, Pucciarini A, Bigerna B, Marafioti T, Gambacorta M, et al. A monoclonal antibody (MUM1p) detects expression of the MUM1/IRF4 protein in a subset of germinal center b cells, plasma cells, and activated T cells. Blood (2000) 95:2084–92.
28. Jundt F, Anagnostopoulos I, Förster R, Mathas S, Stein H, Dörken B. Activated Notch1 signaling promotes tumor cell proliferation and survival in Hodgkin and anaplastic large cell lymphoma. Blood (2002) 99:3398–403. doi: 10.1182/blood.v99.9.3398
29. Chiarle R, Simmons WJ, Cai H, Dhall G, Zamo A, Raz R, et al. Stat3 is required for ALK-mediated lymphomagenesis and provides a possible therapeutic target. Nat Med (2005) 11:623–9. doi: 10.1038/nm1249
30. Zamo A, Chiarle R, Piva R, Howes J, Fan Y, Chilosi M, et al. Anaplastic lymphoma kinase (ALK) activates Stat3 and protects hematopoietic cells from cell death. Oncogene (2002) 21:1038–47. doi: 10.1038/sj.onc.1205152
31. Prutsch N, Gurnhofer E, Suske T, Liang HC, Schlederer M, Roos S, et al. Dependency on the TYK2/STAT1/MCL1 axis in anaplastic large cell lymphoma. Leukemia (2019) 33:696–709. doi: 10.1038/s41375-018-0239-1
32. Wang J-C, Zhong L-H, Lin W-Q, Zhang W-F, Xi Y-F, Liu Y-P, et al. JAK/STAT3 signaling activation related to distinct clinicopathologic features in systemic ALK - anaplastic Large cell Lymphomas : new insights into their heterogeneity. Am J Surg Pathol (2023) 47:55–64. doi: 10.1097/PAS.0000000000001995
33. Rodríguez M, Alonso-Alonso R, Tomás-Roca L, Rodríguez-Pinilla SM, Manso-Alonso R, Cereceda L, et al. Peripheral T-cell lymphoma: molecular profiling recognizes subclasses and identifies prognostic markers. Blood Adv (2021) 5:5588–98. doi: 10.1182/bloodadvances.2021005171
34. Rozovski U, Harris DM, Li P, Liu Z, Jain P, Veletic I, et al. Constitutive phosphorylation of STAT3 by the CK2-BLNK-CD5 complex. Mol Cancer Res (2017) 15:610–8. doi: 10.1158/1541-7786.MCR-16-0291
35. Johnston PA, Sen M, Hua Y, Camarco DP, Shun TY, Lazo JS, et al. High content imaging assays for IL-6-Induced STAT3 pathway activation in head and neck cancer cell lines. Methods Mol Biol (2018) 1683:229–44. doi: 10.1007/978-1-4939-7357-6_14
36. Balic JJ, Albargy H, Luu K, Kirby FJ, Jayasekara WSN, Mansell F, et al. STAT3 serine phosphorylation is required for TLR4 metabolic reprogramming and IL-1β expression. Nat Commun (2020) 11:3816. doi: 10.1038/s41467-020-17669-5
37. Peron M, Dinarello A, Meneghetti G, Martorano L, Betto RM, Facchinello N, et al. Y705 and S727 are required for the mitochondrial import and transcriptional activities of STAT3, and for regulation of stem cell proliferation. Development (2021) 148. doi: 10.1242/dev.199477
38. Sang W, Xue J, Su L-P, Gulinar A, Wang Q, Zhai Y-Y, et al. Expression of YAP1 and pSTAT3-S727 and their prognostic value in glioma. J Clin Pathol (2021) 74:513–21. doi: 10.1136/jclinpath-2020-206868
39. Liang F, Ren C, Wang J, Wang S, Yang L, Han X, et al. The crosstalk between STAT3 and p53/RAS signaling controls cancer cell metastasis and cisplatin resistance via the Slug/MAPK/PI3K/AKT-mediated regulation of EMT and autophagy. Oncogenesis (2019) 8:59. doi: 10.1038/s41389-019-0165-8
40. Mandal T, Bhowmik A, Chatterjee A, Chatterjee U, Chatterjee S, Ghosh MK. Reduced phosphorylation of Stat3 at ser-727 mediated by casein kinase 2 - protein phosphatase 2A enhances Stat3 tyr-705 induced tumorigenic potential of glioma cells. Cell Signal (2014) 26:1725–34. doi: 10.1016/j.cellsig.2014.04.003
Keywords: anaplastic large cell lymphoma, periphearal T cell lymphoma, not otherwise specified, CD30, pSTAT3
Citation: Xiang C, Wu W, Fan M, Wang Z, Feng X, Liu C, Liu J, Liu G, Xia L, Si H, Gu Y, Liu N, Luo D, Wang Y, Ma D, Hu S and Liu H (2023) Phosphorylated STAT3 as a potential diagnostic and predictive biomarker in ALK- ALCL vs. CD30high PTCL, NOS. Front. Immunol. 14:1132834. doi: 10.3389/fimmu.2023.1132834
Received: 28 December 2022; Accepted: 01 June 2023;
Published: 14 June 2023.
Edited by:
Jiakai Hou, University of Houston, United StatesReviewed by:
Maria Raffaella Ambrosio, University of Siena, ItalyLingman Ma, China Pharmaceutical University, China
Copyright © 2023 Xiang, Wu, Fan, Wang, Feng, Liu, Liu, Liu, Xia, Si, Gu, Liu, Luo, Wang, Ma, Hu and Liu. This is an open-access article distributed under the terms of the Creative Commons Attribution License (CC BY). The use, distribution or reproduction in other forums is permitted, provided the original author(s) and the copyright owner(s) are credited and that the original publication in this journal is cited, in accordance with accepted academic practice. No use, distribution or reproduction is permitted which does not comply with these terms.
*Correspondence: Hui Liu, hliu@xzhmu.edu.cn
†These authors have contributed equally to this work