A Dissolved Gas Assessment Model for Power Transformers According to Weighted Association Rule Mining
 Chenhao Sun
 Zhuoyu Zhou2
  Yongxi Zhang
 Zhiwei Jia
 Chenyang Huang
- 1Key Laboratory of Renewable Energy Electric-Technology of Hunan Province, Changsha University of Science and Technology, Changsha, China
- 2School of Electrical and Information Engineering, Changsha University of Science and Technology, Changsha, China
- 3Northeast Branch of State Grid Corporation of China, Shenyang, China
As one indispensable part of power systems, the reliable-operated power transformers are vital for energy transmission, whereas they are remarkably threatened by potential fault events. To achieve the satisfying and valid operation of power transformers, any fault events that may impact their health ought to be evaluated and early warned. With such motivations, this paper presents original insights on the assessment of power transmission health states via their internal dissolved gas, and an enhanced Association Rule Mining (ARM) model incorporating the analysis of High-Impact-Low-Probability (HILP) components, as well as a dynamic fault event risk evaluation approach, is proposed. The first step is to differentiate the risky components. Unlike the standard ARM, the rarely occurred components in each feature can also be assessed explicitly as the common components to explore the underlying HILP components in the proposed model, rather than just being viewed as trivial data and directly omitted. The second step is to rate the risk level of each risky component. A component importance measure-based evaluation approach is deployed to assess the corresponding risk weights of distinguished risky components. In this approach, the risk weight is determined straightforwardly via the impacts of each component on the variation level of total risks in the system, rather than simply by its frequency of occurrence or data share. Finally, the parameters of the risk weight evaluation approach can be dynamically adapted in an adjustment framework as well. This model is testified through an empirical case study, and the leading results can demonstrate its flexibility and robustness during real applications.
Introduction
As one core part of power systems, power transformers are one key primary equipment, since their failure may cause power supply interruption and even blackouts which will result in significant economic losses. Ergo, it is vital to ensure the safe operation of power transformers. Any transformer failure may lead to the interruption of power supplies, which will consequently cause great losses (Cui et al., 2021; Zhang et al., 2021). Power transformers are usually affected by several inner factors such as thermal stress, overload, and aging of insulating materials. Therefore, the timely and effective fault diagnosis based on these internal characteristics of transformers will be salutary for the subsequent maintenance. Once the countermeasures are implemented, the potential risks of failure can thus be greatly reduced (Lijun et al., 2021; Meira et al., 2021).
Unlike the electrical signal parameters which are largely affected by the electromagnetic environment within the transformer, there is also a strong correlation between the fault event and the gas composition in transformer oil. Therefore, dissolved gas analysis (DGA) is commonly utilized for transformer fault diagnoses (Cui et al., 2020; Meira et al., 2021).
At present, many researchers have proposed a large number of research ideas on the DGA (Bakar et al., 2014), and considerable progress has been achieved. In the traditional methods, the three-ratio method, the Rogers ratio method, and the Duval triangle method based on the DGA have played an important role, but there are still some drawbacks such as the incomplete state coding and the absolutely coding boundaries. They might limit the practical application of these approaches (Malik and Mishra, 2016; Shi et al., 2016).
In recent years, many scholars have applied machine learning theories to transformer fault diagnosis modeling, and have achieved satisfying results. The first one is the DGA method based on the optimization algorithm (Asafuddoula et al., 2018). To improve the accuracy and reliability of oil-immersed transformer fault diagnosis, References (Youwen et al., 2021; Wu et al., 2021) studied a transformer fault diagnosis method based on genetic algorithm optimization of extreme gradient lifting, and Siada et al. employed fuzzy logic models to assess the concentration of each sort of the dissolved gas in (Abu Bakar and Abu- Siada, 2017), or to reduce the dependency for standardizing the DGA interpretation techniques by (Abu- Siada et al., 2013). In (Huanpeng et al., 2017), the Least Squares Dual Support Vector Machine (LS-TSVM) model was deployed. Based on the genetic algorithm, and Genetic Algorithm Support Vector Machine (GA-SVM) along with the crisscross optimization method for the DGA feature was realized in (Anbo et al., 2016; Jing et al., 2020). These DGA methods based on the optimization algorithm can often obtain the intuitive fault probability, but it is necessary to count the large-capacity data for a long period, which requires a larger size of input data.
The second type is the DGA method using the neural network (Jan and Verma, 2021). In (Yingjie and Tienan, 2021), a diagnosis method based on the improved Elman neural network was proposed. In order to improve the accuracy and performance under small sample data scenarios, a method based on the residual BP neural network was established in reference (Wenqing et al., 2020). In (Yan and Taihua, 2020), an optimized probabilistic neural network fault diagnosis method based on digital twinning technology was proposed. A transformer condition assessment method based on fuzzy neural network and local statistics was built in reference (Rigatos and Siano, 2016). The DGA method based on neural networks generally has strong stability and fault tolerance, but they also require large-capacity input data generally.
The third one is the DGA method based on the vector machine (Moazami et al., 2016). Reference (Yiyi et al., 2018) proposed a transformer fault diagnosis model based on the support vector machine (SVM) which was optimized by the imperial colonial competition algorithm, and Rao et al. selected non-linear SVM to classify diverse types of power transformer faults by (Rao et al., 2021). In (Jun et al., 2017), the AdaBoost algorithm was combined with the quadratic mapping support vector machine to find a transformer fault diagnosis model. References (Bacha et al., 2012; Xinbo et al., 2020) applied the support vector machine to realize the classification and discrimination of transformer faults. Although the results of the DGA method based on the vector machine are generally or close to the global optimization, it is difficult to solve the multi-classification problems.
To handle these, association rule mining (ARM) (Nahar et al., 2013) is often exploited in the DGA method because it can select input features or states according to requirements. In (Li et al., 2015), the diagnosis model is further optimized based on the grid search (GS) algorithm. An integrated algorithm combining the set pair analysis and the ARM was created by (Sheng et al., 2018). In (Tian -en et al., 2019), the probabilistic image model was applied in the ARM to further improve the efficiency. Remarkable achievements have been made in the literature, whereas there are still some improvable aspects. Firstly, the standard ARM algorithms usually deploy a fixed and uniform importance measure criterion, thus some components with a lower frequency of occurrence will be directly screened out without any assessment. However, there might also be some high-impact (HI) components that can cause failures in these low-probability components, hence these high-risk- low-probability (HILP) components should be extracted and analyzed; Secondly, the risk weight of the selected HI components ought to be determined directly by the risks they generate, rather than simply via their frequency of occurrence; Finally, the predefined parameters in the ARM need to be adjusted or modified during the diagnosis to further enhance the performance.
To realize these, this paper proposes a DGA method based on an improved Weighted Association Rule Mining (WARM) model. In the preprocessing step, the assessment mapping space is established for collecting and integrating all the input data. In this model, the first step is to explore the risky components from the whole input components. The calculation methods of several significance selecting criteria are modified to pick out the HILP components, so that the HILP data can be extracted from the rare data for further analysis along with the HI components which are chosen from the common components. The second step is to evaluate the risk level of the distinguished risky components from the first step, and a risk weight evaluation approach is proposed in light of the component importance measure (CIM). In this model, the influence degree of the HI and the HILP components themselves on the variation level of total reliability of a transformer, rather than the proportion in a database or the frequency of appearance, is incorporated to measure the risk weights. At last, a dynamic adjustment framework is established where the parameters in the risk weight evaluation approach can be periodically adapted and amended in line with the previous diagnosis performance. An empirical case study is conducted, and the results demonstrate that the proposed method can improve diagnostic accuracy, operational efficiency, and reliability during real-world applications.
Data Preprocessing
In order to construct a unified processing space for subsequent analysis, the whole collected fault event records, as well as the relevant features and including components need to be integrated.
Suppose
As for the target feature
Based on the above assumptions, the assessment mapping space can be constructed as a matrix form
where each row (except the first row) indicates one record of a fault event,
WARM Model
Background of ARM
Assuming that there is a set
The establishment of association rules generally depends on the discovery of the large item sets as well as the frequent rules, and the selection criteria for them are called the significance selecting criteria. The most commonly-used significance selecting criterion is called the support
Refinement of Significance Selecting Criteria
Among the input components, there are often some that occur less frequently. However, a part of these rare feature quantity values will also lead to transformer failures, then cause serious losses. Therefore, those HILP components cannot be simply ignored. The standard ARM algorithm employs the same and fixed score calculation methods of significance selecting criteria, which makes the rare variables be discarded directly without any analyses. Therefore, based on the standard significance selecting criteria, this paper designs the weighted significance selecting criteria that consider the rare variables.
In the ARM, large item sets and frequent rules are filtered by a uniform calculation approach which results in the dominance of common components that account for a large proportion of the database. In other words, rare components along with the HILP components will be screened out. In order to properly handle these rare data, this paper establishes four weighted significance selecting criteria.
Firstly, an association rule can be redefined as:
where
If the association rule contains at least one rare element in a feature
where
Establishment of Risk Weight Evaluation Model
Since different components in each feature have different impacts on the states of a transformer, further investigation of the relative magnitude of the risk weight of each component is indispensable. In most current studies, the evaluation of risk weights relies on the proportion in a database or the frequency of occurrence. However, they are not equal to the influence of a component on the state of the entire transformer. Therefore, the relative risk weights of each component are determined based on the degree of influence on the transformer itself in this paper.
This paper describes the overall fault risk of a transformer based on the system risk structure theory, and the principle of the CIM is utilized to describe the impact of different components, so as to design the risk weight evaluation model. For the purpose of distinguishing the relative risk weights of rare components, this paper forms two independent processing subspaces of
The CIM can measure the impact of each component on the overall risks. In this paper, the risk of a component, that is, the risk of an element
where
Similarly, the risk reduction worth (RRW) (Vesely et al., 1983) represents the relative decline in the overall risk if the element
where
In a fault record, even if a component changes, this fault may no longer occur. Ergo, the occurrence of the fault requires that all the corresponding elements of each feature in this record are confirmed to be relevant. Based on this, the mathematical form of the overall risk can be written as:
In this paper, the relative risk weight of an element
where
The mathematical expression of
This paper selects the mean value of the impact of formula (7-8) to measure the risk from rare elements, so
where
Formation of Adjustment Framework
During the application of the diagnosis method, the occurrence of failures varies in different periods. Moreover, with the increase in application time, the parameters ought to be adjusted according to the previous performance to further improve the accuracy of weight evaluations.
In this paper, 1 year is supposed as a research cycle. Therefore, let
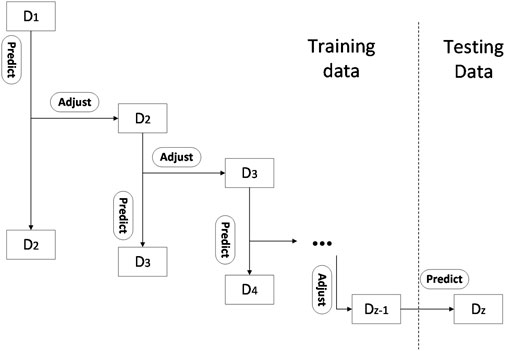
FIGURE 1. An illustration of dynamic parameter adjustment framework.
To start with, the initial parameters can be determined from the previous knowledge or engineering experiences. Next, the parameters will be amended in line with the diagnosis performance of the previous cycle. If the actual number of faults in the investigated system is higher than the predicted number of faults according to the comparison between the predicted results and the actual consequences at the end of a year
Empirical Case Study
Database
In this case study, the transformer maintenance records from a high-voltage transmission system in a central province of China are selected as input data. The total number of sample records is 1,564 which covers the contents of five gases (H2, CH4, C2H2, C2H4, C2H6) and relative gas production rates of two (CO, CO2). Seven states of a transformer (normal operation, low temperature overheating, medium temperature overheating, high temperature overheating, low energy discharge, high energy discharge, and partial discharge) are incorporated as the target.
Validation Tools
In this paper, two 10-fold cross-validation test cases are generated: the general case which is conducted separately according to all states of a transformer; the state case that studies the individual influence of the events by each kind of the state.
When comparing the diagnosis results with the test data, the receiver operating characteristic (ROC) and the precision-recall (PR) curves are deployed to validate the performance (Ziege, 2012). On the basis of these two curves, the area under the curve (AUC) (Swets, 2016) is implemented as the performance indicator, and the higher the AUC value is, the more accurate the diagnosis will be.
General Case
In the very beginning, this paper takes all types of transformer faults as a whole, and applies the WARM-based DGA method to diagnose whether the transformer is faulty or not, i.e., the transformer has only two states: faulty and normal operation.
To verify the effectiveness of both the significance selecting and risk weight evaluation enhancements in the proposed WARM model, two standard ARM algorithms are taken for comparison: the Relim and the Apriori methods. These two algorithms are different in item searching, recording, and sorting, whereas sharing similar procedures in significance selecting and weight evaluation steps. In that case, two DGA techniques (WARM(Relim), WARM(Apriori)) that adopt the improved significance selecting criteria and risk weight evaluation model but apply the Relim and the Apriori algorithms, respectively, will be compared with the two standard forms (WARM(Relim), ARM(Apriori)). The comparison of the ROC and PR curves of these DGA methods are shown in Figure 2.
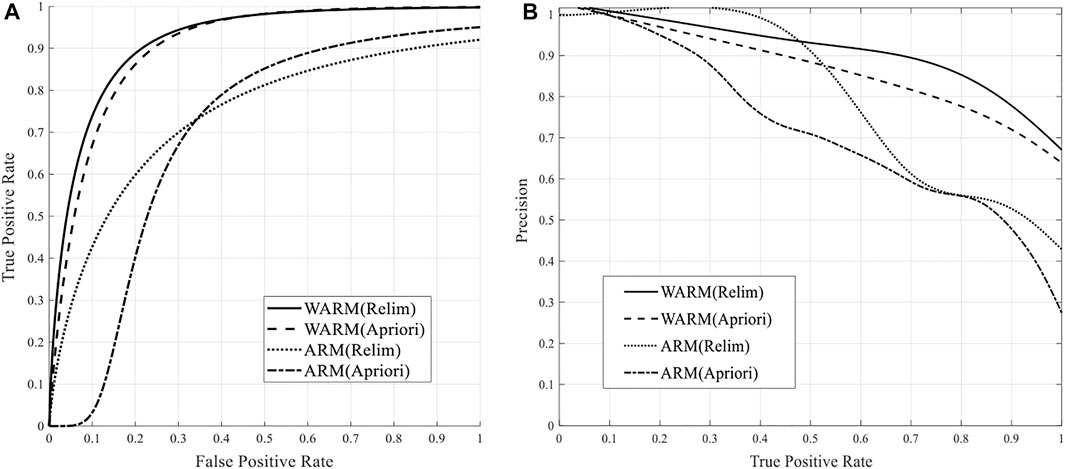
FIGURE 2. Performance comparison of general case: (A) ROC, (B) PR.
It can be concluded from Figure 2 that the WARM method which is based on the refined significance selecting criteria and risk weight evaluation model can achieve more accurate transformer fault diagnoses than the ARM model. It can be concluded that the accuracy of the results obtained by the Relim and the Apriori algorithms is relatively close. That is, these two algorithms cannot notably improve the diagnosis precision compared with each other. However, compared with the DGA method based on the ARM, the AUC of the ROC and PR curves of both two algorithms with the WARM model is raised by 19.6 and 14.1% on average. This indicates that the proposed WARM model can successfully enhance the diagnostic performance for either one of the two algorithms.
State Case
Next, the separate diagnoses of all the seven states are carried out, and the comparison is illustrated in Figure 3, where NO-normal operation, LTO-low temperature overheating, MTO-medium temperature overheating, HTO-high temperature overheating, LED-low energy discharge, HED-high energy discharge, and PD-partial discharge are applied.
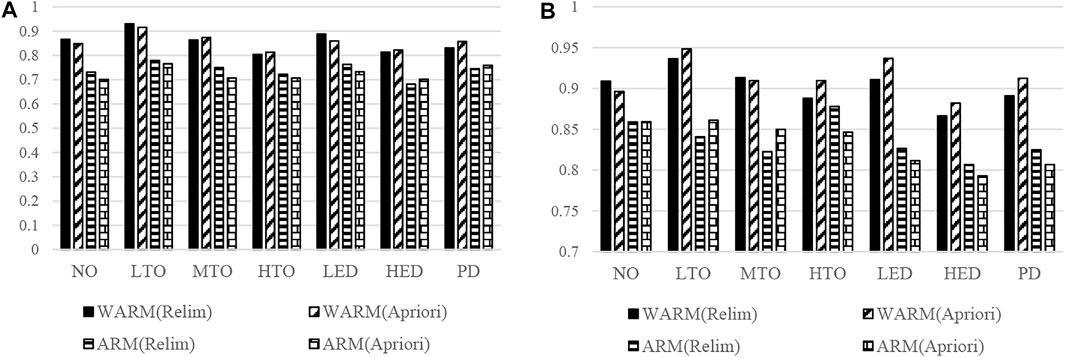
FIGURE 3. Performance comparison of state case by AUC statistics: (A) ROC, (B) PR.
From Figure 3, the enhancements in diagnoses performance can be achieved via the significance selecting and risk weight evaluation in the WARM model for all the seven transformer conditions. Among them, the diagnosis of the LTO is the most precise one whereas the HED gets the lowest scores in both two evaluations. According to the input database, the HED events seldom happen in recent years while the LTO is one most frequent events. This is in line with the different data volumes of each transformer state, so as the performance. Nevertheless, the significant enhancement of the HED is conducted through the WARM model. Ergo, the benefits of the WARM can be verified especially when the input data is limited. Furthermore, the WARM-based method is also able to operate during some extreme scenarios.
Conclusion
For the purpose of handling some limitations in the standard ARM-based DGA method, such as ignorance of the HILP data, the simple evaluation of risk, and the static parameters during applications, this paper proposes an enhanced WARM-based DGA technique. The main works can be summarized as:
1) In the first step, the risky components ought to be distinguished from the whole input data. Unlike the common components, the rarely distributed components are generally viewed as trivial components and simply discarded. Nonetheless, some HILP components which may also cause fault events should be extracted from the rare components. To this end, the calculation approach of four significance selecting criteria is rebuilt, and the records with any rare component of each feature will be explored once again to decide the HILP components according to the different distributions of rare components in every feature. This can improve the diagnostic accuracy and cover some potential extreme situations during applications;
2) In the second step, the risk level of each risky component will be assessed. In real scenarios, the correlation between a component and the fault event risk is not simply equal to its percentage in the database or frequency of occurrence. That is, a frequent component may not be a risky one whereas a rare component might be a risky one. Ergo, based on CIM, the risk weight of each extracted HI or HILP component can be measured straightforwardly according to the corresponding impact on the variation direction and amounts of the overall risks of a transformer, rather than simply by the frequency of appearance or the data share;
3) During applications, the predefined default parameters might not be suitable or optimal within different scenes or periods. In this paper, these parameters will be modified or adapted in accordance with the previous diagnostic performance, and can thus further improve the accuracy, especially within dissimilar conditions in future periods.
The results of an empirical study validate that the proposed DGA method can ameliorate the precision, practicability, and efficiency within real scenarios.
Data Availability Statement
The datasets presented in this article are not readily available because secrecy agreement. Requests to access the datasets should be directed to State Grid of China.
Author Contributions
CS: Conceptualization, Methodology, Software, Writing; ZZ: Data curation; YZ: Investigation; ZJ: Supervision; JH: Validation; CH: Reviewing.
Funding
This work is financially supported by Key Laboratory of Renewable Energy Electric-Technology of Hunan Province, Grant No: 2020ZNDL006.
Conflict of Interest
Author CH is employed by the Northeast Branch of State Grid Corporation.
The remaining authors declare that the research was conducted in the absence of any commercial or financial relationships that could be construed as a potential conflict of interest.
Publisher’s Note
All claims expressed in this article are solely those of the authors and do not necessarily represent those of their affiliated organizations, or those of the publisher, the editors and the reviewers. Any product that may be evaluated in this article, or claim that may be made by its manufacturer, is not guaranteed or endorsed by the publisher.
References
Abu Bakar, N., and Abu-Siada, A. (2017). A New Method to Detect Dissolved Gases in Transformer Oil Using NIR-IR Spectroscopy. IEEE Trans. Dielect. Electr. Insul. 24 (1), 409–419. doi:10.1109/tdei.2016.006025
Abu-Siada, A., Hmood, S., and Islam, S. (2013). A New Fuzzy Logic Approach for Consistent Interpretation of Dissolved Gas-In-Oil Analysis. IEEE Trans. Dielect. Electr. Insul. 20 (6), 2343–2349. doi:10.1109/tdei.2013.6678888
Anbo, M., Haiming, L., and Zhuangzhi, G. (2016). Fault Diagnosis Method of Transformer Based on Crisscross Optimization Algorithm and Fuzzy Clustering[J]. Electr. Meas. Instrum. 53 (13), 25–29. doi:10.3969/j.issn.1001-1390.2016.13.006
Asafuddoula, M., Verma, B., and Zhang, M. (2018). A Divide-and-Conquer-Based Ensemble Classifier Learning by Means of Many-Objective Optimization. IEEE Trans. Evol. Comput. 22 (5), 762–777. doi:10.1109/tevc.2017.2782826
Bacha, K., Souahlia, S., and Gossa, M. (2012). Power Transformer Fault Diagnosis Based on Dissolved Gas Analysis by Support Vector Machine. Electr. Power Syst. Res. 83 (1), 73–79. doi:10.1016/j.epsr.2011.09.012
Bakar, N., Abu-Siada, A., and Islam, S. (2014). A Review of Dissolved Gas Analysis Measurement and Interpretation Techniques. IEEE Electr. Insul. Mag. 30 (3), 39–49. doi:10.1109/mei.2014.6804740
Cui, H., Yang, L., Zhu, Y., Li, S., Abu-Siada, A., and Islam, S. (2020). A Comprehensive Analyses of Aging Characteristics of Oil-Paper Insulation System in HVDC Converter Transformers. IEEE Trans. Dielect. Electr. Insul. 27 (5), 1707–1714. doi:10.1109/tdei.2020.008788
Cui, H., Yang, L., Zhu, Y., Li, S., Abu-Siada, A., and Islam, S. (2021). Dissolved Gas Analysis for Power Transformers within Distributed Renewable Generation-Based Systems. IEEE Trans. Dielect. Electr. Insul. 28 (4), 1349–1356. doi:10.1109/tdei.2021.009490
Doostan, M., and Chowdhury, B. H. (2017). Power Distribution System Fault Cause Analysis by Using Association Rule Mining. Electr. Power Syst. Res. 152 (1), 140–147. doi:10.1016/j.epsr.2017.07.005
Hipp, J., Güntzer, U., and Nakhaeizadeh, G. (2000). Algorithms for Association Rule Mining - a General Survey and Comparison. SIGKDD Explor. Newsl. 2 (1), 58–64. doi:10.1145/360402.360421
Huanpeng, C., Shu, H., and Qiuli, N. (2017). Fault Diagnosis of Power Transformer Based on RELS-TSVM and DGA[J]. Power Syst. Prot. Control 45 (21), 134–139. doi:10.7667/PSPC161753
Jan, Z., and Verma, B. (2021). Multicluster Class-Balanced Ensemble. IEEE Trans. Neural Netw. Learn. Syst. 32 (3), 1014–1025. doi:10.1109/tnnls.2020.2979839
Jing, W., Su-an, X., Kai-xing, H., Ce, W., Yong, L., Xing, C., et al. (2020). Transformer Based on DGA Feature Quantity Optimization and GA-SVM Fault Diagnosis Model[J]. Transformer 57 (12), 36–46.
Jun, L., Lijin, Z., Liang, H., Hua-rong, Z., Xun, H., Huan, C., et al. (2017). Fault Diagnosis Method for Power Transformer Based on Adaboost.MK and SM-SVDD [J]. J. Electr. Power Sci. Technol. 32 (03), 139. doi:10.3969/j.issn.1673-9140.2017.03.022
Li, L., Yong, C., Jun, X., Li-Qiu, J., Ning, M., Ming, L., et al. (2015). An Integrated Method of Set Pair Analysis and Association Rule for Fault Diagnosis of Power Transformers[J]. IEEE Trans. Dielectr. Electr. Insulation 22 (04), 2368–2378. doi:10.1109/tdei.2015.004855
Lijun, Z., Xiangyu, Z., Zhenyu, W., Tong, L., Xiaowei, X., Chenqingyu, Z., et al. (2021). Oscillation Wave Modeling and Axial Shift Fault Analysis of Transformer Winding[J]. Electr. Power Autom. Equip. 41 (3), 157–163. doi:10.16081/j.epae.202101029
Malik, H., and Mishra, S. (2016). Application of Gene Expression Programming (GEP) in Power Transformers Fault Diagnosis Using DGA. IEEE Trans. Ind. Appl. 52 (6), 4556–4565. doi:10.1109/tia.2016.2598677
Meira, M., Verucchi, C., Alvarez, R., and Catalano, L. (2021). Dissolved Gas Analysis in Mineral Oil and Natural Ester Liquids from Thermal Faults. IEEE Trans. Dielect. Electr. Insul. 28 (4), 1317–1325. doi:10.1109/tdei.2021.009334
Moazami, S., Noori, R., Amiri, B. J., Yeganeh, B., Partani, S., and Safavi, S. (2016). Reliable Prediction of Carbon Monoxide Using Developed Support Vector Machine. Atmos. Pollut. Res. 7 (3), 412–418. doi:10.1016/j.apr.2015.10.022
Nahar, J., Imam, T., Tickle, K. S., and Chen, Y.-P. P. (2013). Association Rule Mining to Detect Factors Which Contribute to Heart Disease in Males and Females. Expert Syst. Appl. 40 (4), 1086–1093. doi:10.1016/j.eswa.2012.08.028
Ochin, W., Kumar, S., and Joshi, N. (2016). Rule Power Factor: A New Interest Measure in Associative Classification. Procedia Comput. Sci. 93 (1), 12–18. doi:10.1016/j.procs.2016.07.175
Rao, U. M., Fofana, I., Rajesh, K. N., and Picher, P. (2021). Identification and Application of Machine Learning Algorithms for Transformer Dissolved Gas Analysis. IEEE Trans. Dielect. Electr. Insul. 28 (5), 1828–1835. doi:10.1109/tdei.2021.009770
Rezaie, S., Bafghi, Z. G., Manavizadeh, N., and Kordmahale, S. B. (2022). Highly Sensitive Detection of Dissolved Gases in Transformer Oil with Carbon-Doped ZnO Nanotube: A DFT Study. IEEE Sensors J. 22 (1), 82–89. doi:10.1109/jsen.2021.3126654
Rigatos, G., and Siano, P. (2016). Power Transformers' Condition Monitoring Using Neural Modeling and the Local Statistical Approach to Fault Diagnosis. Int. J. Electr. Power & Energy Syst. 80 (1), 150–159. doi:10.1016/j.ijepes.2016.01.019
Sheng, G., Hou, H., Jiang, X., and Chen, Y. (2018). A Novel Association Rule Mining Method of Big Data for Power Transformers State Parameters Based on Probabilistic Graph Model[J]. IEEE Trans. Smart Grid 9 (02), 695–702. doi:10.1109/tsg.2016.2562123
Swets, A. (2016). Signal Detection Theory and ROC Analysis in Psychology and Diagnostics: Collected Papers [M]. USA: Lawrence Erlbaum Associates.
Tian-en, H., Qinglai, G., and Hongbin, S. (2019). A Deep Spatial-Temporal Data-Driven Approach Considering Microclimates for Power System Security Assessment[J]. Appl. Energy 237 (1), 36–48. doi:10.1016/j.apenergy.2019.01.013
Vesely, W. E., and Davis, T. C. (1983). Two Measures of Risk Importance and Their Application[J]. Nucl. Technol. 68 (2), 226–234.
Wenqing, Z., Hai, Y., Zhendong, Z., and Xuqiang, S. (2020). Fault Diagnosis of Transformer Based on Residual BP Neural Network[J]. Electr. Power Autom. Equip. 40 (2), 143–148. doi:10.16081/j.epae.201912021
Shi, X., Zhu, Y., Ning, X., Wang, L., Sun, G., and Chen, G. (2016). Transformer Fault Diagnosis Based on Deep Auto-Encoder Network[J]. Electr. Power Autom. Equip. 36 (5), 122–126. doi:10.16081/j.issn.1006-6047.2016.05.021
Xinbo, H., Weitao, J., Yongcan, Z., and Yi, T. (2020). Transformer Fault Prediction Based on Time Series and Support Vector Machine[J]. High. Volt. Eng. 46 (7), 2530–2538. doi:10.13336/j.1003-6520.hve.20191344
Yan, W., and Taihua, Z. (2020). Fault Diagnosis of Transformers Based on Optimal Probabilistic Neural Network Based on Digital Twin[J]. Modul. Mach. Tool Automatic Manuf. Tech. 11 (1), 20–23. doi:10.13462/j.cnki.mmtamt.2020.11.005
Yingjie, W., and Tienan, C. (2021). Transformer Fault Diagnosis Method Based on Improved Elman Neural Network[J]. J. Shenyang Univ. Technol. 43 (3), 254–258. doi:10.7688/j.issn.1000-1646.2021.03.03
Yiyi, Z., Jian, J., Ke, W., Hanbo, Z., Jiake, F., Hao, Z., et al. (2018). Power Transformer Fault Diagnosis Model Based on Support Vector Machine Optimized by Imperialist Competitive Algorithm[J]. Electr. Power Autom. Equip. 38 (1), 99–104. doi:10.16081/j.issn.1006-6047.2018.01.014
Youwen, Z., Bin, F., Ye, C., Weihan, L., Chuangxin, G., et al. (2021). Fault Diagnosis Method for Oil-Immersed Transformer Based on XGBoost Optimized by Genetic Algorithm[J]. Electr. Power Autom. Equip. 41 (2), 200–206. doi:10.16081/j.epae.202012021
Zhang, J., Zhang, H., Ding, S., and Zhang, X. (2021). Power Consumption Predicting and Anomaly Detection Based on Transformer and K-Means[J]. Front. Energy Res. 9 (1), 113–122. doi:10.3389/fenrg.2021.779587
Wu, Z., Zhou, M., Lin, Z., Chen, X., and Huang, Y. (2021). Improved Genetic Algorithm and XGBoost Classifier for Power Transformer Fault Diagnosis[J]. Front. Energy Res. 9 (1), 65–76. doi:10.3389/fenrg.2021.745744
Keywords: transformer diagnosis, dissolved gas analysis (DGA), weighted association rule mining, HILP component, component importance measure (CIM)
Citation: Sun C, Zhou Z, Zhang Y, Jia Z, Huang J and Huang C (2022) A Dissolved Gas Assessment Model for Power Transformers According to Weighted Association Rule Mining. Front. Energy Res. 10:879869. doi: 10.3389/fenrg.2022.879869
Received: 20 February 2022; Accepted: 16 May 2022;
Published: 09 June 2022.
Edited by:
Yan Xu, Nanyang Technological University, SingaporeReviewed by:
Narottam Das, Central Queensland University, AustraliaHao Ming, Southeast University, China
Xin Wang, Shanghai Jiao Tong University, China
Copyright © 2022 Sun, Zhou, Zhang, Jia, Huang and Huang. This is an open-access article distributed under the terms of the Creative Commons Attribution License (CC BY). The use, distribution or reproduction in other forums is permitted, provided the original author(s) and the copyright owner(s) are credited and that the original publication in this journal is cited, in accordance with accepted academic practice. No use, distribution or reproduction is permitted which does not comply with these terms.
*Correspondence: Chenhao Sun, chenhaosun@csust.edu.cn