Taphonomy of Biosignatures in Microbial Mats on Little Ambergris Cay, Turks and Caicos Islands
 Maya L. Gomes1*
  Leigh Anne Riedman2
  Shane O’Reilly3,4
  Usha Lingappa5
  Kyle Metcalfe5
  David A. Fike6 John P. Grotzinger5 Woodward W. Fischer5
  Andrew H. Knoll7
- 1Department of Earth and Planetary Sciences, Johns Hopkins University, Baltimore, MD, United States
- 2Department of Earth Science, University of California, Santa Barbara, Santa Barbara, CA, United States
- 3School of Earth Sciences, University College Dublin, Dublin, Ireland
- 4Department of Earth, Atmospheric and Planetary Sciences, Massachusetts Institute of Technology, Cambridge, MA, United States
- 5Division of Geological and Planetary Sciences, California Institute of Technology, Pasadena, CA, United States
- 6Department of Earth and Planetary Sciences, Washington University, St. Louis, MO, United States
- 7Department of Earth and Planetary Sciences, Harvard University, Cambridge, MA, United States
Microbial mats are taxonomically and metabolically diverse microbial ecosystems, with a characteristic layering that reflects vertical gradients in light and oxygen availability. Silicified microbial mats in Proterozoic carbonate successions are generally interpreted in terms of the surficial, mat building community. However, information about biodiversity in the once-surface-layer can be lost through decay as the mats accrete. To better understand how information about surface microbial communities is impacted by processes of decay within the mat, we studied microbial mats from Little Ambergris Cay, Turks and Caicos Islands. We used molecular techniques, microscopy and geochemistry to investigate microbial mat taphonomy – how processes of degradation affect biological signatures in sedimentary rocks, including fossils, molecular fossils and isotopic records. The top < 1 cm of these mats host cyanobacteria-rich communities overlying and admixed with diverse bacterial and eukaryotic taxa. Lower layers contain abundant, often empty, sheaths of large filamentous cyanobacteria, preserving their record as key mat-builders. Morphological remains and free lipid biomarkers of several bacterial groups, as well as diatoms, arthropods, and other eukaryotes also persist in lower mat layers, although at lower abundances than in surface layers. Carbon isotope signatures of organic matter were consistent with the majority of the biomass being sourced from CO2-limited cyanobacteria. Porewater sulfide sulfur isotope values were lower than seawater sulfate sulfur isotope values by ∼45–50‰, consistent with microbial sulfate reduction under sulfate-replete conditions. Our findings provide insight into how processes of degradation and decay bias biosignatures in the geological record of microbial mats, especially mats that formed widely during the Proterozoic (2,500–541 million years ago) Eon. Cyanobacteria were the key mat-builders, their robust and cohesive fabric retained at depth. Additionally, eukaryotic remains and eukaryotic biosignatures were preserved at depth, which suggests that microbial mats are not inherently biased against eukaryote preservation, either today or in the past.
Introduction
Microbial mat ecosystems contain diverse consortia of primarily microscopic organisms along with their metabolic products and, occasionally, trapped sediment or authigenic minerals. Mat systems vary in community composition and texture, but usually exhibit a common pattern of vertical organization (Jorgensen and Cohen, 1977; Jorgensen et al., 1979; Revsbech et al., 1983; Skyring, 1984; Cohen, 1984; Visscher et al., 1992; Van Gemerden, 1993; Jorgensen, 1994; Des Marais, 1995). A green to deep blue-green, mm- to cm-scale surface layer gets its color primarily from cyanobacteria – the predominant primary producers and agents of mat accretion. The mat surface hosts a variety of other mat-dwelling photoautotrophs and heterotrophs, their diversity and abundance reflecting physical conditions within and around the mat. Below the surface, where light penetrates but oxygen does not, a variably thick, pink layer is often present, populated by anoxygenic phototrophic bacteria (predominantly proteobacteria) as well as anaerobic heterotrophs and chemoautotrophs. Further below, dark basal layers host additional anaerobic heterotrophs. As mats accrete, biomass produced in surface layer becomes the substrate for respiration and fermentation in the lower layers. Thus, the morphology and biogeochemistry of lower layers reflects both the nature and growth of mat-building communities as well as processes within the mat that may overwrite some or all of the surface record.
Marine sedimentary records indicate that mats were widespread during the Proterozoic Eon (2500–541 million years ago; Walter, 1976; Grotzinger and Knoll, 1999; Riding, 2006). While not all Proterozoic mat deposits contain unambiguous biological or environmental signatures, some preserve biologically informative sedimentological textures (e.g., Grotzinger and Knoll, 1999; Dupraz and Visscher, 2005; Dupraz et al., 2009; Bosak et al., 2013; Knoll et al., 2013; Frantz et al., 2015; Manning-Berg and Kah, 2017; Manning-Berg et al., 2019) or the cellular and biochemical remains of constituent microbes (e.g., Barghoorn and Tyler, 1965; Hofmann, 1976; Knoll et al., 1991, 2013; Butterfield et al., 1994; Manning-Berg et al., 2019). How well do fossil mat materials reflect the mats’ original microbial diversity? How well can mats tell the story of ancient ecosystems? Microbial mat taphonomy can be used to determine how processes of degradation and decay bias the fossil, biomarker, and geochemical records of these ecosystems.
One hypothesized bias intrinsic to microbial mats is the “mat-seal effect,” wherein the cohesive mat surface is suggested to exclude the entrance of eukaryotic organisms and their molecular products into the mat system (Pawlowska et al., 2013). This hypothesis has been suggested as a possible explanation for the puzzling lack of steranes (eukaryotic biomarkers) in all but the youngest Proterozoic mats, which is problematic because eukaryote body fossils date from at least 1.65 billion years ago (Javaux et al., 2001; Leiming et al., 2005; Agiæ et al., 2017; Javaux and Knoll, 2017). Another observation is that silicified Proterozoic mats (e.g., in the Belcher Supergroup, Canada, Hofmann, 1976; or the Bylot Supergroup, Baffin Islands, Hofmann and Jackson, 1991) commonly contain filaments with morphological similarities to oscillatorian or scytonematalean cyanobacterial filaments, which leads to the hypothesis that cyanobacteria were important architects of microbial mats in many Proterozoic environments. In this paper, we document the microbial diversity and other biogeochemical aspects of a modern microbial mat system and investigate changes in morphological and geochemical signatures of microorganisms with depth in the mat. These datasets enables us to address how well lower mat layers capture the microbial diversity and environmental conditions of the surface layer. In addition to testing the hypothesized anti-eukaryote bias suggested by the “mat-seal effect” and the role of cyanobacteria as mat-builders, we investigated more broadly in what ways fossilized mats act as reliable narrators of history and which elements of microbial history are lost through processes of degradation and decay as the mat accretes.
Materials and Methods
Study Site
Little Ambergris Cay is an uninhabited ∼6 km × 1.6 km island in the Turks and Caicos Islands, British West Indies (Figure 1). A bedrock rim of oolitic grainstone frames the island at an elevation of 1–1.5 m above sea level (Orzechowski et al., 2016; Stein et al., 2016). Water depth varies tidally by up to 50 cm. Although this variability is muted in the island interior, tides play a more important role in determining water depth than seasonal changes in precipitation and evaporation (i.e., range of average precipitation-evaporation throughout the year is 0 to −6 mm/day; Jury, 2013). Microbial mats that occur in shallow bays and channels in the interior of the island can be divided into three classes based on surface morphology and texture (Figure 2), which vary as a function of elevation and therefore the duration of subaerial exposure over tidal cycles: flat mats lie at low elevations and are persistently submerged; polygonal mats are found at intermediate elevations and are submerged during high-tide; and blister mats with knobbly, low-relief morphologies occur at higher elevations and are subaerially exposed except during storms (Stein et al., 2016; Trembath-Reichert et al., 2016). These mat morphologies are similar to Great Bahama Bank microbial mats in peritidal and marsh settings (e.g., Hardie, 1977; Maloof and Grotzinger, 2011).
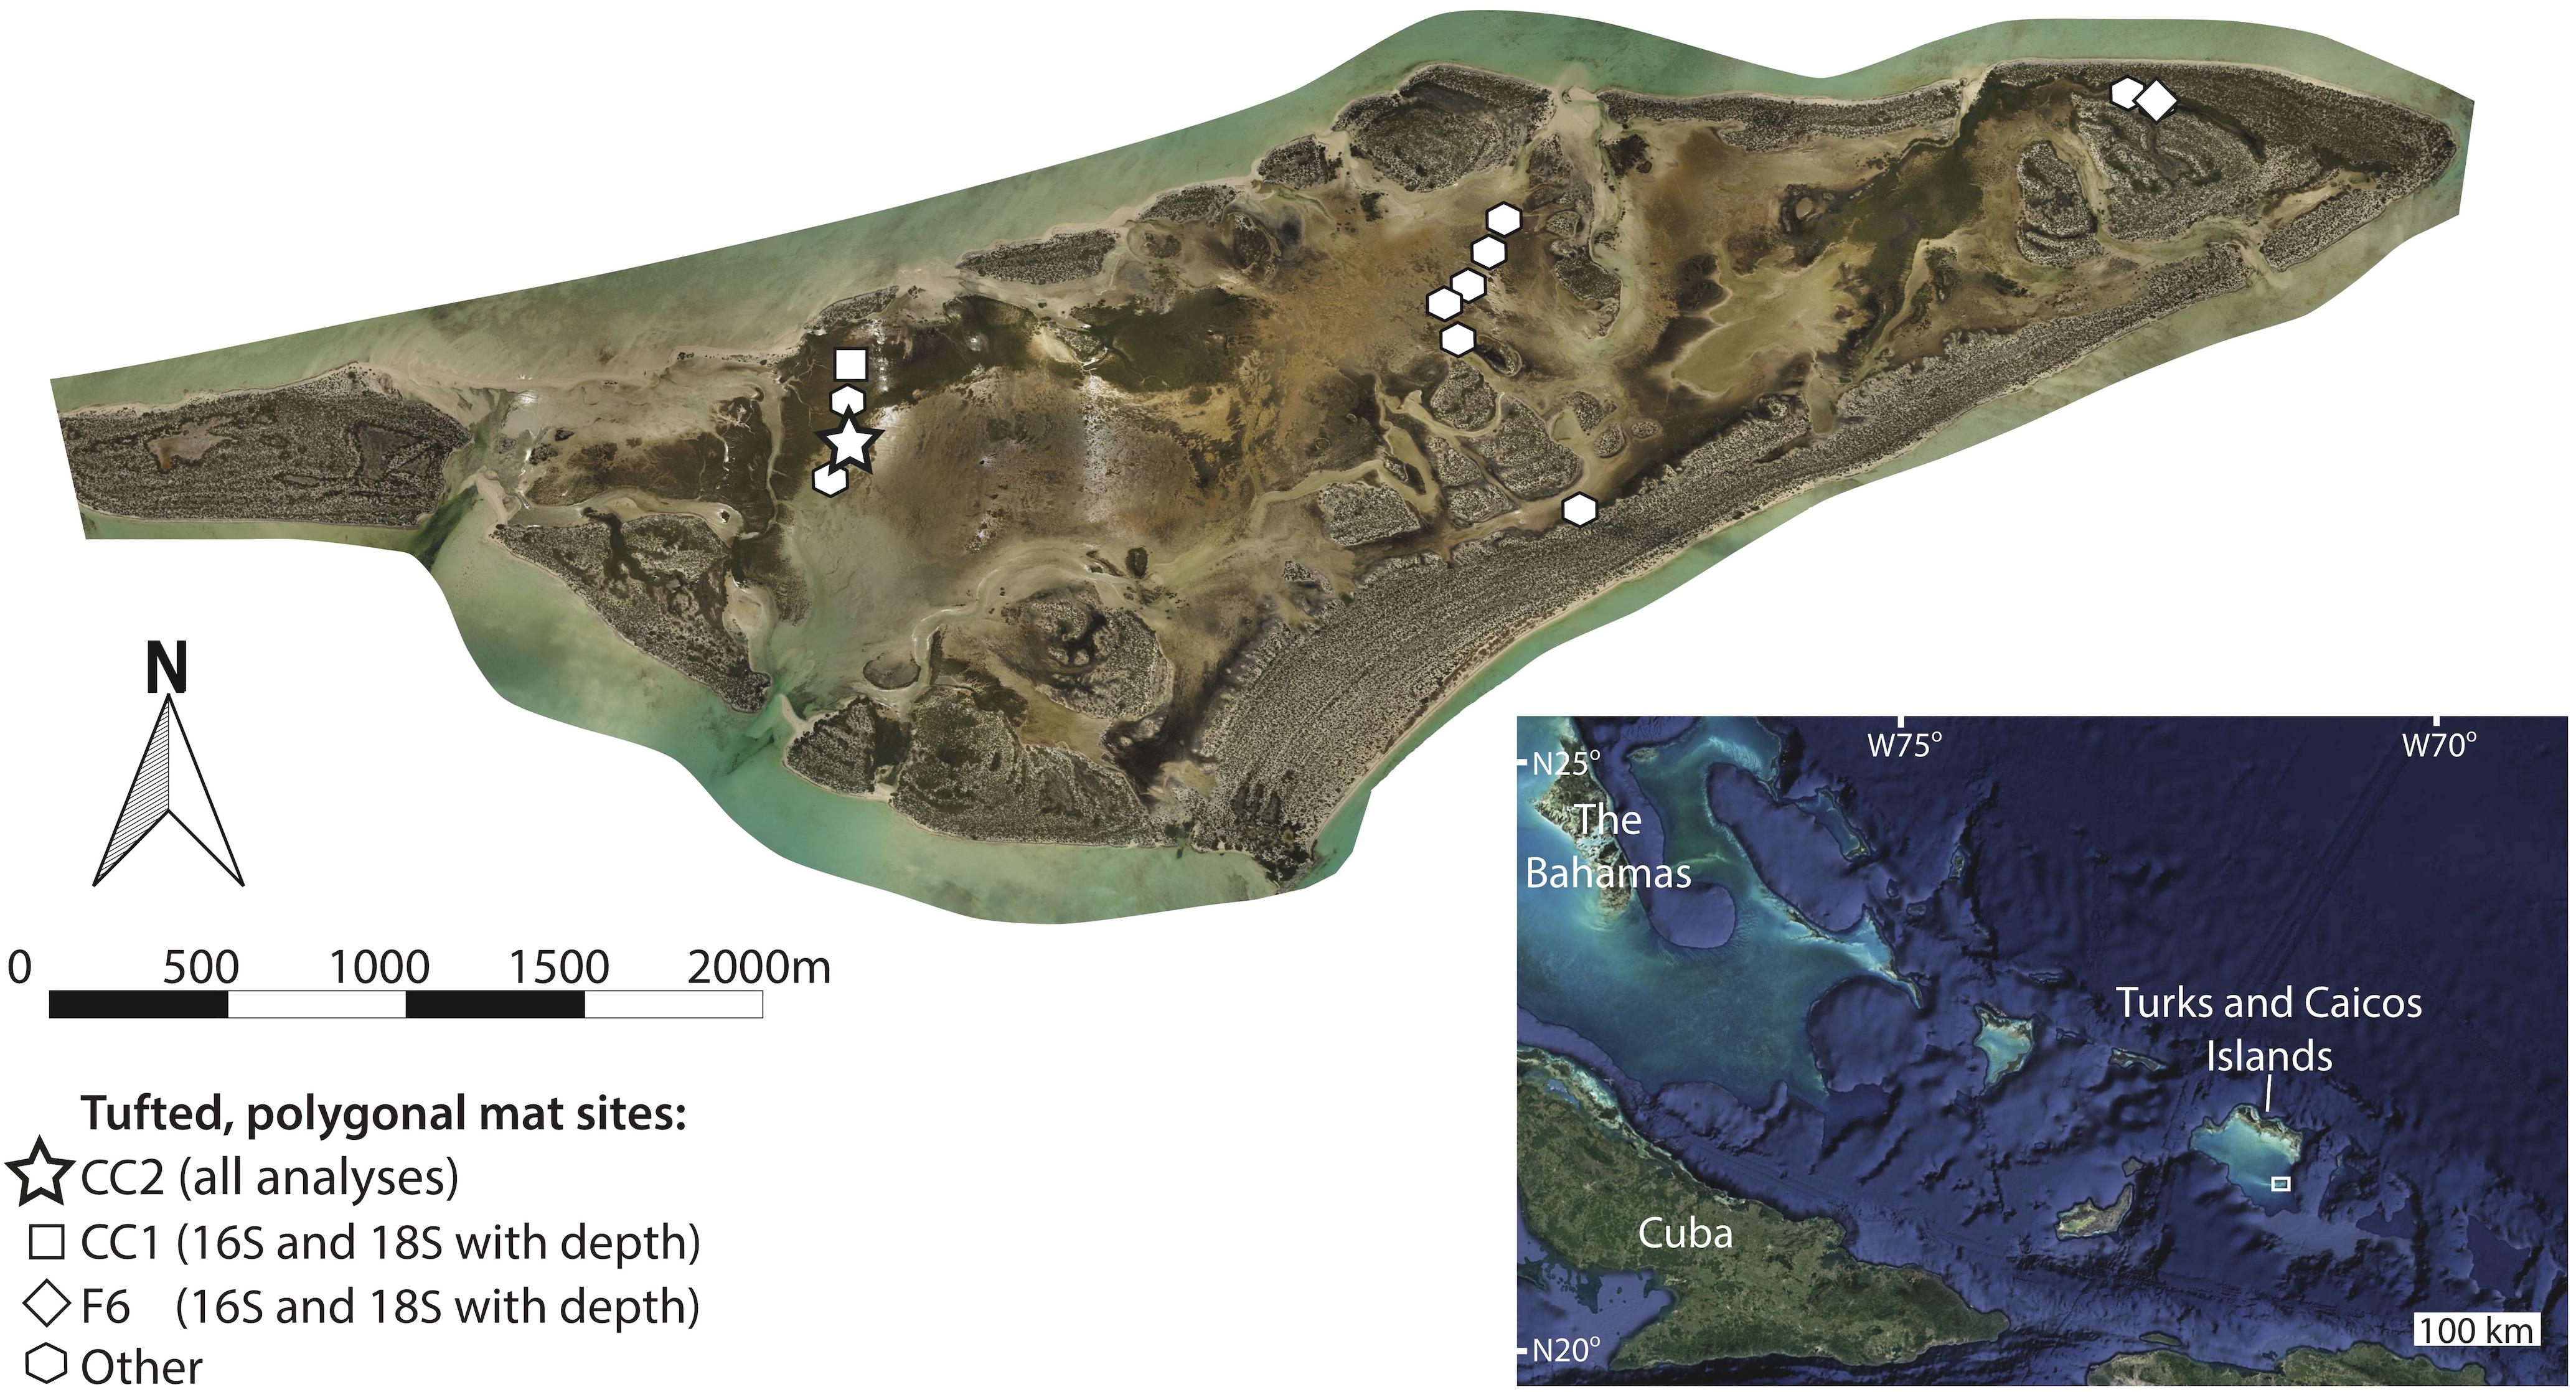
Figure 1. Orthomosaic of Little Ambergris Cay (Stein et al., 2016, online image reprinted with permission, retrieved from http://www.ntstein.com/home/little-ambergris/) with locations of tufted, polygonal microbial mat study sites. Microbial mats are found in shallow bays and channels that line the interior of the island, which is surrounded by an oolitic grainstone rim. The bottom right inset image shows the location of the Turks and Caicos Islands within the southwest north Atlantic Ocean (image from Google Earth; map data from SIO, NOAA, U.S. Navy, NGA, GEBCO; image from Landsat/Copernicus) with a box around the location shown in the main image. We conducted all analyses on the site CC2 (star), characterized by polygonal mats. Sites used for analyses of depth trends in 16S and 18S data are shown with a square (CC1) and a diamond (F6). Other polygonal mat sites, from which pigment-rich layers were sampled for 16S analysis, are indicated with polygons. Additional information about site locations and metadata are provided in Supplementary Table S1.
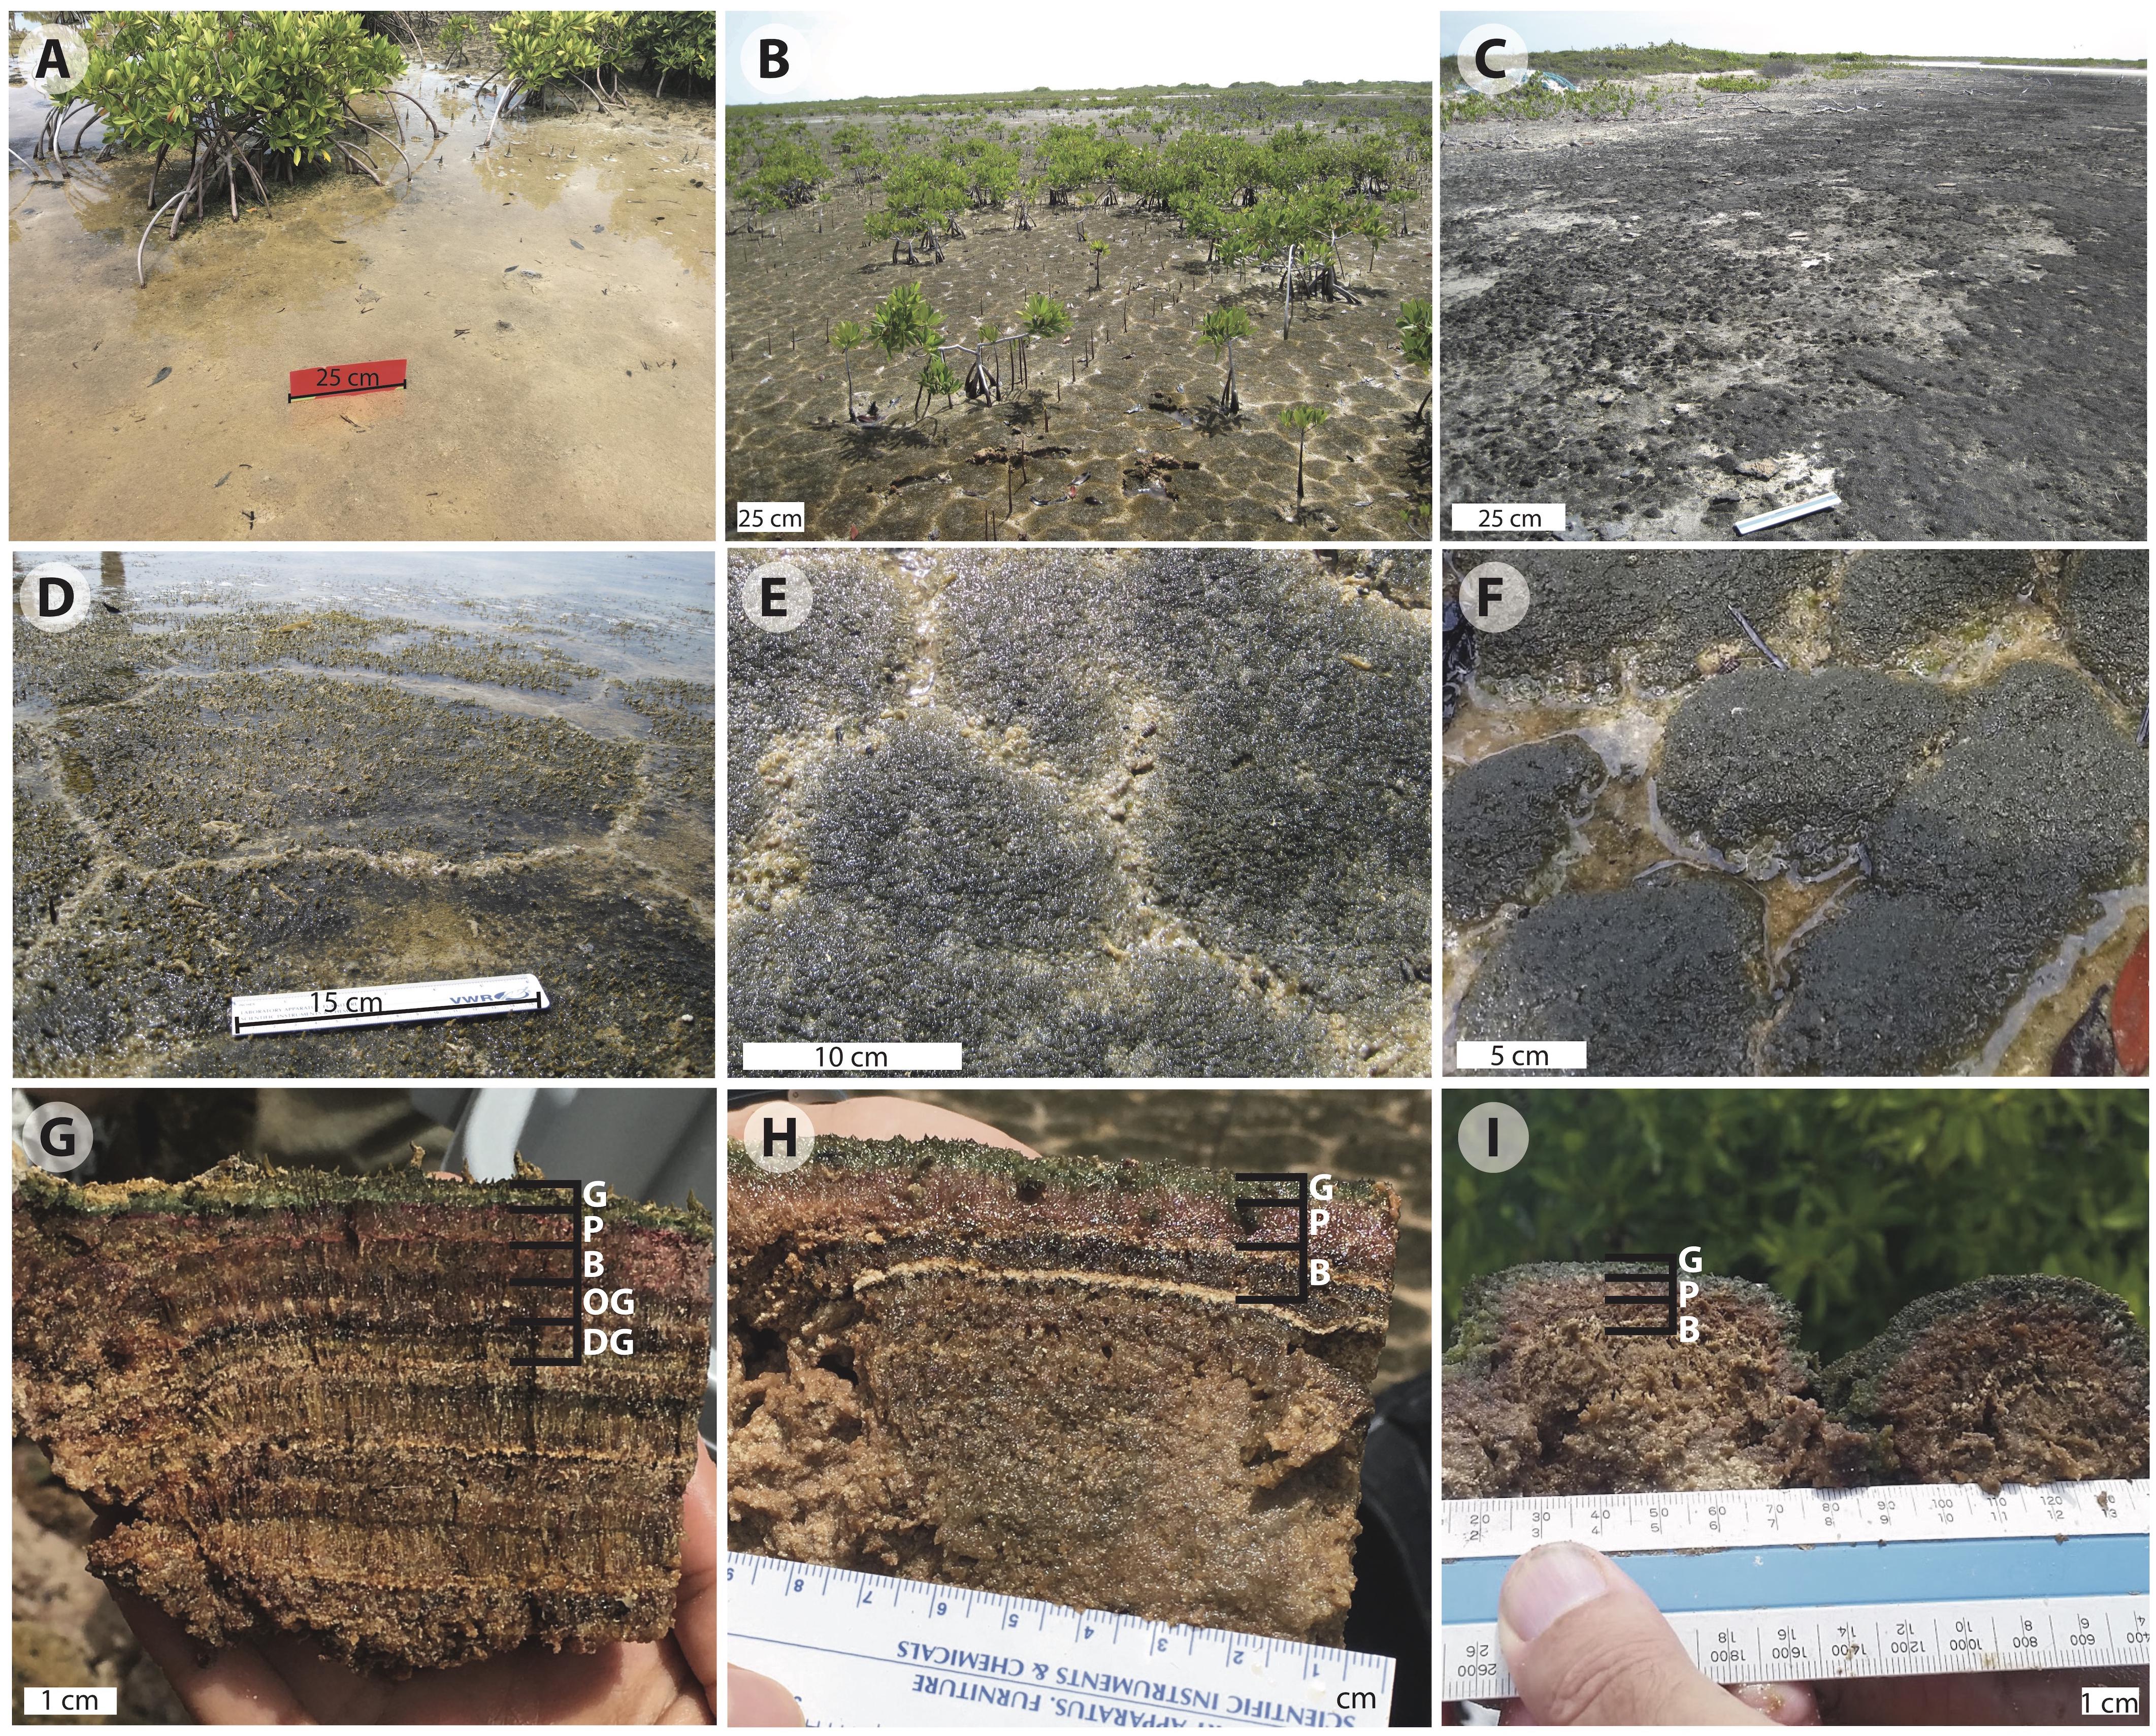
Figure 2. Images of Little Ambergris Cay microbial mats: (A) flat mat; (B) polygonal mats (online image reprinted with permission, retrieved http://gomeslab.weebly.com) (C) blister mats; (D) polygonal mat site CC2; (E) polygonal mat site CC1; (F) polygonal mat site F6; (G) cross-section of polygonal mat CC2; (H) cross-section of polygonal mat CC1; (I) cross-section of polygonal mat F6. The cross sections in (G–I) show the G, green; P, pink; and B, brown layers in mats CC2, CC1, and F6, respectively. Image G also shows the OG, olive-green and DG, dark-green pigment-poor layers in CC2. Note the vertically oriented filamentous layers in the B, OG, and DG layers and layers below. Judging from Hurricane Irma in 2017, we suspect that the thin ooid laminae visible in (H) record earlier hurricanes that washed oolitic sand into the island interior.
Field Methods
We mapped the island in July 2016 using un-piloted aerial vehicles to produce the orthomosaic in Figure 1 (Stein et al., 2016). We sampled a range of mat types from 25 locations across the island (Supplementary Table S1): nine flat mats, twelve tufted polygonal mats, and four knobbly blister mats. At each site, salinity was determined with an ATAGO S-28E refractometer and pH was measured with a WTW 3310 pH meter with a SenTix41 probe. Mat samples for DNA analysis were taken with an ethanol-sterilized metal spatula and preserved in the field using the Zymo Xpedition lysis/stabilization solution in BashingBeadTM lysis tubes, mechanically homogenized by taping the tubes to a reciprocating saw and operating it for 1 min to ensure lysis and exposure of released DNA to the stabilizing solution. To obtain samples for microscopy and geochemical analyses, a metal putty knife was used to remove a ∼5 cm ×∼10 cm section of mat from each site. Mat samples were placed in ziptop bags and stored in the dark. Sectioning typically occurred on the same day of sampling (including site CC2, which is the focus of this study); those not sectioned on the same day were refrigerated and sectioned within five or fewer days of sampling. Prior to sectioning, material exposed to the plastic bag was removed with an ethanol-sterilized metal spatula and discarded. Sectioning was done based on color and texture characteristics, also with an ethanol-sterilized razor blade. Sectioned samples for microscopy were preserved in 200 proof ethanol to prevent fungal or bacterial degradation and refrigerated. Sectioned samples for organic geochemistry and C isotope analysis were wrapped in annealed (500°C, 8 h) organic-free foil, placed in a sterile Whirl-Pak§ bag, and stored at −20°C.
Site Selection
We examined a range of microbial mat types on Little Ambergris Cay and chose to focus on tufted, polygonal mats because they have the greatest accumulation of mat material (i.e., the thickest mats), enhancing our ability to study processes of degradation and decay with depth. The polygonal mats were sampled over a period of 4 days (July 1–4, 2016). The similarity between 16S rRNA gene molecular surveys of polygonal mat sites presented in the results section indicates that the microbial diversity of polygonal mat communities is sufficiently similar at all sampled sites that any one polygonal mat provides a representative view of that mat type (Figure 3). The majority of our analyses were performed on polygonal mat site CC2 (N21° 17.8382′× W71° 42.2418′; Figure 1). The only data presented in the main text that does not come from CC2 are depth trends in microbial diversity as assessed by 16S and 18S rRNA gene surveys within the pigment-rich layers at two polygonal mat sites (Figure 1): CC1 (N21° 17.9335′× W71° 42.2572′), and F6 (N21° 18.3128′× W71° 40.2887′).
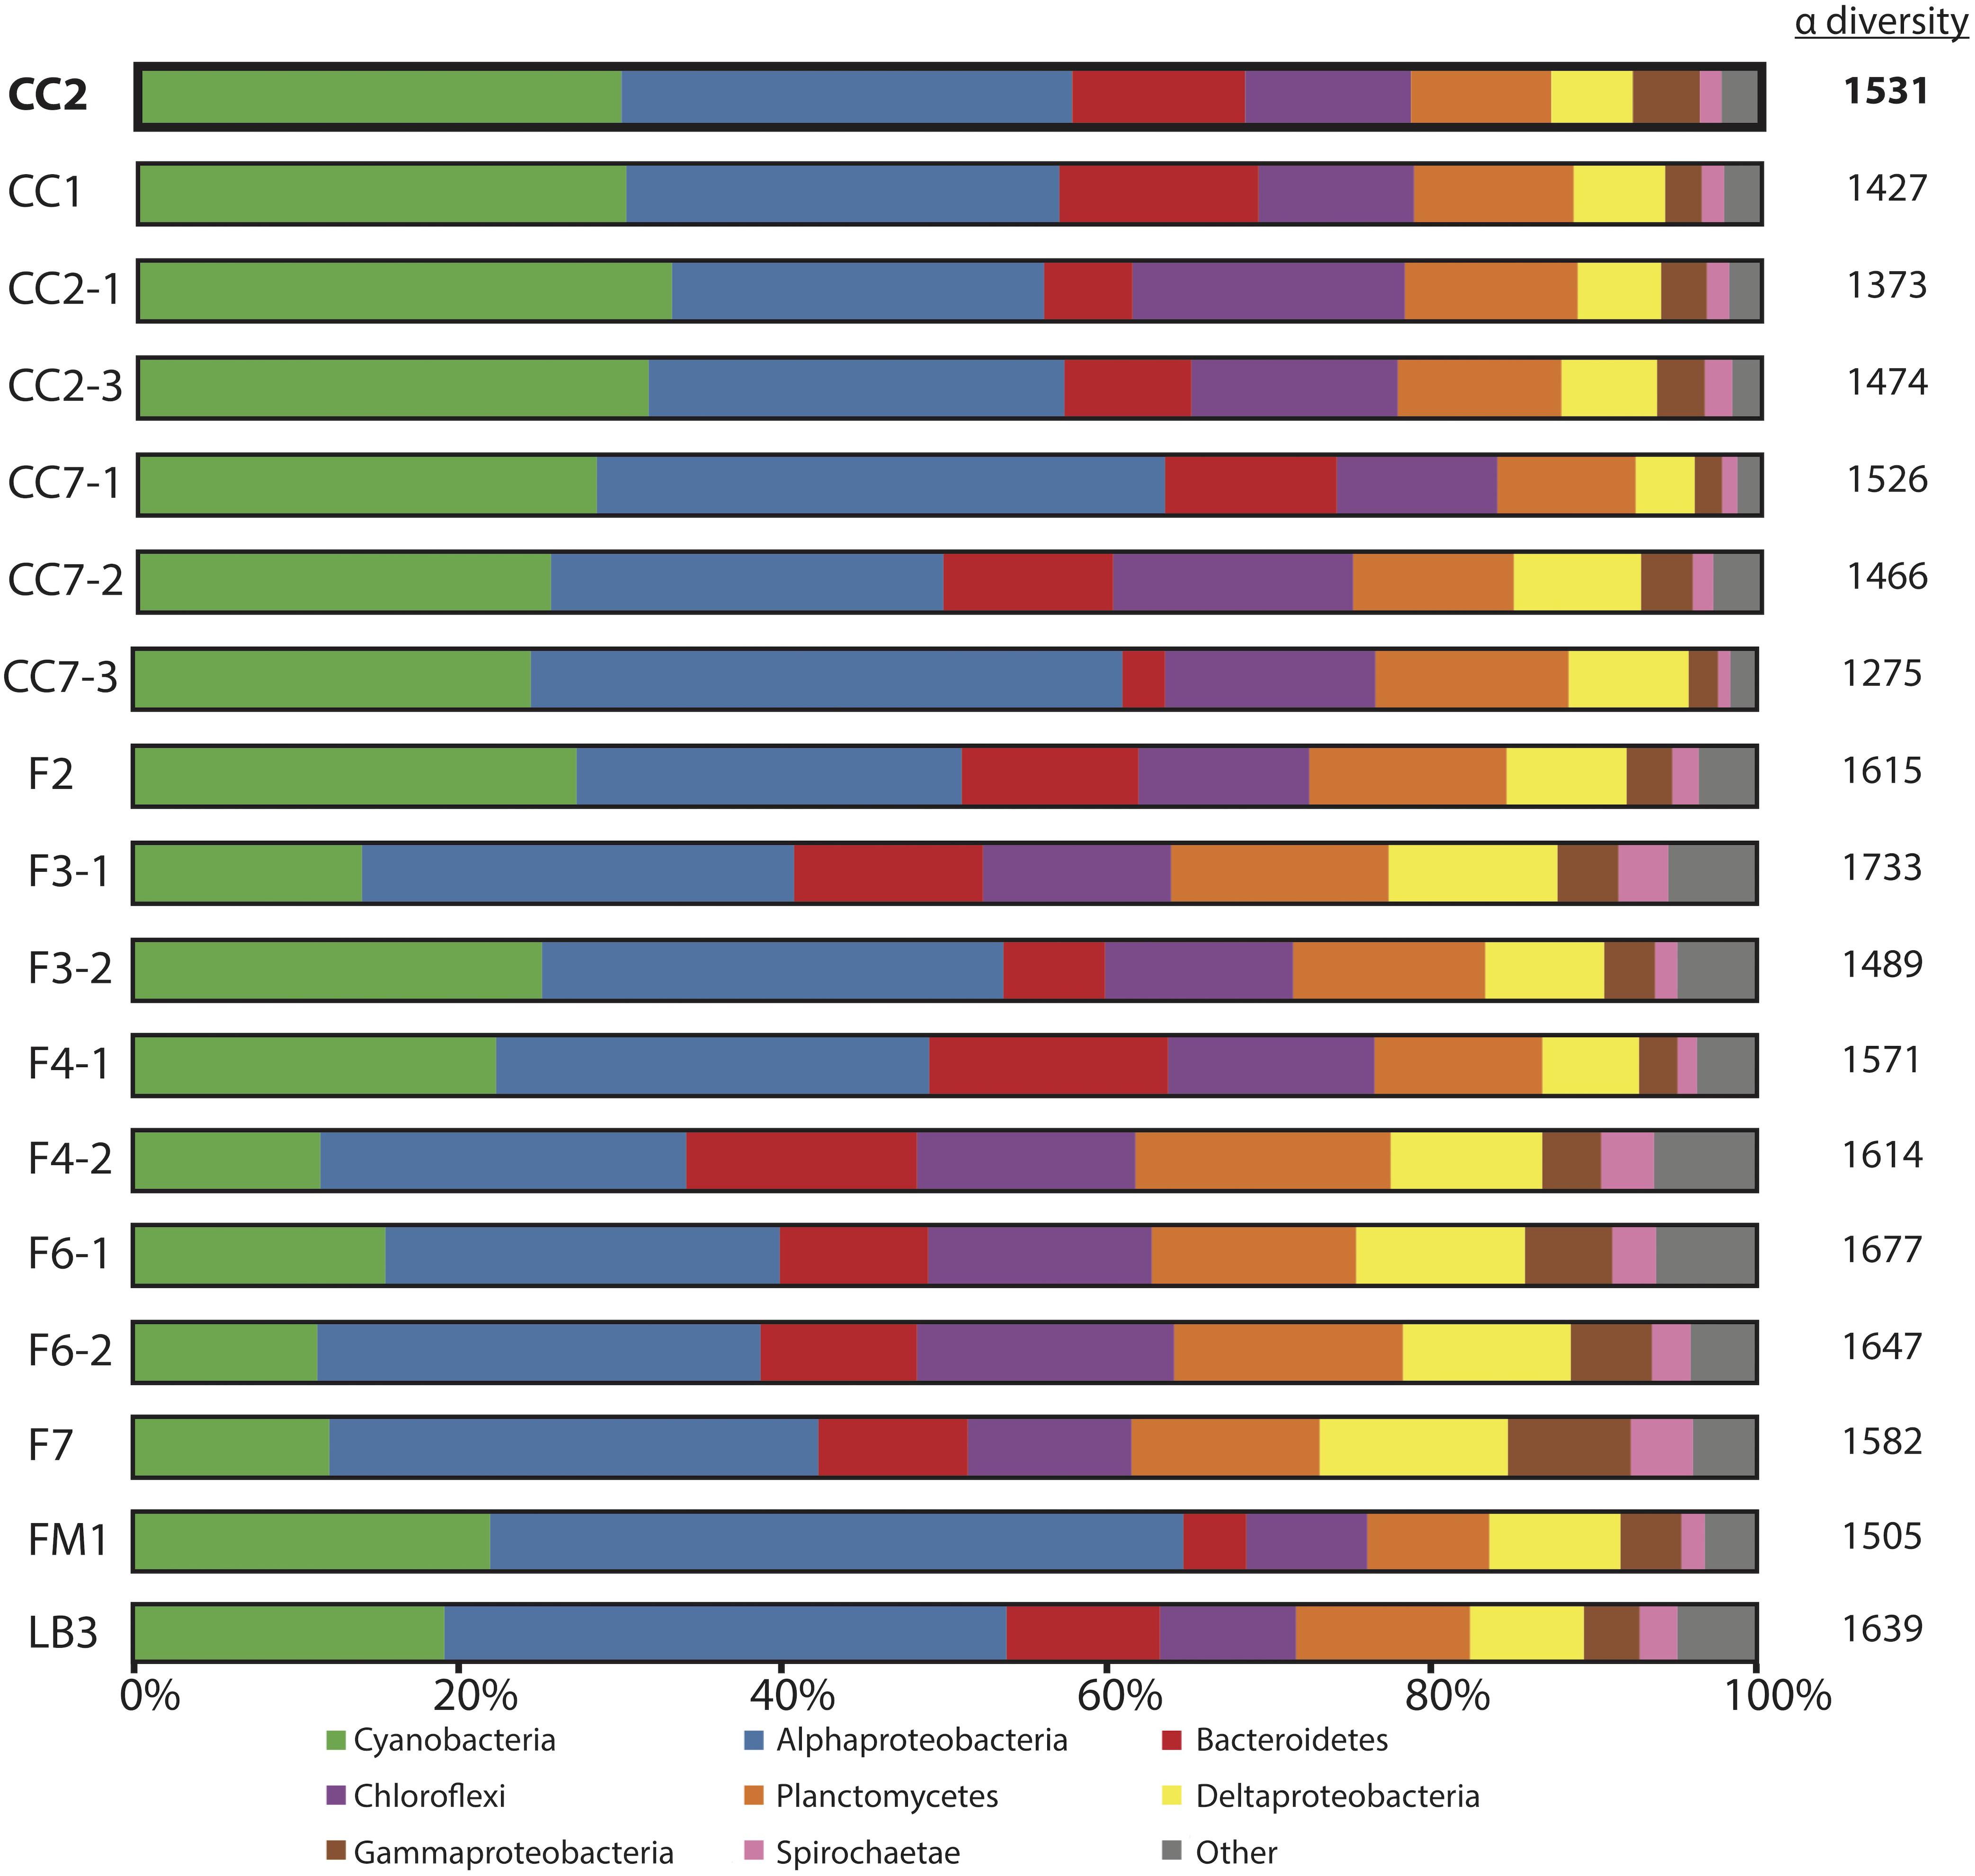
Figure 3. Microbial diversity of polygonal mats recovered using iTag sequencing of the 16S rRNA gene. Relative abundances (%) do not include reads unassigned to any taxon, which comprise ∼20% of the total 16S rRNA gene reads. Operational taxonomic units assigned to families constituting a small percentage of total reads are labeled “other.” Alpha diversity is provided to the right of the columns using results rarefied to 3000 reads/sample using the single_rarefaction.py script in QIIME, in order to minimize artifacts imposed by differences in number of reads between samples. Replicate number is given after the dash.
Microbial Diversity From 16S and 18S rRNA Genes
An amplicon barcoding and sequencing approach commonly known as iTag (Caporaso et al., 2012; Degnan and Ochman, 2012) was used to document microbial diversity of samples preserved in the field by mechanical homogenization in BashingBeadTM lysis tubes with Zymo Xpedition lysis/stabilization solution. Samples were taken in duplicate or triplicate to assess heterogeneity. Replicate data is shown Figure 3. We extracted DNA using the Zymo Soil/Fecal DNA MiniPrep kit in the lab according to the manufacturers protocol. The V4-V5 region of the 16S rRNA gene was amplified using archaeal/bacterial primers with Illumina (San Diego, CA, United States) adapters. Polymerase chain reactions (PCR) were performed following the protocol recommended by the Earth Microbiome Project (EMP)1. We used the 515f-926r primer set for its ability to more reliably reproduce the community composition of control communities rather than the older 515f-806r primer set, following the recommendations of Parada et al. (2016) and adapted according to the EMP2. Analysis of eukaryotic communities was performed by PCR amplification of the V4 region of the 18S rRNA gene using the appropriate primers and a cycling protocol optimized for 18S rRNA gene amplification (Stoeck et al., 2010). Sequencing data were processed as previously described by Case et al. (2015), using QIIME (Caporaso et al., 2010) to join paired ends, trim quality, cluster operational taxonomic units (OTUs), assign taxonomy, remove singletons, and generate taxonomic abundance tables with OTU reads grouped at the family level for downstream community ecology analysis in R (Oksanen et al., 2017; R core team, 2017). Taxonomic identification for each representative sequence was assigned using the Silva v119 database (Quast et al., 2013). For alpha and beta diversity metrics, the genetic survey results were rarefied to 3000 reads/sample using the single_rarefaction.py script in QIIME, in order to minimize artifacts imposed by differences in number of reads between samples. Negative controls testing for contamination from DNA extraction and PCR reagents were also produced and sequenced. The negative controls were over-amplified (45 PCR cycles), as they failed to amplify under the PCR cycle conditions used for environmental samples. Contaminant taxa in over-amplified negative controls were largely absent (typically < 5 reads) from environmental samples. Information about primers, adaptations of the methods for primer pair 515f/926r, and methods to quantify and check purify of DNA are provided in Supplementary Material. The 16S and 18S rRNA gene amplicon sequences produced in this study were deposited in the publicly available Sequence Read Archive (accession number: PRJNA533117).
Microscopy
Subsamples (∼1 cm3) of sectioned mats preserved in 200 proof ethanol were placed in 10% hydrochloric acid for 3 days to remove carbonate materials. Residues were then rinsed with deionized water in a 32 μm sieve and examined as strewn wet mount microscope slides using a Leitz Orthoplan transmitted light microscope. Due to a lack of diagnostic morphological features in some taxa, it was not always possible to provide confident taxonomic interpretation based on optical microscopy; thus, when necessary we classified specimens based on appearance (e.g., coccoidal or helical cells). This approach is similar to those used in micropaleontological analyses and is therefore relevant to the taphonomic analysis of the microbial mat. It also enables us to evaluate taphonomic patterns of different classes of cellular materials or exoskeletons, which does not rely on the assumption that ancient microbial mats had the same or similar microbial communities as modern microbial mats. Relative proportions of the constituent microbiota in the top five layers of the CC2 mat were quantified by counting the first 100 specimens encountered during transects across strewn microscope slides. In order to assess heterogeneity within the layers, this counting process was replicated four times for each layer and the results compared by calculating Bray-Curtis dissimilarity among the layers. Non-metric multidimensional scaling and principal coordinate analyses indicate the individual 100-counts within each layer are more similar to each other than to other layers. Variability within 100-counts in each layer speaks to the heterogeneity of the samples, but the clustering of the counts indicates that assemblages of dissected layers are distinct from each other and that visual cues such as color and texture reflect genuine differences in microbial communities. With increasing depth, however, the variability of the counts (heterogeneity of the sample) decreases and the statistical distinctions between layers become less clear. The relative abundances reported here are averages for four rounds of 100-specimen counts and data from each round of counts are reported in Supplementary Table S2.
Organic Geochemistry
A detailed description of organic geochemical methods is given in Supplementary Material. In brief, freeze-dried sub-samples of mats were extracted according to a modified Bligh and Dyer method (Bligh and Dyer, 1959; Sturt et al., 2004). Dried residues were extracted three times by ultrasonication in 9:1 (v/v) dichloromethane/methanol to quantitatively recover apolar lipids. For intact polar lipid (IPL) analysis, a 10 μL aliquot of each total lipid extract (TLE) was analyzed using an Agilent 1200 Series HPLC coupled to an Agilent Accurate-Mass Quadrupole Time-Of-Flight mass spectrometer with an electrospray ionization interface. The HPLC was equipped with a Zorbax Eclipse XDB-C18 (5 μm, 250 μm × 9.4 mm, Agilent Technologies) for reverse phase separation. A portion of each TLE was also separated into fractions of increasing polarity by silica gel column chromatography for analysis of free lipid biomarkers. After silylation, an aliquot was injected in splitless mode into an Agilent 7890A gas chromatograph interfaced with an Agilent 5975C mass spectrometer. Separation was achieved on a J&W DB-5MS fused silica capillary column. All lipids were quantified using representative internal standards (see Supplementary Material for details about standards). Total ion chromatograms and mass spectral information for identified lipids are provided in the Supplementary Figures S1, S2. To investigate changes in the macromolecular composition of microbial mat samples with depth, the solvent-extracted dried mat residues were pyrolyzed using a CDS analytical 5250T Pyroprobe interfaced to a Waters Micromass AutoSpec Ultima mass spectrometer.
Carbon Isotope Measurements
Sectioned mat samples were freeze dried, acidified with 6N hydrochloric acid to remove inorganic carbon, rinsed with deionized water, and dried in an oven at 70°C. This acidification procedure is likely to extract and remove some organic carboxylic groups, but was necessary to ensure that the analyses were not biased by either admixed carbonate sediment (sand and mud) or intracellular carbonate in the Cyanobacteria. C isotope values (δ13C = {[(13C/12C)sample/(13C/12C)V–PDB]-1}∗ 1000, where V-PDB is the Vienna PeeDee Belemnite C isotope standard) were determined on a Costech ECS 401 Elemental Analyzer coupled to a Delta V Plus mass spectrometer. Analytical uncertainty is ± 0.1‰ based on replicate analyses of lab standards and the international IAEA-CH3 cellulose standard.
Sulfur Isotope Measurements
Porewater sulfide was recovered via reaction with silver embedded in photo film (Ilford Delta 100 Professional Black and White Negative Film) forming silver sulfide in a 2-dimensional pattern in the film (Fike et al., 2017). Prior to sampling, the films were soaked for 5 min in deionized water twice to remove water soluble pigments and allowed to dry in the dark. The films were taped to aluminum sheets, inserted into the mats, and allowed to react for 3–5 h under daylight. After removal, films were rinsed with water, allowed to dry, and stored in the dark. The films were cut at 1 cm intervals along depth profiles. Sulfide was extracted from the films in reaction vessels purged of O2 by N2 gas by reaction with boiling acid (6N HCl) for 1.5 h (Chanton and Martens, 1985) and driven by an N2 carrier gas to a trap vessel containing 0.3 M zinc acetate and 0.6% acetic acid where it precipitated as zinc sulfide. The zinc sulfide was subsequently converted to Ag2S by the addition of 1 M silver nitrate solution and purified by rinsing with 1 M ammonium hydroxide (Firsching, 1961), and deionized water. For δ34S measurements (δ34S = {[(34S/32S)sample/(34C/32C)V–CDT]-1}∗ 1000, where V-CDT is the Vienna Canyon Diablo Troilite S isotope standard), 0.35–0.45 mg of Ag2S was weighed in tin boats along with 2–4 mg of vanadium pentoxide. Measurements of δ34S values were made on a Costech ECS 401 Elemental Analyzer coupled to a Delta V Plus isotope ratio mass spectrometer. S isotope measurements were reproducible within 0.2‰ based on repeat analysis of international standards (IAEA S-1 and IAEA S-3) and an in-house Ag2S standard.
Results
As noted above, much of this investigation focused on tufted polygonal mat CC2, which lies at the boundary between a mangrove thicket and a shallow bay in the northwestern part of the cay (Figures 1, 2B,D,G). The mats here are naturally dissected into polygons with typical junctions at ∼120°. Surfaces of the ∼20–40 cm polygons are dark green at the center, with tufts that rise up to 3 mm above the surface, and are lighter green to beige along the fringes. Water overlying the mat at the CC2 site had a salinity of 43 PSU and pH of 7.01 at the time of sampling on July 4, 2016 (salinity and pH varied over tidal and diel cycles; over the course of our sampling period the range and mean of water salinity at all mat sites on Little Ambergris Cay was 39–95 PSU and 49 PSU, respectively, and the range and mean for pH was 6.67–8.90 and 7.69, respectively, n = 25; Supplementary Table S1). We did not document the pH and salinity within the mat, which have been shown to deviate from the overlying water due to time-varying photosynthetic activity and other physiochemical processes in other mat systems (Jorgensen and Cohen, 1977; Jorgensen et al., 1979; Revsbech et al., 1983; Cohen, 1984; Revsbech and Ward, 1984; D’Amelio et al., 1989; Ramsing et al., 1993; Ley et al., 2006). Visual inspection of the mat revealed that upper layers display bright colors; we interpret this as evidence that these layers are rich in pigments compared to subjacent layers.
In vertical profile (Figures 2G–I), we recognized and sampled multiple layers of CC2 based on color and texture. Below the tufts at the surface of the polygons (Figure 2G), there were two pigment-rich layers with filamentous textures: a ∼3.5 mm deep blue-green layer (henceforth referred to as the green layer) and a ∼8.5 mm pink layer. These brightly colored layers reflected a depth gradient of the current generation of mat-building and mat-dwelling microorganisms (Walter, 1976; Jorgensen and Cohen, 1977; Jorgensen et al., 1979; Revsbech et al., 1983; Cohen, 1984; Visscher et al., 1992; Van Gemerden, 1993; Jorgensen, 1994). The green surface layer marks a zone of the mat rich in living cyanobacteria and other taxa that thrive where both light and oxygen are available during the day. Below this, the pink layer contains a microbial community that thrives where light is present, but oxygen is limited or absent; the pink coloration reflects higher relative abundance of phototrophic Proteobacteria.
Below the photosynthetically active layers, we found evidence of previous surface mat generations, now covered by the current surface mat. In these lower pigment-poor layers, there is no significant visual representation of green or pink photosynthetic pigments. Rather, the layers exhibit various shades of olive-green, dark-green, beige, and brown – colors that largely reflect that pigments are absent and what remains are brownish sheaths of dead or moribund photosynthetic taxa. The pigment-poor layers range in thickness from 4.5 to 10 mm and include sporadic calcium carbonate-rich layers, interpreted to ooids and other sediment deposited during large storms. Many of the pigment-poor layers have a 0.5 mm-scale robust surface-normal fabric due to the presence of bundled, predominantly vertically oriented cyanobacterial sheaths. Others had a more granular appearance. Within this pigment-poor region we analyzed the top three pigment-poor layers for microscopy and geochemistry: a ∼8.5 mm-thick filamentous brown layer, a ∼8.5 mm-thick olive-green layer with a mixed granular/filamentous texture, and a ∼8.5 mm-thick filamentous dark-green layer. The remainder of the mat is various shades of brown with variably developed filamentous or granular textures; samples for organic and C isotope geochemistry were taken at transitions between these two textures. At ∼15 cm below the mat surface, there is a transition to ooid sand—the primary carbonate sediment type on this part of the platform and the substrate that underlies microbial mats throughout the island.
Microbial Diversity From 16S and 18S rRNA Genes
The microbial diversities of pigment-rich layers at polygonal mat sites (Figure 3) were sufficiently similar, as assessed by molecular methods, to conclude that any one sample provides a representative view of their biological communities and taphonomic patterns. This similarity was tested using the permutational multivariate analysis of variance (PERMANOVA) implementation adonis in the community ecology R package vegan (Oksanen et al., 2017; R core team, 2017). Results indicate that the community composition of polygonal mats does not differ significantly between polygonal mat sites (p = 0.05, n = 17). The mean alpha diversity of all sites was 1538 (n = 17; Figure 3). The beta diversity (i.e., mean alpha diversity divided by the gamma diversity) was 0.129 – a value consistent with the PERMANOVA results indicating polygonal mats were not significantly dissimilar. We thus focused the majority of our analyses on one site (CC2, alpha diversity of 1531; Figure 4) with additional information about microbial diversity trends with depth coming from sites CC1 and F6 (alpha diversity of 1427 and 1677, respectively, Figures 5, 6).
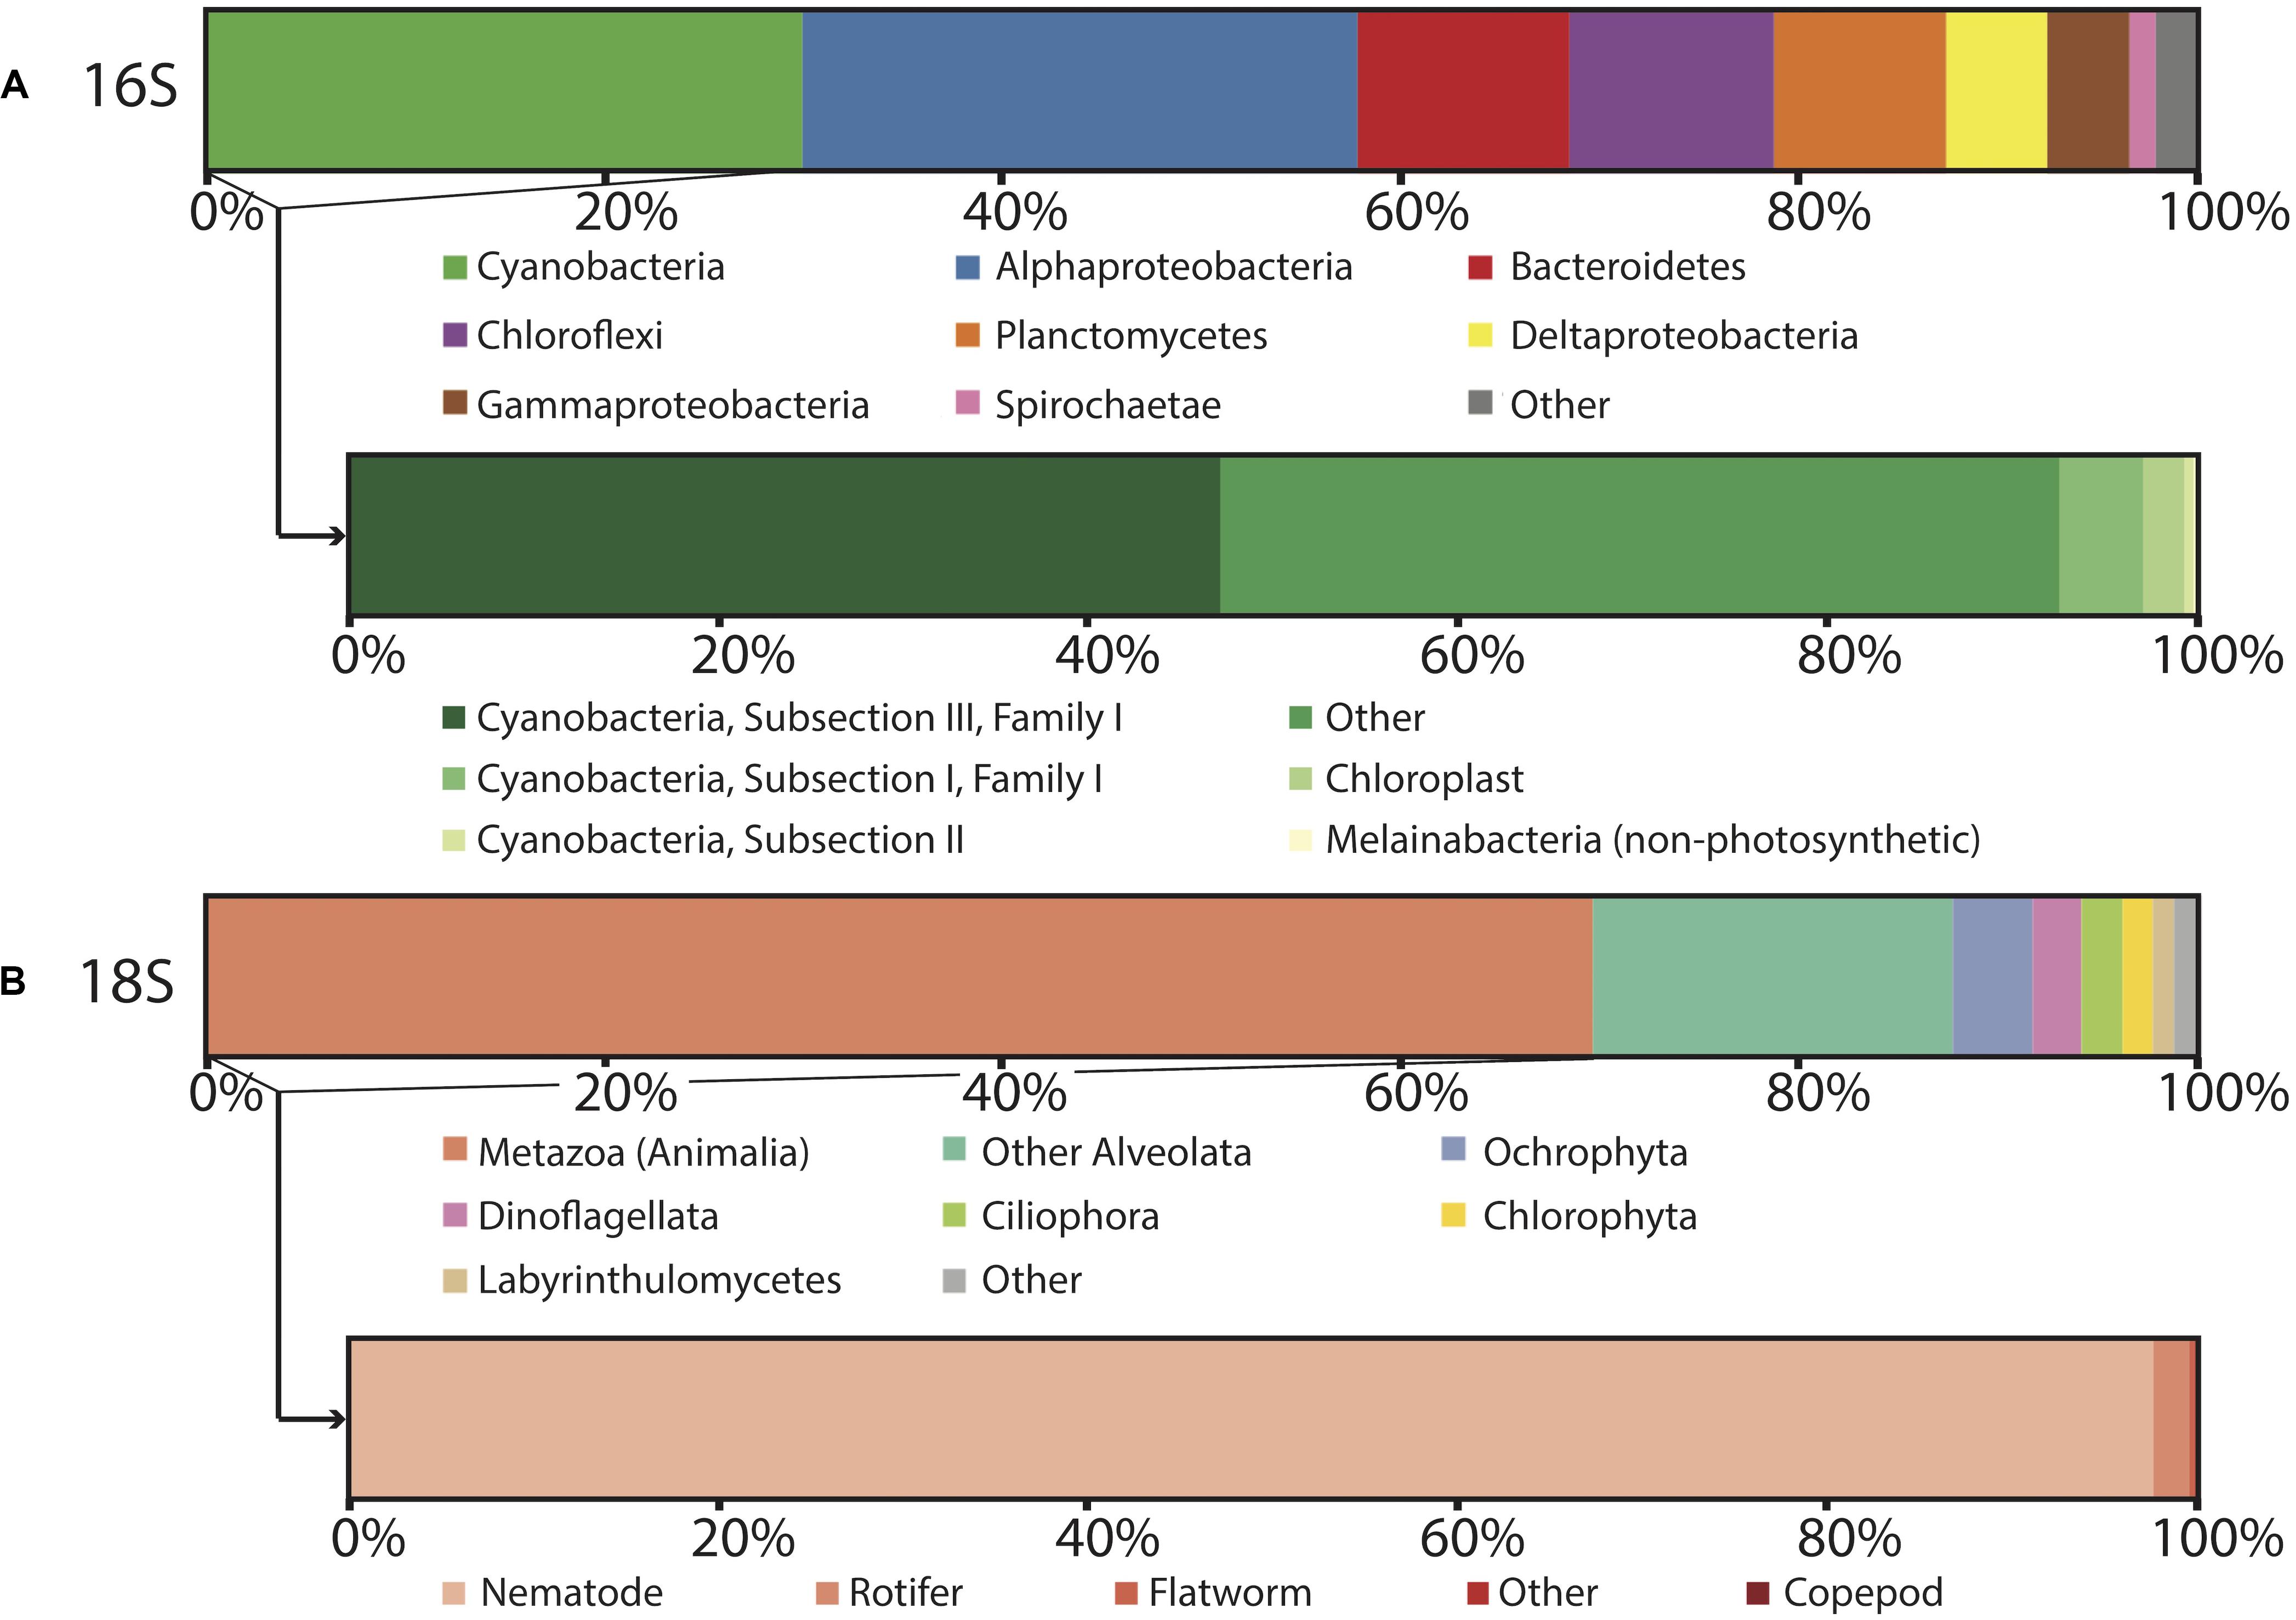
Figure 4. Microbial diversity of polygonal mat CC2 recovered using iTag sequencing of the (A) 16S rRNA gene, with inset showing cyanobacterial diversity, and (B) 18S rRNS gene, with inset showing metazoan diversity. Relative abundances (%) do not include reads unassigned to any taxon, which comprise 22% of the total 16S reads and 17% of the total 18S reads. Operational taxonomic units assigned to families constituting a small percentage of total reads are labeled “other.”
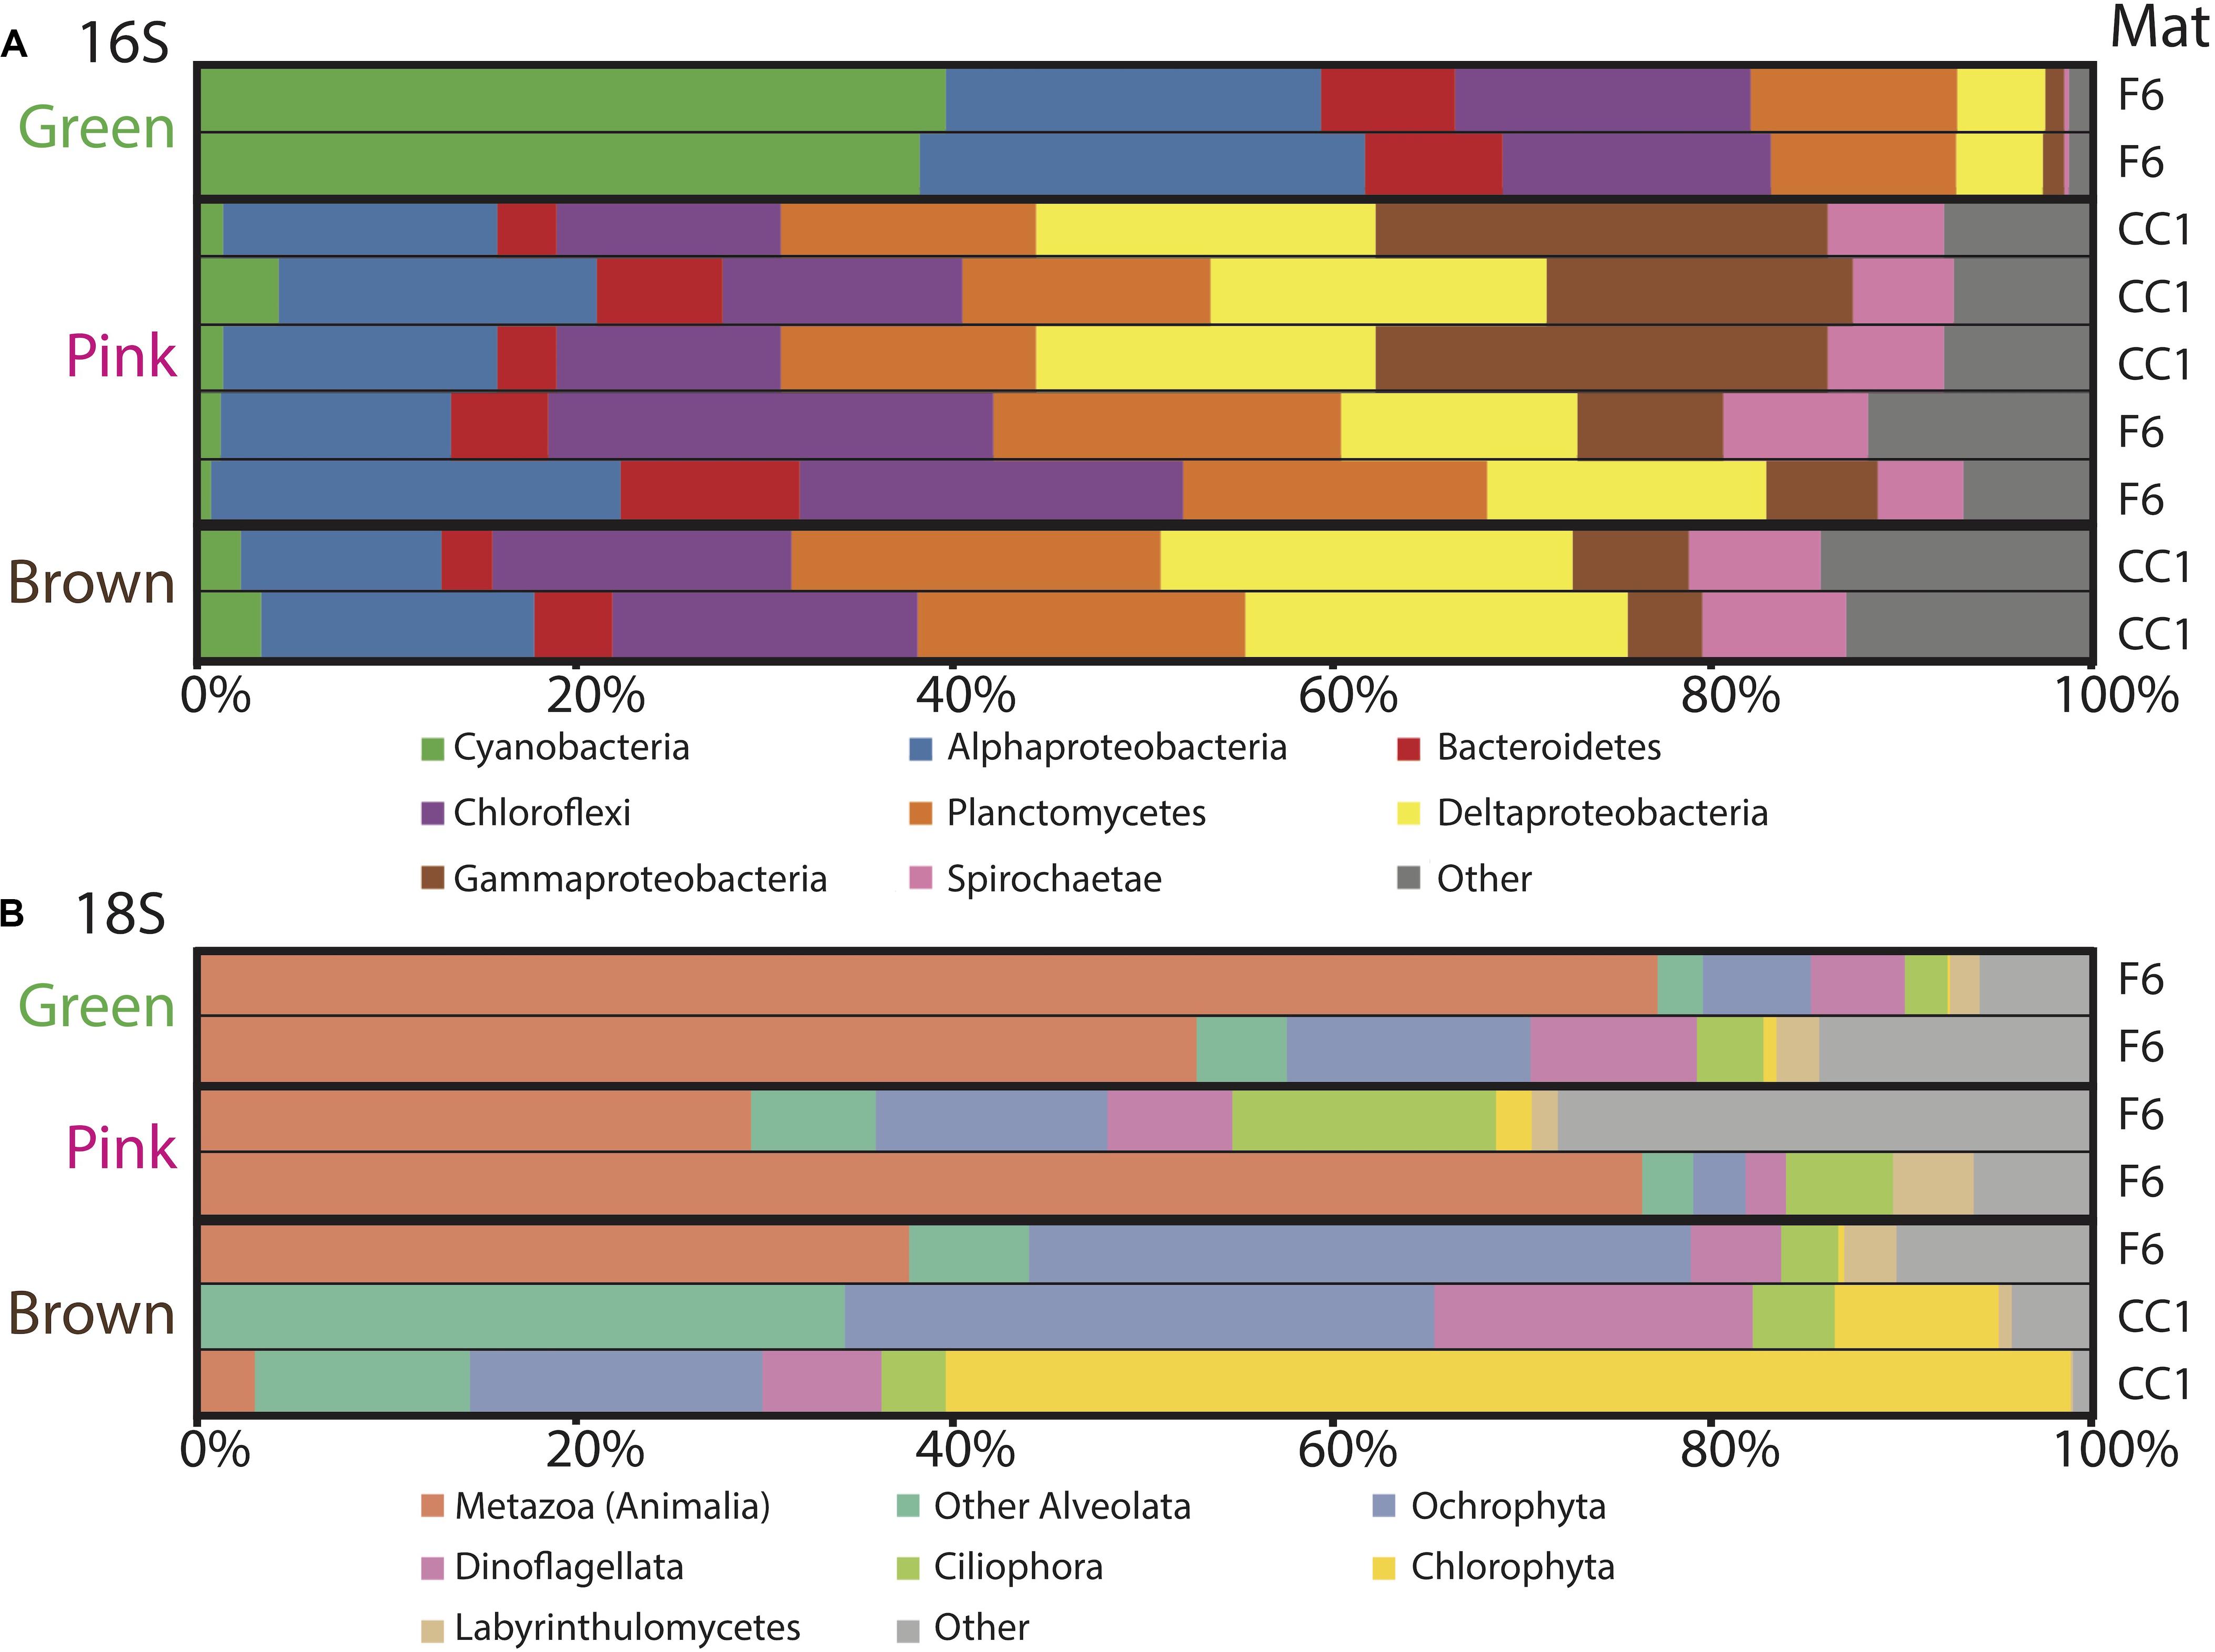
Figure 5. Microbial diversity with depth in the green, pink and brown layers of polygonal mats CC1 and F6 recovered using iTag sequencing of the (A) 16S and (B) 18S rRNA genes. Relative abundances (%) do not include reads unassigned to any taxon. Operational taxonomic units assigned to families constituting a small percentage of total reads are labeled “other.” Mats sampled for the data are indicated on the right.
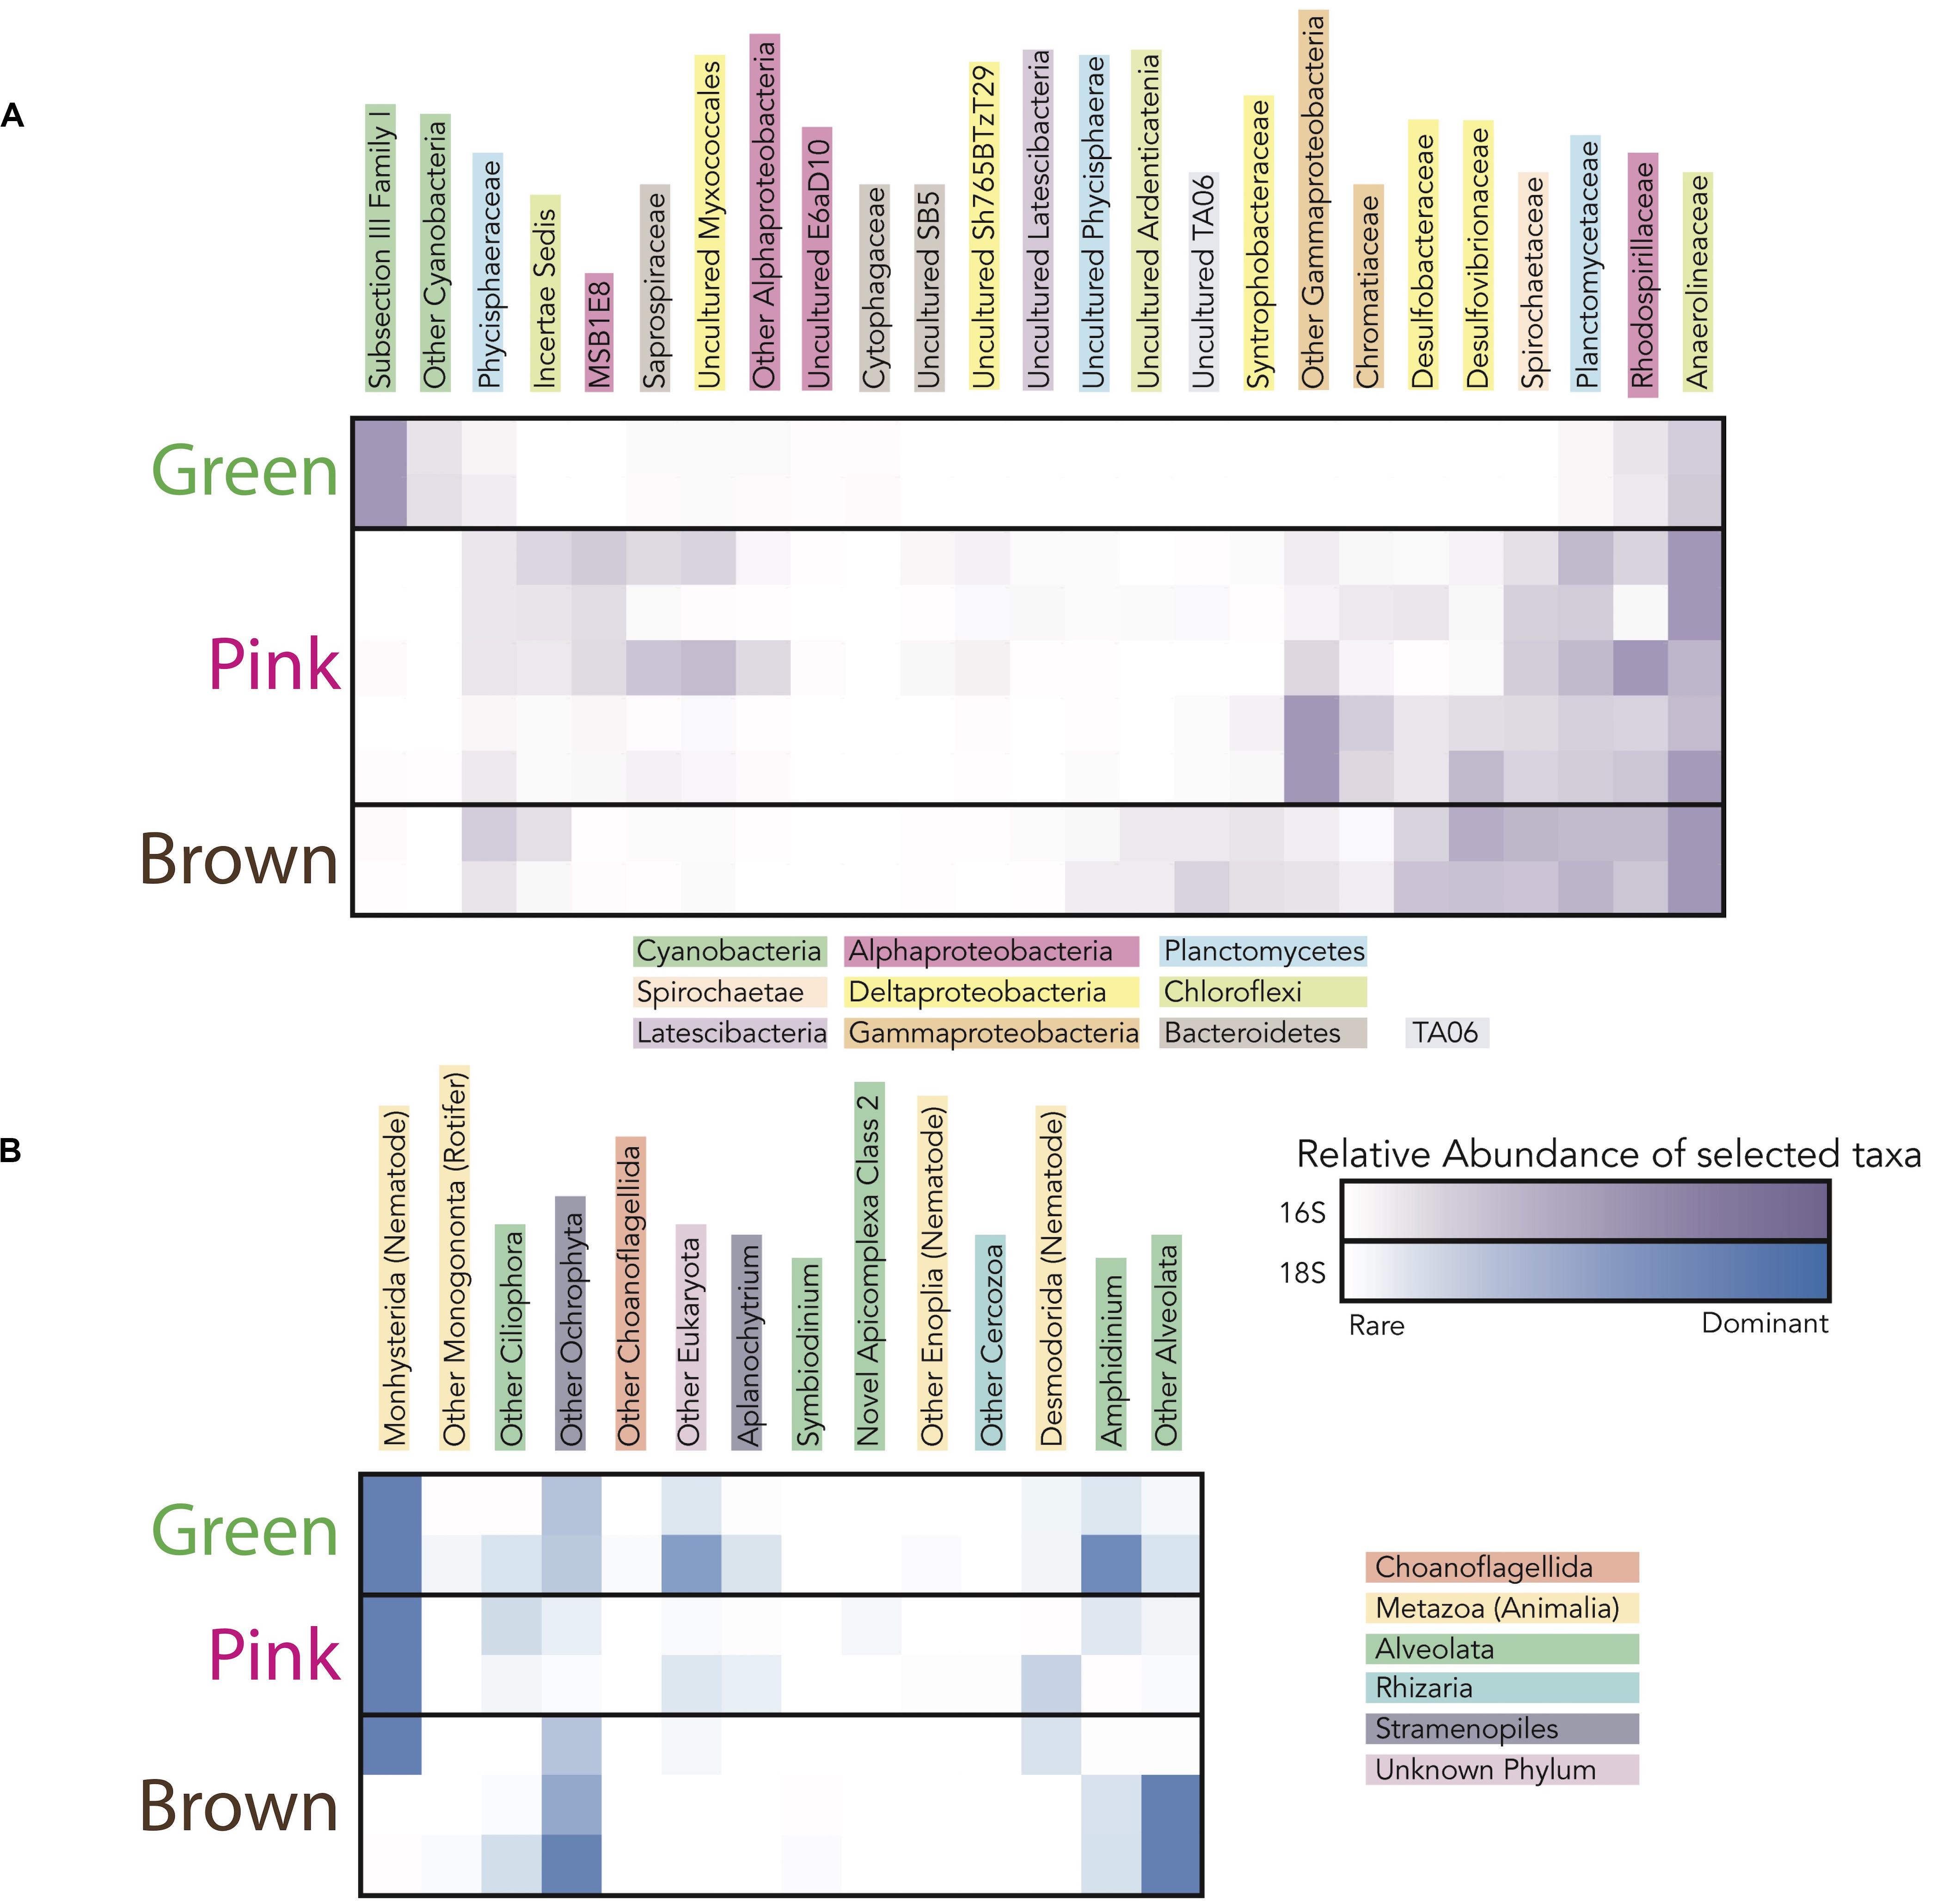
Figure 6. Heatmap showing the taxa (i.e., operational taxonomic units clustered at the 97% level) responsible for the differences in microbial community diversity between the green, pink, and brown layers in sites CC1 and F6 from (A) 16S rRNA gene data and (B) 18S rRNA gene data. Families included in heatmaps have maximum relative abundance in any sample ≥ 1% of total community and represented families responsible for 95% of variance (calculated using simper) between mat layers categorized by color. The darkness of the purple (for 16S rRNA gene data) and blue (for 18S rRNA gene data) colors corresponds to the relative abundance of taxa in each layer.
In general, OTUs recovered by our 16S rRNA gene sequencing surveys were assigned to members of the Cyanobacteria, Proteobacteria, Chloroflexi, Bacteroidetes, and Planctomycetes; these taxa dominated the bacterial communities at CC2 (Figure 4) and the other polygonal mat sites (Figure 3). Archaeal OTUs were exceptionally rare and represented < 0.5% of the taxa identified in the 16S rRNA gene analysis. Metazoans (mostly nematodes) and various taxa of alveolates (including dinoflagellates and ciliates) dominated taxonomic assignments of OTUs from the 18S rRNA gene surveys of eukaryotic diversity. Reads unassigned to any taxon composed 22% of the total 16S rRNA gene reads and 17% of the total 18S rRNA gene reads from CC2; this was similar to other sites and reflects a combination of reads not sufficiently diagnostic for taxonomic classification and known biases associated with the amplicon sequencing approach.
To evaluate changes in relative abundances of taxa with depth, as recognized by molecular means, we compared microbial diversity data from samples of two green, five pink, and two brown layers from polygonal mat sites CC1 and F6 (Figure 5). Cyanobacteria dominated bacterial diversity in the green layers of sampled polygonal mats, representing 40% of taxa identified. In the pink and brown layers, cyanobacteria represented only 1% of taxa identified. Pairwise comparisons were used to compute the contribution of each taxon to the total Bray-Curtis dissimilarity between sample pairs (e.g., microbial communities of green layers vs. those of pink layers) using the simper similarity percentage analysis in the vegan R package (Clarke, 1993; Oksanen, 2011; Oksanen et al., 2017; R core team, 2017). This analysis enabled us to determine the taxa responsible for differences between sample sets (Figure 6). The results indicated that bacterial community compositions in the pink and brown layers were more similar to each other than they are to communities of the green layer. The pink and brown layers were dominated by alpha-, gamma-, and deltaproteobacteria, including the families Rhodospirillaceae, Rhodobacteraceae, and Chromatiaceae. All three families contain anoxygenic phototrophic members, consistent with light penetration into pink and brown layers of the mats. Other important taxa in the pink and brown layers were members of the families Desulfovibrionaceae and Desulfobacteriacea, which contain heterotrophic sulfate reducers. Relative to the green layer, the pink and brown layers were also enriched in OTUs assigned to Chloroflexi (largely of the family Anaerolineaceae), Planctomycetes (of the families Planctomycetaceae and Phycisphaeraceae), and Spirochaetaceae. Thus, taxa known to include sulfate reducers, fermenters, and other anaerobic heterotrophs increased in relative abundance with depth (Figures 5, 6).
Trends in abundance with depth were more conspicuous for the eukaryotes (Figure 5). Metazoa were the most abundant eukaryotes in the green (∼50–80%) and pink layers (∼30–80%) across samples, as well as in the brown layer of F6 (∼90%). High abundances of metazoans have been reported for other marine microbial mat environments, which have been attributed to metazoan OTUs overwhelming 18S rRNA gene libraries (Feazel et al., 2008; Myshrall et al., 2010; Edgcomb et al., 2014). Additional common OTU assignments in all layers included eukaryotic group categorized as “Other Alveolata” (i.e., non-dinoflagellate or -ciliate taxa), Ochrophyta, Dinoflagellata, Ciliophora, Chlorophyta, and Labyrinthulomycetes. Nematodes were the most common OTU assignment within the Metazoa, although signatures of flatworms, gastropods, copepods, and rotifers were also recovered. OTUs assigned to plant taxa were rare, despite the nearby presence of mangroves (<0.5% of total 18S rRNA gene survey diversity; 0 to ∼25% of Archaeplastida OTUs).
Microbial Assemblages From Microscopy
Light microscopy revealed that the surface pigment-rich layers contained more diverse microbial assemblages than the lower pigment-poor layers (Figures 7–9 and Supplementary Table S2). The green layer was the most diverse – containing abundant distinctive filaments of nostocalean cyanobacteria (especially Scytonema, e.g., Golubic and Hofmann, 1976; relative abundance = 44%), other thin (<1 μm across) filaments (30%), pennate diatoms (15%), dinoflagellates (5%), arthropods such as copepods (4%), and rare nematodes (1%). Rare taxa (<1%) included helical cells, colonial coccoidal cyanobacteria, colonial elongate cells, pink-colored colonial coccoids likely to be phototrophic Proteobacteria, tintinnid tests, and other probable ciliates (i.e., cells that resemble ciliates but lacked apparent cilia, perhaps due to sample processing).
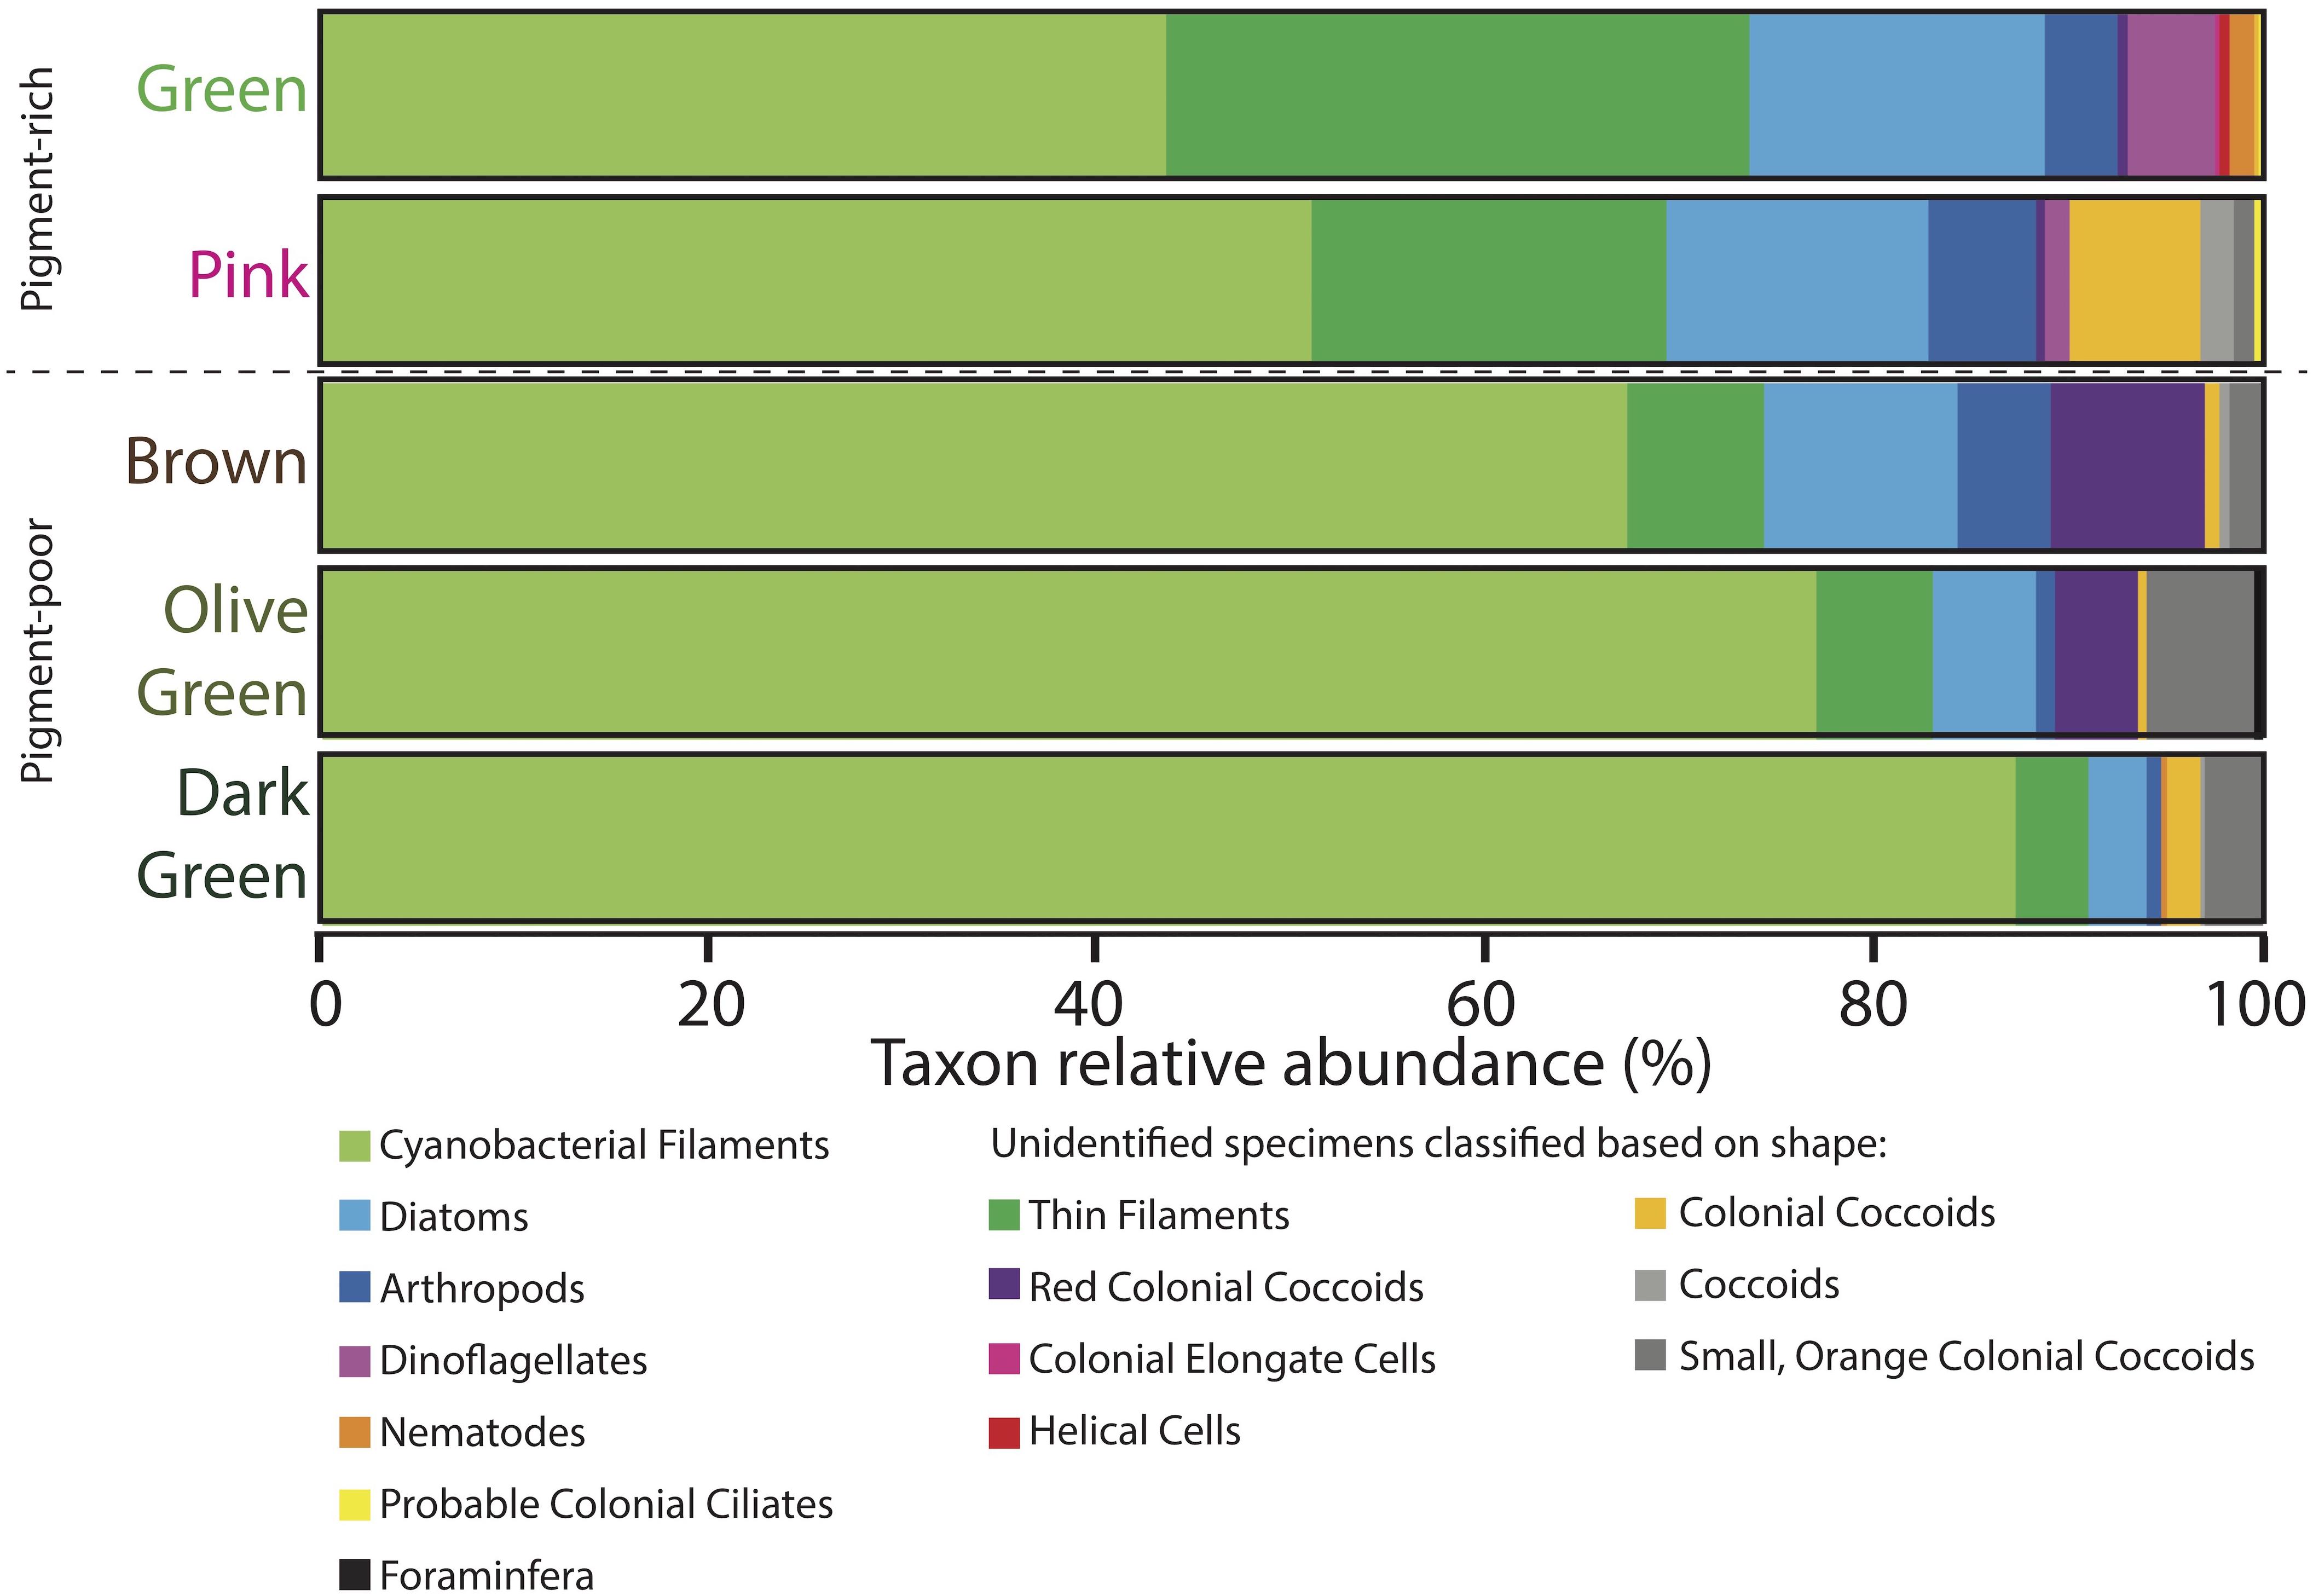
Figure 7. Microbial assemblages expressed as percent taxon relative abundance from four 100-counts of specimens on strewn wet mount microscope slides via optical microscopy. Specimens observed under the microscope that could not be positively identified because of a lack of diagnostic features are classified based on shape and are listed in the two rightmost columns. Data for four 100-counts and standard deviations are provided in Supplementary Table S2.
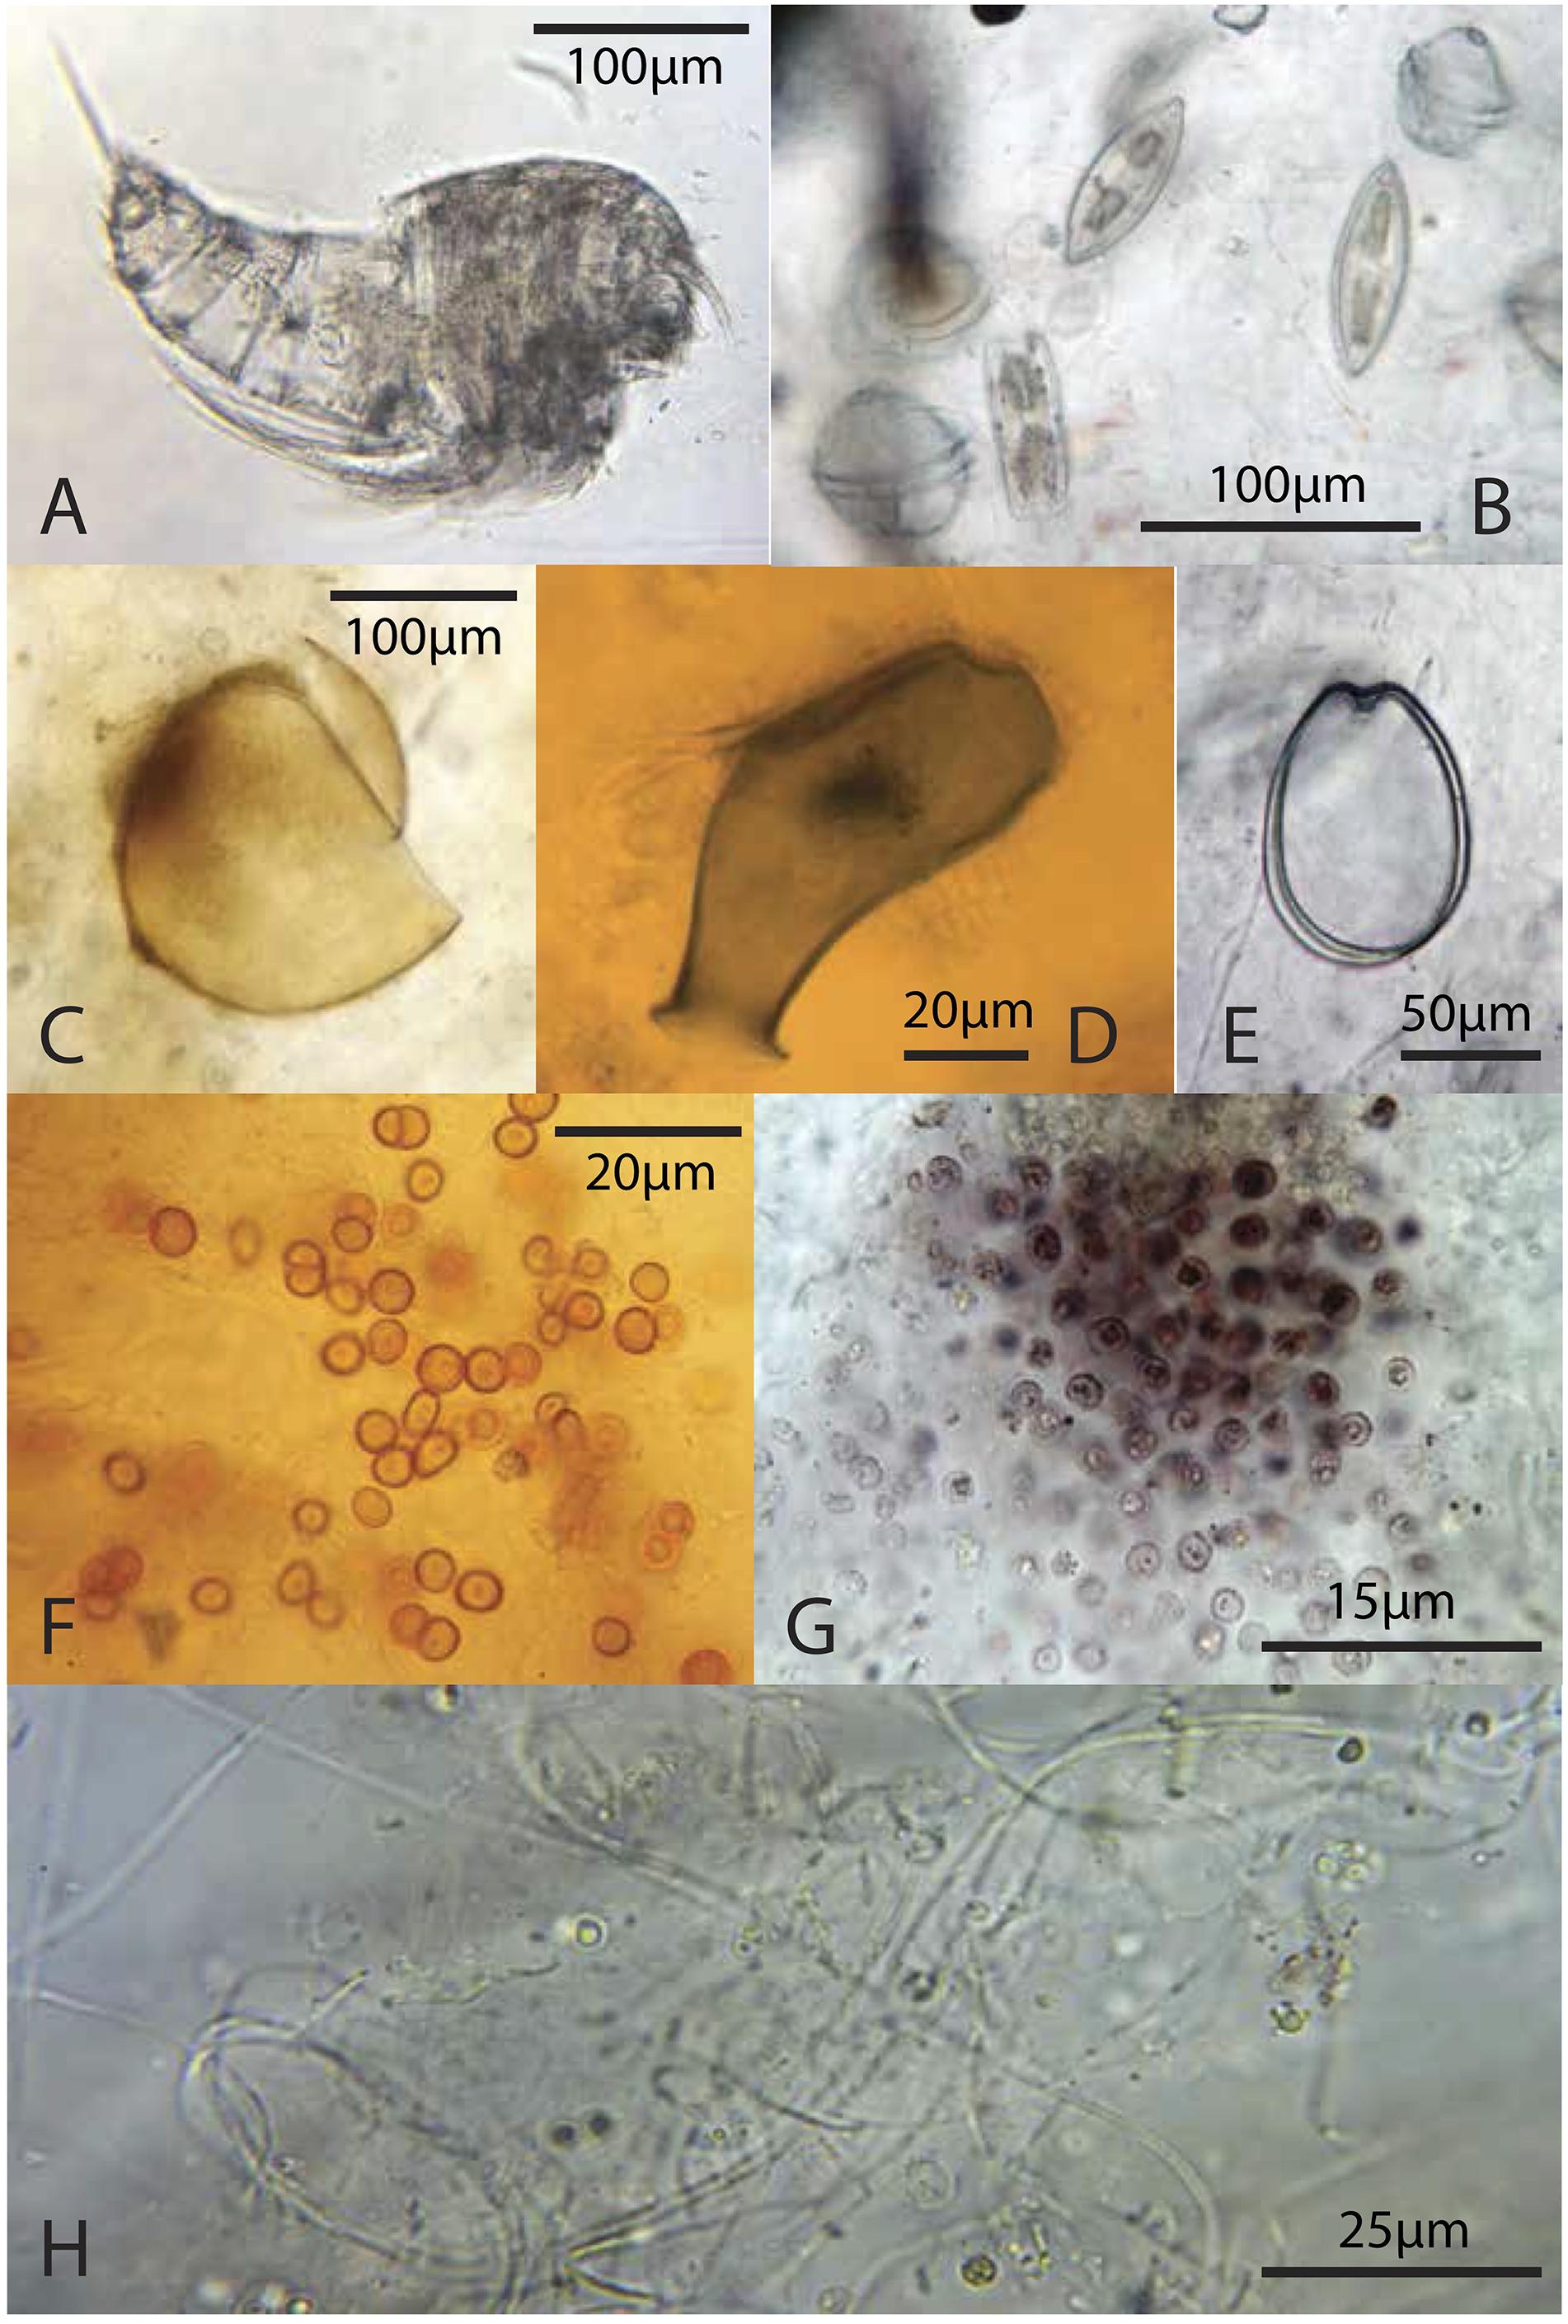
Figure 8. Representative microbiota: (A) copepod from the green layer; (B) pennate diatoms and dinoflagellates from the green layer; (C) likely tintinnid from the green layer; (D) testate protist, possibly folliculinid ciliate, from a deep, pigment poor-layer, (E) athecate dinoflagellate from the green layer; (F) orange coccoid cells from the green layer; (G) pink coccoid cells from the brown layer; (H) thin filaments from the brown layer.
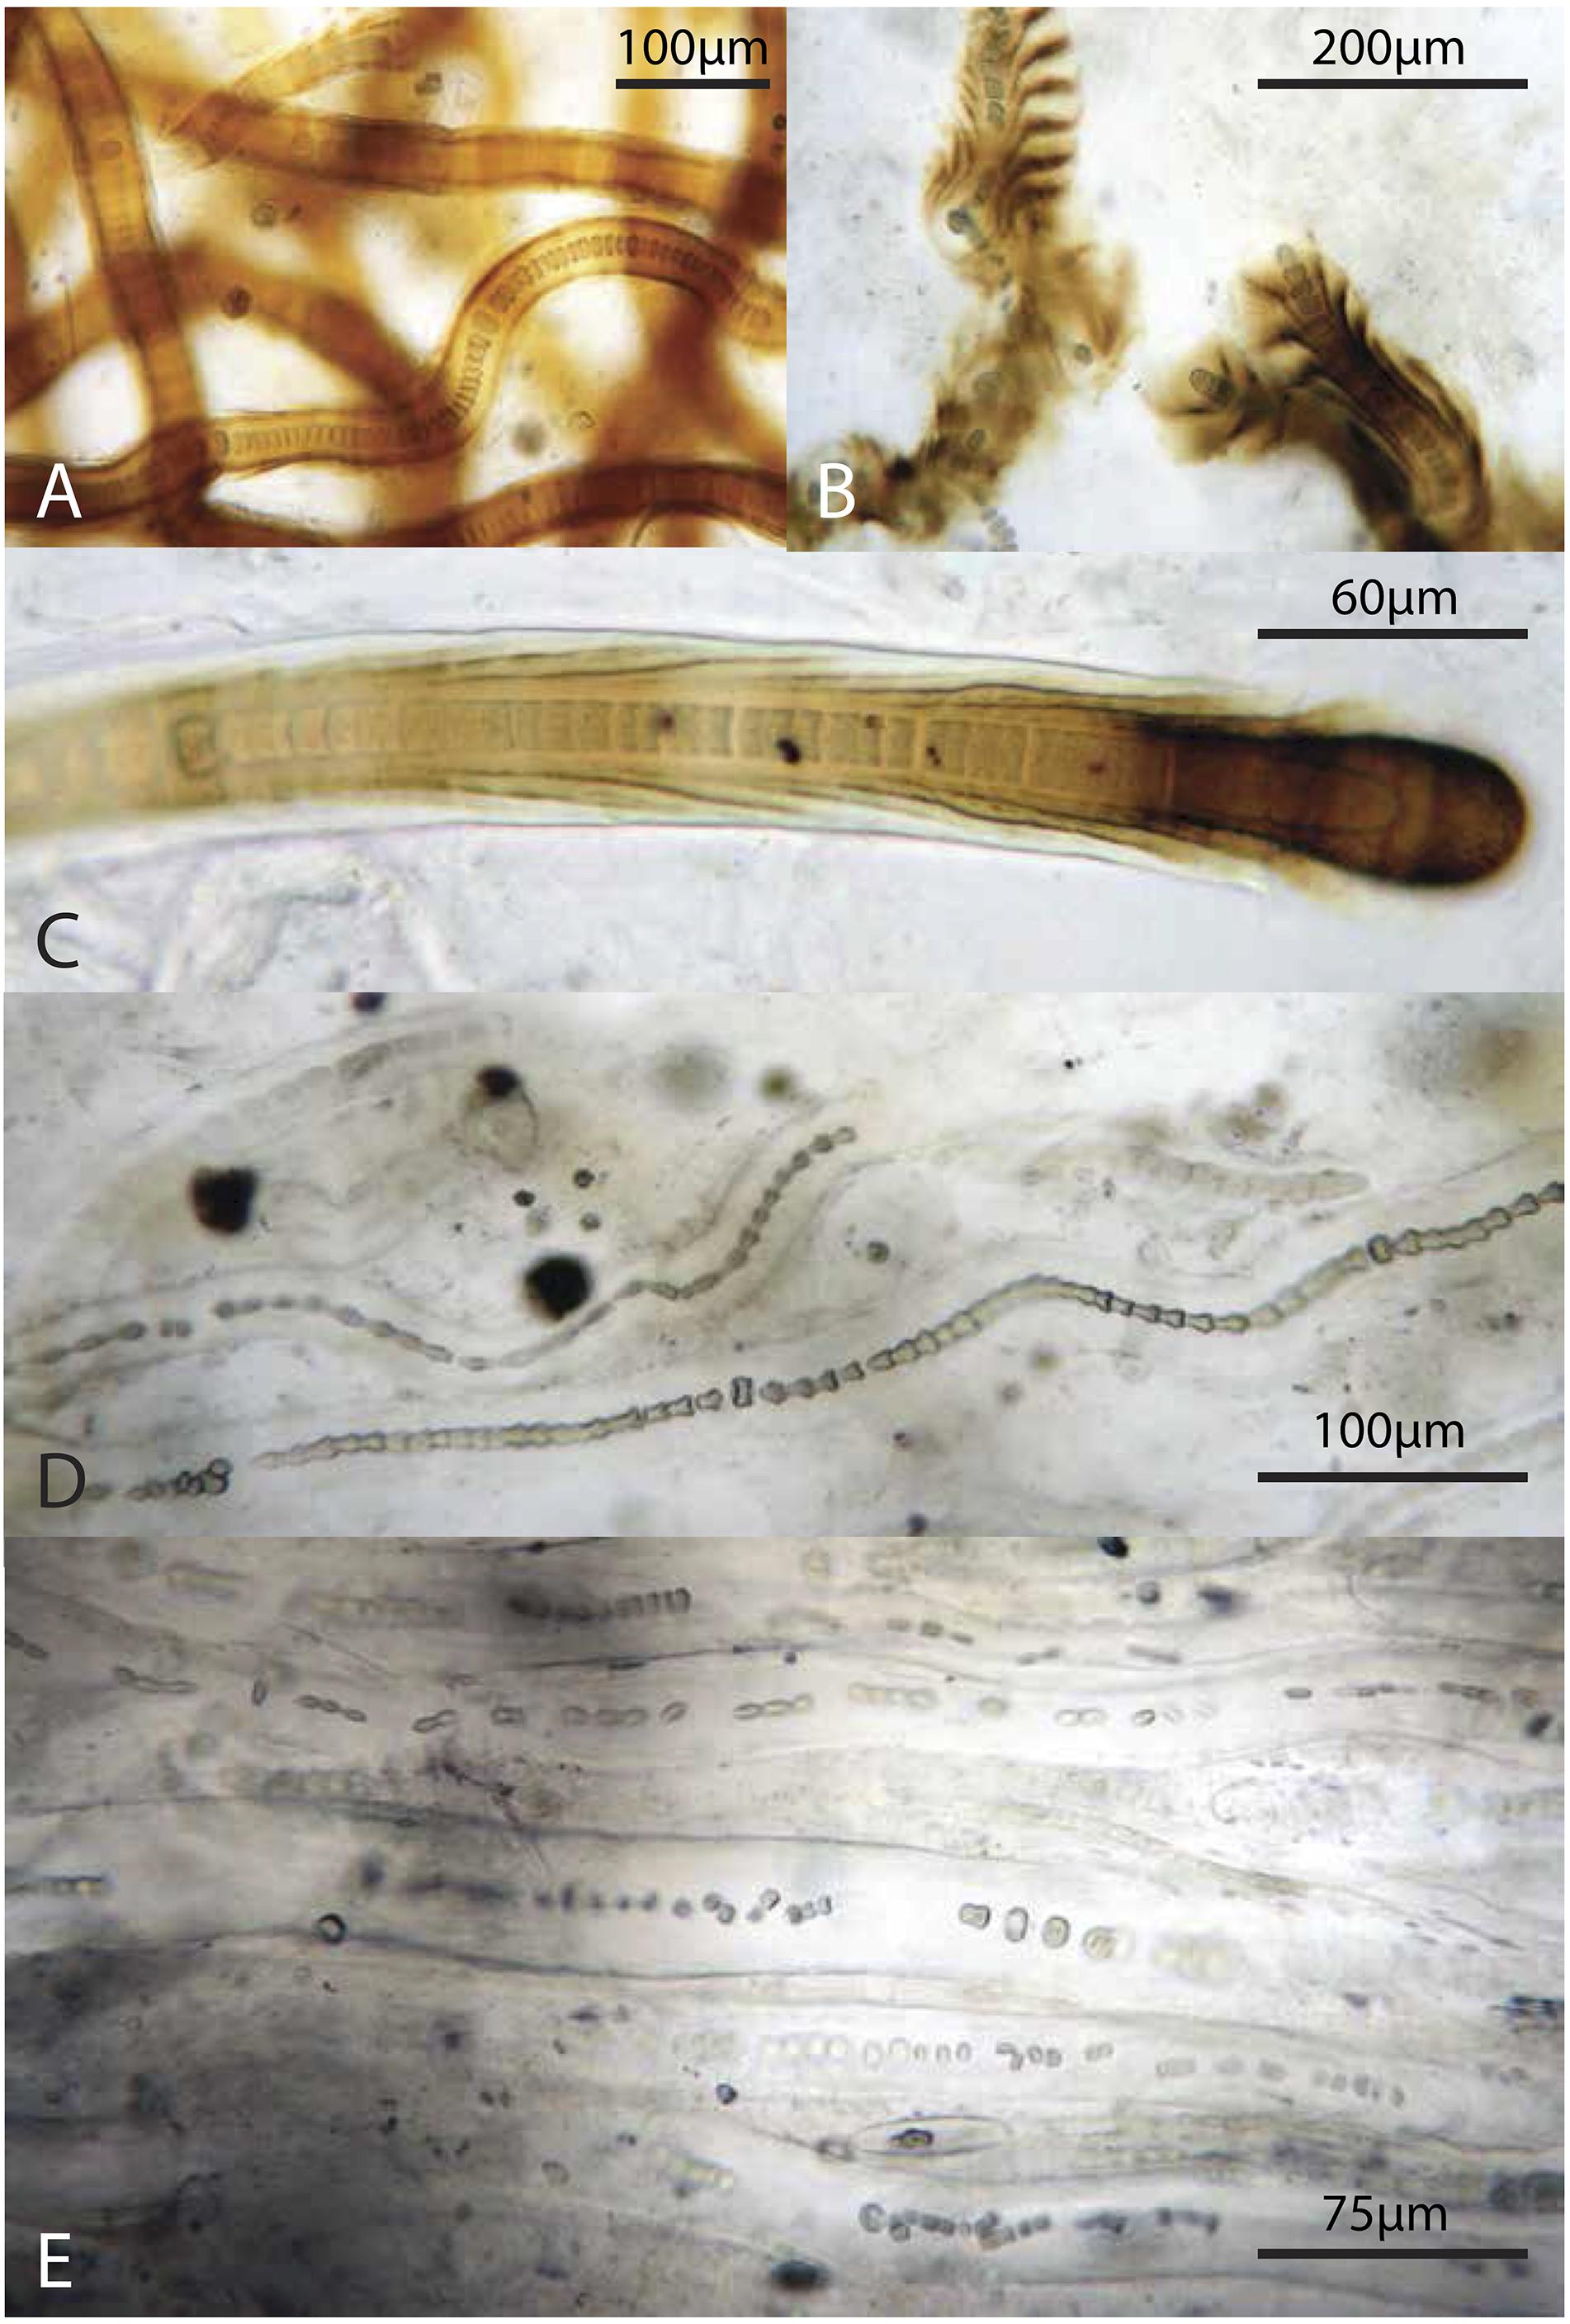
Figure 9. Representative filamentous Cyanobacteria (cf. Scytonema): (A–C) from the green layer, (D,E) from the pigment-poor layer below the dark green layer. Note varying degrees of preservation of trichomes.
The pink layer was similar in composition to the green layer but contained more shrunken cells and physical disarticulation (Figures 7–9 and Supplementary Table S2). Cyanobacterial filaments displayed high relative abundance in this layer (51%), as did colonial coccoids (7%), arthropods (6%), and non-colonial coccoids (2%). Cyanobacteria showed varying degrees of necrosis (Figure 9), implying that their abundance likely reflects differential preservation rather than continued dominance within the living pink layer community. Arthropods were represented mostly by decay-resistant cuticles (cf. Briggs and Kear, 1994; Briggs, 1999). Rare non-colonial coccoids (2%) and small, orange colonial coccoids (1%) also occurred in this layer. The relative abundances of thin filaments, pennate diatoms, and dinoflagellates decline slightly from the overlying green layer to values of 18, 14, and 1%, respectively (Figure 7). Pennate diatoms and dinoflagellates were represented largely by empty frustules and evacuated cell walls and cysts, respectively.
The relative abundances of many organisms decreased with depth in the pigment-poor layers, whereas large cyanobacterial filaments increased in relative abundance (Figure 7 and Supplementary Table S2). In the brown layer, the relative abundances of pink colonial coccoids (8%; likely phototropic Proteobacteria) and small orange colonial coccoids (2%) increased relative to the overlying layers (Figure 7 and Supplementary Table S2). Large cyanobacterial filaments (67%) were abundant and apparent to the unaided eye in the form of a robust, vertically oriented filamentous fabric (Figure 2G) that recurred in the underlying the olive-green and dark-green layers.
The olive-green and dark-green layers continued the trend of increasing proportional abundance of cyanobacterial filaments (77 and 87%, respectively) with increasing loss of morphological detail. There was also a decrease in positive identification of eukaryotic groups in these layers (6 and 4%, respectively, Figure 7 and Supplementary Table S2) – an effect largely due to increased disarticulation (e.g., more specimens were identifiable to only “arthropod” rather than to more specific groups). The relative abundance of the pink colonial coccoids, which were most common in the brown layer, decreased to 4% of specimens in the olive-green layer and were not observed in the underlying dark-green layer. The relative abundance of small orange coccoidal colonies peaked at a value of 6% in the olive-green layer and decreased to 3% in the dark-green layer. Diatoms and thin filaments were still observed within the lowermost cohesive layers of the mat, but dinoflagellates did not persist.
Although relative abundances of taxa in the remainder of the pigment-poor layers were not quantified via 100-counts, we found that the layer immediately underlying the dark-green layer was similar to the one above, with a strong vertical fabric and a high proportion of large cyanobacterial filaments such as Scytonema. Thin filaments were also abundant and pennate diatoms were common, but little else was identified. Further below that layer, the mat fabric textures were very different from those above: the mat material was less cohesive, contained fewer large cyanobacterial filaments, had no discernable vertical fabric, but had a high proportion of amorphous organic matter. Finer filaments occurred as infrequent clusters along with rare pennate diatoms in these layers.
In summary, Scytonema and other cyanobacteria not only dominated biomass in the surface mat where these taxa thrive, but also increased in relative abundance with depth. At depth, these filaments exhibited increasingly poor sheath preservation, with a loss of definition of sheath morphology (Figure 9). Other bacteria as well as microscopic eukaryotes (e.g., copepods and pennate diatoms) were present in all layers (Figure 8), although different taxa displayed varying resistance to decay and, in the case of organisms with mineralized skeletons, dissolution.
Organic Geochemistry
The green and pink pigment-rich layers contain orders of magnitude more intact polar lipids (IPLs) than the brown layer and other pigment-poor layers below, reflecting the substantial depletion of microbial biomass below the pigment-rich layers of the mat (Figure 10A). Photoautotroph lipids – betaine lipids (BL), glycolipids (GL) sulfolipids (SL) – dominate in all layers, however, bacterial phosphatidylglycerols (PG, C12:0 to C16:0) are most abundant in the pink and brown layers and increase as a proportion of total IPL with depth (Supplementary Table S3). In addition, IPL core fatty acid compositions were different between the green and subjacent layers: in the cyanobacteria-rich green layer, IPL core fatty acids are dominantly C18:3, C16:1, C18:1, while in the deeper layers, C17 fatty acids derived from anoxygenic phototrophic bacteria are more prominent (Supplementary Table S3). Isomers of the pigments pheophytin a and bacteriophaeophytin a – molecules derived from chlorophyll a and bacteriochlorophyll a, respectively, – were also detected. Pheophytin a was the major pigment in IPL extracts from the green layer, while bacteriophaeophytin a from anoxygenic phototrophic bacteria was the major pigment detected in IPL extracts from deeper in the mat (Supplementary Table S3).
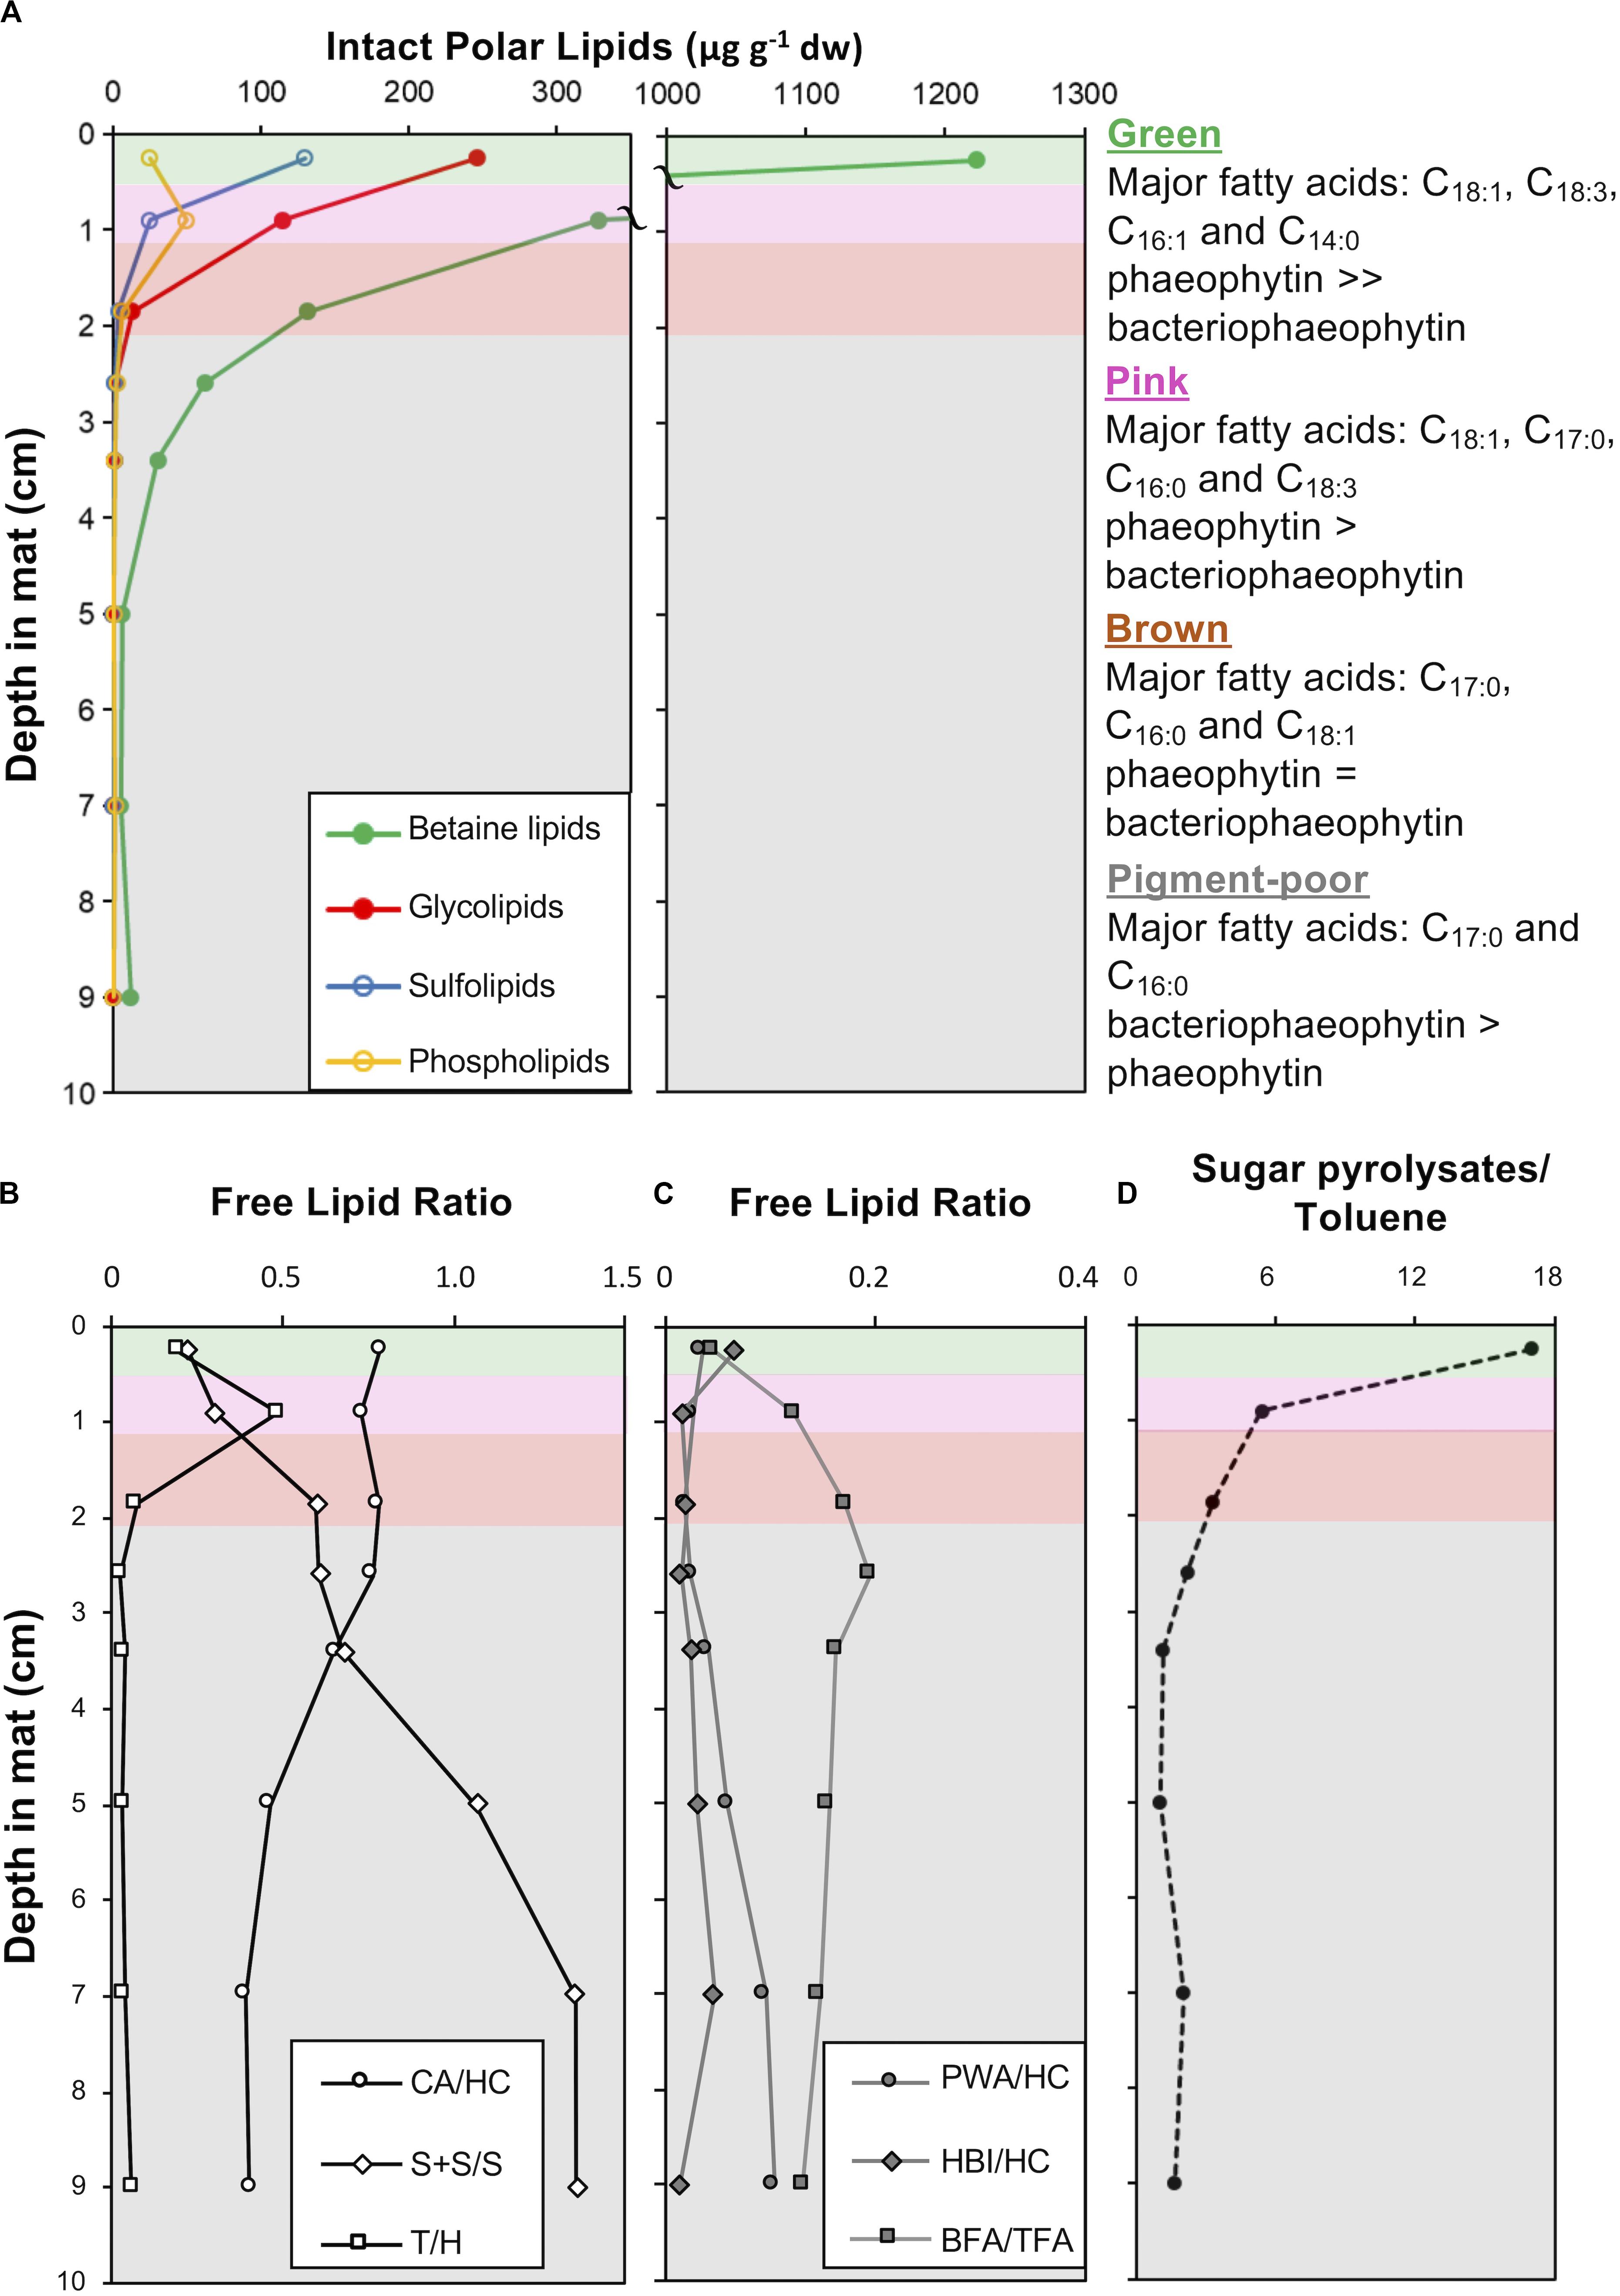
Figure 10. Depth profiles in CC2 showing: (A) intact polar lipid (IPL) classes, (B) free lipid ratios with abbreviations: CA, cyanobacterial alkanes; HC, total hydrocarbons; S + S/S, stanols and steranes/stenols; T, taraxerol; and H, total hopanols (C) free lipid ratios with abbreviations: PWA, plant wax alkanes; HC, total hydrocarbons; HBIs, highly branched isoprenoids; BFA, bacterial fatty acids, and TFA, total fatty acids (D) the ratio of sugar to toluene pyrolysates in pigment-rich (green and pink) and pigment-poor (brown, olive-green, dark-green, and three underlying) layers. A summary of the major fatty acids bound in IPLs is given to the right of the plots and full dataset is provided in Supplementary Table S3. The major unesterified, free lipid data and ratios are provided in Supplementary Table S4. Pyrolysates detected are reported in Supplementary Table S5. Total ion chromatograms and mass spectral information for identified lipids are provided in Supplementary Figures S3, S4.
Fatty acids, alcohols (sterols, hopanols, alkanols) and hydrocarbons (branched and normal alkanes, steranes, and hopanes) dominate the free lipid biomarkers (i.e., free, unesterified lipids; Figures 10B,C and Supplementary Figures S1, S2, and Supplementary Table S4). Bacterial free fatty acids (iso-, anteiso, C15 and iso-, anteiso, mid-chain branched, and normal C17 fatty acids; Shiea et al., 1990; Kaneda, 1991; Coates et al., 2014) increase from 5% in the surface green layer to up to 16% of total free fatty acids in deeper layers. Stanols and steranes derived from progressive diagenetic alteration of unsaturated sterols (stenols; Wakeham, 1989) produced by eukaryotes also increase in relative abundance with depth. The abundance of hopanes relative to total hydrocarbons increased with depth (Supplementary Table S4). Cyanobacterial hydrocarbons – mono-, di- & trimethyl alkanes with chain lengths between 16 and 18 – were major hydrocarbons at all depths, with saturated isomers abundant with depth (Supplementary Table S4). Diatom-specific C25 highly branched isoprenoids (Grossi et al., 2004) and vascular plant biomarkers (taraxerol and long chain n-alkanes with carbon preference index > 1; Bray and Evans, 1961; Eglinton and Hamilton, 1967; Versteegh et al., 2004) were also detected as major lipids (Supplementary Table S4).
Pyrolysis gas chromatography-mass spectrometry (py-GC-MS) data on extracted mat residues highlighted macromolecular compositional and structural changes in the mat matrix with depth. The green and pink mat layers contained isomers of furancarboxaldehye and methyl furancarboxaldehye as major pyrolysates (Supplementary Table S5; Räisänen et al., 2003). These polysaccharide-derived pyrolysates decreased in relative abundance relative to toluene – a common pyrolysate of kerogen – with increasing depth in the mat (Figure 10D).
Carbon Isotopes
Acid-insoluble organic carbon δ13C values ranged between −14.3 and −12.3‰ (Figure 11; mean = −13.5‰, σ = 0.6‰, n = 7). The surface pigment-rich layers displayed more variable δ13C values than the lower pigment-poor layers: the δ13C value is −12.3‰ in the green layer and −14.3‰ in the pink layer. The pigment-poor layers had δ13C values that range from −13.2 to −13.9‰ (mean = −13.6‰, σ = 0.3‰, n = 5). The δ13C pattern at our study site CC2 was similar in the majority of other polygonal mat sites across the island (Supplementary Table S6).
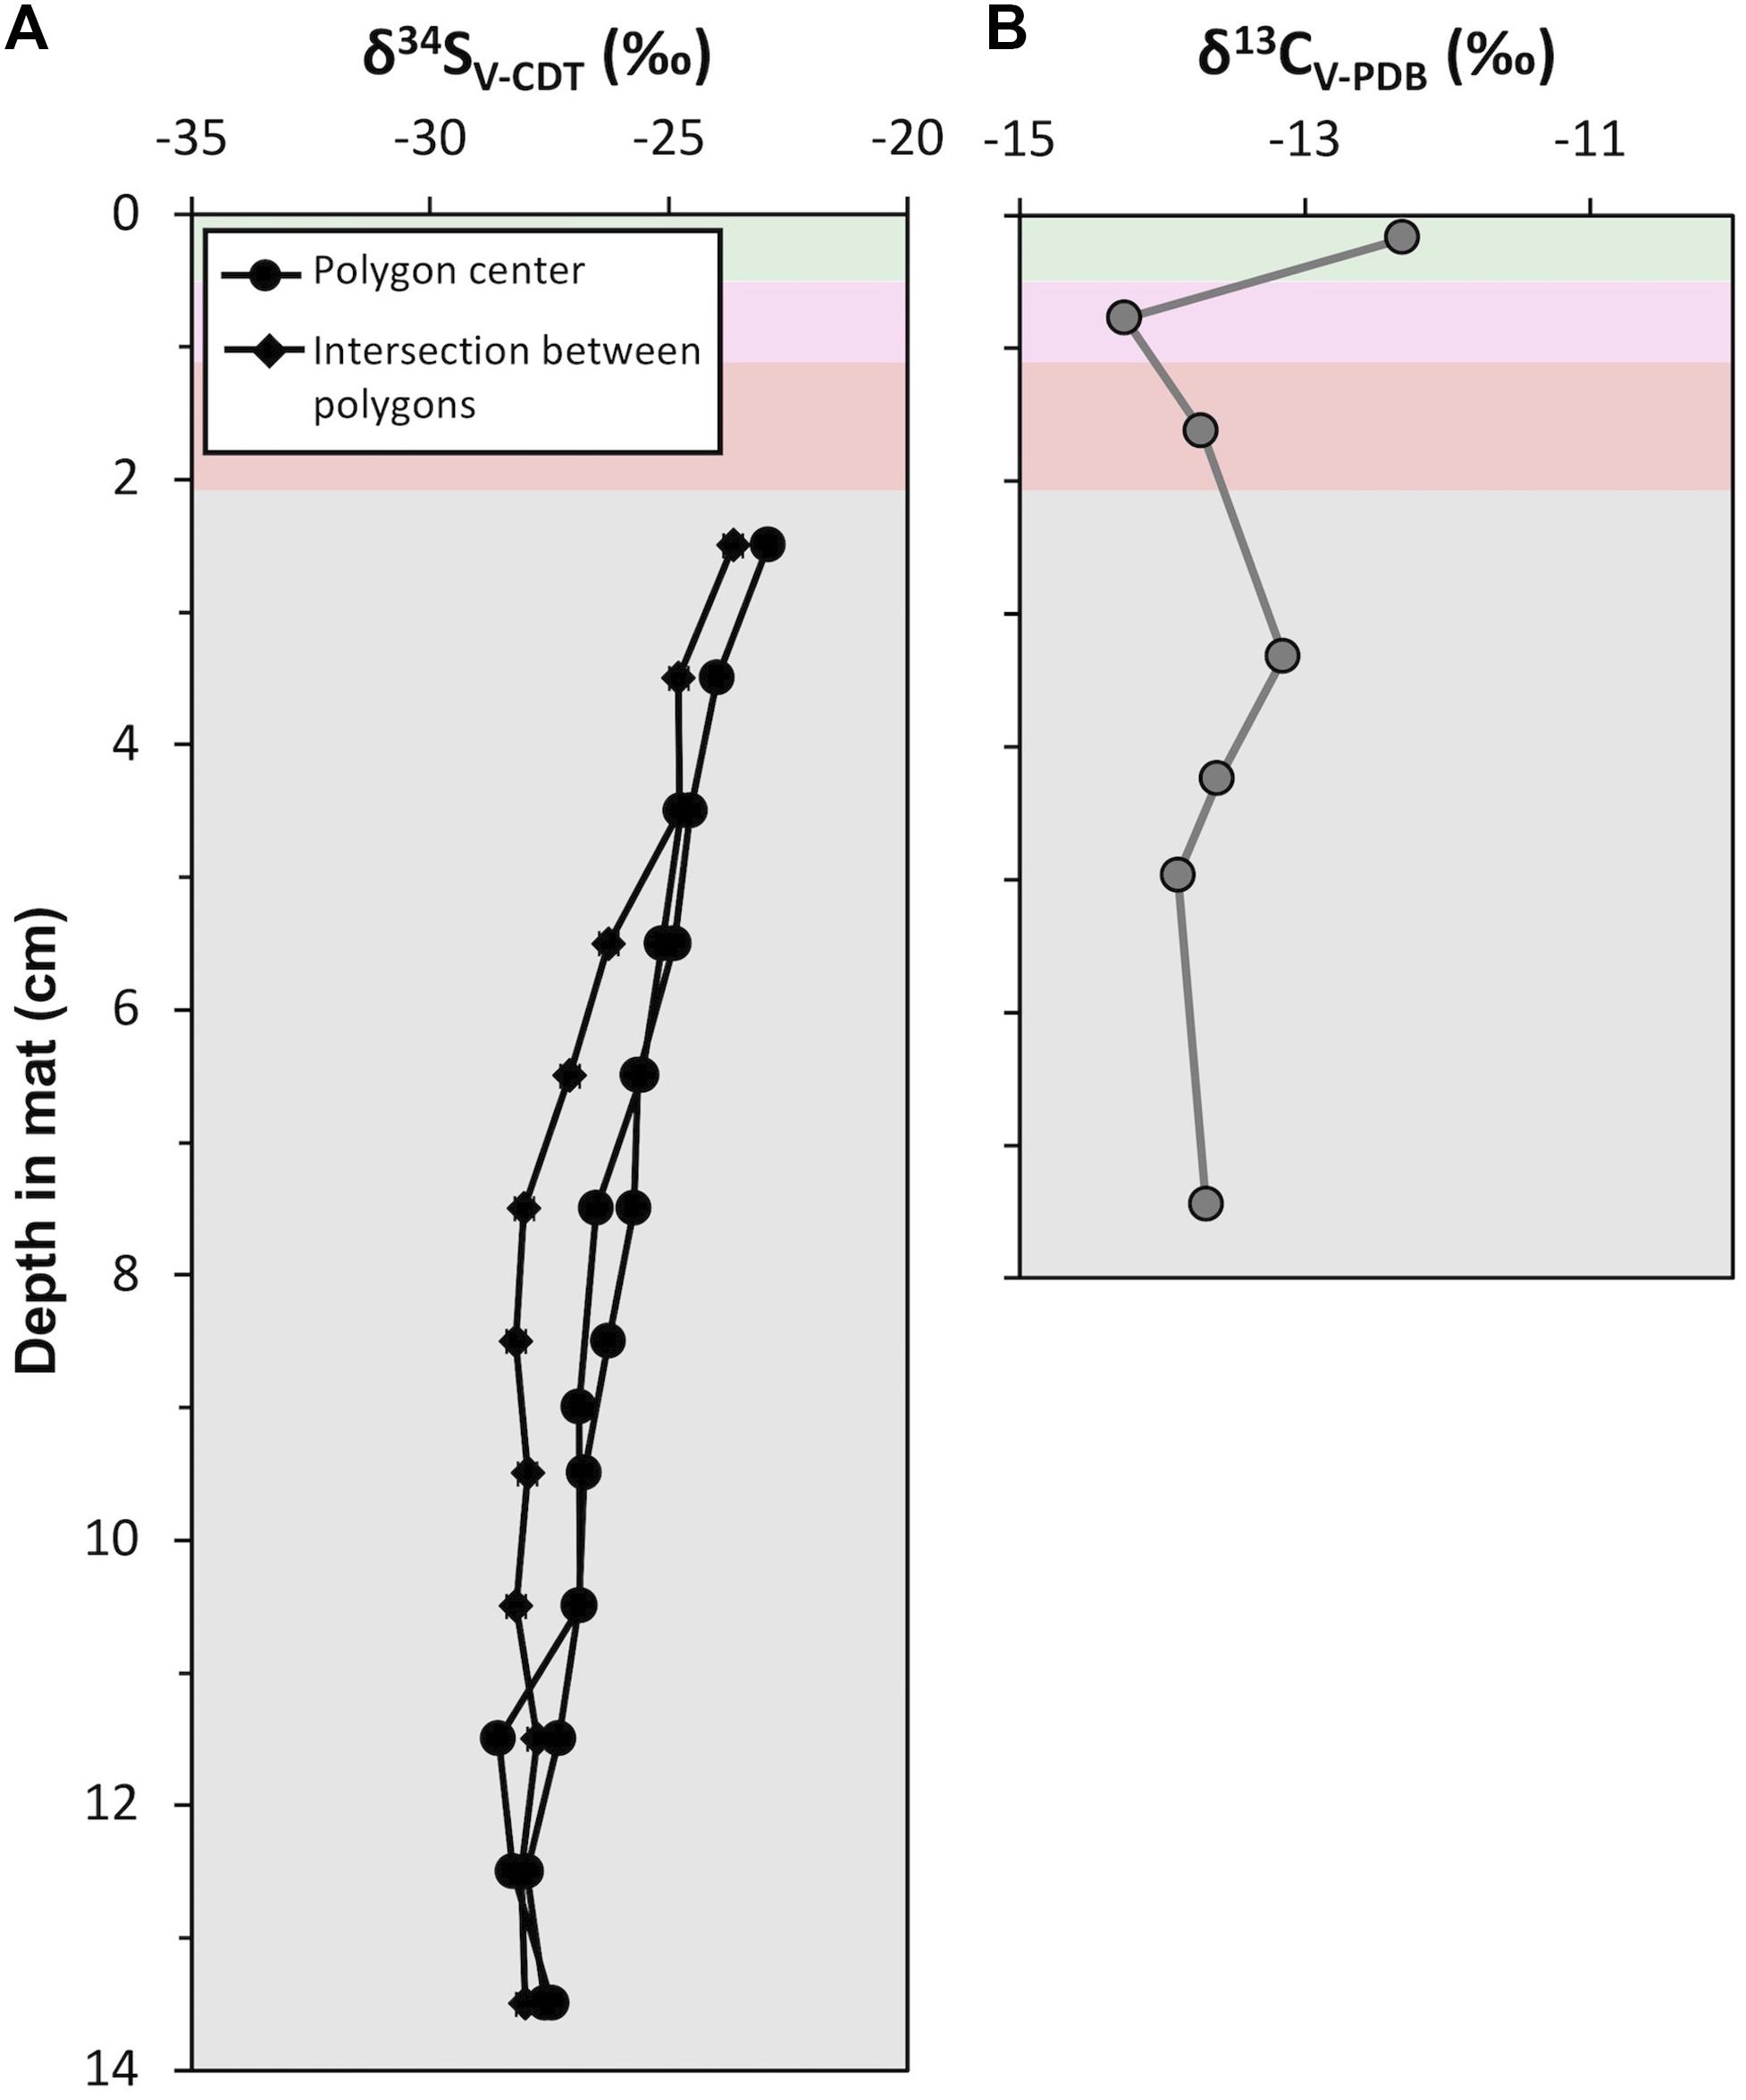
Figure 11. Depth profiles of isotope geochemistry from CC2: (A) Sulfur isotope (δ34S; ‰) values of porewater sulfide from polygon centers (black line with circle) and an intersection between polygons (black line with squares). Analytical uncertainty in δ34S values is ± 0.2‰. (B) Carbon isotope (δ13C; ‰) values of acid insoluble residue. Analytical uncertainty in δ13C values is ± 0.1‰. Data are provided in Supplementary Tables S6, S7.
Sulfur Isotopes
Sulfur isotope values were measured from porewater sulfide precipitated on photo film within pigment-poor layers. There was not sufficient recovery of porewater sulfide from pigment-rich layers for analyses. Three depth profiles of δ34S values were analyzed (Figure 11); two from polygon interiors and one at the intersection between polygons. In the polygon interiors, δ34S profile decreased from a maximum of −24.1‰ in the olive-green layer (i.e., 2.5 cm below the mat surface) to ∼−28.8‰ at ∼13 cm depth. The boundary between the polygons showed a slightly different δ34S pattern: δ34S values decreased from −24.9 to −29.2‰ between 2.5 cm and 7.5 cm and remained at a mean value of −29.2‰ (σ = 0.2%, n = 7) below 7.5 cm. This pattern of moderately decreasing δ34S values from ∼−23‰ at the top of the zone of sulfide accumulation in porewaters to ∼−28‰ at depth at our study site CC2 was similar in other polygonal microbial mat sites (Supplementary Table S7).
Discussion
Microbial mats are both living communities and continually updated records of the past; the deep, pigment-poor layers are not only thriving heterotrophic ecosystems, but also palimpsests, overwritten transcripts of recent history. As a mat grows by accretion and material passes from the upper pigment-rich layers to those below, the organic structure of the material in pigment-poor layers becomes a homogenous, chemically recalcitrant, diagenetically altered pre-fossil mat (i.e., sugar pyrolysates:toluene pyrolysate ratio is constant with depth; Figure 10D). We observed that morphological and geochemical patterns throughout the depth of the mat reflect the interplay of biological, physical, and chemical processes that influence the location of living taxa and the degradation and decay of their biomass. Nonetheless, some morphological and geochemical signatures of certain taxa persisted with depth, albeit with changes that did not completely prohibit identification.
Little Ambergris Cay mats communities are broadly similar to those of other mat systems (e.g., Walter, 1976; Van Gemerden, 1993; Des Marais, 2003; Dupraz et al., 2009; Myshrall et al., 2010; Foster and Green, 2011; Louyakis et al., 2017). The pigment-rich layers contain abundant phototrophic organisms, with cyanobacteria dominant in the uppermost green layer and anoxygenic photosynthetic bacteria increasing in relative abundance within the underlying pink layer (Figures 5, 6). Similar to findings from previous microbial diversity studies of Little Ambergris Cay (Trembath-Reichert et al., 2016) and intertidal microbial mats along Highborne Cay in the Bahamas (650 km to the northwest; Baumgartner et al., 2009; Foster et al., 2009; Myshrall et al., 2010; Louyakis et al., 2017), 16S rRNA gene sequence analyses of Little Ambergris Cay polygonal mats revealed diverse bacterial populations dominated by Cyanobacteria, Proteobacteria, Planctomycetes, Bacteroidetes, and Spirochaetes. While the very minor archaeal input could be due in part to primer bias, low abundances of archaea are also found in Highborne Cay mats (Baumgartner et al., 2009; Myshrall et al., 2010). Also similar to mats from Highborne Cay (Myshrall et al., 2010), 18S rRNA gene sequence data from Little Ambergris Cay polygonal mats are dominated by metazoans (mostly nematodes) with some layers also containing alveolates and chlorophytes (Figures 4, 5). Another similarity between the two mat systems is that they contain microscopically conspicuous metazoans (Tarhan et al., 2013; Figures 7, 8). Although hypersaline microbial mats (e.g., Shark Bay; Burns et al., 2004; Papineau et al., 2005; Goh et al., 2009; and Guerrero Negro; Ley et al., 2006) have microbial communities distinct from those of the “normal marine” Highborne Cay and Little Ambergris Cay mat ecosystems, they are similar at the phylum level (Baumgartner et al., 2009; Myshrall et al., 2010). Thus, Little Ambergris Cay polygonal mats have similar “functional groups of microbes” (Van Gemerden, 1993), comparable not only to Highborne Cay, but also other well-studied microbial mat ecosystems, and is therefore a useful system to evaluate taphonomic patterns.
A distinguishing feature of mats at Little Ambergris Cay, however, is the lack of significant lithification. This allowed us to focus on how processes of degradation and decay acted upon fossils, molecular fossils, and isotope signatures during mat accretion in the absence of additional complexities imposed by lithification. If we assume that surface communities have remained relatively consistent over the period of mat accumulation – a reasonable assumption given similarity of mat communities within Little Ambergris Cay over seasonal and yearly timescales (c.f. Trembath-Reichert et al., 2016) and in mats elsewhere (Des Marais, 2003; Golubic et al., 2006; Baumgartner et al., 2009; Foster et al., 2009; Myshrall et al., 2010; Foster and Green, 2011; Maloof and Grotzinger, 2011; Louyakis et al., 2017) – then we can evaluate the preservation potential of different taxa in terms of morphological and geochemical signatures.
Taphonomy of Morphological Signatures and Molecular Fossils
Cyanobacteria were major contributors at the mat surface; genetic data indicate that they made up 40% of the taxonomic diversity in pigment-rich layers and microscopy indicated that they made up 44% of mat biomass in the green layer. Below the green layer, community composition trends diverged between methods. Genetic data and the concentration of IPLs from cyanobacteria decreased in relative abundance with depth, instead emphasizing the anoxygenic phototrophs known to conduct sulfide-oxidizing phototrophy (e.g., members of the families Chromatiaceae and Rhodospirillaceae; some of which may also contribute to heterotrophic breakdown of the mat). Microscopy, however, showed an increase in the relative abundance of cyanobacteria, albeit in varying states of decay. Similarly, free lipid biomarker analyses indicate that likely cyanobacterial hydrocarbons (i.e., monomethyl and dimethyl alkanes with chain lengths between 16 and 18, and normal and unsaturated C17 alkanes; Figure 10B; Supplementary Table S4; Shiea et al., 1990; Coates et al., 2014) remain abundant in deeper layers. This divergence can be explained in terms of living versus deceased organisms; genetic and IPL data primarily revealed spatial distributions of living organisms, whereas morphological and free lipid biomarker data captured information about both living and dead organisms.
The increase in relative abundance of cyanobacteria observed by microscopy echoes previous observations that the polysaccharide sheaths and envelopes of cyanobacteria are relatively resistant to decay and so may persist and retain morphological information after cell death (Horodyski et al., 1992; Bartley, 1996). Specifically, Golubic and Barghoorn (1977) argued that the cells in scytonematalean cyanobacterial filaments decay to form a series of inverted cones that reflect their encompassing funnel-shaped sheaths – a pattern that can be seen clearly in Figure 9D. Cyanobacterial remains play an important structural role throughout the entire mat system, contributing much of the biomass and morphologically identifiable record in lower layers. Organic carbon δ13C values (−14.3 to −10.2‰; Supplementary Table S6) in Little Ambergris Cay mats were similar to other modern cyanobacterial mats, which have higher δ13C values than modern marine sedimentary organic matter that are attributed to CO2 limitation in the productive surface layers of the mat (Parker, 1964; Barghoorn et al., 1977; Schidlowski, 1985; Des Marais et al., 1989; Bebout et al., 2002; Jahnke et al., 2004; Kelley et al., 2006; Wieland et al., 2008; Houghton et al., 2014). This δ13C signature of CO2-limited cyanobacteria biomass was retained in deeper layers along with abundant cyanobacterial hydrocarbons (Figure 10B; Supplementary Table S4). The pyrolysis data indicate that biomass in the deep layers has been diagenetically altered to a more chemically homogenous and recalcitrant state (e.g., sugar pyrolysates:toluene ratio is constantly low in the deep layers; Figure 10D). Geochemical data and observations of cyanobacterial sheath retention at depth implied that morphological and geochemical signatures of filamentous cyanobacteria were well preserved in deep, altered layers and reflected their important role as architects of the mat.
In addition to the larger cyanobacterial filaments, thin (<1 μm across) filaments were observed in all layers (Figure 7), but their abundance decreased with depth. This morphology (Figure 8H) could represent several different taxa identified in the mats by 16S rRNA gene sequence data. However, cellular morphologies were not sufficiently diagnostic to differentiate between these taxa. Candidates for these thin filaments included Halomicronema (a member of subsection III Family I of the Cyanobacteria, which were abundant in the green layer; Figure 5) or members of the Anaerolineaceae (anaerobic and chemoheterotrophic filamentous bacteria; Yamada and Sekiguchi, 2006; which were present in all pigment-rich layers, but are more abundant in the pink and brown layers; Figure 5). Thus, although microscopy results indicated that thin filaments were preserved at depth and therefore are resistant to degradation and decay, their morphologies were not sufficiently diagnostic to infer taxonomic affinity or metabolic role.
Non-filamentous cellular morphologies identified via microscopy include both colonial and non-colonial coccoids, as well as rare helically coiled specimens observed in the green layer (Figure 7). Small, orange colonial coccoids and colonial coccoids that lack distinguishing colors were observed at relative abundances of 3 and 2%, respectively, in the dark green layer, and some persisted in the lower pigment-poor layers. Similarly sized coccoidal cells are known from the geological record (e.g., Hofmann and Jackson, 1991, 1994), but because pigments were poorly retained and simple cocci are not morphologically diagnostic, their fossil-equivalents reveal little about taxonomy or metabolism.
Indirect evidence for other microbial taxa can come from sulfur isotope (δ34S) signatures of pyrite because sulfate reducing and/or sulfur oxidizing bacteria affect δ34S values of dissolved sulfide (Kamber and Whitehouse, 2007; Wacey et al., 2010; Meyer et al., 2017; Gomes et al., 2018). In the Little Ambergris Cay mats, porewater sulfide was 34S-enriched at the top of the zone of sulfide accumulation relative to deeper horizons (Figure 11A). Modern hypersaline microbial mats at Guerrero Negro displayed a similar pattern (Fike et al., 2008, 2009), which was attributed to higher rates of sulfate reduction and/or sulfide oxidation at the surface. The observed δ34S pattern in Little Ambergris Cay was unlikely to be due only to differential rates of sulfate reduction because the organic matter in pigment-poor layers where these patterns were documented was more homogeneous and recalcitrant than the pigment-rich layers (Figure 10D) and should favor low sulfate reduction rates and therefore consistently large S isotope fractionations (Sim et al., 2011; Wing and Halevy, 2014). The observed δ34S pattern may have resulted from the mixing of two sulfide reservoirs: (1) sulfide produced in situ with relatively high δ34S values and (2) upwardly advecting pore water with 34S-depleted sulfide reduced by microorganisms utilizing even more recalcitrant organic matter in the ooid sediment pore water. Thus, pyrite δ34S values can be used to infer the presence of sulfur cycling microorganisms in ancient mats, but may also be influenced by physical transport processes.
Molecular and microscopy data provided differing views of eukaryotic diversity in the pigment-rich layers. Morphologically distinct taxa such as diatoms, arthropods, dinoflagellates, and ciliates were well captured via microscopy, and some of these taxa (i.e., dinoflagellates and ciliates) were abundant in the 18S rRNA gene data. However, diatoms were relatively uncommon according to the genetic data, which instead emphasized the importance of metazoans (mostly nematodes) and alveolates. The difference could be in some part due to saturation of 18S rRNA gene data with metazoan sequences (Allen et al., 2009; Myshrall et al., 2010), rapid loss of DNA from deceased diatom cells despite frustule preservation, or the difficulty in positive identification of alveolates from microscopy.
Relative abundances of heterotrophic eukaryotes, including copepods, nematodes, and ciliates, were highest in the surface mat – this environment offers food, protection from predators and high oxygen levels when light is available for oxygenic photosynthesis. It is also possible that some heterotrophic eukaryotes descend into the mat during the day to avoid predators and emerge at night to feed in a lifestyle akin to the diurnal vertical migration of zooplankton in the ocean. Although some eukaryotic taxa are sulfide-tolerant (Grieshaber and Völkel, 1998), sulfide is toxic to many eukaryotes. Sulfide, anoxia, and declining food resources may have caused the observed dearth of living eukaryotes at depth (Figures 7, 11); and although ciliates and nematodes may feed episodically in lower mat layers, they complete their life cycles in oxic surface environments. It is also possible that some taxa were transported to the mat upon death. Regardless of lifestyles, the presence of morphological remains and various eukaryote biomarkers (Figures 10B,C and Supplementary Tables S2, S4) in the deep pigment-poor layers indicates that a preservable record of eukaryotic taxa can be incorporated into deep microbial mat layers. As was seen with bacterial taxa, there was significant variation in the preservational potential of biosignatures among eukaryotic taxa. Of the eukaryotes observed in or around the mats, biosignatures of diatoms (both morphological and biomarker), arthropods (morphological), and mangroves or shrubland plants that occupy the bedrock rim of the island (biomarkers) showed the greatest preservation potential.
Implications for Biosignatures in Proterozoic Microbialites
In terms of morphology, assemblages in silicified Proterozoic mats with preserved microfossils (e.g., Knoll et al., 1991; Hofmann and Jackson, 1994; Sergeev et al., 1997; Manning-Berg and Kah, 2017; Manning-Berg et al., 2019) most closely resemble lower layers of the Little Ambergris Cay mats, reemphasizing the long-appreciated observation that ancient mat communities underwent diagenetic alteration prior to silicification. Our observations of variably well-preserved cyanobacterial sheaths in the deepest layers of Little Ambergris Cay mats supports paleontological interpretations that fossil cyanobacteria were primary architects of Proterozoic mats (e.g., Hofmann, 1976; Hofmann and Jackson, 1991; Knoll et al., 1991, 2013; Manning-Berg and Kah, 2017; Manning-Berg et al., 2019). Modern and fossil mats alike contain cyanobacterial filaments in various states of decay, with shrunken trichomes, collapsed cells and variably intact sheaths (Figure 9). Our biomarker and δ13C data similarly indicate that a substantial portion of the mat biomass was sourced from cyanobacteria (Figures 10, 11 and Supplementary Tables S4, S6). Moreover, biomarkers recovered from Proterozoic mats yield high proportions of hopanes, isoprenoids and carotenoids indicative of prokaryotic input and porphyrins with nitrogen isotope values suggestive of cyanobacteria as the primary autotrophs in the community (Knoll et al., 2007; Blumenberg et al., 2012; Brocks et al., 2017; Gueneli et al., 2018). The predominance of cyanobacterial fossils and geochemical proxy data for cyanobacteria in Proterozoic mats likely conveys an accurate sense of these taxa as mat-builders, but – importantly – perhaps only a limited sense of the remainder of the surface communities.
Eukaryotic remains are significantly less common in Proterozoic microbial mats than in modern ones. In particular, biomarker ratios of steranes to hopanes, which are taken as a measure of relative input of eukaryotic to prokaryotic biomolecules, remained low until the late Neoproterozoic (Brocks et al., 2017). The oldest unambiguously eukaryotic body fossils, however, date from the Paleoproterozoic ∼1.65 billion years ago (Javaux et al., 2001; Leiming et al., 2005; Agiæ et al., 2017; Javaux and Knoll, 2017), and eukaryotic diversity and disparity increase through much of the Proterozoic eon (Huntley et al., 2006; Knoll et al., 2006; Cohen and Macdonald, 2015; Riedman and Sadler, 2018). Thus, eukaryote biosignatures are be expected to be preserved in microbial mats deposited during this time. Pawlowska et al. (2013) suggested that the dearth of steranes in Proterozoic mats is not a primary ecological signal, but rather resulted from the physical exclusion of eukaryotes from the mat itself. This “mat-seal” hypothesis posits that the cohesive mat surface created in the absence of bioturbators excluded eukaryotes. Our microscopy and biomarker results from laminated modern mats do not support this hypothesis, as we observed physical and biochemical remains of eukaryotes at all mat depths. The most abundant eukaryotic remains in Little Ambergris Cay mats are from taxa with cuticles or tests that are relatively resistant to decay (e.g., arthropod exoskeletons or diatom frustules). While these particular taxa are unlikely to have lived in Proterozoic mats, their persistence in lower layers of this laminated modern mat indicates that eukaryotes are not excluded by the mat surface and that cuticles or tests made of recalcitrant materials can survive processes of degradation and decay during mat accretion. Consistent with this, morphologically complex cysts, vase-shaped protistan tests, and other eukaryotic remains have been observed in some Proterozoic mat assemblages (e.g., Knoll et al., 1991). Proterozoic eukaryotes lacking resistant walls were less likely to be preserved and those without diagnostically eukaryotic features were not recognizable – indeed microfossils, unresolved as either eukaryotic or prokaryotic, have been described as common in lithified Proterozoic mats (Awramik and Barghoorn, 1977; Hofmann and Jackson, 1991, 1994). Given our observations of eukaryotic signals throughout these modern mats, the lack of steranes in Proterozoic mats presents a puzzle. One possible answer is that eukaryotes, although present, were simply too low in abundance to leave an impact on the biomarker record. Another possibility is that eukaryotes were abundant and important in the Proterozoic mat environments but were simply not producing sterols, as is seen in some eukaryotes adapted to anoxic habitats (e.g., Zuendorf et al., 2006). It is also possible that many Proterozoic protists may represent stem, rather than crown, eukaryotes (Porter et al., 2018), and these taxa simply did not display the characters (e.g., recalcitrant polymers, mineralized tests) that leave behind morphological and molecular features we observe throughout the Little Ambergris Cay mats. In any event, however, explanations must be sought in the biological features of early eukaryotes and not in a selective bias imparted by mats.
Conclusion
Microbial mats are multi-layered aggregations of intimately intertwined microorganisms spanning all domains of life. We compared diversity in surface, pigment-rich layers of a microbial mat at Little Ambergris Cay to morphological and geochemical signatures in the deep, pigment-poor layers in order to assess how processes of degradation and decay affect fossils, molecular fossils, and isotopic signatures in sedimentary rocks. The lack of significant lithification enabled us to focus on the impacts of degradation and decay without the bias of lithification. We found that a range of signatures of certain cyanobacteria –predominately those left by members of the large, filamentous genus Scytonema – were preserved in the lower layers: morphologically as sheaths and cell envelopes, and biochemically as C16 to C18 monomethyl and dimethyl alkanes. We also observed that biosignatures of other taxa variably persist with depth; those showing greatest potential to leave behind morphological signatures included diatoms, arthropods, colonial coccoids, and thin filamentous bacterial cells. The latter two, however, lacked diagnostic morphological features that would allow more specific classification in both modern and fossil mats. Together these results emphasized the importance of cyanobacteria as key mat architects and underscored the loss of microbial diversity with accretion and depth. These results highlight the limitations of literal reading of preserved mats as proxies for the once living surface communities because processes of degradation and decay provide a skewed portrayal of community structure. We also found ample evidence that physical remains and biomarkers of eukaryotes can be preserved at depth within microbial mats. These findings do not support the notion of an anti-eukaryote bias in Proterozoic microbial mats posited by the “mat-seal” hypothesis. Thus, body fossil, molecular fossil, and isotopic records in preserved mats are likely to overemphasize certain taxa with diagnostic and recalcitrant biological signatures, but do not necessarily systematically exclude eukaryotic groups.
Data Availability Statement
The datasets presented in this study can be found in online repositories. The names of the repository/repositories and accession number(s) can be found in the article/Supplementary Material.
Author Contributions
MG, LR, SO’R, UL, KM, WF, JG, and AK conducted the field work. UL and KM collected and analyzed 16S and 18S rRNA gene data. LR performed microscopy and analyzed the microscopy data. SO’R collected and analyzed organic geochemistry data. MG collected and analyzed carbon and sulfur isotope data. MG drafted the manuscript. All authors interpreted the data as a whole and developed the conclusions, contributed to the final manuscript, and design of the study.
Funding
Funding was provided by the Agouron Institute.
Conflict of Interest
The authors declare that the research was conducted in the absence of any commercial or financial relationships that could be construed as a potential conflict of interest.
Acknowledgments
We thank the Agouron Institute for support of this project and the Department of Environment & Coastal Resources (DECR) of Turks and Caicos Island government for granting a research permit to perform this work to JG. We also thank Roger Tarika, Bevo Tarika, Paul Mahoney, James Seymour, and the support staff on Big Ambergris Cay for logistical support. We are also grateful to Lizzy Trower (CU Boulder), Daven Quinn (Caltech), Nathan Stein (Caltech), Marjorie Cantine (MIT), Justin Strauss (Dartmouth), Hannah Grotzinger (MIT), Emily Orzechowski (UC Berkeley), and Sophia Roosth (Harvard) for help with field and lab work and Elizabeth Sibert (Harvard) for help with statistical comparisons of microscopy data. We also thank Teresa Avila, Stephanie Moore, and Jennifer Houghton (Washington University) for laboratory and technical assistance, Alexandra Freibott (USDA, Forest Service) for help with microfauna identification, and David Johnston (Harvard) and Roger Summons (MIT) for access to facilities.
Supplementary Material
The Supplementary Material for this article can be found online at: https://www.frontiersin.org/articles/10.3389/feart.2020.576712/full#supplementary-material
Footnotes
- ^ http://www.earthmicrobiome.org/emp-standard-protocols/16s/
- ^ http://www.earthmicrobiome.org/protocols-and-standards/16s/
References
Agiæ, H., Moczydłowska, M., and Yin, L. (2017). Diversity of organic-walled microfossils from the early mesoproterozoic ruyang group, North China Craton: a window into the early eukaryote evolution. Precambrian Res. 297, 101–130. doi: 10.1016/j.precamres.2017.04.042
Allen, M., Goh, F., Burns, B. P., and Neilan, B. A. (2009). Bacterial, archaeal and eukaryotic diversity of smooth and pustular microbial mat communities in the hypersaline lagoon of Shark Bay. Geobiology 7, 82–96. doi: 10.1111/j.1472-4669.2008.00187.x
Awramik, S., and Barghoorn, E. S. (1977). The gunflint microbiota. Precambrian Res. 5, 121–142. doi: 10.1016/0301-9268(77)90025-0
Barghoorn, E. S., Knoll, A. H., Dembicki, H., and Meinschein, W. G. (1977). Variation in stable carbon, 1977, variation in stable carbon isotopes of organic matter from the gunflint iron formation. Geochim. Cosmochim. Acta 41, 425–430. doi: 10.1016/0016-7037(77)90271-x
Barghoorn, E. S., and Tyler, S. A. (1965). Microorganisms from the Gunflint Chert. Science 147, 563–577.
Bartley, J. K. (1996). Actualistic taphonomy of cyanobacteria: implications for the precambrian fossil record. Palaios 11, 571–586.
Baumgartner, L. K., Spear, J. R., Buckley, D. H., Pace, N. R., Reid, R. P., Dupraz, C., et al. (2009). Microbial diversity in modern marine stromatolites, Highborne Cay, Bahamas. Environ. Microbiol. 11, 2710–2719. doi: 10.1111/j.1462-2920.2009.01998.x
Bebout, B. M., Carpenter, S. P., Des Marais, D. J., Discipulo, M., Embaye, T., Garcia-Pichel, F., et al. (2002). Long-term manipulations of intact microbial mat communities in a greenhouse collaboratory: simulating earth’s present and past field environments. Astrobiology 2, 383–402. doi: 10.1089/153110702762470491
Bligh, E. G., and Dyer, W. J. (1959). A rapid method of total lipid extraction and purification. Can. J. Biochem. Physiol. 37, 911–917.
Blumenberg, M., Thiel, V., Riegel, W., Kah, L. C., and Reitner, J. (2012). Biomarkers of black shales formed by microbial mats, Late mesoproterozoic (1.1 Ga) Taoudeni Basin, Mauritania. Precambrian Res. 196–197, 113–127.
Bosak, T., Knoll, A. H., and Petroff, A. P. (2013). the meaning of stromatolites. Annu. Rev. Earth Planet. Sci. 41, 21–44.
Bray, E. E., and Evans, E. D. (1961). Distribution of n-paraffins as a clue to recognition of source beds. Geochim. Cosmochim. Acta 22, 2–15. doi: 10.1016/0016-7037(61)90069-2
Briggs, D. E. G. (1999). Molecular taphonomy of animal and plant cuticles: selective preservation and diagenesis. Phil. Trans. R. Soc. Lond. B 354, 7–17. doi: 10.1098/rstb.1999.0356
Brocks, J. J., Jarrett, A. J. M., Sirantoine, E., Hallmann, C., Hoshino, Y., and Liyanage, T. (2017). The rise of algae in Cryogenian oceans and the emergence of animals. Nature 548, 578–581. doi: 10.1038/nature23457
Burns, B. P., Goh, F., Allen, M., and Neilan, B. A. (2004). Microbial diversity of extant stromatolites in the hypersaline marine environment of Shark Bay, Australia. Environ. Microbiol. 6, 1096–1101. doi: 10.1111/j.1462-2920.2004.00651.x
Butterfield, N. J., Knoll, A. H., and Swett, K. (1994). Paleobiology of the neoproterozoic svanbergfjellet formation, Spitsbergen. Fossils Strata 4, 1–84.
Caporaso, J. G., Kuczynski, J., Stombaugh, J., Bittinger, K., Bushman, F. D., Costello, E. K., et al. (2010). QIIME allows analysis of high-throughput community sequencing data. Nat. Methods 7, 335–336.
Caporaso, J. G., Lauber, C. L., Walters, W. A., Berg-Lyons, D., Huntley, J., Fierer, N., et al. (2012). Ultra-high-throughput microbial community analysis on the Illumina HiSeq and MiSeq platforms. ISME J. 6, 1621–1624. doi: 10.1038/ismej.2012.8
Case, D. H., Pasulka, A. L., Marlow, J. J., Grupe, B. M., Levin, L. A., and Orphan, V. J. (2015). Methane seep carbonates host distinct, diverse, and dynamic microbial assemblages. MBio 6:e01348–01315. doi: 10.1128/mBio.01348-15
Chanton, J. P., and Martens, C. S. (1985). The effects of heat and stannous chloride addition on the active distillation of acid volatile sulfide from pyrite-rich marine sediment samples. Biogeochemistry 1, 375–382. doi: 10.1007/bf02187379
Clarke, K. R. (1993). Non-parametric multivariate analyses of changes in community structure. Austr. J. Ecol. 18, 117–143. doi: 10.1111/j.1442-9993.1993.tb00438.x
Coates, R. C., Podell, S., Korobeynikov, A., Lapidus, A., Pevzner, P., Sherman, D. H., et al. (2014). Characterization of cyanobacterial hydrocarbon composition and distribution of biosynthetic pathways. PLoS One 9:e85140. doi: 10.1371/journal.pone.0085140
Cohen, P. A., and Macdonald, F. A. (2015). The proterozoic record of eukaryotes. Paleobiology 41, 610–632. doi: 10.1017/pab.2015.25
Cohen, Y. (1984). “Oxygenic photosynthesis, anoxygenic photosynthesis and sulfate reduction in cyanobacterial mats,” in Current Perspectives in Microbial Ecology, eds M. J. Klug and C. A. Reddy (Washington, DC: ASM), 435–441.
D’Amelio, E. D., Cohen, Y., and Des Marais, D. J. (1989). “Comparative functional ultrastructure of two hypersaline submerged cyanobacterial mats: guerrero Negro, Baja California Sur, Mexico and Solar Lake, Sinai, Egypt,” in Microbial Mats. Physiological Ecology of Benthic Microbial Communities, eds Y. Cohen and E. Rosenberg (Washington DC: American Society for Microbiology), 97–113.
Degnan, P. H., and Ochman, H. (2012). Illumina-based analysis of microbial community diversity. ISME J. 6, 183–184.
Des Marais, D. J. (1995). The biogeochemistry of hypersaline microbial mats. Adv. Microb. Ecol. 14, 251–274. doi: 10.1007/978-1-4684-7724-5_6
Des Marais, D. J. (2003). Biogeochemistry of hypersaline microbial mats illustrates the dynamics of modern microbial ecosystems and the early evolution of the biosphere. Biol. Bull. 204, 160–167. doi: 10.2307/1543552
Des Marais, D. J., Cohen, Y., Nguyen, H., Cheatham, M., Cheatham, T., and Munoz, E. (1989). “Carbon isotopic trends in the hypersaline ponds and microbial mats at Guerrero Negro, Baja California Sur, Mexico: implications for Precambrian stromatolites,” in Microbial Mats: Physiological Ecology of Benthic Microbial Communities, eds Y. Cohen and E. Rosenberg (Washington, DC: American Society for Microbiology), 191–203.
Dupraz, C., Reid, R. P., Braissant, O., Decho, A. W., Norman, R. S., and Visscher, P. T. (2009). Processes of carbonate precipitation in modern microbial mats. Earth Sci. Rev. 96, 141–162. doi: 10.1016/j.earscirev.2008.10.005
Dupraz, C., and Visscher, P. T. (2005). Microbial lithification in marine stromatolites and hypersaline mats. Trends Microbiol. 13, 429–438. doi: 10.1016/j.tim.2005.07.008
Edgcomb, V. P., Bernhard, J. M., Summons, R. E., Orsi, W., Beaudoin, D., and Visscher, P. T. (2014). Active eukaryotes in microbialites from Highborne Cay, Bahamas, and Hamelin Pool (Shark Bay), Australia. ISME J. 8, 418–429. doi: 10.1038/ismej.2013.130
Eglinton, G., and Hamilton, R. J. (1967). Leaf epicuticular waxes. Science 156, 1322–1335. doi: 10.1126/science.156.3780.1322
Feazel, L. M., Spear, J. M., Berger, A. B., Harris, J. K., Frank, D. N., Ley, R. E., et al. (2008). Eucaryotic diversity in a hypersaline microbial mat. Appl. Environ. Microbiol. 74, 329–332. doi: 10.1128/aem.01448-07
Fike, D. A., Finke, N., Zha, J., Blake, G., Hoehler, T. M., and Orphan, V. J. (2009). The effect of sulfate concentration on (sub)millimeter-scale sulfide δ34S in hypersaline cyanobacterial mats over the diurnal cycle. Geochim. Cosmochim. Acta 73, 6187–6204. doi: 10.1016/j.gca.2009.07.006
Fike, D. A., Gammon, C. L., Ziebis, W., and Orphan, V. J. (2008). Micron-scale mapping of sulfur cycling across the oxycline of a cyanobacterial mat: a paired nanoSIMS and CARD-FISH approach. ISME J. 2, 749–759. doi: 10.1038/ismej.2008.39
Fike, D. A., Houghton, J. L., Moore, S. E., Gilhooly, W. P., Dawson, K. S., Druschel, G. K., et al. (2017). Spatially resolved capture of hydrogen sulfide from the water column and sedimentary pore waters for abundance and stable isotopic analysis. Mar. Chem. 197, 26–37. doi: 10.1016/j.marchem.2017.10.004
Firsching, F. H. (1961). Precipitation of silver phosphate from homoge- neous solution. Analyt. Chem. 33, 873–874. doi: 10.1021/ac60175a018
Foster, J. S., and Green, S. J. (2011). “Microbial diversity in modern stromatolites,” in STROMATOLITES: Interaction of Microbeswith Sediments, Cellular Origin, Life in Extreme Habitats and Astrobiology, eds V. C. Tewari and J. Seckbach (Dordrecht: Springer), 383–405. doi: 10.1007/978-94-007-0397-1_17
Foster, J. S., Green, S. J., Ahrendt, S. R., Golubic, S., Reid, R. P., Hetherington, K. L., et al. (2009). Molecular and morphological characterization of cyanobacterial diversity in the stromatolites of Highborne Cay, Bahamas. ISME J. 3, 573–587. doi: 10.1038/ismej.2008.129
Frantz, C. M., Petryshyn, V. A., and Corsetti, F. A. (2015). Grain trapping by filamentous cyanobacterial and algal mats. implications for stromatolite microfabrics through time. Geobiology 13, 409–423. doi: 10.1111/gbi.12145
Goh, F., Allen, M. A., Leuko, S., Kawaguchi, T., Decho, A. W., Burns, B. P., et al. (2009). Determining the specific microbial populations and their spatial distribution within the stroma- tolite ecosystem of Shark Bay. ISME J. 3, 383–396. doi: 10.1038/ismej.2008.114
Golubic, S., and Barghoorn, E. S. (1977). “Interpretation of microbial fossils with special reference to the Precambrian,” in Fossil Algae, ed. E. Flügel (Berlin: Springer-Verlag), 1–14. doi: 10.1007/978-3-642-66516-5_1
Golubic, S., and Hofmann, H. J. (1976). Comparison of Holocene and mid-precambrian entophysalidaceae (Cyanophyta) in stromatolitic algal mats: cell division and degradation. J. Paleontol. 50, 1074–1082.
Golubic, S., Radoi, R., and Seong-Joo, L. (2006). Decastronema kotori gen. nov., comb. nov.: a mat-forming cyanobacterium on cretaceous carbonate platforms and its modern counterparts. Carnets Geol. 127, 1–17.
Gomes, M. L., Fike, D. A., Bergmann, K. D., Jones, C., and Knoll, A. H. (2018). Environmental insights from high-resolution (SIMS) sulfur isotope analyses of sulfides in Proterozoic microbialites with diverse mat textures. Geobiology 16, 17–34. doi: 10.1111/gbi.12265
Grieshaber, M. K., and Völkel, S. (1998). Animal adaptations for tolerance and exploptation of poisonous sulfide. Annu. Rev. Physiol. 60, 33–53. doi: 10.1146/annurev.physiol.60.1.33
Grossi, V., Beker, B., Geenevasen, J. A. J., Schouten, S., Raphel, D., Fontaine, M.-F., et al. (2004). C25 highly branched isoprenoid alkenes from the marine benthic diatom Pleurosigma strigosum. Phytochemistry 65, 3049–3055. doi: 10.1016/j.phytochem.2004.09.002
Grotzinger, J. P., and Knoll, A. H. (1999). Stromatolites in precambrian carbonates: evolutionary mileposts or environmental dipsticks? Annu. Rev. Earth Planet. Sci. 27, 313–358. doi: 10.1146/annurev.earth.27.1.313
Gueneli, N., McKenna, A. M., Ohkouchi, N., Boreham, C. J., Beghin, J., Javaux, E. J., et al. (2018). 1.1-billion-year-old porphyrins establish a marine ecosystem dominated by bacterial primary producers. Proc. Natl. Acad. Sci. U.S.A. 115, E6978–E6986.
Hardie, L. A. (1977). Sedimentation on the Modern Carbonate Tidal Flats of Northwest Andros Island, Bahamas. Baltimore, MD: Johns Hopkins University Press.
Hofmann, H. J. (1976). Precambrian microflora, Belcher Islands, Canada: Significance and systematics. J. Paleontol. 50, 1040–1073.
Hofmann, H. J., and Jackson, G. D. (1991). Shelf-facies microfossils from the Uluksan Group (Proterozoic Bylot Supergroup), Baffin Island, Canada. J. Paleontol. 65, 361–382.
Hofmann, H. J., and Jackson, G. D. (1994). Shale-facies microfossils from the proterozoicbylot supergroup, Baffin Island, Canada. Paleontol. Soc. Mem. 37, 1–35. doi: 10.1017/s0022336000062314
Horodyski, R. J., Bauld, J., Lipps, J. H., and Mendelson, C. V. (1992). “Preservation of prokaryotes and organic-walled and calcareous and siliceous protists,” in The Proterozoic Biosphere: A Multidisciplinary Study, eds J. W. Schopf and C. Klein (Cambridge: Cambridge University Press), 185–193.
Houghton, J., Fike, D., Druschel, G., Orphan, V., Hoehler, T. M., and Des Marais, D. J. (2014). Spatial variability in photosynthetic and heterotrophic activity drives localized delta13C org fluctuations and carbonate precipitation in hypersaline microbial mats. Geobiology 12, 557–574. doi: 10.1111/gbi.12113
Huntley, J. W., Xiao, S., and Kowalewski, M. (2006). 1.3 Billion years of acritarch history: an empirical morphospace approach. Precambrian Res. 144, 52–68. doi: 10.1016/j.precamres.2005.11.003
Jahnke, L. L., Embaye, T., Hope, J., Turk, K. A., van Zuilen, M., Des Marais, D. J., et al. (2004). Lipid biomarker and carbon isotopic signatures for stromatolite-forming, microbial mat communities and Phormidium cultures from Yellowstone National Park. Geobiology 2, 31–47. doi: 10.1111/j.1472-4677.2004.00021.x
Javaux, E. J., and Knoll, A. H. (2017). Micropaleontology of the lower Mesoproterozoic Roper Group, Australia, and implications for early eukaryotic evolution. J. Paleontol. 91, 199–229. doi: 10.1017/jpa.2016.124
Javaux, E. J., Knoll, A. H., and Walter, M. R. (2001). Morphological and ecological complexity in early eukaryotic ecosystems. Nature 412, 66–69. doi: 10.1038/35083562
Jorgensen, B. B. (1994). Sulfate reduction and thiosulfate transformations in a cyanobacterial mat during a diel oxygen cycle. FEMS Microbiol. Ecol. 13, 303–312. doi: 10.1016/0168-6496(94)90068-x
Jorgensen, B. B., and Cohen, Y. (1977). Solar Lake (Sinai). 5. The sulphur cycle of the benthic cyanobacterial mat. Limnol. Oceanogr. 22, 657–666. doi: 10.4319/lo.1977.22.4.0657
Jorgensen, B. B., Kuenen, J. G., and Cohen, Y. (1979). Microbial transformations of sulphur compounds in a stratified lake (Solar Lake, Sinai). Limnol. Oceanogr. 24, 799–822. doi: 10.4319/lo.1979.24.5.0799
Kamber, B. S., and Whitehouse, M. J. (2007). Micro-scale sulphur isotope evidence for sulphur cycling in the late Archean shallow ocean. Geobiology 5, 5–17.
Kaneda, T. (1991). Iso- and anteiso-fatty acids in bacteria: biosynthesis, function, and taxonomic significance. Microbiol. Rev. 55, 288–302. doi: 10.1128/mmbr.55.2.288-302.1991
Kelley, C. A., Prufert-Bebout, L. E., and Bebout, B. M. (2006). Changes in carbon cycling ascertained by stable isotopic analyses in a hypersaline microbial mat. J. Geophys. Res. Biogeosci. 111:G04012.
Knoll, A. H., Javaux, E. J., Hewitt, D., and Cohen, P. (2006). Eukaryotic organisms in Proterozoic oceans. Philos. Trans. R. Soc. Lond. B Biol. Sci. 361, 1023–1038. doi: 10.1098/rstb.2006.1843
Knoll, A. H., Summons, R. E., Waldbauer, J. R., and Zumberge, J. E. (2007). “The geological succession of primary producers in the Oceans,” in Evolution of Primary Producers in the Sea, ed. P. G. Falkowski (Amsterdam: Elsevier), 133–163. doi: 10.1016/b978-012370518-1/50009-6
Knoll, A. H., Swett, K., and Mark, J. (1991). Paleobiology of a Neoproterozoic tidal flat/lagoonal complex: the draken conglomerate formation, Spitsbergen. J. Paleontol. 65, 531–570. doi: 10.1017/s0022336000030663
Knoll, A. H., Wörndle, S., and Kah, L. C. (2013). Covariance of microfossil assemblages and microbialite textures across an upper mesoproterozoic carbonate platform. Palaios 28, 453–470. doi: 10.2110/palo.2013.p13-005r
Leiming, Y., Xunlai, Y., Fanwei, M., and Jie, H. (2005). Protists of the upper mesoproterozoic ruyang group in shanxi province, China. Precambrian Res. 141, 49–66. doi: 10.1016/j.precamres.2005.08.001
Ley, R. E., Harris, J. K., Wilcox, J., Spear, J. R., Miller, S. R., Bebout, B. M., et al. (2006). Unexpected diversity and complexity of the guerrero negro hypersaline microbial mat. Appl. Environ. Microbiol. 72, 3685–3695. doi: 10.1128/aem.72.5.3685-3695.2006
Louyakis, A. S., Mobberley, J. M., Vitek, B. E., Visscher, P. T., Hagan, P. D., Reid, R. P., et al. (2017). A Study of the microbial spatial heterogeneity of bahamian thrombolites using molecular, biochemical, and stable isotope analyses. Astrobiology 17, 413–430. doi: 10.1089/ast.2016.1563
Maloof, A. C., and Grotzinger, J. P. (2011). The Holocene shallowing-upward parasequence of north-west Andros Island, Bahamas. Sedimentology 59, 1375–1407. doi: 10.1111/j.1365-3091.2011.01313.x
Manning-Berg, A. R., and Kah, L. C. (2017). Proterozoic microbial mats and their constraints on environments of silicification. Geobiology 15, 469–483. doi: 10.1111/gbi.12238
Manning-Berg, A. R., Wood, R. S., Williford, K. H., and Czaja, A. D. (2019). The taphonomy of proterozoic microbial mats and implications for early diagenetic silicification. Geosciences 9:geosciences9010040.
Meyer, N. R., Zerkle, A. L., and Fike, D. A. (2017). Sulphur cycling in a Neoarchaean microbial mat. Geobiology 15, 353–365. doi: 10.1111/gbi.12227
Myshrall, K. L., Mobberley, J. M., Green, S. J., Visscher, P. T., Havemann, S. A., Reid, R. P., et al. (2010). Biogeochemical cycling and microbial diversity in the thrombolitic microbialites of Highborne Cay, Bahamas. Geobiology 8, 337–354. doi: 10.1111/j.1472-4669.2010.00245.x
Oksanen, J. (2011). Multivariate Analysis of Ecological Communities in R: Vegan Tutorial: R Package Version 1 7.
Oksanen, J., Blanchet, F. G., Friendly, M., Kindt, R., Legendre, P., McGlinn, D., et al. (2017). Vegan: Community Ecology Package.: R Package Version 2.4-5. Available online at: https://CRAN.R-project.org/package=vegan (accessed July 27, 2018).
Orzechowski, E. A., Strauss, J. V., Knoll, A. H., Fischer, W. W., Cantine, M., Metcalfe, K., et al. (2016). “Age and construction of little ambergris cay bedrock rim, southeastern caicos platform, British West Indies,” in Proceedings of the American Geophysical Union, Fall General Assembly, San Francisco, CA.
Papineau, D., Walker, J. J., Mojzsis, S. J., and Pace, N. R. (2005). Composition and structure of microbial communities from stromatolites of Hamelin Pool in Shark Bay, Western Australia. Appl. Environ. Microbiol. 71, 4822–4832. doi: 10.1128/aem.71.8.4822-4832.2005
Parada, A. E., Needham, D. M., and Fuhrman, J. A. (2016). Every base matters: assessing small subunit rRNA primers for marine microbiomes with mock communities, time series and global field samples. Environ. Microbiol. 18, 1403–1414. doi: 10.1111/1462-2920.13023
Parker, P. L. (1964). The biogeochemistry of the stable isotopes of carbon in a marine bay. Geochim. Cosmochim. Acta 28, 1155–1164. doi: 10.1016/0016-7037(64)90067-5
Pawlowska, M. M., Butterfield, N. J., and Brocks, J. J. (2013). Lipid taphonomy in the proterozoic and the effect of microbial mats on biomarker preservation. Geology 41, 103–106. doi: 10.1130/g33525.1
Porter, S. M., Agiæ, H., and Riedman, L. A. (2018). Anoxic ecosystems and early eukaryotes. Emerg. Top Life Sci. 2, 299–309. doi: 10.1042/etls20170162
Quast, C., Pruesse, E., Yilmaz, P., Gerken, J., Schweer, T., Yarza, P., et al. (2013). The SILVA ribosomal RNA gene database project: improved data processing and web-based tools. Nucleic Acids Res. 41, D590–D596.
R core team (2017). R: A Language and Environment for Statistical Computing. Vienna: R Foundation for Statistical Computing.
Räisänen, U., Pitkänen, I., Halttunen, H., and Hurtta, M. (2003). Formation of the main degradation compounds from arabinose, xylose, mannose and arabinitol during pyrolysis. J. Therm. Anal. Calorim. 72, 481–488.
Ramsing, N. B., Kuhl, M., and Jorgensen, B. B. (1993). Distribution of sulfate-reducing bacteria, O2, and H2S in photosynthetic biofilms determined by oligonucleotide probes and microelectrodes. Appl. Environ. Microbiol. 59, 3840–3849. doi: 10.1128/aem.59.11.3840-3849.1993
Revsbech, N. P., Jorgensen, B. B., Blackburn, T. H., and Cohen, Y. (1983). Microelectrode studies of the photosynthesis and 02, H2S and pH profiles in a microbial mat. Limnol. Oceanogr. 28, 1062–1074. doi: 10.4319/lo.1983.28.6.1062
Revsbech, N. P., and Ward, D. M. (1984). Microelectrode studies of interstitial water chemistry and photosynthetic activity in a hot spring microbial mat. Appl. Environ. Microbiol. 48, 270–275. doi: 10.1128/aem.48.2.270-275.1984
Riding, R. (2006). Microbial carbonate abundance compared with fluctuations in metazoan diversity over geological time. Sediment. Geol. 185, 229–238. doi: 10.1016/j.sedgeo.2005.12.015
Riedman, L. A., and Sadler, P. M. (2018). Global species richness record and biostratigraphic potential of early to middle Neoproterozoic eukaryote fossils. Precambrian Res. 319, 6–18. doi: 10.1016/j.precamres.2017.10.008
Schidlowski, M. (1985). Carbon isotope discrepancy between precambrian stromatolites and their modern analogs: inferences from hypersaline microbial mats of the sinai coast. Orig. Life Evol. Biosph. 15, 263–277. doi: 10.1007/bf01808173
Sergeev, V. N., Knoll, A. H., and Petrov, P. Y. (1997). Paleobiology of the mesoproterozoic-neoproterozoic transition: the Sukhaya Tunguska Formation, Turukhansk Uplift, Siberia. Precambrian Res. 85, 201–239. doi: 10.1016/s0301-9268(97)00035-1
Shiea, J., Brassell, S. C., and Ward, D. M. (1990). Mid-chain branched mono- and dimethyl alkanes in hot spring cyanobacterial mats: a direct biogenic source for branched alkanes in ancient sediments? Org. Geochem. 15, 223–231. doi: 10.1016/0146-6380(90)90001-g
Sim, M. S., Ono, S., Donovan, K., Templer, S. P., and Bosak, T. (2011). Effect of electron donors on the fractionation of sulfur isotopes by a marine Desulfovibrio sp. Geochim. Cosmochim. Acta 75, 4244–4259. doi: 10.1016/j.gca.2011.05.021
Skyring, G. W. (1984). “Sulfate reduction in marine sediments associated with cyanobacterial mats in Australia,” in Microbial Mats: Stromatilites, eds Y. Cohen, R. W. Castenhotz, and H. O. Halvorson (New York, NY: Liss), 265–275.
Stein, N., Grotzinger, J. P., Quinn, D. P., Fischer, W. W., Knoll, A. H., Cantine, M., et al. (2016). UAV, DGPS, and laser transit mapping of microbial mat ecosystems on little ambergris Cay, B.W.I. AGUFM 2016:E21D-0921D.
Stoeck, T., Bass, D., Nebel, M., Christen, R., Jones, M. D., Breiner, H. W., et al. (2010). Multiple marker parallel tag environmental DNA sequencing reveals a highly complex eukaryotic community in marine anoxic water. Mol. Ecol. 19, 21–31. doi: 10.1111/j.1365-294x.2009.04480.x
Sturt, H. F., Summons, R. E., Smith, K., Elvert, M., and Hinrichs, K. U. (2004). Intact polar membrane lipids in prokaryotes and sediments deciphered by high-performance liquid chromatography/electrospray ionization multistage mass spectrometry: new biomarkers for biogeochemistry and microbial ecology. Rapid Comm. Mass Spec. 18, 617–628. doi: 10.1002/rcm.1378
Tarhan, L. G., Planavsky, N. J., Laumer, C. E., Stolz, J. F., and Reid, R. P. (2013). Microbial mat controls on infaunal abundance and diversity in modern marine microbialites. Geobiology 11, 485–497. doi: 10.1111/gbi.12049
Trembath-Reichert, E., Ward, L. M., Slotznick, S. P., Bachtel, S. L., Kerans, C., Grotzinger, J. P., et al. (2016). Gene sequencing-based analysis of microbial-mat morphotypes, caicos platform, British West Indies. J. Sediment. Res. 86, 629–636. doi: 10.2110/jsr.2016.40
Van Gemerden, H. (1993). Microbial mats: a joint venture. Mar. Geol. 113, 3–25. doi: 10.1016/0025-3227(93)90146-m
Versteegh, G. J. M., Schefuß, E., Dupont, L., Marret, F., Sinninghe Damsté, J. S., and Jansen, J. H. F. (2004). Taraxerol and Rhizophora pollen as proxies for tracking past mangrove ecosystems. Geochim. Cosmochim. Acta 68, 411–422. doi: 10.1016/s0016-7037(03)00456-3
Visscher, P. T., Prins, R. A., and Van Gemerden, H. (1992). Rates of sulfate reduction and thiosulfate consumption in a marine microbial mat. FEMS Microbiol. Ecol. 86, 283–294. doi: 10.1111/j.1574-6968.1992.tb04820.x
Wacey, D., McLoughlin, N., Whitehouse, M. J., and Kilburn, M. R. (2010). Two coexisting sulfur metabolisms in a ca. 3400 Ma sandstone. Geology 38, 1115–1118. doi: 10.1130/g31329.1
Wakeham, S. G. (1989). Reduction of stenols to stanols in particulate matter at oxic-anoxic boundaries in sea water. Nature 342, 787–790. doi: 10.1038/342787a0
Walter, M. R. (1976). “Hot-spring sediments in Yellowstone National Park,” in Stromatolites, ed. M. R. Walter (New York, NY: Elsevier), 489–498. doi: 10.1016/s0070-4571(08)71153-1
Wieland, A., Pape, T., Mobius, J., Klock, J.-H., and Michaelis, W. (2008). Carbon pools and isotopic trends in a hypersaline cyanobacterial mat. Geobiology 6, 171–186. doi: 10.1111/j.1472-4669.2007.00138.x
Wing, B. A., and Halevy, I. (2014). Intracellular metabolite levels shape sulfur isotope fractionation during microbial sulfate respiration. Proc. Natl. Acad. Sci. U.S.A. 111, 18116–18125. doi: 10.1073/pnas.1407502111
Yamada, T., and Sekiguchi, Y. (2006). “Anaerolineae,” in Bergey’s Manual of Systematics of Archaea and Bacteria, ed. W. B. Whitman 1–2. doi: 10.1002/9781118960608.fbm00301
Keywords: taphonomy, microbial mats, cyanobacteria, eukaryotes, biosignatures, stable isotope geochemistry, organic geochemistry
Citation: Gomes ML, Riedman LA, O’Reilly S, Lingappa U, Metcalfe K, Fike DA, Grotzinger JP, Fischer WW and Knoll AH (2020) Taphonomy of Biosignatures in Microbial Mats on Little Ambergris Cay, Turks and Caicos Islands. Front. Earth Sci. 8:576712. doi: 10.3389/feart.2020.576712
Received: 26 June 2020; Accepted: 14 August 2020;
Published: 04 September 2020.
Edited by:
Stefano Dominici, University of Florence, ItalyReviewed by:
Barbara Cavalazzi, University of Bologna, ItalyFrances Westall, Centre National de la Recherche Scientifique (CNRS), France
Dylan Wilmeth, UMR 7154 Institut de Physique du Globe de Paris (IPGP), France
Copyright © 2020 Gomes, Riedman, O’Reilly, Lingappa, Metcalfe, Fike, Grotzinger, Fischer and Knoll. This is an open-access article distributed under the terms of the Creative Commons Attribution License (CC BY). The use, distribution or reproduction in other forums is permitted, provided the original author(s) and the copyright owner(s) are credited and that the original publication in this journal is cited, in accordance with accepted academic practice. No use, distribution or reproduction is permitted which does not comply with these terms.
*Correspondence: Maya L. Gomes, mgomes@jhu.edu