
Abstract
Background
Studies quantifying SARS-CoV-2 have focused on upper respiratory tract or plasma viral RNA with inconsistent association with clinical outcomes. The association between plasma viral antigen levels and clinical outcomes has not been previously studied. Our aim was to investigate the relationship between plasma SARS-CoV-2 nucleocapsid antigen (N-antigen) concentration and both markers of host response and clinical outcomes.
Methods
SARS-CoV-2 N-antigen concentrations were measured in the first study plasma sample (D0), collected within 72 h of hospital admission, from 256 subjects admitted between March 2020 and August 2021 in a prospective observational cohort of hospitalized patients with COVID-19. The rank correlations between plasma N-antigen and plasma biomarkers of tissue damage, coagulation, and inflammation were assessed. Multiple ordinal regression was used to test the association between enrollment N-antigen plasma concentration and the primary outcome of clinical deterioration at one week as measured by a modified World Health Organization (WHO) ordinal scale. Multiple logistic regression was used to test the association between enrollment plasma N-antigen concentration and the secondary outcomes of ICU admission, mechanical ventilation at 28 days, and death at 28 days. The prognostic discrimination of an externally derived “high antigen” cutoff of N-antigen ≥ 1000 pg/mL was also tested.
Results
N-antigen on D0 was detectable in 84% of study participants. Plasma N-antigen levels significantly correlated with RAGE (r = 0.61), IL-10 (r = 0.59), and IP-10 (r = 0.59, adjusted p = 0.01 for all correlations). For the primary outcome of clinical status at one week, each 500 pg/mL increase in plasma N-antigen level was associated with an adjusted OR of 1.05 (95% CI 1.03–1.08) for worse WHO ordinal status. D0 plasma N-antigen ≥ 1000 pg/mL was 77% sensitive and 59% specific (AUROC 0.68) with a positive predictive value of 23% and a negative predictive value of 93% for a worse WHO ordinal scale at day 7 compared to baseline. D0 N-antigen concentration was independently associated with ICU admission and 28-day mechanical ventilation, but not with death at 28 days.
Conclusions
Plasma N-antigen levels are readily measured and provide important insight into the pathogenesis and prognosis of COVID-19. The measurement of N-antigen levels early in-hospital course may improve risk stratification, especially for identifying patients who are unlikely to progress to severe disease.
Background
Plasma biomarkers of inflammation, organ and tissue damage, and coagulation have been investigated as pathogenic and prognostic biomarkers in COVID-19 disease [1,2,3,4,5,6]. Although these biomarkers provide insight into the mechanisms of virally mediated cell and tissue damage and the host response to SARS-CoV-2, they do not provide a direct measure of viral burden. It can be challenging to understand the importance of non-viral plasma biomarkers in relation to viral infection without concurrent quantification of viral RNA or protein.
Viral burden in SARS-CoV-2 infection is most often quantified by measurement of viral RNA or proteins in the upper respiratory tract. Higher viral load in the upper respiratory tract portends worse outcomes in some studies [7,8,9,10], while others have demonstrated no independent association [11]. Viral load in the upper airways is often not strongly associated with viral products in the plasma [12,13,14,15]. It is plausible that plasma viral burden may provide additional value. Previous studies have established that the detection of circulating SARS-CoV-2 viral RNA is associated with baseline disease severity and with clinical outcomes [12, 16,17,18,19,20,21].
Viral RNA in plasma is also associated with biomarkers of inflammation and tissue damage [12, 19, 20, 22, 23]. Circulating SARS-CoV-2 RNA is often not detectable, however, especially in early or non-critical COVID-19 [17, 24,25,26]. There is increasing interest in the utility of the detection of viral protein antigens in the blood, which are detectable within 2 weeks of symptom onset [27,28,29,30] and are quantifiable even in patients with mild or minimal symptoms [28,29,30,31]. However, there are currently limited studies of how SARS-CoV-2 viral antigen detection in the blood is related to disease severity and outcomes [32,33,34,35,36,37].
The aims of this study were to investigate the relationship between SARS-CoV-2 nucleocapsid antigen (N-antigen) levels detected in plasma at study enrollment (D0) and (1) biomarkers of tissue damage and host response, to COVID-19 and (2) both short-term clinical deterioration and longer-term outcomes of mechanical ventilation and death up to 28 days. We hypothesized that D0 plasma N-antigen concentration would be associated with biomarkers of inflammation, tissue damage, and coagulation and with disease severity.
Methods
Study design
The COVID-19 Multi-phenotyping for Effective Therapies (COMET) study is a prospectively enrolled observational cohort of patients with confirmed or suspected COVID-19 from three hospitals in San Francisco, CA. Sixty subjects were co-enrolled in the Immunophenotyping Assessment in a COVID-19 Cohort (IMPACC) study, and the two study protocols were aligned [38]. Full inclusion and exclusion criteria are provided in the online supplement. Briefly, hospitalized patients 18 years or older with confirmed or suspected COVID-19 infection were eligible for enrollment in COMET within 72 h of hospital admission. Plasma was collected at the time of enrollment (D0) and on study days 4, 7, and 14 during hospitalization. Additional inclusion criteria for the present study were PCR-confirmed COVID-19 infection and sufficient plasma volume to measure viral antigen concentration. Exclusion criteria were planned comfort care at the time of admission, known pregnancy, or incarceration. The primary clinical outcome was clinical status on day 7 as measured by the World Health Organization (WHO) ordinal scale (detailed in Additional file 1). Secondary outcomes were any intensive care unit (ICU) admission for participants not admitted to the ICU at enrollment, invasive mechanical ventilation (MV) on day 28, and death on day 28. Informed consent was obtained from study participants or a designated surrogate decision-maker when available. The Institutional Review Board granted a waiver of consent for 15 study participants from whom direct consent could not be obtained because of death during the study or inability to contact the participant or their surrogate after three separate attempts. This study was approved by the UCSF Institutional Review Board, IRB 20-30497 and the COMET and IMPACC scientific leadership committees.
Sample collection and measurements
EDTA-anticoagulated blood collected at study enrollment (within 72 h of hospital admission) was centrifuged at an ambient temperature at 1000 g for 10 min, and plasma was collected and stored at − 80 °C. SARS-CoV-2 viral nucleocapsid protein (N-antigen) levels were measured in plasma using a single-molecule immune bead assay (Quanterix, Billerica, MA, USA). N-antigen concentrations below the lower limit of detection of 3 pg/mL were assigned a value of 2.9 pg/mL. Plasma interleukin (IL)-6, IL-8, IL-18, IL-10, interferon-gamma induced protein (IP)-10, surfactant protein D (SPD), receptor for advanced glycation end-products (RAGE), angiopoietin-2 (Ang-2), and soluble tumor necrosis factor receptor (sTNFR)-1 were measured using multiplex magnetic bead immunoassays (Luminex, R&D Systems, Minneapolis, MN, USA), and Protein C was measured by ELISA (Helena Laboratories, Beaumont, TX).
Statistical analysis
Continuous variables are presented as mean (SD) or median (IQR) and compared by unpaired t test if normally distributed or by the Wilcoxon rank-sum test if not normally distributed. Categorical variables are presented as n (percent) and compared by chi-square or Fisher’s exact test. Spearman rank correlation was used to test the relationship between plasma N-antigen concentrations and other plasma biomarkers, with a Bonferroni correction for multiple comparisons.
To assess the relationship between N-antigen concentration per 500 pg/mL increase and clinical status at one week, a proportional odds model was fit with a modified ordinal scale as the dependent variable. Categories on the original 8-point WHO ordinal scale with few observations (less than approximately 5% of the sample) at one week were collapsed for the ordinal regression, resulting in a 5-category ordinal scale (Additional file 1: Table S1) ranging from 1 (ambulatory) to 5 (mechanically ventilated or deceased). Separate logistic regression models were fit to assess the relationship between N-antigen concentration per 500 pg/mL increase and ICU admission among study participants not admitted to the ICU at D0 and 28-day mechanical ventilation (MV) or death. Adjustment variables were selected if they were determined pre-hoc to be associated with COVID severity or outcomes, differed substantially across viral antigen quartiles, and/or were likely to affect viral load. All models were adjusted for age, sex, body mass index (BMI), race (white/non-white), symptom duration (days), presence of diabetes, presence of hypertension, immunosuppression (defined as > 4 weeks of 20 mg prednisone equivalent, other immunosuppressive medication, HIV diagnosis, or bone marrow/solid organ transplant), smoking status (current smoker yes/no), remdesivir treatment, steroid treatment for more than one day and within one week before until 21 days after enrollment, enrollment date, and 8-point WHO ordinal scale at D0. Models for clinical status at one week and ICU admission were adjusted for vaccination status. Models for 28-day mechanical ventilation and death were not adjusted for vaccine status as no vaccinated participants were deceased or mechanically ventilated at 28 days.
We evaluated the prognostic value of an externally defined single N-antigen cutoff of ≥ 1000 pg/mL for clinical deterioration at one week defined as worse WHO ordinal status measured on the original scale, ICU admission, and 28-day MV or death. This was the cutoff value of bamlanivimab for hospitalized COVID-19, in which there was evidence of a trend toward differential treatment effect when stratified by plasma N-antigen above/below 1,000 pg/mL [13]. The sensitivity, specificity, positive predictive value (PPV), and negative predictive value (NPV) for each outcome were calculated. Separate unadjusted logistic regression models were fit, and areas under the receiver operating curve (AUROC) were estimated. We also tested the sensitivity, specificity, PPV, and NPV of internally derived cutoffs using the optimum Youden index for each outcome.
For all analyses, a two-sided p value of < 0.05 was considered significant. Statistical analysis was performed using Stata version 17.0 (College Station, TX).
Results
Baseline characteristics, viral N-antigen concentrations, and plasma biomarkers
Plasma volume was sufficient for viral N-antigen measurements in 256 COVID-positive COMET subjects (Fig. 1), consecutively enrolled between March 2020 and August 2021. Baseline characteristics of study participants are presented in Table 1. 71% of participants received remdesivir, 43% received systemic steroids (for > 1 day and within a week prior to enrollment or later), 4% received tocilizumab, and < 1% received monoclonal antibody treatment at any point during hospitalization.
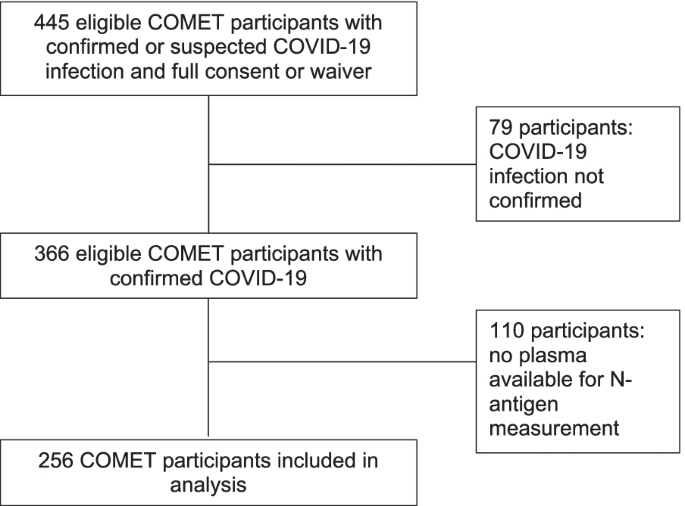
Flowchart of COMET patients included in the study
N-antigen was present above the lower limit of detection (3 pg/mL) in 84% of participants. There was no significant difference in the percentage of participants with detectable N-antigen levels by baseline WHO ordinal scale (p = 0.33), though there was a trend toward a lower percent detectable in those who were intubated at D0 (78% detectable) as compared to those who were not (86% detectable). Among subjects with symptom duration recorded, median symptom duration was shorter (8 days) in participants with detectable N-antigen as compared to those without (11 days, p = 0.015). When limited to those with 14 days or fewer of symptoms, plasma viral antigen level was detectable in 91% of participants as compared to 57% of participants with a symptom duration of greater than 14 days.
The overall distribution of plasma N-antigen concentrations was right-skewed (Additional file 1: Fig. S1) with a median of 735 pg/mL (range 2.9–80,108; IQR 24–4574). There was no significant difference in baseline viral antigen concentration across WHO ordinal categories at D0. Baseline characteristics were compared across quartiles of viral antigen concentration (Additional file 1: Table S2). The proportion of white patients (p = 0.004), median symptom duration (p < 0.001), and baseline oxygen saturation (p = 0.042) declined across viral antigen quartiles, while the proportion of participants with hypertension increased (p = 0.043). Median viral antigen concentration was lower among males (537, IQR 15–3838 pg/mL) than females (1327, IQR 50–5115 pg/mL), but this comparison did not reach statistical significance (p = 0.16).
N-antigen concentration was significantly lower among current smokers (n = 21) than current non-smokers (n = 235) (43 [IQR 9–1060] pg/mL versus 804 [IQR 27–4887] pg/mL, p = 0.04, (Additional file 1: Fig. S2). Median symptom duration, age, BMI, and comorbidities such as hypertension and diabetes did not differ significantly between smokers and non-smokers, though there were more males (n = 17, 81% of smokers and 9% of males) than females (n = 4, 19% of smokers and 4% of females) among the smokers.
N-antigen association with plasma proteins, cytokines, and chemokines
Additional plasma proteins, cytokines, and chemokines from D0 samples had been previously measured for some participants. The correlations between viral N-antigen and ten selected proteins, cytokines, and chemokines at D0 were tested. RAGE, IL-10, and IP-10 were significantly correlated with viral N-antigen concentration after correction for multiple comparisons (Fig. 2). IL-10 and IP-10 were most closely correlated with one another, and RAGE demonstrated a modest correlation with IL-10 and IP-10. Other biomarkers were not significantly correlated with N-antigen concentration after correction for multiple comparisons. The distribution of all measured plasma proteins, cytokines, and chemokines across viral N-antigen quartiles is shown in Additional file 1: Table S3. There was also no correlation between plasma N-antigen levels and the earliest (D0 or D1) clinical laboratory markers of inflammation (C-reactive protein [CRP], lactate dehydrogenase [LDH], and ferritin) or dysregulated coagulation (D-dimer).

Correlation matrix for plasma biomarker and N-antigen concentrations. Biomarkers are presented on the log10 scale. Spearman correlation coefficients are presented above the diagonal. RAGE, n = 235; IL-10, n = 230; IP-10, n = 231. P value for all correlations = 0.01 when adjusted for multiple comparisons
N-antigen association with clinical outcomes
We next tested the association between plasma N-antigen concentration at D0 and clinical status at one week defined by the modified 5-point WHO ordinal scale (see methods). One-week outcome data were complete for 254 of 256 participants. Two participants were transferred to another hospital before one week with unknown subsequent clinical status. Plasma N-antigen concentrations were significantly higher at hospital presentation for the 35 participants whose clinical status was worse by the WHO ordinal scale one week after study enrollment compared to those who were stable or improved (4507 [IQR 1225–9665] pg/mL vs. 483 [IQR 15–3811] pg/mL, p = 0.0003, Fig. 3a). In a proportional odds model with a modified ordinal outcome (Additional file 1: Table S1), each 500 pg/mL increase in D0 plasma N-antigen concentration was significantly associated with a worse one-week outcome in both unadjusted (OR 1.05, 95% CI 1.03–1.07) and fully adjusted (OR 1.05, 95% CI 1.02–1.08) models (Table 2). One hundred and sixty-eight participants were not admitted to the ICU at the time of enrollment, of whom 40 were subsequently admitted to the ICU. We tested the association between D0 plasma N-antigen among these participants and any ICU admission during their hospitalization. The median plasma N- antigen concentration among those ever admitted to the ICU was 4697 (IQR 482–10,410) pg/mL compared to 471 (IQR 18–3142) pg/mL among the 128 never admitted to the ICU (p = 0.0001, Fig. 3b). Each 500 pg/mL increase in enrollment plasma N-antigen concentration was associated with an unadjusted OR of 1.08 (95% CI 1.04–1.12) and a fully adjusted OR of 1.16 (95% CI 1.07–1.25, Table 2) for ICU admission.

a Plasma SARS-CoV-2 N-antigen concentration on D0 by change in clinical status on the World Health Organization ordinal scale. b Plasma viral N-antigen concentration on D0 in patients who were not initially admitted to the ICU at the time of study recruitment, stratified by ICU admission during hospitalization. c Plasma SARS-CoV-2 N-antigen concentration on D0 stratified by mechanical ventilation at 28 days. d Plasma SARS-CoV-2 N-Antigen concentration on D0 stratified by death at 28 days. Plasma N-antigen concentration is presented on log10 scale. P values represent the results of the Wilcoxon rank-sum test
At 28 days, 22 participants were mechanically ventilated, 23 had died, 199 were either still hospitalized and not intubated or discharged alive and free of mechanical ventilation, and 12 had been transferred to another acute facility with unknown status at 28 days. Among participants with complete 28-day outcome data, those who were mechanically ventilated at 28 days had a median D0 N-antigen concentration of 4413 (IQR 432–12,941) pg/mL compared to 574 (14–3811) pg/mL among those who were alive and free of invasive ventilation (p = 0.018, Fig. 3c). Although D0 viral N-antigen concentration was numerically higher among participants who died (1225 [IQR 135–7105] pg/mL) relative to those who were alive on day 28, this difference was not statistically significant (651 [IQR 15–4404] pg/mL, p = 0.28, Fig. 3d).
Each 500 pg/mL increase in enrollment plasma N-antigen concentration was associated with an unadjusted OR of 1.04 (95% CI 1.01–1.06) and a fully adjusted OR of 1.03 (95% CI 1.00–1.05, Table 2) for mechanical ventilation on day 28. The unadjusted OR for death per 500 pg/mL increase in N-antigen concentration was 1.01 (95% CI 0.98–1.03), and the adjusted OR was 0.99 (0.96–1.02).
Prognostic discrimination of high D0 plasma N-antigen
We tested the prognostic utility of an externally defined cutoff for high plasma N-antigen concentration of 1000 pg/mL or above at D0 for risk stratification. In order to generate sensitivity/specificity and areas under receiver operating curves (AUROC), the dichotomous outcome of the ordinal scale better or worse than at enrollment was used for the one-week outcome. ICU and 28-day mechanical ventilation or death outcomes were the same as in the regression models above. D0 plasma N-antigen concentration was 1000 pg/mL or greater in 46% of participants. Sensitivity, specificity, and negative and positive predictive values (NPV and PPV) of this cutoff for each clinical outcome are shown in Table 3. A comparison of the prognostic discrimination for internally derived cutoffs for each outcome by the optimum Youden index as well as the odds ratios associated with each outcome for the internally derived outcome-specific cutoffs in multivariable models can be found in the Supplemental Results (Additional file 1: Tables S4, S5). The internally derived cutoff outperformed the externally derived cutoff for the outcome of 28-day mechanical ventilation. For the other outcomes, the internally derived cutoffs only marginally improved prognostic discrimination or were not statistically different from 1000 pg/mL.
Discussion
The results of this study support the potential value of measuring SARS-CoV-2 nucleocapsid antigen levels in the plasma as a reliable method for detecting the dissemination of viral products into the blood that has biological relevance and prognostic value for clinical outcomes. Plasma viral N-antigen concentration has several advantages over plasma viral RNA as a pathogenic and prognostic biomarker in COVID-19. Previous studies have found that SARSCoV-2 RNA is detectable approximately 10–34% of the time in pooled estimates [17, 26]; increasing the sensitivity for detection may require advanced laboratory techniques that would be difficult to apply for clinical use [39]. Although plasma RNA is associated in some studies with clinical outcomes, it is also most easily detected in patients who are severely ill [12, 18, 19, 25, 40], limiting the prognostic utility of SARS-CoV-2 RNA in patients with early or non-critical disease. By contrast, plasma N-antigen was detectable in 85% of all study participants in our study, and in 91% of those with 14 or fewer days of symptoms prior to enrollment, in line with prior findings [13, 27, 28, 41]. N-antigen was also detectable in plasma across the spectrum of disease severity with a trend toward greater detection in study participants who were not mechanically ventilated at the time of enrollment, possibly because of longer symptom duration in these patients or prior receipt of anti-viral therapies.
While plasma SARS-CoV-2 RNA concentrations are often associated with markers of inflammation and vascular damage [12, 19], we found that plasma N-antigen levels demonstrated weak or no correlation with markers of inflammation (IL-6, IL-8, sTNFR-1), coagulation (protein C), and endothelial injury (Ang-2). Similarly, N-antigen levels were not correlated with markers of inflammation and dysregulated coagulation measured as part of clinical care (LDH, ferritin, CRP, and D-dimer). However, N-antigen levels were correlated with RAGE, IL-10, and IP-10. Elevated D0 RAGE, a marker of type I pneumocyte injury [42, 43], supports recent evidence that the pathogenesis of COVID-19 is likely mediated by damage to the alveolar epithelium [44], perhaps as an early and sentinel event to subsequent endothelial injury and inflammatory response [1]. Prior studies have also identified IP-10 and IL-10 as biomarkers with more specificity for viral infection, including COVID-19, relative to other causes of respiratory failure [45]. Whether the association between N-antigen and IL-10 reflects an appropriate compensatory response to mitigate immune-mediated tissue damage [46] or an adaptive feature of SARS-CoV-2 that suppresses viral clearance by the host [47] requires further study.
In this cohort, the baseline plasma N-antigen concentrations of current smokers were significantly lower than those of non-smokers or former smokers. These differences were not explained by differences in baseline characteristics such as age or comorbidities, nor did symptom duration prior to presentation differ significantly. Smokers were male-predominant, and viral antigen concentrations were lower among males than females in our cohort, which could explain part of the observed difference. The absolute number of smokers in our cohort was small, constituting approximately 9% of the sample, which is lower than the percentage of US adult smokers but similar to San Francisco’s adult smoking prevalence [48, 49]. Nevertheless, these results are consistent with reports that smokers are at lower risk for severe COVID-19 [50].
In addition to insights into COVID-19 biology, the results of this study suggest an important role for plasma N-antigen levels in clinical prognostication. Our results indicate that early plasma N-antigen levels might contribute to the risk stratification for clinical deterioration (clinical deterioration at one week and ICU admission). The unadjusted association between viral N-antigen levels in the plasma and mechanical ventilation was statistically significant, but the fully adjusted association did not meet the threshold for statistical significance, though there was a substantial trend toward an association. Although we did not observe an association between high antigen levels and mortality, we note that our cohort was relatively young with a median age of 57 years. It is possible that an association between N-antigen concentrations and mortality would be observed in an older cohort with a higher mortality rate, or in a cohort with longer follow-up beyond 28 days. High N-antigen concentration was more sensitive than specific for adverse clinical outcomes. Importantly, low N-antigen concentration had a good negative predictive value for adverse outcomes. These findings indicate that plasma N-antigen concentration early in a patient’s hospital course could be used in addition to clinical information to identify those patients who are unlikely to progress to severe illness or death. Plasma N-antigen concentration, which can be measured within hours, could be a valuable biomarker for combined prognostic and predictive clinical trial enrichment in the context of the evidence of differential treatment response by antigen level in a randomized monoclonal antibody trial [13, 51].
Strengths of our study include prospective enrollment in a diverse observational cohort with a range of illness severity levels. In contrast to other studies of N-antigen levels in the plasma, our results are quantitative [37]. Study participants were well phenotyped both clinically and biologically. Study participants were enrolled from both a tertiary care center and a safety net hospital, and our study population received treatments reflecting the evolving standard of care during the pandemic.
Our study also has limitations. Although our results provide insight into the clinical and biological importance of circulating SARS-CoV-2 viral antigens, it does not explain why plasma N-antigen levels are elevated in patients with more severe disease. Possible mechanisms include uncontrolled viral replication in the lungs, alveolar epithelial–capillary barrier disruption, apoptosis of infected epithelial cells in the upper and lower respiratory tracts, and direct infection of circulating leukocytes [52]. Characterization of the mechanisms driving systemic viral antigen dissemination and the therapeutic implications of these mechanisms are warranted. There was no limit for symptom duration prior to enrollment, and some participants were transferred from another hospital, which could confound the relationship between enrollment plasma SARS-CoV-2 N-antigen levels and initial disease severity. Additionally, our cohort was relatively young. Representation of the delta and omicron variants and omicron subvariants is unlikely in our study population as the timeline of enrollment was before the widespread of these variants in North America. It is also possible that the approximately 5% missing 28-day outcomes data due to study participants who were transferred to another facility contributed to bias in the outcome. Participants who were transferred had higher baseline and 1-week severity of illness and were more likely to have N-antigen levels above the 1000 pg/mL cutoff relative to those patients with complete follow-up. This may have biased results of 28-day outcome data toward the null. Lastly, cutoffs for prognostic discrimination are hypothesis-generating only and require further validation in other cohorts.
Conclusions
In summary, plasma SARS-CoV-2 N-antigen levels are readily measured in the plasma of COVID-19 patients independent of baseline disease severity. In combination with other plasma biomarkers, especially elevated levels of plasma RAGE, N-antigen levels provide important biological insight into the pathogenesis of COVID-19 pneumonia, potentially emphasizing the role of alveolar epithelial cell injury. In addition, the measurement of N-antigen levels soon after hospital presentation may improve risk stratification for clinical use and for the enrichment of clinical trials.
Data availability
The datasets used and/or analyzed during the current study are available from the corresponding author on reasonable request.
Abbreviations
- Ang-2:
-
Angiopoietin-2
- AUROC:
-
Area under the receiver operating curve
- BMI:
-
Body mass index
- CKD:
-
Chronic kidney disease
- CRP:
-
C-reactive protein
- COMET:
-
COVID-19 multi-phenotyping for effective therapies
- HFNO:
-
High flow nasal oxygen
- ICU:
-
Intensive care unit
- IL:
-
Interleukin
- IMPACC:
-
Immunophenotyping assessment in a COVID-19 cohort
- IP:
-
Interferon-gamma induced protein
- LDH:
-
Lactate dehydrogenase
- NPV:
-
Negative predictive value
- PPV:
-
Positive predictive value
- RAGE:
-
Receptor for advanced glycation end-products sTNFR-1: soluble tumor necrosis factor receptor 1
- WHO:
-
World Health Organization
- MV:
-
Invasive mechanical ventilation
References
Leisman DE, Mehta A, Thompson BT, Charland NC, Gonye ALK, Gushterova I, Kays KR, Khanna HK, LaSalle TJ, Lavin-Parsons KM, et al. Alveolar, endothelial, and organ injury marker dynamics in severe COVID-19. Am J Respir Crit Care Med. 2021;205:507–19.
Leisman DE, Ronner L, Pinotti R, Taylor MD, Sinha P, Calfee CS, Hirayama AV, Mastroiani F, Turtle CJ, Harhay MO, et al. Cytokine elevation in severe and critical COVID-19: a rapid systematic review, meta-analysis, and comparison with other inflammatory syndromes. Lancet Respir Med. 2020;8(12):1233–44.
Abers MS, Delmonte OM, Ricotta EE, Fintzi J, Fink DL, de Jesus AAA, Zarember KA, Alehashemi S, Oikonomou V, Desai JV, et al. An immune-based biomarker signature is associated with mortality in COVID-19 patients. JCI Insight. 2021. https://doi.org/10.1172/jci.insight.144455.
Calvet J, Berenguer-Llergo A, Gay M, Massanella M, Domingo P, Llop M, Sanchez-Jimenez E, Arevalo M, Carrillo J, Albinana N, et al. Biomarker candidates for progression and clinical management of COVID-19 associated pneumonia at time of admission. Sci Rep. 2022;12(1):640.
Herold T, Jurinovic V, Arnreich C, Lipworth BJ, Hellmuth JC, von Bergwelt-Baildon M, Klein M, Weinberger T. Elevated levels of IL-6 and CRP predict the need for mechanical ventilation in COVID-19. J Allergy Clin Immunol. 2020;146(1):128-136 e124.
Meizlish ML, Pine AB, Bishai JD, Goshua G, Nadelmann ER, Simonov M, Chang CH, Zhang H, Shallow M, Bahel P, et al. A neutrophil activation signature predicts critical illness and mortality in COVID-19. Blood Adv. 2021;5(5):1164–77.
Magleby R, Westblade LF, Trzebucki A, Simon MS, Rajan M, Park J, Goyal P, Safford MM, Satlin MJ. Impact of severe acute respiratory syndrome coronavirus 2 viral load on risk of intubation and mortality among hospitalized patients with coronavirus disease 2019. Clin Infect Dis. 2021;73(11):e4197–205.
Knudtzen FC, Jensen TG, Lindvig SO, Rasmussen LD, Madsen LW, Hoegh SV, Bek-Thomsen M, Laursen CB, Nielsen SL, Johansen IS. SARS-CoV-2 viral load as a predictor for disease severity in outpatients and hospitalised patients with COVID-19: a prospective cohort study. PLoS ONE. 2021;16(10):e0258421.
Boyapati A, Wipperman MF, Ehmann PJ, Hamon S, Lederer DJ, Waldron A, Flanagan JJ, Karayusuf E, Bhore R, Nivens MC, et al. Baseline severe acute respiratory syndrome viral load is associated with coronavirus disease 2019 severity and clinical outcomes: post hoc analyses of a phase 2/3 trial. J Infect Dis. 2021;224(11):1830–8.
de la Calle C, Lalueza A, Mancheno-Losa M, Maestro-de la Calle G, Lora-Tamayo J, Arrieta E, Garcia-Reyne A, Losada I, de Miguel B, Diaz-Simon R, et al. Impact of viral load at admission on the development of respiratory failure in hospitalized patients with SARS-CoV-2 infection. Eur J Clin Microbiol Infect Dis. 2021;40(6):1209–16.
Salto-Alejandre S, Berastegui-Cabrera J, Camacho-Martinez P, Infante-Dominguez C, Carretero-Ledesma M, Crespo-Rivas JC, Marquez E, Lomas JM, Bueno C, Amaya R, et al. SARS-CoV-2 viral load in nasopharyngeal swabs is not an independent predictor of unfavorable outcome. Sci Rep. 2021;11(1):12931.
Fajnzylber J, Regan J, Coxen K, Corry H, Wong C, Rosenthal A, Worrall D, Giguel F, Piechocka-Trocha A, Atyeo C, et al. SARS-CoV-2 viral load is associated with increased disease severity and mortality. Nat Commun. 2020;11(1):5493.
Activ-Tico Bamlanivimab Study Group, Lundgren JD, Grund B, Barkauskas CE, Holland TL, Gottlieb RL, Sandkovsky U, Brown SM, Knowlton KU, Self WH, et al. Responses to a neutralizing monoclonal antibody for hospitalized patients with COVID-19 according to baseline antibody and antigen levels : a randomized controlled trial. Ann Intern Med. 2022;175(2):234–43.
Berastegui-Cabrera J, Salto-Alejandre S, Valerio M, Perez-Palacios P, Revillas FAL, Abelenda-Alonso G, Oteo-Revuelta JA, Carretero-Ledesma M, Munoz P, Pascual A, et al. SARS-CoV-2 RNAemia is associated with severe chronic underlying diseases but not with nasopharyngeal viral load. J Infect. 2021;82(3):e38–41.
Chen L, Wang G, Long X, Hou H, Wei J, Cao Y, Tan J, Liu W, Huang L, Meng F, et al. Dynamics of blood viral load is strongly associated with clinical outcomes in coronavirus disease 2019 (COVID-19) patients: a prospective cohort study. J Mol Diagn. 2021;23(1):10–8.
Hagman K, Hedenstierna M, Gille-Johnson P, Hammas B, Grabbe M, Dillner J, Ursing J. Severe acute respiratory syndrome coronavirus 2 rna in serum as predictor of severe outcome in coronavirus disease 2019: a retrospective cohort study. Clin Infect Dis. 2021;73(9):e2995–3001.
Andersson MI, Arancibia-Carcamo CV, Auckland K, Baillie JK, Barnes E, Beneke T, Bibi S, Brooks T, Carroll M, Crook D, et al. SARS-CoV-2 RNA detected in blood products from patients with COVID-19 is not associated with infectious virus. Wellcome Open Res. 2020;5:181.
Veyer D, Kerneis S, Poulet G, Wack M, Robillard N, Taly V, L’Honneur AS, Rozenberg F, Laurent-Puig P, Belec L, et al. Highly sensitive quantification of plasma severe acute respiratory syndrome coronavirus 2 RNA sheds light on its potential clinical value. Clin Infect Dis. 2021;73(9):e2890–7.
Bermejo-Martin JF, Gonzalez-Rivera M, Almansa R, Micheloud D, Tedim AP, Dominguez-Gil M, Resino S, Martin-Fernandez M, Ryan Murua P, Perez-Garcia F, et al. Viral RNA load in plasma is associated with critical illness and a dysregulated host response in COVID-19. Crit Care. 2020;24(1):691.
Prebensen C, Myhre PL, Jonassen C, Rangberg A, Blomfeldt A, Svensson M, Omland T, Berdal JE. Severe acute respiratory syndrome coronavirus 2 RNA in plasma is associated with intensive care unit admission and mortality in patients hospitalized with coronavirus disease 2019. Clin Infect Dis. 2021;73(3):e799–802.
Heinrich F, Nentwich MF, Bibiza-Freiwald E, Norz D, Roedl K, Christner M, Hoffmann A, Olearo F, Kluge S, Aepfelbacher M, et al. SARS-CoV-2 blood RNA load predicts outcome in critically Ill COVID-19 patients. Open Forum Infect Dis. 2021;8(11):ofab509.
Chen X, Zhao B, Qu Y, Chen Y, Xiong J, Feng Y, Men D, Huang Q, Liu Y, Yang B, et al. Detectable serum severe acute respiratory syndrome coronavirus 2 viral load (RNAemia) is closely correlated with drastically elevated interleukin 6 level in critically ill patients with coronavirus disease 2019. Clin Infect Dis. 2020;71(8):1937–42.
Jacobs JL, Bain W, Naqvi A, Staines B, Castanha PMS, Yang H, Boltz VF, Barratt-Boyes S, Marques ETA, Mitchell SL, et al. SARS-CoV-2 viremia is associated with COVID-19 severity and predicts clinical outcomes. Clin Infect Dis. 2021;74(9):1525–33. https://doi.org/10.1093/cid/ciab686.
Brunet-Ratnasingham E, Anand SP, Gantner P, Dyachenko A, Moquin-Beaudry G, Brassard N, Beaudoin-Bussieres G, Pagliuzza A, Gasser R, Benlarbi M, et al. Integrated immunovirological profiling validates plasma SARS-CoV-2 RNA as an early predictor of COVID-19 mortality. Sci Adv. 2021;7(48):eabj5629.
Nijhuis RHT, Russcher A, de Jong GJ, Jong E, Herder GJM, Remijn JA, Verweij SP. Low prevalence of SARS-CoV-2 in plasma of COVID-19 patients presenting to the emergency department. J Clin Virol. 2020;133:104655.
Tang K, Wu L, Luo Y, Gong B. Quantitative assessment of SARS-CoV-2 RNAemia and outcome in patients with coronavirus disease 2019. J Med Virol. 2021;93(5):3165–75.
Ahava MJ, Kurkela S, Kuivanen S, Lappalainen M, Jarva H, Jaaskelainen AJ. Detection of SARS-CoV-2 nucleocapsid antigen from serum can aid in timing of COVID-19 infection. J Virol Methods. 2022;302:114469.
Hingrat QL, Visseaux B, Laouenan C, Tubiana S, Bouadma L, Yazdanpanah Y, Duval X, Burdet C, Ichou H, Damond F, et al. Detection of SARS-CoV-2 N-antigen in blood during acute COVID-19 provides a sensitive new marker and new testing alternatives. Clin Microbiol Infect. 2020;27(5):789.e1–5. https://doi.org/10.1016/j.cmi.2020.11.025.
Deng Q, Ye G, Pan Y, Xie W, Yang G, Li Z, Li Y. High performance of SARS-Cov-2N protein antigen chemiluminescence immunoassay as frontline testing for acute phase COVID-19 diagnosis: a retrospective cohort study. Front Med (Lausanne). 2021;8:676560.
Thudium RF, Stoico MP, Hogdall E, Hogh J, Krarup HB, Larsen MAH, Madsen PH, Nielsen SD, Ostrowski SR, Palombini A, et al. Early laboratory diagnosis of COVID-19 by antigen detection in blood samples of the SARS-CoV-2 nucleocapsid protein. J Clin Microbiol. 2021;59(10):e0100121.
Shan D, Johnson JM, Fernandes SC, Suib H, Hwang S, Wuelfing D, Mendes M, Holdridge M, Burke EM, Beauregard K, et al. N-protein presents early in blood, dried blood and saliva during asymptomatic and symptomatic SARS-CoV-2 infection. Nat Commun. 2021;12(1):1931.
Sigal GB, Novak T, Mathew A, Chou J, Zhang Y, Manjula N, Bathala P, Joe J, Padmanabhan N, Romero D, et al. Measurement of SARS-CoV-2 antigens in plasma of pediatric patients with acute COVID-19 or MIS-C using an ultrasensitive and quantitative immunoassay. Clin Infect Dis. 2022;383:334.
Ogata AF, Maley AM, Wu C, Gilboa T, Norman M, Lazarovits R, Mao CP, Newton G, Chang M, Nguyen K, et al. Ultra-sensitive serial profiling of SARS-CoV-2 antigens and antibodies in plasma to understand disease progression in COVID-19 patients with severe disease. Clin Chem. 2020;66(12):1562–72.
Martin-Vicente M, Almansa R, Martinez I, Tedim AP, Bustamante E, Tamayo L, Aldecoa C, Gomez JM, Renedo G, Berezo JA, et al. Low anti-SARS-CoV-2 S antibody levels predict increased mortality and dissemination of viral components in the blood of critical COVID-19 patients. J Intern Med. 2022;291(2):232–40.
Olea B, Albert E, Torres I, Gozalbo-Rovira R, Carbonell N, Ferreres J, Poujois S, Costa R, Colomina J, Rodriguez-Diaz J, et al. SARS-CoV-2 N-antigenemia in critically ill adult COVID-19 patients: Frequency and association with inflammatory and tissue-damage biomarkers. J Med Virol. 2022;94(1):222–8.
Wang H, Hogan CA, Verghese M, Solis D, Sibai M, Huang C, Roltgen K, Stevens BA, Yamamoto F, Sahoo MK, et al. SARS-CoV-2 nucleocapsid plasma antigen for diagnosis and monitoring of COVID-19. Clin Chem. 2021;68(1):204–13.
Almansa R, Eiros JM, de Gonzalo-Calvo D, Postigo T, Ortega A, Lopez-Izquierdo R, Moncusi-Moix A, Gort-Paniello C, Dominguez-Gil M, Fuente A, et al. N-antigenemia detection by a rapid lateral flow test predicts 90-day mortality in COVID-19: a prospective cohort study. Clin Microbiol Infect. 2022. https://doi.org/10.1016/j.cmi.2022.05.023.
Impacc Manuscript Writing Team, Committee INS. Immunophenotyping assessment in a COVID-19 cohort (IMPACC): a prospective longitudinal study. Sci Immunol. 2021. https://doi.org/10.1126/sciimmunol.abf3733.
Huang Z, Ning B, Yang HS, Youngquist BM, Niu A, Lyon CJ, Beddingfield BJ, Fears AC, Monk CH, Murrell AE, et al. Sensitive tracking of circulating viral RNA through all stages of SARS-CoV-2 infection. J Clin Invest. 2021. https://doi.org/10.1172/JCI146031.
Kawasuji H, Morinaga Y, Tani H, Yoshida Y, Takegoshi Y, Kaneda M, Murai Y, Kimoto K, Ueno A, Miyajima Y, et al. SARS-CoV-2 RNAemia with a higher nasopharyngeal viral load is strongly associated with disease severity and mortality in patients with COVID-19. J Med Virol. 2022;94(1):147–53.
Brasen CL, Christensen H, Olsen DA, Kahns S, Andersen RF, Madsen JB, Lassen A, Kierkegaard H, Jensen A, Sydenham TV, et al. Daily monitoring of viral load measured as SARS-CoV-2 antigen and RNA in blood, IL-6, CRP and complement C3d predicts outcome in patients hospitalized with COVID-19. Clin Chem Lab Med. 2021;59(12):1988–97.
Fukuda Y, Tanaka A, Homma T, Kaneko K, Uno T, Fujiwara A, Uchida Y, Suzuki S, Kotani T, Sagara H. Utility of SpO2/FiO2 ratio for acute hypoxemic respiratory failure with bilateral opacities in the ICU. PLoS ONE. 2021;16(1):e0245927.
Yamakawa N, Uchida T, Matthay MA, Makita K. Proteolytic release of the receptor for advanced glycation end products from in vitro and in situ alveolar epithelial cells. Am J Physiol Lung Cell Mol Physiol. 2011;300(4):L516-525.
Wick KD, Siegel L, Neaton JD, Oldmixon C, Lundgren J, Dewar RL, Lane HC, Thompson BT, Matthay MA. RAGE has potential pathogenetic and prognostic value in non-intubated hospitalized patients with COVID-19. JCI Insight. 2022. https://doi.org/10.1172/jci.insight.157499.
Hue S, Beldi-Ferchiou A, Bendib I, Surenaud M, Fourati S, Frapard T, Rivoal S, Razazi K, Carteaux G, Delfau-Larue MH, et al. Uncontrolled innate and impaired adaptive immune responses in patients with COVID-19 acute respiratory distress syndrome. Am J Respir Crit Care Med. 2020;202(11):1509–19.
Islam H, Chamberlain TC, Mui AL, Little JP. Elevated interleukin-10 levels in COVID-19: potentiation of pro-inflammatory responses or impaired anti-inflammatory action? Front Immunol. 2021;12:677008.
Mick E, Kamm J, Pisco AO, Ratnasiri K, Babik JM, Castaneda G, DeRisi JL, Detweiler AM, Hao SL, Kangelaris KN, et al. Upper airway gene expression reveals suppressed immune responses to SARS-CoV-2 compared with other respiratory viruses. Nat Commun. 2020;11(1):5854.
Cornelius M, Wang T, Jamal A, Loretan C, Neff L. Tobacco product use among adults: United States, 2019. MMWR Morb Mortal Wkly Rep. 2020;69:1736–42.
Tobacco use and exposure. http://www.sfhip.org/chna/community-health-data/tobacco-use-and-exposure/.
Angus DC, Derde L, Al-Beidh F, Annane D, Arabi Y, Beane A, van Bentum-Puijk W, Berry L, Bhimani Z, Bonten M, et al. Effect of hydrocortisone on mortality and organ support in patients with severe COVID-19: the REMAP-CAP COVID-19 corticosteroid domain randomized clinical trial. JAMA. 2020;324(13):1317–29.
Activ-Tico Ly- CoV555 Study Group, Lundgren JD, Grund B, Barkauskas CE, Holland TL, Gottlieb RL, Sandkovsky U, Brown SM, Knowlton KU, Self WH, et al. A neutralizing monoclonal antibody for hospitalized patients with Covid-19. N Engl J Med. 2021;384(10):905–14.
Junqueira C, Crespo A, Ranjbar S, de Lacerda LB, Lewandrowski M, Ingber J, Parry B, Ravid S, Clark S, Schrimpf MR, et al. FcgammaR-mediated SARS-CoV-2 infection of monocytes activates inflammation. Nature. 2022;606:576–84.
Acknowledgements
We thank the members of the COMET consortium. The names and affiliations of those members not listed as authors are provided in Additional file 1. We also thank Drs. Benoit Fatou, Kinga Smolen, Hanno Steen, Patrick van Zalm, and Arthur Viode from the IMPACC Proteomics Core for sharing their data on the mass spectrometric detection.
COMET consortium members and affiliations
Yumiko Abe-Jones: Division of Hospital Medicine, University of California, San Francisco, California. Alexander Beagle: Department of Medicine, University of California, San Francisco, CA, USA. Sharvari Bhide: Division of Pulmonary and Critical Care Medicine, Department of Medicine, Zuckerberg San Francisco General Hospital and Trauma Center, University of California San Francisco. Gabriela K. Fragiadakis: Department of Medicine, Division of Rheumatology, University of California, San Francisco, CA 94143, USA, CoLabs, University of California, San Francisco, CA 94143, USA, Bakar ImmunoX Initiative, University of California, San Francisco, CA 94143, USA. Ana Gonzalez: Division of Pulmonary and Critical Care Medicine, Department of Medicine, Zuckerberg San Francisco General Hospital and Trauma Center, University of California San Francisco. Omid Jamdar: Helen Diller Family Comprehensive Cancer Center, University of California, San Francisco, CA, USA. Norman Jones: Core Immunology Laboratory. Division of Experimental Medicine, University of California San Francisco, California, USA. Tasha Lea: Department of Pathology, University of California, San Francisco, CA, USA. Carolyn Leroux: Division of Pulmonary and Critical Care Medicine, Department of Medicine, University of California San Francisco, San Francisco, California, USA. Jeff Milush: Core Immunology Laboratory. Division of Experimental Medicine, University of California San Francisco, California, USA.Logan Pierce: Division of Hospital Medicine, University of California, San Francisco, California. Priya Prasad: Division of Hospital Medicine, University of California, San Francisco, California. Sadeed Rashid: Helen Diller Family Comprehensive Cancer Center, University of California, San Francisco, CA, USA. Nicklaus Rodriguez: Helen Diller Family Comprehensive Cancer Center, University of California, San Francisco, CA, USA. Austin Sigman: Division of Pulmonary and Critical Care Medicine, Department of Medicine, University of California San Francisco, San Francisco, California, USA. Luz Torres Altamirano: Helen Diller Family Comprehensive Cancer Center, University of California, San Francisco, CA, USA. Alyssa Ward: Division of Rheumatology, Department of Medicine, University of California San Francisco, San Francisco, California, USA. Michael Wilson: Weill Institute for Neurosciences, Department of Neurology, University of California, San Francisco.
Funding
This project was funded in part by the National Institutes of Health (U19AI077439, supporting the UCSF component of the NIAID Immunophenotyping Assessment in a COVID-19 Cohort [IMPACC] Network), and in part by Genentech (TSK-020586).
Author information
Authors and Affiliations
Consortia
Contributions
CSC, AL, MAM, and KDW conceived and designed the study. KDW performed data analysis, wrote the initial draft of the manuscript, and created the figures and tables. AW was the primary data manager. SC was the primary project manager. RG, AJ, SSC, VN, and DL were study coordinators. CJ performed non-viral protein biomarker measurements. RD and HCL performed the nucleocapsid measurements. PS contributed to the study design and provided critical revisions. KNK, CMH, and KDL served as physician leads. AL, DJE, CRL, MFK, and PGW are members of the COMET executive committee that reviewed and approved the submission of this manuscript. All authors critically reviewed the manuscript and approved the submission. All authors read and approved the final manuscript.
Corresponding author
Ethics declarations
Ethics approval and consent to participate
This study was approved by the UCSF Institutional Review Board, IRB 20-30497, and the COMET and IMPACC scientific leadership committees. Informed consent was obtained from study participants or a designated surrogate decision-maker when available. The Institutional Review Board granted a waiver of consent for study participants from whom direct consent could not be obtained because of death during the study or inability to contact the participant or their surrogate after three separate attempts.
Consent for publication
Not applicable.
Competing interests
In addition to project funding below, the authors declare the following: KDW has received funding from NIH 5T32GM008440-24. AL, DJE, CRL, MFK, and PGL serve on the COMET executive committee. RD receives grant support from HHSN261201500003I. CMH receives support from NIH NHLBI 5K23HL133495 and DOD W81XWH-171-0631 outside the present work. KDL receives consultancy fees from AM Pharma, Biomerieux, BOA Medical, Neumora, and Seastar and holds stock in Amgen. PGW receives grant funding from Genentech for COVID-19 studies and consultancy fees from Sanofi, Regeneron, Astra Zeneca, Glenmark Pharmaceuticals, and Theravance. CSC receives grant support from the NIH and reports grants and personal fees from Roche/Genentech, and Bayer and personal fees from Quark Pharmaceuticals, Gen1e Life Sciences, Vasomune, Quantum Leap Healthcare Collaborative, Janssen, and Cellenkos. MAM receives grant support from NIH/NHLBI R35HL140026, NIH/NIAID OT2HL156812, Genetech-Roche, and Quantum for iSPY-ARDS and consultancy fees from Citius, Novartis, Johnson & Johnson, Gilead, and Pliant. AW, SAC, RG, AJ, SSC, VN, DL, CJ, HCL, and PS have no competing interests to disclose.
Additional information
Publisher's Note
Springer Nature remains neutral with regard to jurisdictional claims in published maps and institutional affiliations.
Supplementary Information
Additional file 1.
Online supplement.
Rights and permissions
Open Access This article is licensed under a Creative Commons Attribution 4.0 International License, which permits use, sharing, adaptation, distribution and reproduction in any medium or format, as long as you give appropriate credit to the original author(s) and the source, provide a link to the Creative Commons licence, and indicate if changes were made. The images or other third party material in this article are included in the article's Creative Commons licence, unless indicated otherwise in a credit line to the material. If material is not included in the article's Creative Commons licence and your intended use is not permitted by statutory regulation or exceeds the permitted use, you will need to obtain permission directly from the copyright holder. To view a copy of this licence, visit http://creativecommons.org/licenses/by/4.0/. The Creative Commons Public Domain Dedication waiver (http://creativecommons.org/publicdomain/zero/1.0/) applies to the data made available in this article, unless otherwise stated in a credit line to the data.
About this article

Cite this article
Wick, K.D., Leligdowicz, A., Willmore, A. et al. Plasma SARS-CoV-2 nucleocapsid antigen levels are associated with progression to severe disease in hospitalized COVID-19. Crit Care 26, 278 (2022). https://doi.org/10.1186/s13054-022-04153-3
Received:
Accepted:
Published:
DOI: https://doi.org/10.1186/s13054-022-04153-3