

Abstract
Ceramic, polymers and solid lubricants were used as reinforcements in the electroless Ni–P deposit, which is in-soluble in nature. Impingement of in-soluble particles has improved the hardness and wear resistance of the Ni–P deposit. However, the question still remains on the bonding of matrix and reinforcement particle during the wear at high load conditions. Hence, to strengthen the Ni–P deposit, a soluble reinforcement particle (CaBr2) has been used in this study. A detail study on the role of bath composition (Nickel sulphate and CaBr2) on the mechanical and tribology behavior of alkaline electroless Ni–P/CaBr2 composite coatings is reported. Coatings were carried out with various weight combination of CaBr2 particle (1 g l−1, 2 g l−1, and 3 g l−1) and source of nickel (16 g l−1, 18 g l−1, and 20 g l−1) in the bath. The optimum bath composition to achieve higher hardness, low surface roughness (Ra), low coefficient of friction (COF), and wear rate were analyzed using response surface methodology (RSM). ANOVA was used to identify the influencing factor on the output responses and an empirical model has been formulated. Ni–P/CaBr2 coating exhibited a high surface roughness of 1.505 μm for the weight combination of 1 g l−1 of CaBr2 and 20 g l−1 of nickel sulphate. High surface hardness of 793 HV0.05 and low wear rate of 3.33 × 10⁻⁶ gm.m−1 was achieved for the high weight combination of CaBr2 particle and nickel sulphate. The obtained experimental results were closer to the predicted results, confirming the significance of the model for optimizing the bath composition for Ni–P/CaBr2 composite coatings. Various characterization techniques like Scanning Electron Microscope-Electron Dispersive Spectrum (SEM-EDS), x-ray Diffractometer (XRD) and 3D non-contact surface profilometer were used to justify the wear results obtained through the experimentation.
Export citation and abstract BibTeX RIS
1. Introduction
Electroless nickel phosphorus (Ni–P) deposition method was extensively used for the tribology and corrosion application because of its better lubrication, hardness and corrosion resistance [1, 2]. Wear and corrosion resistance were significantly improved with the reinforcement of second phase particle in the deposit [3, 4]. Various studies pertaining to the bath composition, second phase particles, and surface treatments were reported in the recent years [5] to improve the hardness, coefficient of friction (COF), corrosion and wear resistance of Ni–P coating [6–12]. However, the use of ceramic particles has resulted in high COF and poor toughness in the electroless composite coatings. Hence, the selection of reinforcement particles was important to overcome the various wear defects associated with ceramic particle reinforcements. As an alternative to hard ceramic particles, hybrid particles were also used in the last decades to overcome the wear defects of using ceramic particle as reinforcement. So, many researchers reported the hybrid combination in Ni–P coating for enhancing the wear resistance [13–15]. In spite of the hybrid combination, soluble particles were also used as reinforcement to augment the tribology properties of Ni–P coating. Soluble particles have a greater advantage over the insoluble particles on improving the surface features in terms of the porosity [16]. Precipitated CaCO3 was recently used as soluble reinforcement particle in the matrix [17]. The result showed that the soluble second phase particle could have greater advantages over the surface characteristics of Ni–P composite coatings. The dissolved Ca element had a prominent role on enhancing the wear property of electroless composite coatings. Similarly, only few research works were studied on solubility of reinforcement particle in the elecctroless coating and its effect on the tribology behavior. Hence, the subject of the research on finding out the soluble second phase particles and its influence on the microstructure, hardness, friction, and wear properties of Ni–P composite coatings were very much needed.
Calcium bromide is an anhydrous compound that dissolves in water. The dissolved CaBr2 was used as a drilling fluids and oxidizers for controlling the Mercury emission. Calcium based compounds are also used in the tribology applications due to the lubricity [18]. However, the anions of the calcium compounds play a substantial role on improving the friction and wear resistance. For example, the reinforcement of calcium hexaboride has increased the COF because of the presence of boride anion [19] and the reinforcement of carbonate anion could decrease the friction coefficient [17]. Hence, it is very important to investigate the calcium based compounds though calcium is presented as a cation. No research work reported the use of CaBr2 as reinforcement particles with the Ni–P alloy. Hence, considering the advantages of solubility and presence of Ca and Br elements, the present work is focused on the fabrication of Ni–P/CaBr2 coating on mild steel through electroless deposition process.
Reinforcement particles play a substantial role on the variation of bath pH, rate of deposition, nickel, phosphorus content and etc. For example, the reinforcement of crab shell particles has increased the rate of nickel deposition and on the other case the reinforcement of ceramic particles has decreased the nickel content. These variations in the nickel content due to the second phase particles could have a huge impact on the mechanical and tribology property. Source of nickel was also one of the major influencing content in electroless bath to increase or decrease the weight percentage of nickel in the coating. Hence, finding out the optimum weight combination of second phase particle and nickel source is important to study the most influencing parameters on the COF and wear behavior. Therefore, the present study is about the optimization of weight combination of second phase CaBr2 particle (1 g l−1, 2 g l−1, and 3 g l−1) and source of nickel (16 g l−1, 18 g l−1, and 20 g l−1) in the bath. The optimum weight combination to achieve higher hardness, low surface roughness, low COF, and low wear rate were analyzed using the Response Surface Methodology (RSM - central composite face centered design). Analysis of Variance (ANOVA) was used to identify the influencing factors on the output responses and an empirical model has been formulated. Various characterization methods like SEM, XRD, Vickers hardness tester, 3D surface roughness profilometer, and Pin on Disc apparatus were used to characterize the Ni–P/CaBr2 composite coatings.
2. Materials and methods
2.1. Coating process
A circular low carbon steel sample with the diameter of 55 mm and thickness of 8 mm were used as substrate material for the electroless deposition of Ni–P and Ni–P/CaBr2 coating.
All chemical reagents were dissolved in the 1000 ml of pure double distilled (DD) water and stirred for 1 h duration using the magnetic stirrer. The schematic representation of the pretreatment and coating process is shown in figure 1. Typical weight combination of nickel sulphate and CaBr2 particles were shown in table 1 while maintaining the other chemical agents and parameters constant (Sodium hypophosphite—23 g l−1, Tri-sodium citrate—13 g l−1, lead acetate—0.001 g l−1, and pH—7). The weight combination of nickel sulphate and CaBr2 particle was selected based on the trial and error method. After the preparation of Ni–P solution, CaBr2 particles were dispersed in the bath and stirred for 1 h duration at the speed of 350 rpm (Rotation per Minute). Non-homogeneous anhydrous CaBr2 particle with the size of 10–18 μm was used as in received condition. After a continuous stirring of CaBr2 particles, heat is supplied to the bath at a rate of 1.6 °C min.−1 to reach a temperature of 97 °C [17]. The pretreated samples were immersed immediately in the alkaline bath after the temperature reached 97 °C and deposition process were carried out for the duration of 1 h. The pretreatment process carried out on the mild steel prior to the deposition process is detailed in the author's recent article [17]. Fabricated coatings are then post heat treated at 400 °C for 1 h at the rate of 30 °C min.−1 using the tubular furnace [20].
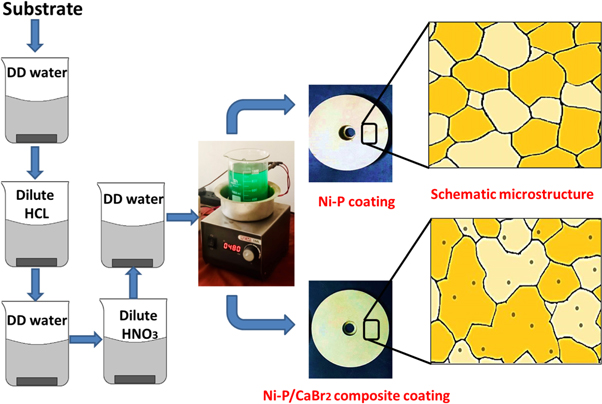
Figure 1. Schematic of pretreatment and electroless composite coating process.
Download figure:
Standard image High-resolution imageTable 1. Weight combination of CaBr2 and NiSO4 used for Ni–P/CaBr2 composite coatings.
| S.No | CaBr2 (g l−1) | NiSO4 (g l−1) |
|---|---|---|
| 1 | 1 | 16 |
| 2 | 1 | 18 |
| 3 | 1 | 20 |
| 4 | 2 | 16 |
| 5 | 2 | 18 |
| 6 | 2 | 20 |
| 7 | 3 | 16 |
| 8 | 3 | 18 |
| 9 | 3 | 20 |
2.2. Coating characterization
Morphology and elemental analysis of Ni–P and Ni–P/CaBr2 composite coatings were analyzed using scanning electron microscope-EDS (Hitachi S-3400N) at different magnifications. The phase structure change of the Ni–P/CaBr2 composite coatings with respect to the reinforcement of CaBr2 particle and heat treatment process were analyzed using XRD (X' per PRO, CuKα (1.54 Å)) in the step size of 0.05°. Micro-hardness was analyzed in the Vickers hardness tester for a dwell period of 10 s. The average value of the hardness for eight samples was measured and reported. The average surface roughness (Ra) of the coatings was obtained using 3D surface profilometer. Friction and wear test is done against the hardened EN-31 counter-face using the pin on disc (DUCOM) 15 N loading condition at dry sliding mode using ASTM G99-05. Duration of the wear test was 10 min at a sliding velocity of 0.75 m s−1. Mass of the sample was measured using the digital weighing machine and wear rate is calculated using the equation referred to the recent article [21]. Wear track characterization was done using SEM and EDS analyzer to discuss the wear mechanism influencing the material removal during the sliding of coated samples against the En-31 counter-face.
2.3. Design of experiments
For optimization of the process parameter levels, RSM was employed through the Design-Expert software (Ver.7). RSM is a statistical approach used for analysing the problems on which desired response is affected by several input parameters [22, 23]. Two input parameters (Nickel sulphate and CaBr2 particle) were used to analyze the output responses like roughness, hardness, COF, and wear rate. Design of experiment was done using the central composite face centered design. Process parameters and their levels (Low, medium, and High) used in this research work are shown in table 2. Mathematical model was generated from the experimental results. Response surface plots, residual plots, prediction values, and desirable graphs were used to validate the mathematical model generated for the taken composite coating.
Table 2. Factors and levels used for the experiments.
| Parameters | Low level (−1) | Medium level (0) | High level (+1) |
|---|---|---|---|
| CaBr2 (g l−1) | 1 | 2 | 3 |
| Nickel sulphate (g l−1) | 16 | 18 | 20 |
3. Results and discussion
Table 3 presents the obtained experimental results from the various weight combination of CaBr2 and nickel sulphate used in this study. The results pertaining to the various weight combinations are discussed below.
Table 3. Experiment results.
| S.No | CaBr2 (g l−1) | Nickel sulphate (g l−1) | Surface roughness (μm) | Hardness (HV0.05) | Wear rate (X10−6) gm.m−1 | COF |
|---|---|---|---|---|---|---|
| 1 | 1 | 16 | 0.891 | 535 | 7.98 | 0.29 |
| 2 | 1 | 18 | 1.054 | 590 | 7.62 | 0.26 |
| 3 | 1 | 20 | 1.505 | 625 | 7.57 | 0.25 |
| 4 | 2 | 16 | 1.067 | 569 | 6.23 | 0.24 |
| 5 | 2 | 18 | 1.129 | 672 | 5.98 | 0.22 |
| 6 | 2 | 20 | 1.359 | 749 | 5.17 | 0.20 |
| 7 | 3 | 16 | 0.345 | 612 | 4.02 | 0.21 |
| 8 | 3 | 18 | 0.676 | 700 | 3.68 | 0.19 |
| 9 | 3 | 20 | 0.991 | 793 | 3.33 | 0.17 |
3.1. Surface characterization
The average surface roughness measured using 3D surface profilometer (table 3) was plotted in the figure 2. High surface roughness of 1.505 μm was exhibited for the Ni–P/CaBr2 composite coating with the combination of 1 g l−1 of CaBr2 and 20 g l−1 of nickel sulphate. The primary reason for high surface roughness was due to the impingement and solubility of CaBr2 particle in the bath. Solubility of CaBr2 particle leads to two phenomenon; one is high rate of nickel deposition and doping of Ca elements between the nickel and phosphorus atoms. High rate of nickel deposition was due to the increased oxidation reaction created by the CaBr2 particle in the bath. To discuss the role of CaBr2 particle on the rate of Nickel and phosphorus deposition, the obtained EDS analysis of the composite coating is shown in table 4. The increase in weight percentage of Nickel is clearly evidenced for the composite coatings. Generally in the electroless composite deposition, the nickel and phosphorus were replaced with second phase particles. Hence, the weight percentage of nickel and phosphorus generally decreases with the increase in the second phase particles. For ceramic composite coatings, only the impingement of second phase particle could take place on the Ni–P matrix and it do not have much influence on redox reaction. This impingement of particles [24] on the surface of the matrix is the main reason for increase in the surface roughness of ceramic reinforced composite coatings. However, this accounts only for the insoluble ceramic particle [25]. In the recent article [26], it is quoted that the reinforcement of sea shell and nano zinc oxide particle could increase the roughness of the composite deposit to 2.21 μm. The obtained surface roughness (1.505 μm) of Ni–P/CaBr2 composite coating was low as compared to the composite deposit seen in the recent literature [26]. This clearly states that the roughness of Ni–P composite deposit could be increased even for the nano particles reinforcement. Also, the low surface value obtained for the Ni–P/CaBr2 composite coating justifies that the surface roughness of the Ni–P deposits can be controlled by using the soluble reinforcement particles [17].
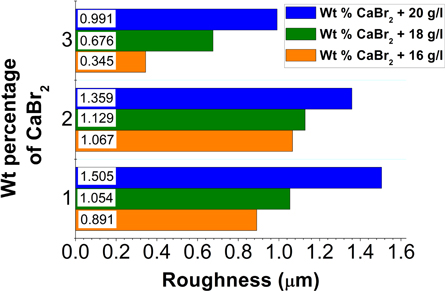
Figure 2. Roughness chart.
Download figure:
Standard image High-resolution imageTable 4. Wt% of Ni, P, Ca and Br in Ni–P/CaBr2 coatings with different weight combinations of NiSO4 and CaBr2 particles.
| S.No | CaBr2 (g l−1) | NiSO4 (g l−1) | Nickel (Wt %) | Phosphorus (Wt %) | Ca (Wt %) | Br (Wt %) |
|---|---|---|---|---|---|---|
| 1 | 1 | 16 | 84.78 | 10.36 | 1.06 | 1.03 |
| 2 | 1 | 18 | 86.24 | 9.52 | 0.98 | 0.77 |
| 3 | 1 | 20 | 89.26 | 8.24 | 0.87 | 0.76 |
| 4 | 2 | 16 | 90.35 | 7.23 | 1.29 | 1.05 |
| 5 | 2 | 18 | 91.40 | 6.87 | 1.02 | 0.56 |
| 6 | 2 | 20 | 92.36 | 5.32 | 0.89 | 0.76 |
| 7 | 3 | 16 | 93.26 | 4.42 | 1.22 | 1.02 |
| 8 | 3 | 18 | 93.78 | 3.72 | 1.34 | 1.07 |
| 9 | 3 | 20 | 94.13 | 3.26 | 1.58 | 1.02 |
For soluble particle, the atom of second phase particle tends to locate between the nickel and phosphorus atoms and increase the growth of the nodules. The formation of nodules mainly depends upon the rate of nickel deposition. For example, the size of the nodule decreases with increase in the nickel deposition [27] and vice versa. Similarly for the reinforcement of CaBr2, the high rate of nickel deposition has affected the nodular formation. The doping of high Ca elements has enhanced the growth of the nodular structure. This growth in the nodular structure created an uneven profile on the surface, which induced a high surface roughness for Ni–P/CaBr2 composite coating (figure 3(b)) as compared with the nodular structure of Ni–P coating (figure 3(a)).
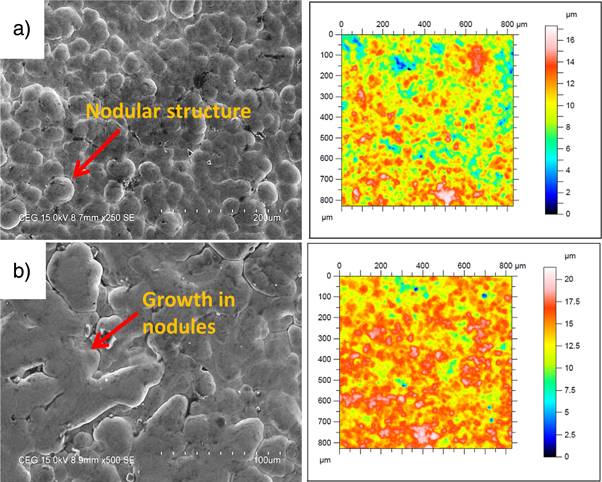
Figure 3. Morphology and non-contact surface image of (a) Ni–P and (b) Ni–P/CaBr2 composite coating.
Download figure:
Standard image High-resolution imageIt is clear from the table 3 that the increases in the addition of CaBr2 particles have decreased the surface roughness. However, the surface roughness increases gradually on increasing the addition of nickel sulphate from 16 g l−1 to 20 g l−1. This is because of the increase in weight percentage of nickel in the coating. During the deposition process, the particle reinforcement mainly depends on the nickel—phosphorus matrix. Deposition of more nickel atoms could reduce the impingement of second phase particles and vice versa. The deposition of more nickel atoms was due to two reasons, one is presence of high source of nickel, and other is increased oxidation reaction as discussed earlier. Hence, on comparison, the weight combination of CaBr2 (3 g l−1) and nickel sulphate (16 g l−1) has presented low surface roughness of 0.345 μm. It is also concluded that the low weight percentage of nickel sulphate could play a vital role on reducing the surface roughness with high weight combination of CaBr2 particle. The accumulation of un-dissolved CaBr2 particles was clearly mapped on the surface of NiP-CaBr2 composite coating using the EDS analysis (figure 4), which clearly states that the CaBr2 could also remain as a compound in the Ni–P/CaBr2 composite deposit.
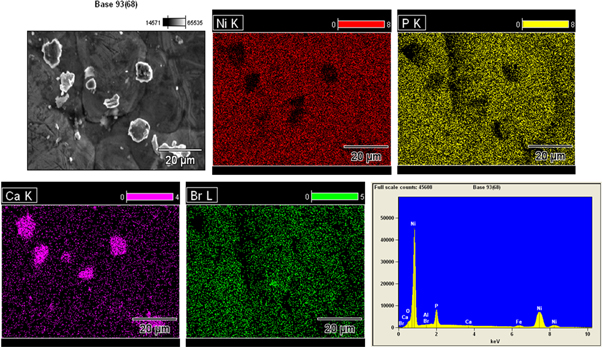
Figure 4. Elemental mapping image of Ni–P/CaBr2 composite coating.
Download figure:
Standard image High-resolution imageFigure 5 depicts the cross section image of Ni–P and Ni–P/CaBr2 coatings. Low coating thickness of 18 μm was presented for Ni–P, which is comparatively lower than that of 23 μm of Ni–P/CaBr2 composite coating. There was an increase in the coating thickness with the initial dispersion of CaBr2 particle (1.0 g l−1) (figure 5(b)), which was related to impingement of CaBr2 in the Ni–P matrix. There was not much difference in the thickness of Ni–P/CaBr2 composite coating after increasing the weight dispersion of CaBr2 particle in the Ni matrix. The existence of Ni, P, Fe, Ca, and Br elements were also confirmed in the EDS mapping, which evidencing the constituents of mild steel and Ni–P/CaBr2 composite coating (figure 6).
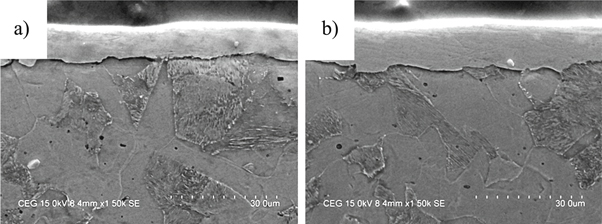
Figure 5. Cross section SEM images of (a) Ni–P and (b) Ni–P/CaBr2 composite coatings.
Download figure:
Standard image High-resolution image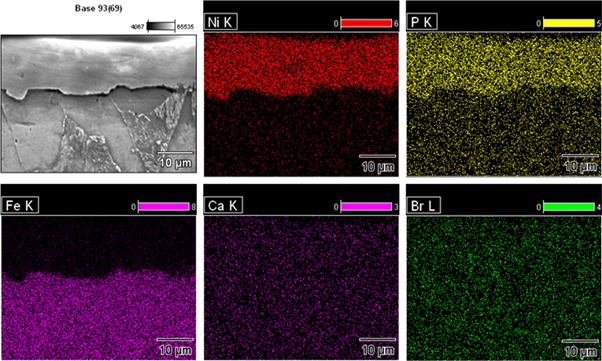
Figure 6. Elemental mapping at the cross section of Ni–P/CaBr2 composite coating.
Download figure:
Standard image High-resolution image3.2. Phase structure (XRD study)
Figure 7 shows the XRD pattern of Ni–P and Ni–P/CaBr2 composite coatings for the weight combination of CaBr2 (1 g l−1, 2 g l−1 and 3 g l−1) and nickel sulphate (16 g l−1, 18 g l−1 and 20 g l−1). It was noticed that the Ni phase peaked at an angle 2theta of 50° was the dominant phase for the Ni–P coating along with the Meta stable phases such as Ni3P and Ni12P5 phases. These results were almost matches with the result obtained in the various studies [27, 28]. Reinforcement of CaBr2 particles had greatly influenced the crystallographic change of the Ni–P/CaBr2 composite coatings. The FWHM width of the major Ni (111) peak was found to be increasing after the reinforcement of CaBr2 in Ni–P matrix. The increase in the width of Ni (111) plane indicates the growth of the Ni crystal after the reinforcement of the CaBr2 particles. The growth of the crystal size was related to an increase in the volume of the Ni space lattice due to the doping of Ca and Br elements. The dissolved Ca and Br ions could locate between the Ni atoms during the deposition process. This allows the increase in the volume of the space lattice of Ni, which caused the increase of crystal size.
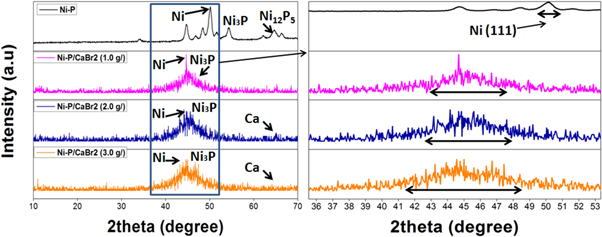
Figure 7. XRD pattern of the Ni–P and Ni–P/CaBr2 composite coatings.
Download figure:
Standard image High-resolution imageIn addition to the crystal growth, there was also a decrease in the Meta stable phases (Ni3P and Ni12P5) with increasing dispersion of CaBr2 particles in the Ni–P bath. Formation of Meta stable phases is generally because of the solubility of phosphorus (P) element in the matrix. The presence of P element in terms of high or low content could play a crucial role in the formation of Ni3P and Ni12P5 phase. So, a decrease in the phosphorus content due to the doping of Ca+ and Br− has been the reason for the reduction in the Meta stable phase formation in Ni–P/CaBr2 composite coatings. The presence of Ca+ and Br− elements between the Ni and phosphorus atoms inhibits the formation of Meta stable phases (Ni3P and Ni12P5) during heat treatment process. Hence, Ni3P and Ni12P5 phase formation was affected for the Ni–P/CaBr2 composite coatings. On comparison, Ni–P/CaBr2 composite coating with the weight combination of 3 g l−1 of CaBr2 and 20 g l−1 of nickel sulphate has shown a low Meta stable phase formation due to the high doping of Ca+ and Br− elements in the NiP matrix. There was also a shift of Ni (111) peak from the angle of 50° to the angle of 45° for Ni–P/CaBr2 coatings after the dispersion of CaBr2 particle. The doping of Ca+ and Br− impurities displaced the crystal planes and creates an internal stress in the coating. Hence, there is a slight shift in the Ni peak for Ni–P/CaBr2 coatings with the initial weight dispersion (1 g l−1) of CaBr2 particle in the bath. Peak shift increases considerably to 44.5° and 44.2° with the dispersion of CaBr2 particle (2 g l−1, and 3 g l−1). Maximum shift was obtained for the Ni–P/CaBr2 coating with the high weight combination of nickel sulphate and CaBr2 particle (20 g l−1 and 3 g l−1), which is due to the high stacking fault created by the Ca+ and Br− elements in the Ni crystal lattice.
3.3. Hardness study
The hardness value measured for the low carbon steel and Ni–P deposit are reported as 125 HV0.05 and 513 HV0.05. Hardness of low carbon steel has been significantly improved after the Ni–P deposit. To discuss the influence of CaBr2 and nickel sulphate, the hardness of the Ni–P/CaBr2 composite coatings were measured and shown in figure 8. Figure 8 demonstrates the hardness plot of Ni–P/CaBr2 coating with various weight combination of CaBr2 and nickel sulphate.
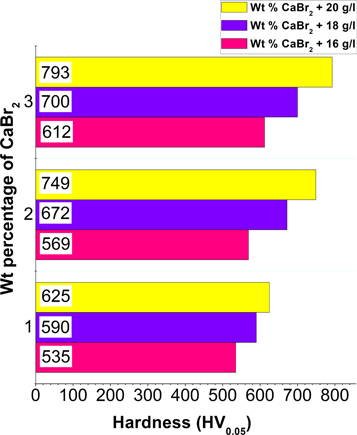
Figure 8. Hardness plot.
Download figure:
Standard image High-resolution imageHardness of Ni–P/CaBr2 composite coating rises gradually with the nickel sulphate and dispersion of CaBr2 in the bath. Maximum hardness of 793 HV0.05 was achieved for the high weight combination of CaBr2 (3 g l−1) and nickel sulphate (20 g l−1). This is due to the increase in Ni content with respect to the increased oxidation created by the CaBr2 particle during the deposition process. Though, many articles reveal the decrease in hardness due to existence of Ca in Ni–P matrix [29], the presence of Ca elements in Ni–P/CaBr2 composite coating has no role on decreasing the hardness. This is because of the increase in the Ni content caused by the high weight combination of Nickel sulphate and CaBr2 in the Ni–P bath. As discussed earlier, solubility of CaBr2 particle was the main cause for increase in the hardness. The dissolved CaBr2 has promoted the increase of Ni deposition and simultaneously decreased the deposition of P. On account of that, Ni is the dominant phase in the composite coating, which is found to be a main reason for achieving the improvement in the hardness of Ni–P/CaBr2 coating. Various article revealed that the hardness of composite coating depends on the hardness of the reinforcement particles [30]. However, in the case of CaBr2 composite coating, the increased oxidation is the cause for the improved hardness of Ni–P/CaBr2 composite coating.
3.4. Friction and wear characterization
Low carbon steel showed a high wear rate of 11.94 × 10⁻⁶ gm.m−1 and a COF of 0.48 compared to the other deposit. Wear rate decreases considerably to 8.06 × 10⁻⁶ gm.m−1 with the COF of 0.3 after the Ni–P deposit. The formation of a semi lubricating layer was found to be the reason for the improvement in the wear resistance of Ni–P. This lubricating layer resists the material removal and improves the friction resistance during the sliding. Formation of semi lubricating layer and its influence on COF and wear rate has been discussed in many articles [5]. To discuss the wear mechanism during the sliding, the SEM images of the wear track of Ni–P and Ni–P/CaBr2 coating are shown in figure 9.
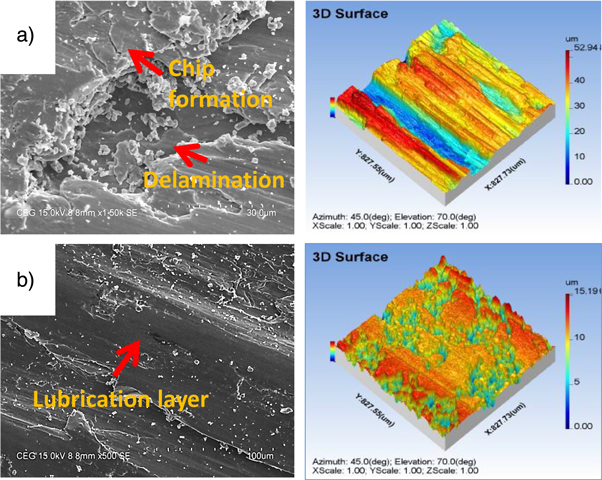
Figure 9. Wear track SEM images of (a) Ni–P and (b) Ni–P/CaBr2 composite coating.
Download figure:
Standard image High-resolution imageNi–P exhibited a severe adhesive wear in the wear track (figure 9(a)) compared to the Ni–P–CaBr2 composite coating. In addition to adhesive, de-lamination wear is also spotted in the wear track of Ni–P coating. The formed lubricating layer was removed in the form of chips during the wear test. The removed lubricating layers from the wear track reports that the Ni–P coating starts to fail at the higher loading condition. The weak sustainment of tribolayer for Ni–P coating at high load condition was also been discussed in the recent article [29], which matches with the above obtained results. The detachment of chips with the crack formation was clearly observed in the track of Ni–P coating. Hence, the observed wear mechanism for Ni–P coating is adhesive and delamination wear. The 3D surface image of the wear track of Ni–P coating also confirms the removal of lubricating layer after the wear test (figure 9(a)). The measured mean wear depth of Ni–P coating (8.202 μm) is also high as compared to that of Ni–P/CaBr2 coating (4.407 μm) with the high weight combination of nickel sulphate and CaBr2 particle.
The wear rate and COF measured for the Ni–P/CaBr2 composite coatings against the sliding with hardened En-31 counter-face is presented in table 3. From the table 3, it is clear that the COF and wear rate decreases considerably with the Ni–P/CaBr2 as compared to the low carbon steel and Ni–P deposit. Wear rate and COF decreases considerably with the dispersion of CaBr2 particle and nickel sulphate in the bath. The obtained wear rate (3.33 × 10⁻⁶ gm−1) and COF (0.17) were found to be low for the high weight combination of CaBr2 particle and Nickel sulphate (NS) as compared to the other weight combinations. The primary cause for low COF and wear rate is due to the improved hardness and lubrication created by the Ni and CaBr2 particle in the coating. The above improved combination of hardness and lubrication had resisted the removal of lubricating layer during the sliding. The presence of lubricating layer is also clearly seen in the wear track of Ni–P/CaBr2 composite coating, which is having the maximum weight combination of CaBr2 particle and nickel sulphate (figure 9(b)). The elemental composition of the lubricating layer is shown in figure 10, which consists of nickel, oxide, phosphorus and iron. This indicates that, the nickel tends to adhere to the surface in the form of an oxide layer during the sliding, which is responsible for the improvement in the wear resistance. The adherence of a lubricating layer was found to increase in the wear track of Ni–P/CaBr2 composite coating after the reinforcement of CaBr2 in the matrix. Hence, restricting the delamination of lubricating layer from the wear track and subsequently led to the improvement in the wear resistance of Ni–P/CaBr2 composite coating. Also, the reinforcement of CaBr2 particle have resulted the considerable reduction in the size of the chips for the high weight combinations of CaBr2 and nickel sulphate.
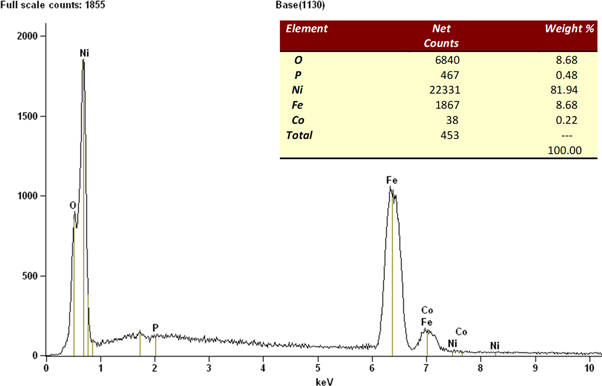
Figure 10. Elemental analysis of lubricating layer formed in the wear track of Ni–P/CaBr2 composite coating.
Download figure:
Standard image High-resolution image3.5. Statistical analysis
The most influenced input parameters and optimum weight combination of nickel sulphate and CaBr2 particle for obtaining the better hardness and wear resistance has been determined from the experimental results (table 5) using ANOVA. The ANOVA results (95% confidence level and 5% significance level and) for the output responses (Surface roughness, hardness, COF, and wear rate) are shown in tables 6–9. The mathematical model developed for the output response are shown in the equations (1)–(4).
Table 5. Design of experiment and results.
| Std | Run | Block | CaBr2 | NS | Ra | HV0.05 | Wear rate | COF |
|---|---|---|---|---|---|---|---|---|
| 1 | 13 | Block 1 | 1 | 16 | 0.891 | 535 | 7.98 | 0.29 |
| 2 | 11 | Block 1 | 3 | 16 | 0.345 | 612 | 4.02 | 0.21 |
| 3 | 3 | Block 1 | 1 | 20 | 1.505 | 625 | 7.57 | 0.25 |
| 4 | 9 | Block 1 | 3 | 20 | 0.991 | 793 | 3.33 | 0.17 |
| 5 | 8 | Block 1 | 1 | 18 | 1.054 | 590 | 7.62 | 0.26 |
| 6 | 6 | Block 1 | 3 | 18 | 0.676 | 700 | 3.68 | 0.19 |
| 7 | 1 | Block 1 | 2 | 16 | 1.067 | 569 | 6.23 | 0.24 |
| 8 | 4 | Block 1 | 2 | 20 | 1.359 | 749 | 5.17 | 0.2 |
| 9 | 2 | Block 1 | 2 | 18 | 1.129 | 672 | 5.98 | 0.22 |
| 10 | 5 | Block 1 | 2 | 18 | 1.105 | 676 | 6.04 | 0.21 |
| 11 | 10 | Block 1 | 2 | 18 | 1.11 | 685 | 6.15 | 0.22 |
| 12 | 12 | Block 1 | 2 | 18 | 1.145 | 670 | 5.93 | 0.21 |
| 13 | 7 | Block 1 | 2 | 18 | 2 | 664 | 5.85 | 0.23 |
Table 6. ANOVA results for surface roughness with various weight combinations of NiSO4 and CaBr2.
| Source | Sum of squares | df | Mean Square | F value | p-value Prob > F | Condition |
|---|---|---|---|---|---|---|
| Model | 1.17 | 3 | 0.39 | 5.17 | >0.0238 | Significant |
| A-CaBr2 | 0.34 | 1 | 0.34 | 4.56 | >0.0614 | |
| B-NS | 0.40 | 1 | 0.40 | 5.31 | >0.0466 | |
| A2 | 0.43 | 1 | 0.43 | 5.64 | 0.0415 | |
| Residual | 0.68 | 9 | 0.076 | |||
| Lack of Fit | 0.062 | 5 | 0.012 | 0.9916 | Not significant | |
| Pure Error | 0.62 | 4 | 0.15 |
Table 7. ANOVA results for hardness with various weight combinations of NiSO4 and CaBr2.
| Source | Sum of squares | df | Mean square | F value | p-value Prob > F | Condition |
|---|---|---|---|---|---|---|
| Model | 59 292.58 | 4 | 14 823.14 | 93.35 | 0.0001 | Significant |
| A-CaBr2 | 21 004.17 | 1 | 21 004.17 | 132.27 | 0.0001 | |
| B-NS | 33 900.17 | 1 | 33 900.17 | 213.49 | 0.0001 | |
| A2 | 2317.99 | 1 | 2317.99 | 14.60 | ||
| Residual | 1270.35 | 8 | 158.79 | |||
| Lack of Fit | 1027.15 | 4 | 256.79 | 4.22 | 0.0959 | Not significant |
| Pure Error | 243.20 | 4 | 60.80 |
Table 8. ANOVA results for COF with various weight combinations of NiSO4 and CaBr2.
| Source | Sum of squares | df | Mean square | F value | p-value Prob > F | Condition |
|---|---|---|---|---|---|---|
| Model | 0.011 | 2 | 5.608E-3 | 84.94 | 0.0001 | Significant |
| A-CaBr2 | 8.817E-3 | 1 | 8.817E-3 | 133.53 | 0.0001 | |
| B-NS | 400E-3 | 1 | 2.400E-3 | 36.35 | 0.0001 | |
| Residual | 6.603E-4 | 10 | 6.603E-5 | |||
| Lack of Fit | 3.803E-4 | 6 | 6.338E-5 | 0.91 | 0.5659 | Not significant |
| Pure Error | 2.800E-4 | 4 | 7.000E-5 |
Table 9. ANOVA results for wear rate with various weight combinations of NiSO4 and CaBr2.
| Source | Sum of squares | df | Mean square | F VALUE | p-value Prob > F | Condition |
|---|---|---|---|---|---|---|
| Model | 25.34 | 2 | 12.67 | 292.96 | 0.0001 | Significant |
| A-CaBr2 | 24.56 | 1 | 24.56 | 567.93 | 0.0001 | |
| B-NS | 0.78 | 1 | 0.78 | 17.98 | 0.0017 | |
| Residual | 0.43 | 10 | 0.043 | |||
| Lack of Fit | 0.38 | 6 | 0.064 | 4.94 | 0.0719 | Not significant |
| Pure Error | 0.051 | 4 | 0.013 |
The model F-value for surface roughnes is 5.17 and found to be significant at 95% confidence level. Also it is noted that the obtained F-value for Nickel sulphate is greater than the F-value of CaBr2 particle. This indicates that the nickel sulphate is more influential in controlling the roughness of the Ni–P/CaBr2 coatings. Figure 11 presents the residual plots of the design model of Ni–P/CaBr2 composite coating. It is clear that the residuals are distributed closer to the mean straight line, which confirms that the models are adequate for the Ni–P/CaBr2 composite coatings. It is also clear that the predicted values were closer to the experimental ones (figure 12). This evidences that the formulated model is significant with the experimental result. Similary the obtained F-value (93.35, 84.94, and 292.96) for hardness, COF, and wear rate are found to be significant and hence, the formulated model can be considered. The accuracy of the formulated models were checked by using the residual analysis
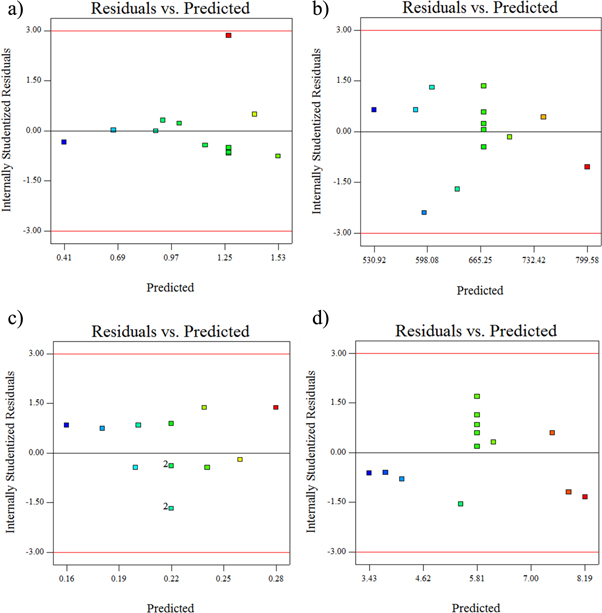
Figure 11. Residuals results for (a) surface roughness, (b) hardness, (c) COF, and (d) wear rate.
Download figure:
Standard image High-resolution image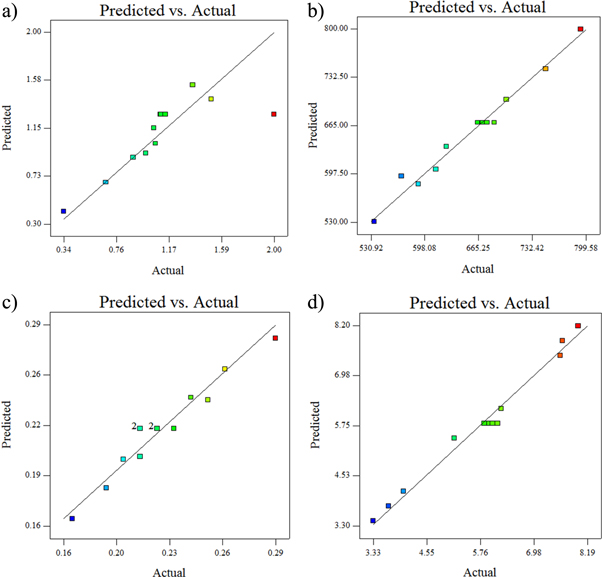
Figure 12. Predicted versus Actual results for (a) surface roughness, (b) hardness, (c) COF, and (d) wear rate.
Download figure:
Standard image High-resolution image3.5.1. Influence of bath parameters on roughness, hardness, COF and wear rate
Figure 13 depicts the relationship between the input parameters and the output responses. Figure 13(a) represents the effect of nickel sulphate and CaBr2 particles on surface roughness. When the dispersion of CaBr2 particle is increased to 1 g l−1, and 2 g l−1, there is an increase in the surface roughness and decreases with the weight dispersion of 3 g l−1. At the same time, when the nickel sulphate is increased with the CaBr2, the surface roughness decreases considerabily (figure 13(a)). It means that the nickel sulphate particle dominates in reducing the roughness of Ni–P/CaBr2 composite coating when compared to that of CaBr2 particle.
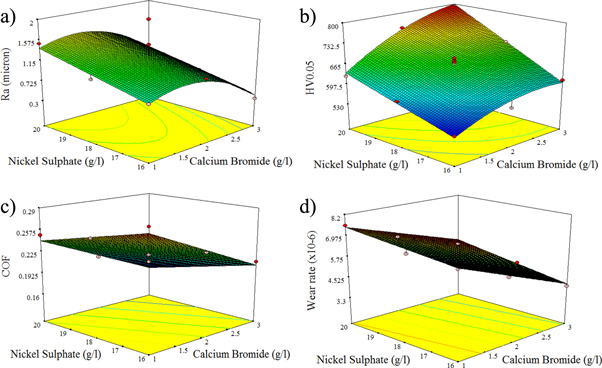
Figure 13. RSM plot for the influence of various weight combinations of CaBr2 and Nickel sulphate on (a) surface roughness, (b) Hardness, (c) COF, and (d) wear rate.
Download figure:
Standard image High-resolution imageFigure 13(b) shows the relationship between the input parameters and hardness. It is clear that, increase in both CaBr2 and Nickel sulphate has increased the hardness of the coatings. However, the contribution of nickel sulphate particle is found to be more in increasing the hardness of the Ni–P/CaBr2 coating when compared to that of CaBr2 particle. High hardness is achieved for the high weight combination of CaBr2 and nickel sulphate, due to presence of more Ni atoms in the Ni–P/CaBr2 coating. The relationship between the input parameters, COF, and wear rate is depicited in figures 13(c) and (d). COF and wear rate reduces gradually with increase in the dispersion of CaBr2 and nickel sulphate in the bath. The increase in CaBr2 particle has more influence in reducing the COF and wear rate when compared to that of Nickel sulphate.
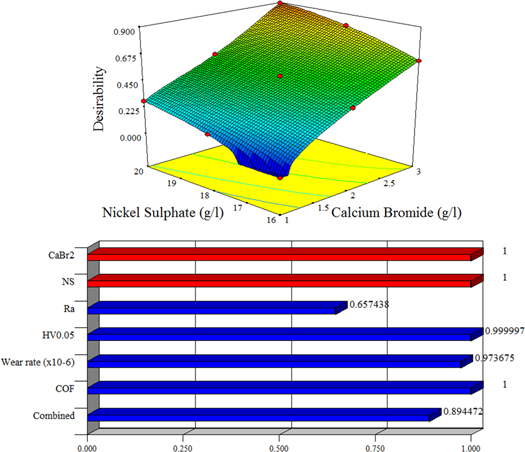
Figure 14 shows the desirability chart of the formulated models for Ni–P/CaBr2 coating. It is clear that the combination of 3 g l−1 of CaBr2 and 20 g l−1 of nickel sulphate has the highest desirability of 1 for the COF of the Ni–P/CaBr2 coating, followed by the hardness, wear rate, and surface roughness. There is a slight change in the desirability values for the nickel sulphate from the weight percentage of 16 g l−1 to 18 g l−1. This indicates that the influence of nickel sulphate from 16 g l−1 to 18 g l−1 on roughness, COF, hardness, and wear rate is very minimum. However, with increase of the weight percentage of nickel sulphate to 19 g l−1 and 20 g l−1, there is a gradual increase in the desirability values. This indicates that the nickel sulphate at the higher weight percentage will certainly have an impact on the mechanical and tribology property. In case of the weight percentage range of CaBr2 particle, there is a tremendous increase in the desirability value. The above indicates that the minimum amount of CaBr2 particle also influences the mechanical and tribology property.
Figure 14. Desirability chart.
Download figure:
Standard image High-resolution image
4. Conclusion
Ni–P/CaBr2 composite coating with various weight combinations of nickel sulphate and CaBr2 particles was deposited on the low carbon steel. Influence of various weight combinations of the constituent particles of Ni–P/CaBr2 composite coating on roughness, hardness, COF, and wear rate was studied. Following conclusion is drawn from the experimental and statistical analysis.
- CaBr2 particle induced a growth in the nodular structure due to high oxidation reaction created in the bath during the deposition. The growth of the nodular structure has increased the roughness of Ni–P/CaBr2 coating due to increase in the dispersion of CaBr2 particle. However, the increase in the addition of nickel sulphate has resulted in low surface roughness due to the low doping of Ca atoms. This concludes that the increase in nickel sulphate has great influence on the surface roughness.
- Significant improvement of the hardness has been achieved in Ni–P/CaBr2 coating. This is attributed to the presence of high weight percentage of Ni in the coating. High hardness of 793 HV0.05 is resulted for Ni–P/CaBr2 coating having a weight combination of 3 g l−1 of nickel sulphate and 20 g l−1 of CaBr2 particle.
- The improved hardness has greatly reduced the COF and wear rate of Ni–P/CaBr2 coating. Severe adhesive and delamination wear has been eliminated after the reinforcement of CaBr2 in the matrix. The weight combination of 3 g l−1 of nickel sulphate and 20 g l−1 of CaBr2 particle in the composite coating has resulted in low COF and wear rate when compared to that of other weight combinations. The optimum weight combination obtained with the statistical analysis is 3 g l−1 of CaBr2 and 19.8655 g l−1 of nickel sulphate, which is closer to the weight combinations used in the experimental results and yields optimum response values of Roughness as 0.912 μm, hardness of 793 HV0.05, COF of 0.166 and wear rate of 3.45 × 10⁻⁶ gm.m−1. This research concludes that the formulated response surface model can be effectively used to analyze the mechanical and tribology characteristics of Ni–P/CaBr2 coating.
Acknowledgments
Thanks to Department of Mechanical Engineering, Anna University, Chennai, Tamilnadu, India for providing research facilities for this research work. No research grant was provided for this research work. Conflict of interest: There is no conflict of interest for this research work.