

Abstract
Germany's forests provide a variety of ecosystem services. Sustainable forest management aims to optimize the provision of these services at regional level. However, climate change will impact forest ecosystems and subsequently ecosystem services. The objective of this study is to quantify the effects of two alternative management scenarios and climate impacts on forest variables indicative of ecosystem services related to timber, habitat, water, and carbon. The ecosystem services are represented through nine model output variables (timber harvest, above and belowground biomass, net ecosystem production, soil carbon, percolation, nitrogen leaching, deadwood, tree dimension, broadleaf tree proportion) from the process-based forest model 4C. We simulated forest growth, carbon and water cycling until 2045 with 4C set-up for the whole German forest area based on National Forest Inventory data and driven by three management strategies (nature protection, biomass production and a baseline management) and an ensemble of regional climate scenarios (RCP2.6, RCP 4.5, RCP 8.5). We provide results as relative changes compared to the baseline management and observed climate. Forest management measures have the strongest effects on ecosystem services inducing positive or negative changes of up to 40% depending on the ecosystem service in question, whereas climate change only slightly alters ecosystem services averaged over the whole forest area. The ecosystem services 'carbon' and 'timber' benefit from climate change, while 'water' and 'habitat' lose. We detect clear trade-offs between 'timber' and all other ecosystem services, as well as synergies between 'habitat' and 'carbon'. When evaluating all ecosystem services simultaneously, our results reveal certain interrelations between climate and management scenarios. North-eastern and western forest regions are more suitable to provide timber (while minimizing the negative impacts on remaining ecosystem services) whereas southern and central forest regions are more suitable to fulfil 'habitat' and 'carbon' services. The results provide the base for future forest management optimizations at the regional scale in order to maximize ecosystem services and forest ecosystem sustainability at the national scale.
Export citation and abstract BibTeX RIS

Original content from this work may be used under the terms of the Creative Commons Attribution 3.0 licence.
Any further distribution of this work must maintain attribution to the author(s) and the title of the work, journal citation and DOI.
1. Introduction
The timber harvested from Germany's forests supports an economically significant forest sector (Kies et al 2008). It generally contributes to climate mitigation by using wood as a substitute for fossil fuels (Beringer et al 2011, BMELV and BMU 2010, Creutzig et al 2015) and carbon-intensive materials such as concrete and steel (Pilli et al 2015). However, forests provide other important ecosystem services and functions, besides timber, that are relevant for human well-being (MEA 2005). For example, forests harbour biodiversity, regulate water regimes and are seen as sites of cultural heritage with great identification and recreation service (de Groot et al 2010). In 2014, the German government decided to reduce Germany's greenhouse gas emissions by 40% by 2020 (UBA 2016). Land-use, land-use change and forestry (LULUCF) activities play an important role to fulfil this aim. Forests are the main contributor to this sink with −56.5 Mt CO2eq a−1 stored in carbon pools of above- and belowground biomass, deadwood, litter, organic soil, and mineral soil in 2013 (UBA 2016). Hence, German forests provide a wide range of ecosystem services.
Both forest management (Bottalico et al 2016, Duncker et al 2012, Verkerk et al 2014) and climate change (Maroschek et al 2009, Nelson et al 2013) influence the amount and quality of ecosystem services provided by forests. Forest management practices have to be organized to meet the demand for different ecosystem services from different societal groups (Reed et al 2013). Most often, trade-offs between these services imply a need for prioritization and a stand-based evaluation of management measures (Gutsch et al 2011). For instance, it is not possible to achieve high carbon storage in the forest stand and simultaneously increase the harvest of timber; a well-known trade-off (Başkent et al 2011, Borys et al 2016, Seidl et al 2007, Sharma et al 2013).
Despite numerous efforts to project what effects climate change and forest management will have on Germany's ecosystem services (Grunewald et al 2016, Gutsch et al 2016, Lasch-Born et al 2015, Norris et al 2012, Schaich and Milad 2013), studies often neglect important factors on either the climate or the management side. For example, modelling studies based on real stand characteristics have only been conducted at a very small sub-set of the total German forest area (Borys et al 2016) or rely on simplified stand characteristics and forest management (Lasch-Born et al 2015). Likewise models that feature more realistic treatments of forest management and stand characteristics often lack detailed process descriptions which are necessary to analyse the climate sensitivity of forest growth (Verkerk et al 2014). Furthermore, recent national studies were limited by the small number of climate change scenarios applied (Köhl et al 2010), and hence do not allow assessing the effects of climate change uncertainty on ecosystem services.
In this study we combine, for the first time, a detailed process-based model that accounts for realistic forest characteristics and management of Germany's forests based on National Forest Inventory data with an ecosystem service-balancing approach. The paper aims at answering the following research questions:
- 1.To what degree do climate change and management strategies affect the provisioning of forest ecosystem services?
- 2.What are the trade-offs between climate change and management strategies in terms of provisioning of forest ecosystem services?
- 3.How does the uncertainty inherent to future climate change projections influence ecosystem services and trade-offs between them?
- 4.Are there regions favouring specific ecosystem services and what are the implications for optimal forest management at the German scale?
2. Materials and methods
2.1. Model 4C
Stand-scale process-based models are useful tools for quantifying indicators for sustainable forest management of which many are related to the provisioning of ecosystem services (Mäkelä et al 2012). In this study, the analysis of climate and management impacts was carried out with the process-based forest model 4C (FORESEE–FORESt Ecosystems in a Changing Environment) for all forested areas in Germany. 4C is being developed to describe the forest behaviour on tree- and stand-level under changing environmental conditions (Lasch et al 2005). Furthermore, 4C allows simulating the effects of different management strategies (thinnings, harvesting and planting) on forests stands. Details on processes included in the model and a description of the key processes underlying the modelling of the ecosystem services are given in the supplementary material as well as on the 4C-webpage (www.pik-potsdam.de/4c/).
Table 1. Overview of the 19 climate scenarios applied in this study based on the global circulation model⁎regional climate model combinations for the historical time period (1971–2005) and the low (RCP 2.6), the medium (RCP 4.5) and the high (RCP 8.5) warming pathway (2011–2045) (for more details about the GCM⁎RCM combinations see (Jacob et al 2014)).
| GCM/RCM | Historical runs | RCP2.6 | RCP4.5 | RCP8.5 |
|---|---|---|---|---|
| STARS | 1 | 2 a | 1 | 1 |
| ICHEC-EC-EART/NMI-RACMO22E | 1 | — | 1 | 1 |
| ICHEC-EC-EART/SMHI-RCA4 | 1 | 1 | 1 | 1 |
| MOHC-HadGEM2-ES/SMHI-RCA4 | 1 | — | 1 | 1 |
| MPI-M-ESM-LR/MPI-CSC-REMO2009 | 1 | 1 | 1 | 1 |
aTwo different climate realizations of the same model (STARS) are used here.
Table 2. Characteristics of the three management strategies.
| Strategy/silvicultural measure | Baseline management | Nature protection (NP) | Biomass production (BP) |
|---|---|---|---|
| Overall management goal | reproduce the observed management | lower timber harvest, higher biomass stock, longer rotation cycles | higher timber harvest, lower biomass stock, shorter rotation cycles |
| Planting | same tree species as before | beech on 50% of former pine and spruce covered forest area | Douglas fir on 30% of former pine and oak covered forest area |
| Thinning intensity | observed (BWI3, Thünen-Institut 2012) | −5% | +10% |
| Rotation cycle | as suggested by federal state-specific management guidelines (range 133–201 years, details in table 3) | mean change from baseline = +18 years (details in table 3) | mean change from baseline = −54 years (details in table 3) |
| Harvest abandonment | observed (1.9% of forest area) | 10% of forest area | observed (1.9% of forest area) |
2.2. Forest stand data
Aiming at a comprehensive representation of Germany's forest, we selected all inventory plots including the main tree species from the second German national forest inventory 'BWI²' (pointing date: 2002, (BMELV 2005)). We selected about 21 000 plots with Norway spruce, 15 000 with Scots pine, 2000 with Douglas fir, 16 000 with common beech, 11 000 with oaks, and 4500 with birch. The latter was chosen to represent broadleaf trees with short life span. Furthermore, we used data from the third German national forest inventory 'BWI³' (Thünen-Institut 2012) for model validation of simulated timber harvest and timber increment. The initialization process encompassed three working steps. (1) We extracted from the BWI2 database the tree species and mean age for each BWI2-plot. (2) We then added the age-dependent and species-specific stand information (mean height, mean diameter, and mean basal area) of the specific federal state in which the BWI2-plot was located. (3) We applied initialization subroutines in 4C which included empirically derived distribution functions of height, diameter, and stem number to initialize the carbon pools and other state variables of the model. The plot stand data were then intersected with the CORINE 2000 (DLR-DFD 2004) data to upscale to the total forest area. In total, 69 393 mono-species stands representing 10.37 million hectares (91% of the German forest area) were thus initialized to be simulated with 4C. These forest stands represent a close-to-reality distribution in terms of species occurrence and stand characteristics.
2.3. Climate and Soil data
To each of 69 393 forest stands, we assigned a soil type from the digital soil map BÜK 1000 (BGR 2004), a land-use unit taken from the land cover map CORINE 2000 (DLR-DFD 2004) to aggregate from point to forest area, and the closest grid cell (0.25° × 0.25°) of the CORDEX climate data (Coordinated Regional Climate Downscaling Experiment (Jacob et al 2014)). To aggregate from forest stand (point) to forest area we divided the area of a forest polygon (CORINE 2000) by all forest stands inside this polygon to assign each forest stand the forest area it represents.
We used an ensemble of 14 simulations of future climate (2011–2045) plus five simulations of historical climate (1971–2005) based on statistical and dynamical downscaling approaches with a spatial resolution of 0.25° × 0.25° (table 1). The future climate scenarios cover three RCP (Representative Concentration Pathway) scenarios (RCP2.6, RCP4.5 and RCP8.5, representing a low, intermediate and high warming, respectively). Table 1 lists the number of simulations used within our study and shows the corresponding RCP and GCM/RCM combination.
2.4. Forest management
We defined two alternative management strategies, Biomass production (BP) and Nature protection (NP) (table 2), in addition to the baseline management. The overall goal of the BP strategy was to enhance timber harvest, whereas the NP strategy aimed at old forests (increasing stand age) and habitat diversity enhancement.
First, information concerning the baseline management was derived from forest management guidelines of the federal states and from observed harvest statistics. The thinning intensity was based on annual harvested timber statistics available for tree species, age classes (0–20, 21–40,..., >160), and federal states referring to the ten-year period 2003–2012 (from BWI³ (Thünen-Institut 2012)). From management guidelines a federal state- and species-specific rotation length has been defined (table 3). Second, the two management alternatives (BP, NP) were defined by a set of modifications of the baseline management (table 2).
Table 3. Rotation length in years of the four main tree species (spruce, pine, beech and oak) as minimum (Min), median (Med), and maximum (Max) over the 13 federal states. For Birch and Douglas fir we defined the same rotation length for all 13 federal states.
| Spruce | Pine | Beech | Oak | Birch/Douglas fir | |||||||||
|---|---|---|---|---|---|---|---|---|---|---|---|---|---|
| Min | Med | Max | Min | Med | Max | Min | Med | Max | Min | Med | Max | Med | |
| Base | 97 | 133 | 158 | 133 | 163 | 190 | 143 | 177 | 197 | 135 | 201 | 227 | 80 |
| BP | 70 | 94 | 113 | 88 | 101 | 141 | 103 | 128 | 159 | 104 | 135 | 176 | 60 |
| NP | 112 | 153 | 220 | 127 | 198 | 222 | 167 | 187 | 214 | 120 | 207 | 221 | 100 |
Table 4. Forest ecosystem services by ecosystem service division and group (as defined by Grunewald et al (2016) with the respective 4C model outputs selected as indicators for the ecosystem service-balancing analysis.
| Division | Group (Acronym) | 4C-Model output indicator | Unit |
|---|---|---|---|
| Materials | Biomass (T - Timber) | Timber harvest (CH) | t C ha−1 a−1 |
| Maintenance of physical, chemical, biological conditions | Atmospheric composition and climate regulation (C - Carbon) | Above and belowground biomass (CBM) | t C ha−1 |
| Net ecosystem production (CNEP) | t C ha−1 a−1 | ||
| Soil carbon (CS) | t C ha−1 | ||
| Maintenance of physical, chemical, biological conditions | Water conditions (W - Water) | Percolation (WP) | mm a−1 |
| Nitrogen leaching (WN) | kg N ha−1 a−1 | ||
| Maintenance of physical, chemical, biological conditions | Lifecycle maintenance, habitat and gene pool protection (H - Habitat) | Deadwood (CDW) | t C ha−1 |
| Mean dbh of the trees (dm) | cm | ||
| Broadleaf tree proportion (pBL) | % |
dbh—diameter at breast height
We also considered planting of tree saplings in our simulations. Once the rotation length was reached, the whole stand was harvested and regenerated with 2000 saplings per hectare of the same tree species (baseline management) or management strategy-specific tree species (see table 2). The selection of stands for harvest abandonment and for changing species during planting (see table 2) has been conducted randomly but in such a way that the specific percentage given in table 3 was reached in all federal states. The thinning interval was kept constant for all management strategies and implemented as annual thinnings. Finally, each of the 69 393 forest stands received its specific management input with respect to the federal state, tree species and age.
2.5. Simulation concept, ecosystem service trade-offs and ecosystem service-balancing approach
We simulated the 69 393 forest stands with the initializations generated for the year 2002 for 35 years using the 1971–2005 climate for the historical simulations and the 2011–2045 climate for the RCPs: with all combinations of climate and management scenarios (19 times 3 simulation runs in total). We selected those 4C-model outputs that are indicative of the four different forest ecosystem services which are listed under 'Groups' of table 4. For better analysis and reading we chose for every group an acronym, being aware that the acronym itself does not represent an ecosystem service. Note that nitrogen leaching is inverted to achieve the same directionality as the other indicators to calculate the average water service value.
We calculated for each simulated plot and each climate scenario the relative change of the nine indicators (table 4) using the NP and BP strategy compared to the baseline strategy to quantify the management effect. These relative changes were then averaged for the assigned ecosystem service (table 4) (appendix, equations A1–A4). In addition, we calculated the relative change of the indicators using the RCP scenarios compared to the historic climate separate for each specific RCM to quantify the climate effect. These relative changes were averaged for the assigned ecosystem service in the same way as described for the management effect. The climate and management related effects on the ecosystem services were averaged once more over all plots belonging to one of the 85 German forest regions defined by Wolff (2002). Hereby the relative change of each plot was weighted by its associated forest area. Also the averaging over all forest regions was conducted with weights based on the forest area of the forest region. On the base on the values of the 85 forest regions we conducted a two factorial analysis of variance (ANOVA) with the 14 possible relative changes regarding the climate scenarios and the two management strategies. The ANOVA were calculated for each of the four ecosystem services setting the forest region as a covariate and allowing interaction between the two factors climate and management (results of the ANOVA in table S1 of the supplementary material available at stacks.iop.org/ERL/13/045012/mmedia).
The trade-off analysis between ecosystem services was measured by the Theil-Sen estimate (Sen 1968, Theil 1950) of the slope for each ecosystem service combination for all climate scenarios separately for the two management strategies. Thus, for every forest region (i = 1,2,...,85) and climate scenario (j = 1, 2,...,19) the relative changes with respect to the baseline management are pairwise used to calculate linear functions (with slope aijk and intercept bijk) between each possible ecosystem service pair (k = 1, 2,...,4). In contrast to the ordinary least square method, the median slope (aijk) is calculated from all slopes of a set of pairs xijk, yijk (relative changes of ES of the forest plots of a forest region). The median slopes and the confidence intervals (containing 95% of the slopes) are used further for the trade-off analysis (figure 2) and also for the ecosystem service balancing approach (figure 3) which is described in the following paragraph. A significant (95% confidence interval less than zero) negative slope defined a trade-off whereas a synergy was defined by a significant positive slope (95% confidence interval greater than zero). Further, we calculated the variation coefficients over all slopes of a forest region, ecosystem service pair and management alternative which served as a measure of the climate change uncertainty of the trade-off results (figure 2). All statistical analyses were conducted with R (R Core Team 2015), the Theil-Sen estimates with the R-package zyp Version 0.1–1 (Bronaugh and Werner 2013).
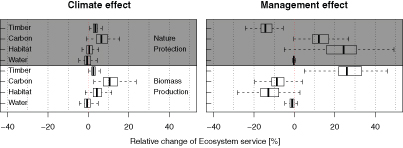
Figure 1. Left: Relative changes of ecosystem services with respect to the difference between climate scenarios (RCPs, 2011–2045) and the historic climate (1971–2005) (climate effect). Right: Relative changes of ecosystem services with respect to the difference between the two management strategies and the baseline management (management effect). The box-plots represent the forest area weighted means of Germany's 85 forest regions.
Download figure:
Standard image High-resolution image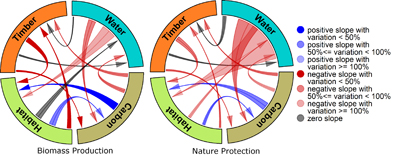
Figure 2. Trade-off and synergies between ecosystem services for both management strategies averaged over all forest areas and climate scenarios. Red arrows represent significant negative (trade-off), blue arrows positive (synergy) and grey arrows zero Theil-Sen slopes. The thickness at the base of the arrow is the absolute slope value between an ecosystem service X and a respective ecosystem service Y (where the arrow points at). The different transparency levels stand for the variation [%] of the slope value with respect to its range of the 2.5% and 97.5% confidence level.
Download figure:
Standard image High-resolution imageTable 5. Categories for the ecosystem service balancing approach for both management strategies (BP, NP). Condition 1 focusses on the change of each ecosystem service (Timber, Carbon, Water, and Habitat) individually and Condition 2 focusses on the relation (based on the Theil-Sen slopes) to the other three ecosystem services.
| Category | Condition 1 (relative change of focused service) | Condition 2 (Theil-Sen slopes to other three services) |
|---|---|---|
| Co-benefit | Class +2 in the focused ecosystem service | At least one service within slope class +2 or +1, other services in minimum in class −1 |
| No regreta | Class +2 in the focused ecosystem service | All services in minimum in class −1 |
| Large trade−off | Class +2 in the focused ecosystem service | At least one service in class −2 |
| Small trade-off | Class +1 in the focused ecosystem service | All services in minimum in class −1 |
| No benefit | Class −1 in the focused ecosystem service | All services in minimum in class −1 |
| Conflicts | Class +1, −1, −2 in the focused ecosystem service | At least one service in class −2 |
aWe define 'No regret' as an increase of an ES above-average without any substantial trade-offs to the other ES, hence strong benefits exceed small losses.
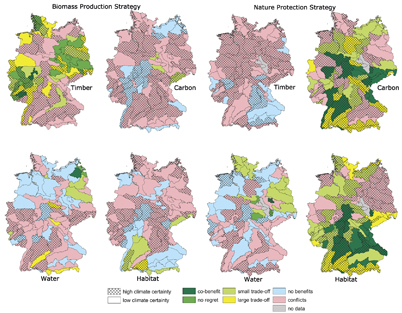
Figure 3. Balancing of ecosystem services separate for the two management strategies (Biomass Production and Nature Protection) and the four ecosystem services. The ecosystem service balancing categories are explained in detail in table 5. High climate certainty is given if 90% of all possible climate scenarios result in the same classification.
Download figure:
Standard image High-resolution image
The management and climate driven changes of ecosystem services as well as the information of the trade-off analysis were combined to evaluate the potential for region-specific balancing of ecosystem service management options. The goal of the balancing was to define forest regions where one ecosystem service responded best to a management strategy while the possibly simultaneous negative impacts on the other ecosystem services were lowest. To this end, we calculated for each management strategy and each ecosystem service the minimum of management driven changes and Theil-Sen slopes, the maximum, the mean of all positive and the mean of all negative changes and Theil-Sen slopes. These values were used as thresholds, defining four classes of ecosystem service change: strong negative changes (−2), moderate negative changes (−1), moderate positive changes (+1) and strong positive changes (+2). The same applies for the Theil-Sen slopes resulting in strong negative slopes (−2), moderate negative slopes (−1), moderate positive slopes (+1) and strong positive slopes (+2). Based on these four classes we defined six categories evaluating a given management strategy (table 5). For example the category 'Co-benefit' was characterized by a strong positive response in one ES (+2) (Condition 1) to a management strategy, a synergy to another service (+2 or +1, i.e. Theil-Sen slope>0) whilst at the same time the negative impacts of the remaining two ecosystem services were not allowed to exceed the class moderate negative slope (−1) (Condition 2). For all categories the climate change uncertainty of the category was checked by calculating for each category and ecosystem service the considered classes for all climate scenarios separately. If more than 90% of all classes were consistent between the climate scenarios we assume that this category has high climate certainty. In case that fewer than 90% of all classes were consistent we assume that the category has low climate certainty. The resulting ecosystem service category per forest region was mapped and represents our 'ecosystem service balancing approach' (figure 3).
3. Results
When comparing the absolute modelled timber harvest and stem increment of the baseline scenario with BWI³ data for each tree species considered in this study, we find that 4C reproduces species-specific yields (stem increment and timber harvest) in good correspondence with inventory data (figure S2 and S3, ESM).
Table 6. Forest area weighted mean of the 4C model output indicators simulated at 69 393 plots with respect to the simulated 10.37 million hectare forest area of Germany. Values are given for the historic climate period and as a mean value over the three RCPs.
| BP | NP | Baseline | |||||
|---|---|---|---|---|---|---|---|
| 4C output | Unit | hist | RCPs | hist | RCPs | hist | RCPs |
| Timber harvest | t C ha−1 a−1 | 2.81 | 2.87 | 2.16 | 2.22 | 2.50 | 2.57 |
| Total biomass | t C ha−1 | 87.86 | 94.04 | 136.59 | 143.69 | 116.75 | 123.68 |
| Net ecosystem production | t C ha−1 a−1 | 2.31 | 2.48 | 3.42 | 3.58 | 3.10 | 3.27 |
| Soil carbon | t C ha−1 | 233.12 | 229.36 | 228.81 | 224.98 | 231.98 | 228.15 |
| Percolation | mm a−1 | 286.51 | 302.67 | 283.37 | 299.65 | 284.17 | 300.52 |
| Nitrogen leaching | kg N ha−1 a−1 | 7.15 | 7.76 | 7.03 | 7.64 | 7.00 | 7.60 |
| Deadwood | t C ha−1 a−1 | 0.23 | 0.22 | 0.45 | 0.41 | 0.35 | 0.31 |
| Mean diameter of the trees | cm | 23.81 | 24.13 | 37.66 | 38.22 | 34.55 | 35.07 |
| Broadleaf tree proportion | % | 30.42 | 30.42 | 40.19 | 40.19 | 37.15 | 37.15 |
The three management strategies lead to strongly different ecosystem service provisioning as reflected by the nine selected model output indicators for the historic climate period and the mean over the RCPs (table 6). The two management alternatives (BP, NP) fulfil their objectives to increase timber harvest (BP) and increase habitat indicators (NP), respectively. As the forest area weighted mean of Germanys annual timber harvest shows, the BP strategy exhibits with 2.81 t C ha−1 a−1 a 30% higher timber harvest than the NP strategy while the habitat-related indicators are consistently lower in the BP strategy. The NP strategy almost doubles the amount of annual new deadwood (0.45 vs. 0.23 t C ha−1 a−1), leads to a larger mean diameter (37 vs. 23 cm), and results in a higher share of broadleaf tree stocked forest stands (40 vs. 30%). Similarly, the NP strategy enhances the carbon service, for instance with 3.42 t C ha−1 a−1 a 48% higher net ecosystem production than the BP strategy. The forest area weighted means in table 6 can be used to project values on the total forest area of Germany of 11.4 million hectares (BWI3, Thünen-Institut 2012).
3.1. Climate and management induced changes of ecosystem service indicators
The timber service increases for all forest regions applying the BP management. The median change is around 25% of timber harvest. The other services decrease for most forest regions whereby the change in the water service is more or less zero. The median change regarding the carbon service is around minus 9% and regarding the habitat service around minus 14%. Under the NP strategy the timber service exhibits a median decrease of roughly minus 15%. This is accompanied by an increase of the carbon and habitat service by around 12% and 24%, respectively (figure 1).
The climate scenarios have on average a positive impact on timber and carbon services for both management strategies in almost all forest regions (figure 1). Habitat is positively affected by climate change under the BP management. Under the NP management, the climate effect on Habitat is slightly negative for half of the forest regions and slightly positive for the other half. The ecosystem service Water is slightly negatively affected by climate change in the median under both management strategies. That means a little more than half of the forest regions experience a very small decrease of this service. In general, the impacts of future climate scenarios are small compared to the management effects (see also table S1 in the supplementary material), leading to changes in ecosystem services mostly ranging between −5 and +10% with the exception of carbon services which show stronger increases especially in the BP management (figure 1).
The relative frequency distributions of the ecosystem service indicators over the forest regions show also that the effects of management strategies are clearly higher compared to the effect of the various climate scenarios (for CBM, CH, CNEP, dm, pBL, CDW, ESM figure S1). The indicators soil carbon and water percolation are comparatively independent of the management and climate scenario and the indicator broadleaf tree proportion (pBL) is management-dependent only.
3.2. Trade-off analysis
We analysed the Theil-Sen slopes between the ecosystem service changes for both alternative management strategies among all climate scenarios (figure 2). Theil-Sen slopes for a management strategy indicate trade-offs (negative slope) and synergies (positive slopes) between these services. For both management strategies there are significant trade-offs between timber and carbon and timber and habitat service (figure 2). A strong synergy exists between carbon and habitat in both management strategies. There is also a trade-off between the water and habitat and water and carbon service with the BP and NP strategy. However the slope between habitat and water with the BP strategy is zero. No significant slopes are found between timber and water services for both managements.
3.3. Ecosystem service-balancing approach
Following the ecosystem service balancing approach described above, we identified forest regions which show the best performance in one ecosystem service while minimizing negative impacts on the other ecosystem services (figure 3). For the BP management, forest areas in the north-eastern, northern and western parts of Germany show co-benefit, no regret, and small trade-off of the timber service with other services. Surprisingly, there are also few areas which show a positive interaction of timber with carbon and habitat services. Forest regions in the east respond positively to the BP management in terms of the water service. The NP strategy performs best in the central and southern parts of Germany with respect to the habitat and carbon service. In the northern and eastern parts of Germany, we detect forest regions where the NP strategy has positive effects concerning the water service (figure 3).
The climate change uncertainty of a forest region is not constant across management strategies nor ecosystem services. There is only one forest region ('Mitteldeutsches Trias-Berg- und Hügelland') in the central part of Germany where all climate scenarios generate the same effect on ecosystem services. The simulations of the water service are most strongly affected by climate change uncertainty.
4. Discussion
4.1. General issues
Our study analysed the combined effects of climate change and alternative forest management strategies on ecosystem services provided by German forests. Our scenario and model-based assessment allows to compare and assess impacts of climate change and land use on ecosystem services (Köhl et al 2010, Verkerk et al 2014). We selected a range of indicators for the evaluation of ecosystem services known to describe the multi-functionality of forestry (Duncker et al 2012, Irauschek et al 2017, Ray et al 2014), e.g. carbon storage and sequestration, habitat conservation, and timber production. Additionally we selected nitrogen leaching and percolation water as indicators for the ecosystem services water quality and quantity, which have been shown to be sensitive to both climate (Neukum and Azzam 2012, Wegehenkel and Kersebaum 2009) and management (Guillemot et al 2015, Simonin et al 2007). In our study, the selection process of the model-based indicators was in line with general requirements for such indicators: transparent, quantitative and scalable (Villa et al 2014).
It is important to note that our analysis only accounts for relative changes. Higher relative changes on the basis of low absolute values of the baseline management are higher ranked than low relative changes on the basis of high absolute values of the baseline management. We decided to follow this approach because of the high number of forest stands simulated for 91% of the German forest area. Looking at relative changes instead of absolute values is a common approach in modelling or climate impact studies as has been shown, for example, for soil moisture (Brocca et al 2014, Koster et al 2009) or water runoff (Muerth et al 2013). For smaller regions trade-offs and synergies could be simulated much more explicit using the Pareto front technique (Lafond et al 2017). Our overall aim was to map management and climate sensitive regions with respect to different ecosystem services (Tallis and Polasky 2009). In spite of using relative changes our model validation has shown that 4C is able to reproduce the observed absolute values of timber harvest and stem increment of the BWI3 (figure S2 and S3, ESM).
4.2. Climate and management induced changes of ecosystem service indicators
In general, we found a stronger influence of the management strategies on the ecosystem services (and thus on the single indicators they are defined by) compared to the influence of the large set of climate scenarios (figure 1). This finding is in accordance with previous studies on climate and management effects on forest growth using different climate scenarios in Germany (Borys et al 2016, Köhl et al 2010) even though none of these studies has used a comparably large climate ensemble. Most of the time, the projected changing climatic conditions led to positive growth changes at the forest stand level. This increase of growth (provided by the results of the 4C model) is explained by the increase of the growing period, and a temperature-induced higher photosynthetic activity that lead to higher assimilation benefits. Only for very few water-limited stands climate change affected forest growth negatively due to pronounced drought stress and mortality. However, both negative and positive climatic impacts have only small effects on forest dynamics compared to silvicultural measures. However, in this context it is important to note that we did not consider biotic disturbance (i.e. insects, pathogens) neither damage caused by storm nor fire which may have a strong impact on similar ecosystem indicators (Irauschek et al 2017, Thom and Seidl 2016) and are likely to increase under climate change (Seidl et al 2017). Hence, our results do not depict the full range of the expected climate impacts relevant for the ecosystem services and hence the climate effects are likely underestimated.
The comparisons of the two alternative management strategies NP and BP revealed two main opposite effects. The BP strategy enhanced the timber yield at the expense of total biomass stock and NEP while the opposite is true for the NP strategy (figure 1). The combination of different rotation lengths (longer in NP strategy, shorter in BP strategy) and different thinning intensities (low in NP, high in BP) explains the simulated changes in timber harvest, total biomass and NEP. This is in line with previous findings, where rotation length was used to increase the carbon sink capability of forests (Foley et al 2009, Kaipainen et al 2004) and higher thinning intensities led to lower carbon stored in the ecosystem (Creutzburg et al 2016, McKinley et al 2011, Seidl et al 2007) and in products (Law and Waring 2015). Similarly, high carbon storage rates in old forests as found here, were shown by Hardiman et al (2013). Our finding that tree species composition influences carbon sequestration at the forest scale was confirmed by Alvarez et al (2016). In our results the increase in the proportion of broadleaf trees was linked positively with CNEP and CBM under the NP strategy. This is mainly caused by the establishment of beech stands partially replacing former spruce and pine stands, predefined in the NP strategy.
4.3. Synergy and trade-off analysis between ecosystem services
Our trade-off analysis is based on the Theil-Sen regression analysis of the ecosystem services. This method provides a robust non-parametric estimator of regression parameters and is less sensitive to outliers and model errors than ordinary least square methods (Fernandes and Leblanc 2005). Commonly used for analysing the associations between ecosystem service pairs is the Pearson's correlation coefficient when data are normally distributed (Langerwisch et al 2018) and otherwise Spearman's rank correlation coefficient (Mouchet et al 2014). However, Muhlbauer et al (2009) show that the Theil-Sen slope estimator tends more towards the trend of robust methods than the Spearman's rank correlation coefficient.
Our study shows strong synergies between carbon and habitat services consistent for both management strategies (BP, NP) (figure 2) confirming findings of other studies (Hansen and Malmaeus 2016, Verkerk et al 2014). This synergy can be explained by positive relations between the indicators deadwood (for habitat service) and soil carbon (for carbon service), as well as between mean diameter (habitat service) and total biomass (carbon service). This synergy is also partly driven by the above-mentioned positive relation of broadleaf tree proportion to net ecosystem production and total biomass, respectively.
We found strong (and significant) trade-offs between timber harvest and the carbon and habitat ecosystem services for both management strategies. Similar trade-offs have been reported for, e.g. central Italy (Bottalico et al 2016), Swiss (Temperli et al 2017) or entire Europe (Verkerk et al 2014). However, with respect to carbon there is an important time component to be considered, i.e. between the short-term and the long-term effects of timber harvest on the whole carbon balance (including substitution). The net effect of full harvest on the carbon balance is negative in the short-term but positive in the long-term to an extent that it overruns the effect of low or zero timber harvest (Pukkala 2016). Also other ecosystem services are known to have important time components (Sutherland et al 2016) which change the strength of trade-off s. Such temporal components of ecosystem service trade-offs are not considered in this study.
Our simulations show only small effects of the different management strategies on percolation and nitrogen leaching, which is supported by Duncker et al (2012). On average over the whole forest area, percolation and nitrogen leaching slightly increases under climate change. This finding contrasts those of Dirnböck et al (2016) who found that climate change significantly decreased cumulative nitrate losses. On the other hand, Gundersen et al (2006) point out that soil warming increased N-leaching if there is no increase in plant N demand. Here much more detailed studies are needed to enhance the understanding of these complex interactions (Bernal et al 2012). Further, our simulations yield unclear or no relations between the water service and the three other services possibly because 4C operates at the stand-level and ignores water flows between forest stands which complicates the aggregation at landscape scale. For this reason, we stress that our results with regard to the water service should be evaluated at the stand scale (Vacik and Lexer 2001).
4.4. Balancing approach of ecosystem services
The ecosystem service balancing approach combines the trade-off comparison on the base of simulated results with the process-based model 4C with the multiple-objective-scheme (table 5). These kinds of approaches are often applied in ES analysis (Chen et al 2016). It allows to evaluate, at the spatial scale of forest regions, which management strategy promotes which ecosystem service at the cost of the other three services. Without knowing the absolute benefits or losses of the ecosystem services our method enables the detection of forest regions where positive changes are highest and negative changes are lowest compared to the baseline situation. The balancing approach is motivated by the need to design forest management and forest policies which support multifunctionality in the provision of ecosystem services as discussed for the 'Supply-supply case' in Mouchet et al (2014). However, our approach goes beyond multifunctionality and helps to identify forest regions where one can enhance a specific ecosystem service whilst minimizing the effects on the other ecosystem services.
Under the BP management there are only a few forest regions which feature 'Co-benefits' of the timber service with the other ecosystem services because of the large trade-offs with carbon and habitat. However, there are forest regions classified as 'no regret' or 'small trade-off' which show that it is possible to balance timber, carbon and habitat to some extent. If there is a need for higher timber harvest (Temperli et al 2017), e.g. forests to fulfil their role in the bioeconomy, then these forest regions are most suitable for the BP management in comparison to all other regions. Overall, our analysis highlights two main aspects to understand why management strategies caused distinct changes in ecosystem services. Firstly, the above average timber provision under the BP management accompanies a below average provision of carbon and habitat services under the NP management. In our study this situation can be found in forest regions which are characterized by forest stands with a high share of pines, low nutrition status of the soil, and low elevation. One reason for this is that pine trees experience a high increase in growth in the climate change scenarios (Gutsch et al 2016). Another reason is that for the warmer and drier regions of Germany, where the 'plant available water' limits growth, high biomass accumulation in old pine forests is hampered by strong water competition and mortality (McDowell et al 2013, Müller et al 2016). Also, the low nutrition status of the soils in these regions caused a comparatively low carbon storage in tree biomass (Ying-Ping et al 2015). Secondly, regions with low drought sensitivity and/or higher nutrition status (dominating in central and southern Germany) experience higher above average positive changes in carbon and habitat services with the NP management.
5. Conclusions
The development of regionally differentiated and climate-adapted forest management requires detailed knowledge about how local soil conditions, future climates and different management strategies will interact and subsequently affect the provision of ecosystem services. In this study, we include for the first time region-specific information of stand and soil characteristics, climate change and management options in a process-based forest growth simulation for the whole forest area of Germany up to the year 2045. Our approach allows the evaluation of management strategies for each forest growing region according to specific ecosystem services and offers a first glance towards optimizing ecosystem service provision at the national level. Our results provide an important step towards a better understanding of the trade-offs and synergies between forest ecosystem services that is needed to foster a sustainable forest management in an uncertain future and allow for an informed political debate about the valuation of different ecosystem services. The limitations of our study include mainly factors which determine the specific responses to different management strategies. Future refinements of the approach may include the integration of a wood product model and socio-economic analysis that are needed to capture the substitution effect of wood products. Also cultural ecosystem services (e.g. recreation, tourism, education) are highly correlated with carbon and habitat services. They may be included in future studies as well to provide a more complete picture of the main ecosystem services provided by German forests.
Appendix
The changes of ecosystem services timber harvest (T), carbon (C), habitat (H) and water (W) for the management strategy i (i = 1, 2) were calculated relative to the base management separately for each climate model run (j = 1, 2,...,19, table 1) according to the equations (A1)—(A4):
The variables are defined in table 4.
Acknowledgments
CPOR acknowledges funding from the German Federal Ministry of Education and Research (BMBF, grant no. 01LS1201A1). MG, CK receives funding from the Federal Ministry of Food and Agriculture and the Federal Ministry for the Environment, Nature Conservation, Building and Nuclear Safety (BMEL and BMUB, grant no. 28WC403102, WAHYKLAS). Support with data and collaboration by the project CC-LandStraD (German Federal Ministry of Education and Research, grant no. 01LL0909A6). We would like to express our special thanks to Professor Dr Peter Elsasser and Nils Ermisch from the THÜNEN Institute for creating the management scenarios for the CC-LandStraD project.