


Abstract
The meteoroid input function (MIF) describes the seasonal, diurnal and planetographic distribution of incoming meteoroids onto an atmosphere and/or surface of a solar system body. Utilizing state-of-the-art dynamical models of the main populations of meteoroids, we present a comparative study of the MIF on the atmospheres of Venus, Earth and Mars. Our modeling results show that, although a planet's axial tilt and orbital eccentricity introduce measurable important variability of the overall MIF, excursions from the ecliptic plane due to orbital inclination are responsible for the largest differences, producing variations of up to 40% with respect to the mean value in the overall mass fluxes of Venus and Mars. This is particularly true for meteoroid populations concentrated around the ecliptic plane, which are believed to be the dominant source of organics and metals on the atmospheres of these planets.
Export citation and abstract BibTeX RIS

Original content from this work may be used under the terms of the Creative Commons Attribution 4.0 licence. Any further distribution of this work must maintain attribution to the author(s) and the title of the work, journal citation and DOI.
1. Introduction
Planetary bodies and satellites sweep through a cloud of interplanetary dust and particles while they move along their orbital path causing a constant bombardment of meteoroids on their surfaces and atmospheres. When they encounter bodies enveloped by planetary atmospheres, meteoroids heat up as they interact with an increasingly denser atmosphere, decelerate and ablate most of their material in the atmospheric aerobraking region, and introduce exotic species such as Mg, Na, and Fe (Grebowsky et al. 2002, 2017; Plane 2003; Crismani et al. 2017, 2018; Carrillo-Sánchez et al. 2020). It is estimated that, within a factor of 3, ∼30 daily tons of material enter the upper atmosphere of Earth, most of which is in the form of particles with masses between 1 and 10 μg (Carrillo-Sánchez et al. 2016; Janches et al. 2017; Swarnalingam et al. 2019). As these metallic species can be ionized during ablation, by sunlight's ultraviolet photons or by charge exchange with existing atmospheric ions, meteoroids affect the structure, chemistry, dynamics, and energetics of planetary ionospheres.
Meteoric ablation in planetary atmospheres is a ubiquitous phenomenon, and the resulting metal atoms and ions are important tracers of chemistry and dynamics, as they are relatively long-lived and easy to observe (Plane 2003; Plane et al. 2015, 2018). Not only do metallic layers act as tracers of the dynamics dominant in their atmospheric formation region, but also they can become oxidized into meteoric smoke particles, forming metal carbonate ice particles and are an important source of ice cloud nuclei for mesospheric ice clouds (Plane et al. 2015). At Mars, for example, where the atmospheric energy budget is strongly mediated by radiatively active aerosols, meteoric seeded clouds may be responsible for strong perturbations in the mesosphere (Hartwick et al. 2019). At Earth's atmosphere, species such as Na, Fe, Ca, Ca+, K, Mg+, and, most recently, Ni, have been observed for decades by techniques including ground-based lidar, rocket-borne mass spectrometry, and space-borne spectroscopy (Plane et al. 2015; Gerding et al. 2019). Four years of observation provided by the Mars Atmosphere and Volatiles EvolutioN (MAVEN; Jakosky et al. 2015) satellite include the first ever direct measurement of these species in another planetary atmosphere. These observations were performed with the Imaging UV Spectrograph (IUVS; McClintock et al. 2015), which images the dayglow emission at wavelengths below 330 nm and concentrations can be retrieved down to ∼80 km (Crismani et al. 2018), and the Neutral Gas Ion Mass Spectrometer, which measures both ions and neutrals in situ (Benna et al. 2015; Carrillo-Sánchez et al. 2020).
For the case of airless bodies, meteoroids impact their surfaces, producing impact debris and generating surface-boundary exospheres. Several works have shown direct observational evidence of the critical role that meteoroid activity plays in space weathering of airless bodies using observations from missions like MErcury Surface, Space ENvironment, GEochemistry, and Ranging and the Lunar Atmosphere and Dust Environment Explore (Pieters & Noble 2016; Pokorný et al. 2017, 2018, 2019; Janches et al. 2018; Szalay et al. 2018). Thus, knowledge of the meteoroid environment for particles, from both the sporadic background and showers, is relevant to planetary science, chemistry of planetary atmospheres, space weathering of airless bodies, and even collisional risk assessment to satellites and astronauts (Moorhead et al. 2020).
The meteoroid input function (MIF) describes the seasonal, diurnal, and planetographic distribution of incoming meteoroids onto an atmosphere and/or surface of a solar system body given their astronomical origin (Fentzke & Janches 2008; Janches et al. 2018). It has been previously demonstrated for a limited number of planetary bodies in the solar system that the MIF manifests into the directionality of arrival of meteoroids in planetary bodies, providing a specific local time (LT) and planetographic dependence (Janches et al. 2006), which measurably influences the composition of planetary atmospheres and space weathering of airless bodies (Marsh et al. 2013; Pokorný et al. 2017, 2019; Janches et al. 2018). Here we extend previous work and present a comparative study of the MIF at Venus, Earth, and Mars. This study reports for the first time for Mars and Venus the variation of the MIF with the season, LT, and planetographic location. We describe in Section 2 the dynamical models of the more dominant populations of meteoroids in the inner solar system and the methods. We present and discuss the results in Section 3. In Section 4 we present final remarks.
2. The MIF
Similarly to previous work for Mercury (Pokorný et al. 2017, 2018), the Moon (Janches et al. 2018; Pokorný et al. 2019) and Earth (Swarnalingam et al. 2019), in the present study we model the MIF for Venus, Earth, and Mars using dynamical models of four meteoroid sources. These include particles released by Jupiter family comets (JFCs; Nesvorný et al. 2010, 2011a), Halley-type comets (HTCs; Pokorný et al. 2014), Oort Cloud comets (OCC; Nesvorný et al. 2011b), and Main Belt asteroids (MBA; Nesvorný et al. 2010). Other meteoroid populations such as those produced by Edgeworth–Kuiper Belt objects have been shown to be of little significance to the overall flux in the inner solar system (Poppe 2016). These models, which have been extensively described in previous works, track the temporal and orbital evolution of particles ejected from their sources (JFCs, MBA, HTCs, and OCCs) to sinks (sublimation, an impact in a solar system body, or a departure from the solar system body; Nesvorný et al. 2010, 2011a, 2011b; Pokorný et al. 2014). They include both gravitational perturbations by planets and relevant non-gravitational effects, such as radiation pressure and Poynting–Robertson (PR) drag. They also simulate collisions following the treatment proposed by Steel & Elford (1986) whereas the cloud density is constrained with a size distribution function (SDF) determined with Long Duration Exposure Facility (Love & Brownlee 1993) observations assuming a logarithmic shape (an assumption well supported at 1 au by radar observations of meteors; see Janches et al. 2019, and references therein). The collisional lifetimes and SDF are treated as free parameters of the models, and the method proposed by Kessler (1981) is used to calculate the impact probability with planetary bodies. In particular for this work we used the model updated versions reported by Pokorný et al. (2018, 2019) who explored the effects on the production of the ejecta dust cloud on Mercury and the Moon, respectively, produced by different SDFs resulting from varying the differential size index, α (i.e., exponent of the SDF), and different collisional lifetimes resulting from using a collisional fudge factor, Fcoll. In this work we adopt α = 4 (or a differential mass index, β = 2 in agreement with radar observations; Janches et al. 2019) and Fcoll = 20, shown to provide the best agreement with measurements (Pokorný et al. 2019).
Given a particle mass m, entry velocity V, and radiant coordinates in heliocentric ecliptic longitude λ and ecliptic latitude β, the aforementioned models provide a weighting factor that, assuming a total mass flux, can be converted into a number of particles impinging a particular body (Pokorný et al. 2018, 2019). This factor takes into account gravitational focusing effects that can be significant for slow particles. As an example, JFC particle fluxes on the lunar surface can be up to seven times smaller with respect to that at Earth due to this effect (Janches et al. 2018; Pokorný et al. 2019). Table 1 compares the gravitational focusing effect, GF, for different meteoroid velocities at the three planets given by

where Vesc is the escape velocity of the particular planet (Table 2) and Vrel is the relative velocity between the meteoroids and the planet. Each planet has a different atmospheric profile that alters at which altitude meteoroids ablate, and thus for simplicity we assume the escape velocity at the surface of each planet. It is evident from Table 1 that this effect is important for the low-velocity MBA and JFC meteoroid populations and should not produce significant changes on the long-period comets populations. The resolutions in the model used in this work are 2 km s−1 in V and 2° in λ and β. Regarding particles sizes, we consider particles as small as 10 μm and as large as 2000 μm with somewhat different resolutions depending on populations. Table 1 in Pokorný et al. (2019) provides the specific sizes and the number of test particles used for each population.5
Table 1. A Planet's Gravitational Focusing Effect Factora
| Vrel (km s−1) | Venus | Earth | Mars |
|---|---|---|---|
| 15 | 1.48 | 1.6 | 1.1 |
| 25 | 1.17 | 1.2 | 1.04 |
| 35 | 1.08 | 1.1 | 1.02 |
| 45 | 1.05 | 1.06 | 1.01 |
| 55 | 1.04 | 1.04 | 1.01 |
Note.
aThe escape velocity to estimate this factor is calculated at the surface of each planet.Download table as: ASCIITypeset image
Table 2. A Planet's Orbital and Physical Parameters Relevant to the MIF Variability
| Parameter | Venus | Earth | Mars | Variability |
|---|---|---|---|---|
| e | 0.007 | 0.017 | 0.0934 | Seasonal |
| i (°) | 3.4 | 0 | 1.85 | Seasonal, flux |
| Radius (km) | 6051.8 | 6378.1 | 3396.2 | Flux |
| Vesc (km s−1) | 10.36 | 11.2 | 5.027 | Ablation |
| Rotation period (sideral days) | −243.02 | 0.997 | 1.03 | Diurnal and longitudinal |
| Tilt (°) | 2.6 | 23.4 | 25.9 | Latitudinal |
Download table as: ASCIITypeset image
Recently, Carrillo-Sánchez et al. (2020) combined these dynamical models with the Chemical ABlation MODel (Vondrak et al. 2008) and reported a comparison of the contribution of metals and intact carbon from these cosmic meteoroid sources to the atmospheres of the three planets studied here. According to that work, meteoroids originating from JFCs represent the main mass contributor in all three atmospheres (68% for Venus, 70% for Earth, and 52% for Mars, respectively). Furthermore, the authors used a meteoroid distribution in ecliptic coordinates that was uniform throughout the planets' orbit and transformed the coordinates into representative coordinates at 40N degree latitude for both Earth and Mars and at the equator for Venus, thus removing any temporal or spatial variability. This variability will be studied here in detail.
Figure 1 shows the flux of meteoroids from each population integrated over each entire planet as a function of the planet's true anomaly angle (TAA) normalized to 1 t d−1 flux at Earth for each population, where t d−1 are metric tons per day, i.e., 1000 kg per day. A general agreement with Carrillo-Sánchez et al. (2020) can be seen in that, since the radius of Mars is about half of that of Earth and Venus, the total flux is about an order of magnitude smaller. It can also be observed in Figure 1 that, even though the surface area of Venus and Earth are similar, the asteroidal meteoroids flux is somewhat smaller in the Venusians' atmosphere since their orbits are circular already and they move into the inner solar system only by PR drag. This process prolongs the time needed for these particles to reach orbits between Earth and the Sun, effectively resulting in particles having experienced more collisions than those crossing the orbits of Earth and Mars, and are thus dynamically more evolved. Therefore, a larger portion of particles are destroyed compared to those impacting Earth by mutual collisions between meteoroids (Grün et al. 1985; Pokorný et al. 2018), ultimately leading to a lower contribution of the MBA population at Venus' orbit. At the same time, the more eccentric populations (HTCs and OCCs) are more effective at reaching the inner solar system producing a higher flux at Venus than at Earth. This is due to the fact that meteoroids on high eccentricity orbits (e > 0.9) must undergo significant dynamical evolution before they are circularized. Thus meteoroid populations with eccentric orbits will accrete more effectively on inner solar system planets. These two effects have been shown to be particularly extreme at Mercury (Pokorný et al. 2018).
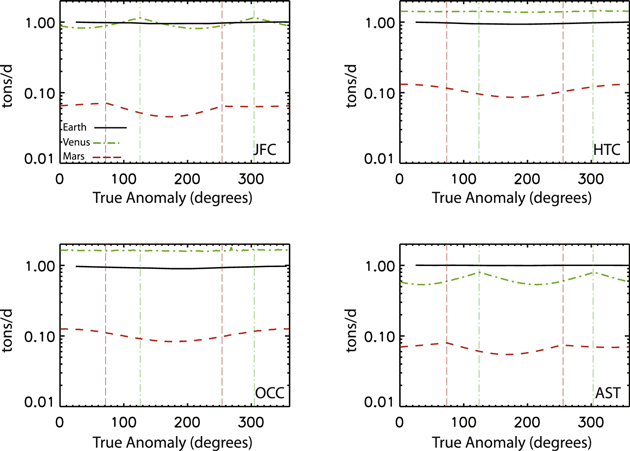
Figure 1. Flux of meteoroids from each population integrated over each entire planet as a function of the planet's TAA normalized to 1 t d−1 flux at Earth for each population. The vertical lines show the TAA at which Venus (green) and Mars (red) cross the ecliptic plane.
Download figure:
Standard image High-resolution imageA new finding of the present study, which is underlined by Figure 1, is the change in the input magnitude for some of these sources with differences up to ∼40% on Venus and Mars as a function of the TAA. This effect is due to the excursion of the planets away from the ecliptic plane due to their nonzero inclined orbits (also noted at Mercury; Pokorný et al. 2018), and it is not captured in the work reported by Carrillo-Sánchez et al. (2020) due to the utilization of an MIF averaged over a year. Table 2 summarizes the main orbital and physical difference of these planets, as well as the properties these differences will influence.
In order to estimate the MIF, the weighting factor resulting from the dynamical models is combined with the physical and orbital properties of the specific solar system body. Therefore, for each planet we define a grid of planetographic latitudes and longitudes with a resolution of 5° for both Venus and Mars. For Earth, the grid resolution is 5° in latitude and 1 25 in longitude. Specifically the number of particles with diameter D and geocentric velocity V originating from a radiant with ecliptic coordinates (λ, β) crossing the planet's cross section disk over the entire year, N(m, V, λ, β), is estimated as

where D is the geometric mean between D1 and D2 in a logarithmic scale, DMax is arbitrarily chosen as 2000 μm, and  is the weighting factor retrieved from the dynamical models. The number of impacts for a given set of meteoroid dynamical parameters at a given location on the particular planet is estimated as

where A(ϕ(t)) is the area of the cell "seen" by a flux impacting at an angle equal to ϕ(t), which is the elevation angle of each ecliptic radiant provided by the dynamical models with respect to an observer positioned on each cell of the planetographic grid. For the case of Earth the calculation of ϕ is a standard calculation (Duffett-Smith 1988). For Mars and Venus we utilized the SPICE ToolKit (Acton 1996).
Because of the differences in orbital, rotational, and tilt motions of each planet, these elevations can vary significantly as a function of the planet's TAA, which in turn will result on significant changes on the meteoroid flux. Two extreme cases of this variability have been demonstrated at Mercury (Pokorný et al. 2017, 2018) and the Moon (Janches et al. 2018; Pokorný et al. 2019). To account for such an effect, the dynamical model produces output every one terrestrial day for Venus (226 outputs), 30 terrestrial days for Earth (12 outputs), and two terrestrial days for Mars (346 outputs).
It is important to note that, for this study, we will focus primarily on relative values for each population due to changes produced by the meteoroid environment and the planet's physical and orbital characteristics. Absolute fluxes are heavily dependent on the measurements used to constrain those values (Nesvorný et al. 2010; Carrillo-Sánchez et al. 2016, 2020; Janches et al. 2017). In addition, the agreement found with those measurement constraints are highly dependent on the uncertainties on model parameters such as the assumed collisional lifetimes, particle densities, and/or the SDF at the source, which can be large (Pokorný et al. 2018, 2019). Thus we do not intend to provide absolute flux estimates in this work but focus on relative changes of the flux, all of which are easily scaled once a particular absolute flux is adopted. Naturally, the most convenient pivot/anchor point (i.e., something that everything else is relative to) is usually the Earth (and the mass flux on Earth), due to the significant wealth of data for the Earth/Moon region.
3. Results and Discussion
The parameters in Table 2 outline several differences and similarities between the planetary characteristics that will be reflected in the MIF at each location. In particular, Figure 2 displays the vertical distance with respect to the ecliptic plane as a function of the TAA. Due to the nonzero orbital inclination of both Venus and Mars, these planets experience significant excursions away from the ecliptic plane in comparison to Earth. This in turn limits the flux of those populations that are mostly distributed close to the ecliptic (i.e., MBA and JFC), causing sharp inflection points in the overall flux (see Figure 1). Thus, in order to study these effects along with diurnal, seasonal, and latitudinal variabilities generated by orbital, rotational, and axial tilt motions, we first selected six particular positions for Mars and Venus listed in Table 3. These are the aphelion and perihelion points, the two point at which each planet crosses the ecliptic plane, and the maximum and minimum vertical distances from the ecliptic plane. For all purposes on this study, the Earth's orbital inclination is negligible and effects due to the departure from the ecliptic plane are absent, and we limit our study to four of Earth's TAAs representing the months when the equinoxes and solstices occurred, which are times when the sharpest changes on the terrestrial MIF take place (Janches et al. 2006; Fentzke & Janches 2008).
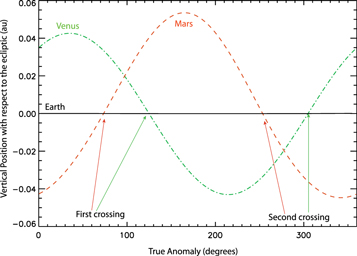
Figure 2. Vertical distance of each Venus (green), Earth (black), and Mars (red) with respect of the ecliptic plane as a function of the planet's TAA.
Download figure:
Standard image High-resolution imageTable 3. A Planet's TAA and Corresponding Vertical Distances from the Ecliptic at Those Orbital Positions Chosen for This Study
| Position | Venus | Earth | Mars | |||
|---|---|---|---|---|---|---|
| TAA (°) | Ecliptic Altitude (au) | TAA (°) | Ecliptic Altitude (au) | TAA (°) | Ecliptic Altitude (au) | |
| Minimum | 214 | −0.043 | ⋯ | ⋯ | 342 | −0.045 |
| Maximum | 35 | 0.043 | ⋯ | ⋯ | 165 | 0.054 |
| First crossing | 125 | 0.00 | ⋯ | ⋯ | 73 | 0.00 |
| Aphelion | 0 | 0.035 | ⋯ | ⋯ | 0 | −0.043 |
| Perihelion | 180 | −0.035 | ⋯ | ⋯ | 180 | 0.051 |
| Second crossing | 306 | 0.00 | ⋯ | ⋯ | 253 | 0.00 |
| March | ⋯ | ⋯ | 175 | 0.00 | ⋯ | ⋯ |
| June | ⋯ | ⋯ | 64 | 0.00 | ⋯ | ⋯ |
| September | ⋯ | ⋯ | 355 | 0.00 | ⋯ | ⋯ |
| October | ⋯ | ⋯ | 82 | 0.00 | ⋯ | ⋯ |
Download table as: ASCIITypeset image
Before looking into the variability of the MIF at each planetary body studied here, it is important to mention the association of these populations with the so-called apparent meteor sporadic sources that are the manifestation of these populations as seen from a planetocentric-based observing system (Brown & Jones 1995). These are known as: (1) the north and south apex sources, composed mainly of dust from long-period comets (HTCs and OCCs; Sekanina 1976; Nesvorný et al. 2011b; Pokorný et al. 2014); (2) the helion and anti-helion sources, composed of dust from short period comets (JFCs and MBAs; Hawkins 1956; Weiss & Smith 1960; Nesvorný et al. 2010, 2011a); and (3) the north and south toroidal sources composed of dust from HTCs (Jones & Brown 1993; Campbell-Brown & Wiegert 2009; Pokorný et al. 2014; Janches et al. 2015). Figure 3 displays the position of these sporadic meteor radiant distributions as white ellipses on a map in ecliptic coordinates in which the sources are viewed from an Earth-centered frame of reference. Therefore, the radiants are expressed as λ–λ0, where λ is the heliocentric ecliptic longitude and λ0 is the true heliocentric longitude of the Sun. This effectively removes the motion of the Earth relative to the Sun, allowing us to display the position of each source fixed in heliocentric ecliptic coordinates throughout the year (e.g., the Earth's apex is always at 270°).
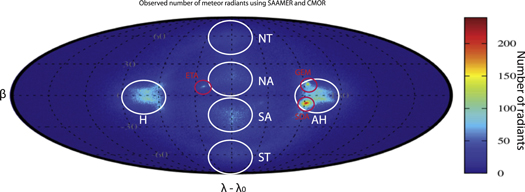
Figure 3. The position of the sporadic meteor radiant distributions in a map in ecliptic coordinates in which the sources are viewed from an Earth-centered frame of reference. The sources, marked with white ellipses, are the north and south apex (NA and SA), helion and anti-helion (H and AH), and the north and south toroidal (NT and ST). Circles in red show three strong annual meteor showers: ETA, GEM, and SDA.
Download figure:
Standard image High-resolution imageThe colored image on the map represents a combined composite year of observations from the two main radars that currently provide continued surveillance of the near-Earth meteoroid environment. These are the Canadian Meteor Orbital Radar (CMOR of mostly Northern Hemisphere observations; Brown et al. 2008) and the Southern Argentina Agile MEteor Radar—Orbital System (SAAMER—OS of mostly Southern Hemisphere observations; Janches et al. 2015, 2020; Bruzzone et al. 2020). Note that the radars are not calibrated with each other, nor are these data corrected for observational biases, and thus the intensity of the sources is not absolute. The red circles on the figure identify three meteor showers whose activity is so strong that they are well above the background noise, even when a full year of observations is combined. These are the η Aquarids (ETA), the southern δ Aquiliids (SDA), and the Geminids (GEM). As can be seen, meteor shower are not only constrained in time but also their radiant is more localized in space, while the sporadic sources result in a wider distribution present throughout the year. Thus, the impact of meteor showers onto planetary atmospheres may be large during a short period of time, depending on their activity (Crismani et al. 2018), but do not contribute significantly to the overall MIF. These sources will manifest similarly at other inner solar system bodies (Janches et al. 2018; Pokorný et al. 2018, 2019).
Figures 4–7 display the relative changes of the MIF as a function of the planetographic latitude and LT for meteoroids released by MBA, JFC, HTC, and OCC, respectively. The six panels in the left and right columns of each figure represent the six different TAAs listed in Table 3 for Venus and Mars, respectively, while the four middle panels represent the four representative months at Earth also listed in Table 3. Some general results for all populations can quickly be drawn from these figures. As in Figure 1, it can be seen that the overall flux of MBAs and JFCs at Venus and Mars decreases by about 40% at TAAs when maximum departures from the ecliptic plane occur. The maximum contributions of these populations to the MIF occur during the TAAs when ecliptic crossing takes place, which is reasonable given the fact that these populations are concentrated around that plane (Figure 3; Nesvorný et al. 2010, 2011a). Interestingly, the faster populations (HTCs and OCCs) have a similar decrease at Mars but their contribution are almost constant at Venus throughout its orbit. This is due to the more eccentric nature of Mars' orbit compared to that of Venus, which causes a minimum meteoroid influx of these populations at aphelion. The same effect has been modeled at Mercury (Pokorný et al. 2018). Note that at Earth, there is a combination (or lack of) of these effects. Earth's orbit is approximately circular like that of Venus and does not depart from the ecliptic plane and thus there is a negligible seasonal effect on the overall MIF contribution for all the populations.
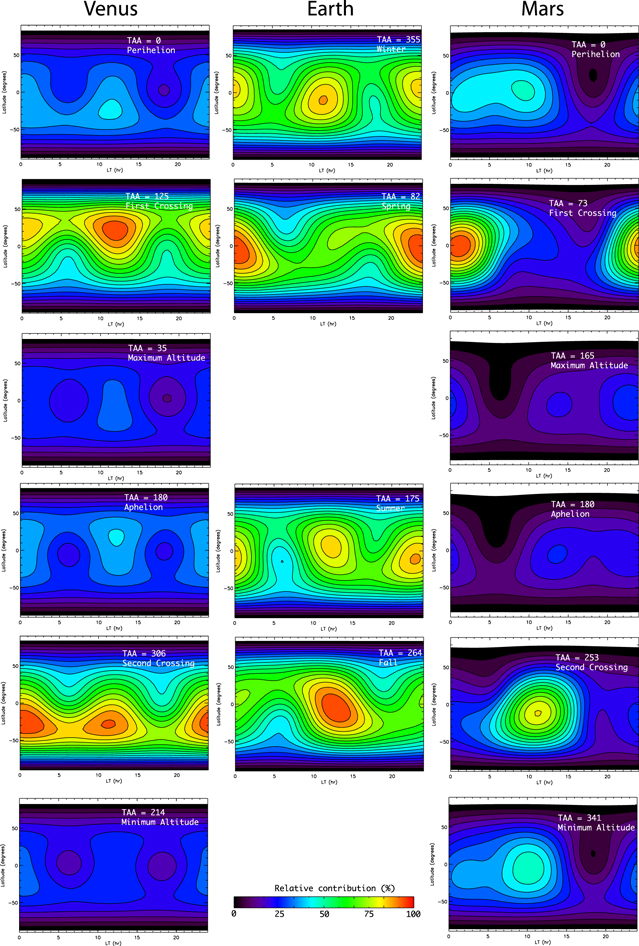
Figure 4. Relative changes on the MIF produced by MBA meteoroids as a function of the planetographic latitude and LT for Venus (left), Earth (middle), and Mars (right). Each contour line represents a 5% increase. The rows are organized in the following manner: row 1 represents near perihelion, row 2 near ecliptic, row 3 maximum altitude, row 4 near aphelion, row 5 near ecliptic, and row 6 minimum altitude.
Download figure:
Standard image High-resolution image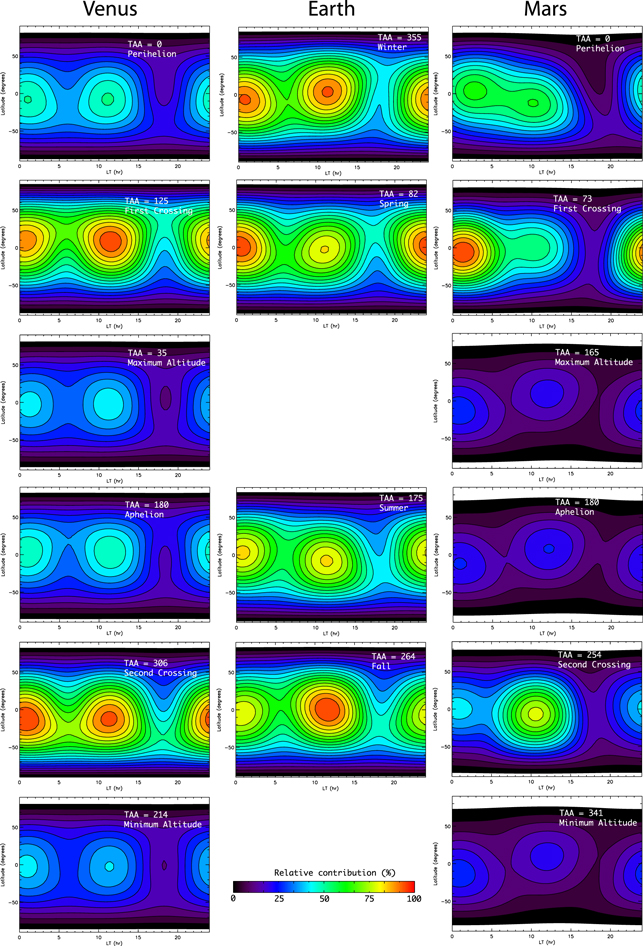
Figure 5. Relative changes on the MIF produced by JFC meteoroids as a function of the planetographic latitude and LT for Venus (left), Earth (middle), and Mars (right). Each contour line represents a 5% increase. The rows are organized in the following manner: row 1 represents near perihelion, row 2 near ecliptic, row 3 maximum altitude, row 4 near aphelion, row 5 near ecliptic, and row 6 minimum altitude.
Download figure:
Standard image High-resolution image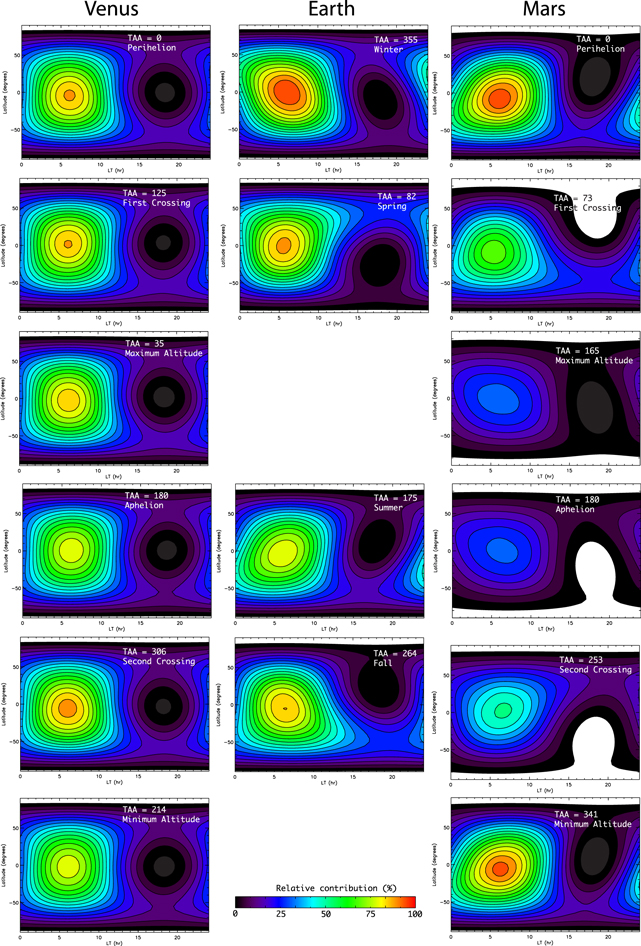
Figure 6. Relative changes on the MIF produced by HTC meteoroids as a function of the planetographic latitude and LT for Venus (left), Earth (middle), and Mars (right). Each contour line represents a 5% increase. The rows are organized in the following manner: row 1 represents near perihelion, row 2 near ecliptic, row 3 maximum altitude, row 4 near aphelion, row 5 near ecliptic, and row 6 minimum altitude.
Download figure:
Standard image High-resolution image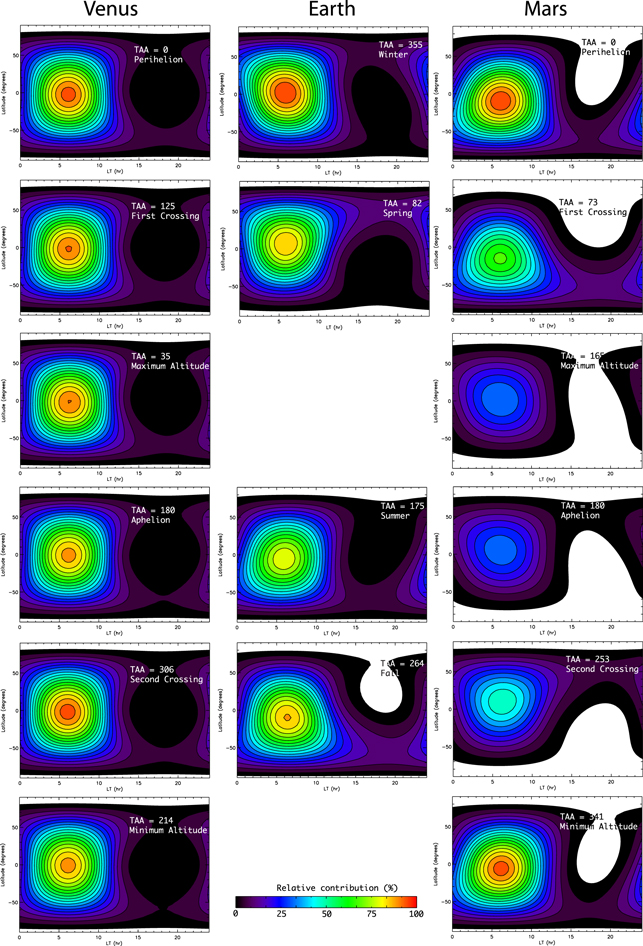
Figure 7. Relative changes on the MIF produced by OCC meteoroids as a function of the planetographic latitude and LT for Venus (left), Earth (middle), and Mars (right). Each contour line represents a 5% increase. The rows are organized in the following manner: row 1 represents near perihelion, row 2 near ecliptic, row 3 maximum altitude, row 4 near aphelion, row 5 near ecliptic, and row 6 minimum altitude.
Download figure:
Standard image High-resolution imageSimilarly, Figures 4–7 show the LT variability. In essence, MBA and JFCs meteoroids produce two periods of maximum contribution at about midnight and noon in all planets, each corresponding to the time at which the anti-helion and helion meteor sporadic sources reach their highest elevations on the sky with respect to a given planetographic location (Figure 3; Janches et al. 2006; Fentzke & Janches 2008). However, an important difference between the planets is that the relative contribution during these two LTs are similar for a given TAA at Venus but changes significantly at Earth and Mars as a function of the TAA. For example, during ecliptic crossings at Mars, the difference between the midnight and noon period is over 50%, while at Earth during the equinox months it is ∼30%. For the case of the long-period comets populations, since HTC and OCC released meteoroids have orbits that produce radiants mostly concentrated in the planets' apex direction, the resulting MIF will make most of its contribution during the first half of the day with a peak at 06:00 hr LT and with mostly a negligible input after 14:00 hr LT. An important point to note regarding to the LT variability is its relation with the planetographic longitude. Because the rotation period of Earth and Mars is about 24 hr, all longitudes on these planets will experience similar MIF levels over a year. However, due to the slower rotation period at Venus, over 200 days (see Table 2), a particular longitude will be exposed to a larger MIF contribution with respect to opposite sides. Consequently, this fact might have noticeable implications for the global distributions of meteoric-related constituents in the Venusians' upper atmosphere, depending on the circulation speed and chemical reactions' timing (Marsh et al. 2013).
The midnight-to-noon MIF strength asymmetry for MBA and JFC meteoroids at Earth and Mars is due to their larger axial tilt in comparison with that of Venus, a characteristic which will also introduce latitudinal variability. Interestingly, for the MIF produced by the MBA and JFC meteoroids (Figures 4 and 5), the latitudinal variability at Venus is uniform along all LTs, due to its small axial tilt. Due to the larger tilt angle at Earth and Mars, on the other hand, these population produce an asymmetric latitudinal motion, which is when the midnight maximum is southward/northward of the planet's equator and the noon one occurs at northward/southward planetographic latitudes. There is little or no latitudinal variability of the MIF for apex radiants at Venus while some occur at those planets with larger axial tilts. In those cases the peak of the MIF varies by ±20° with respect to the equator.
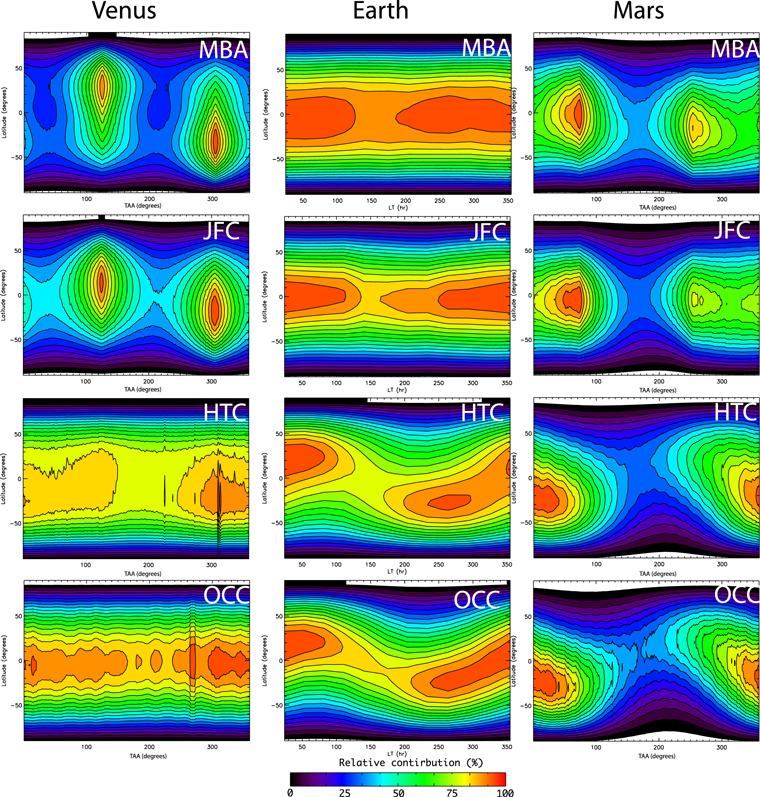
Finally, we present in Figure 8 the diurnally integrated MIF as a function of the planetographic latitude and TAA for each meteoroid population and planet studied here. These figures show that, due to the nonzero orbital inclination of Venus and Mars, the influence of MBAs and JFCs on their atmospheres is maximum during a relatively short period of time around the TAAs when the planets cross the ecliptic plane. However, most of the time, the influx decreases below 70% of the maximum value. This effect can potentially have a large impact on current studies such as those presented by Carrillo-Sánchez et al. (2020), where the weighting factor of each population is estimated for Earth and, later, they are extrapolated for Mars and Venus, without taking into account the significant variability in the fluxes of JFCs and MBAs in these two planets. Furthermore, because of the uniform latitudinal variability at Venus given a TAA (left panels in Figures 4 and 5), this results in a large overall diurnally integrated latitudinal variability as a function of the TAA. The peak between the first and second ecliptic crossing is ±30° and ±20° in planetographic latitude for the MIF produced by MBA and JFC meteoroids, respectively. On the other hand, for Earth and Mars the asymmetry in peak intensity by these populations averaged out such that on a diurnally integrated timescale there is little variability in planetographic latitude. In addition, although broader than on Venus, the peak of the MIF is confined to the ecliptic crossing period at Mars, at Earth the MIF is relatively constant throughout the year given the fact that there is no departure from the ecliptic plane. For the case of the long-period comet populations, because of the circularity of Venus' orbit and the small axial tilt, the intensity of the HTC- and OCC-produced MIF is approximately constant throughout the orbit, both temporally and latitudinally. For the case of Earth, like Venus, the orbit is circular but, like Mars, the tilt is significant and thus, there is a pronounced latitudinal variability of the MIF as a function of the TAA, although the intensity of the peak only decreases by ≤20%. For Mars, however, the combination of an eccentric orbit with a nonzero orbital inclination produces both a latitudinal variability on the MIF peak as a function of the TAA and a decrease of magnitude of over 50% at the Martian equator during aphelion. It is important to note that the sharp discontinuities in Figure 8 are due to singularities in the collisional probability equation utilized in the model. At some specific position in the orbit, some particles will have significantly higher collisional probability with the planet (the planet and the particle are in a very favorable configuration). So when the position of the planet and the particle are close to some singularity, then the collision probability is much higher for random particles. This artificial effect is particularly present for the OCC and HTC populations at Venus because the number of particles released in our models from those comets that encounter the planet is much smaller as compared to JFC or MBA meteoroids.
Figure 8. Diurnally integrated MIF as a function of the planetographic latitude and TAA for each meteoroid population and planet studied in this work. Each contour line represents a 5% increase.
Download figure:
Standard image High-resolution image
An important point to raise is that our meteoroid models use the ecliptic plane as a reference plane rather than, for example, the invariable plane of the solar system. For instance, Cambioni & Malhotra (2018) reported that the main asteroid belt is inclined by about a degree relative to the ecliptic plane. If the sporadic meteoroid complex is symmetric about the invariable plane (or some other plane) rather than the ecliptic plane, it could significantly change the presented results. For instance, Mars has an orbital inclination of 185 relative to the ecliptic plane while the Earth has an inclination of 0°, and as shown in this work, this is one of the causes for the annual fluctuations on Mars. However, both planets are similarly inclined relative to the invariable plane (157 for Earth and 167 for Mars). If that would be the case, the Earth, for example, could experience similar fluctuations to Mars.
It is very likely that the sporadic meteoroid complex is warped or twisted and the plane of symmetry changes between the main belt and the innermost parts of the solar system. For example Nesvorný et al. (2006) treated the dust bands in the main belt as symmetric about the invariable plane when looking outward. On the other hand Nesvorný et al. (2010) assumed the fact that the Zodiacal Dust Cloud (ZDC) is symmetric with respect to the ecliptic latitude supported by IRAS measurements. Rowan-Robinson & May (2013) also show that the ecliptic plane works well as the symmetry plane for the ZDC. On the other hand between 1 and 0.3 au the plane of symmetry seems to be different from the invariable plane and to be similar to the orbital plane of Venus according to Leinert et al. (1980).
There are several reasons at this stage of the effort, however, why we feel confident with the assumption of ecliptic plane symmetry. Initially, the dynamical models were constrained with IRAS measurements, which showed that the ZDC is symmetric with respect to the ecliptic plane (Nesvorný et al. 2010, 2011a, 2011b). This is also supported by decades of observations using meteor radars, which have shown that, as viewed from Earth, the main sporadic sources are symmetric with respect the ecliptic plane (Figure 3; Campbell-Brown & Wiegert 2009; Janches et al. 2015). Later, the HTC dynamical model utilized here reported by Pokorný et al. (2014) was also able to reproduce radar observations assuming ecliptic symmetry. Furthermore, earlier semi-empirical models have also shown that a meteoroid environment that is symmetric with respect to the ecliptic plane reproduces the seasonality and geographical variability of meteor observations using high-power and large-aperture radars (Janches et al. 2006; Fentzke & Janches 2008; Schult et al. 2017). Finally, efforts to expand this work to other solar system bodies also seem to reproduce the variabilities observed on the lunar dust cloud (Janches et al. 2018; Pokorný et al. 2019) and the Ca exosphere at Mercury (Pokorný et al. 2018).
It is important to note that most of these works concern meteoroids with cometary origin that have enough energy to produce the reported observed and modeled phenomena, while Cambioni & Malhotra (2018) focused on the MBA population. Meteoroids originating from MBAs are too slow to produce ionization (and thus most of the observed radar meteors), ablate in the atmosphere, and produce metallic layers, or even produce a significant contribution to the dust plumes in airless bodies. We are certain that the ZDC is more complex that our model predicts. If the invariable plane is indeed the plane of symmetry for the cometary material too, it seems that Earth would have 20% variations between the invariable plane crossing and the highest/lowest point of the orbit (similar to what it is shown now for Mars, but for Mars the flux difference is the number further augmented by the heliocentric distance due to nonzero eccentricity). However, to investigate this in detail would require a significant amount of effort, and since so far all our assumptions hold quite well, we feel confident that for now assuming symmetry about the ecliptic plane is a reasonable assumption. We will certainly investigate this issue in future works.
4. Conclusions and Outlook for Future Work
We presented results from a comparative study of the MIF into terrestrial atmospheres. In particular, we have utilized dynamical models of meteoroids released by four main inner solar system orbital families (MBAs, JFCs, HTCs, and OCCs) to estimate the meteoroid environment around Venus, Earth, and Mars. These planets represent an interesting comparative set due to their difference and similarities in orbital and rotation motions as well as physical characteristics, all of which will manifest on the MIF. The MIF variability can produce directly observable features, such as thin dust clouds produced in airless bodies by impact debris (Pokorný et al. 2017, 2018, 2019; Janches et al. 2018). On atmospheres, however, most of these manifestations will be further modified by other effects such as atmospheric circulation and atmospheric chemistry (Plane et al. 2015). Nevertheless, understanding the MIF in detail has been shown to be critical at Earth when modeling global distribution of metallic meteoric atoms (Feng et al. 2013; Marsh et al. 2013; Plane et al. 2014).
According to our models, excursions from the ecliptic plane are the most important factor of MIF variance, producing decreases of up to 40% in the overall influx for Venus and Mars, although for Mars, the orbital eccentricity is also an important factor. This effect is pronounced for meteoroid populations concentrated around the ecliptic plane (i.e., MBAs and JFCs), which are believed to be the dominant source of organics and metals on the atmospheres of these planets (Carrillo-Sánchez et al. 2016, 2020). This MIF variability should be taken into consideration as the flux reduction due to orbital characteristics is of the same order of magnitude or larger than the error margin of the total flux estimated by Carrillo-Sánchez et al. (2020).
To quantify the potential impact of the present study, we combined our results of the relative but time-dependent flux with the estimates of the absolute but time-averaged flux provided by Carrillo-Sánchez et al. (2020) to assess how the total mass influx varies in different locations of the orbit of Mars and Venus. Carrillo-Sánchez et al. (2020) provided the overall mass influx of meteoroids as well as the contribution of each population for Earth, Mars, and Venus subject to the following assumptions. (1) According to lidar measurements, the global input of neutral Na and Fe measured at Earth (Gardner et al. 2014) is estimated to be 0.3 ± 0.1 t d−1 and 2.3 ± 1.1 t d−1, respectively. (2) The flux of cosmic spherules with diameters between 50 and 700 μm is estimated to be 4.4 ± 0.8 t d−1 (Taylor et al. 1998). Consequently, the authors determined a total mass input of 27.9 ± 8.1 t d−1 for Earth, 2.1 ± 1.0 t d−1 for Mars, and 31.0 ± 15.5 t d−1 for Venus, respectively. In all cases JFCs were found to be the main mass contributor with 70% for Earth, 52% for Mars, and 68% for Venus. Interestingly, the extrapolation of MAVEN/IUVS observations of Mg+ (Crismani et al. 2017) suggests an overall mass influx between 2 and 3 t d−1, which is in good agreement with the mass influx of Mars reported by Carrillo-Sánchez et al. (2020). In addition, Carrillo-Sánchez et al. (2016) assumed that the HTC is the unique mass contributor for fast particles, which means that HTCs represents all long-period cometary particles including OCCs. The reason for this is that both HTCs and OCCs ablate almost completely due to their high velocities, making it difficult to compute the relative contribution of each population to the global input using their methodology.
With the same fitting procedure used by Carrillo-Sánchez et al. (2020) but considering the variability reported in the present work, the resulting global mass influx in different positions with respect to the ecliptic plane at Mars and Venus are listed in Tables 4 and 5. The minimum mass input occurs at the maximum ecliptic altitude for Mars, with 1.63 t d−1, and at the minimum ecliptic altitude for Venus, with 25.16 t d−1. On the contrary, the maximum mass input occurs at perihelion for Mars, with 2.30 t d−1, and at the second crossing of the ecliptic for Venus, with 32.88 t d−1, respectively. In terms of ablation rates, Carrillo-Sanchez estimated fluxes of 0.65 t d−1 and 12.59 t d−1 at Mars and Venus atmospheres, respectively. According to the results shown in Tables 4 and 5, the overall ablation rates range between 0.51 and 0.73 t d−1 at Mars and 10.22 and 13.36 t d−1 for Venus. Hence, significant variability in the fluxes of ablated atoms can be expected. For example, the flux of Mg may vary from 0.068 to 0.096 t d−1 at Mars and 1.28 to 1.68 t d−1 at Venus.
Table 4. Global Mass Input from MBAs, JFCs, and HTCs at Venus for Different Positions with Respect to the Ecliptic Plane
| Position | TAA(°) | MBA (t d−1) | JFC(t d−1) | HTC(t d−1) | Total (t d−1) |
|---|---|---|---|---|---|
| Minimum | 214 | 15.89 | 1.39 | 7.88 | 25.16 |
| Maximum | 35 | 16.28 | 1.39 | 8.05 | 25.72 |
| First crossing | 125 | 22.56 | 2.10 | 8.16 | 32.82 |
| Perihelion | 0 | 17.27 | 1.52 | 8.11 | 26.89 |
| Aphelion | 180 | 17.07 | 1.52 | 7.88 | 26.47 |
| Second crossing | 306 | 22.56 | 2.10 | 8.22 | 32.88 |
Note. These results have been extrapolated from Carrillo-Sánchez et al. (2020) to quantify the variability of the overall fluxes in different positions of the orbit's planet.
Download table as: ASCIITypeset image
Table 5. Same as Table 4, but for the Case of Mars
| Position | TAA(°) | MBA (t d−1) | JFC(t d−1) | HTC(t d−1) | Total (t d−1) |
|---|---|---|---|---|---|
| Minimum | 342 | 0.18 | 1.18 | 0.74 | 2.10 |
| Maximum | 165 | 0.13 | 0.98 | 0.51 | 1.63 |
| First crossing | 73 | 0.21 | 1.37 | 0.68 | 2.27 |
| Perihelion | 0 | 0.18 | 1.37 | 0.74 | 2.30 |
| Aphelion | 180 | 0.16 | 0.98 | 0.51 | 1.65 |
| Second crossing | 253 | 1.18 | 0.18 | 0.57 | 1.93 |
Download table as: ASCIITypeset image
We are currently expanding this work in order to relate the MIF variability with the spatial and seasonal behavior of meteoric metallic layers in the Martian atmosphere. We intend to characterize the injection of metallic atoms (e.g., Na, Mg, Fe, etc.) by the continuous meteoroid influx on the Martian atmosphere and the subsequent chemistry and dynamical global transport of these species and validate them against NASA's MAVEN observations of meteoric ions in the middle atmosphere (Grebowsky et al. 2017; Crismani et al. 2018).
This work is supported by the NASA ISFM Planetary Science Program.
Footnotes
- 5
Note that there is a typo in the table in Pokorný et al. (2019) and the units for diameters appeared as mm instead of μm.