


ABSTRACT
We present the first images of the v = 1 and v = 2 J = 1 → 0 SiO maser lines taken with KaVA, i.e., the combined array of the Korean Very Long Baseline Interferometry (VLBI) Network and the VLBI Exploration of Radio Astrometry (VERA), toward the OH/IR star WX Psc. The combination of long and short antenna baselines enabled us to detect a large number of maser spots, which exhibit a typical ring-like structure in both the v = 1 and v = 2 J = 1 → 0 SiO masers as those that have been found in previous VLBI observational results of WX Psc. The relative alignment of the v = 1 and v = 2 SiO maser spots are precisely derived from astrometric analysis, due to the absolute coordinates of the reference maser spot that were well determined in an independent astrometric observation with VERA. The superposition of the v = 1 and v = 2 maser spot maps shows a good spatial correlation between the v = 1 and v = 2 SiO maser features. Nevertheless, it is also shown that the v = 2 SiO maser spot is distributed in an inner region compared to the v = 1 SiO maser by about 0.5 mas on average. These results provide good support for the recent theoretical studies of the SiO maser pumping, in which both the collisional and the radiative pumping predict the strong spatial correlation and the small spatial discrepancy between the v = 1 and v = 2 SiO maser.
Export citation and abstract BibTeX RIS
1. INTRODUCTION
OH/IR stars are evolved oxygen-rich asymptotic giant branch (AGB) stars with extremely thick circumstellar envelopes (CSEs) of gas and dust, which absorb the optical radiation coming from the central star and re-emit it in the infrared region (Habing 1996). Very high mass-loss rates ( ) of OH/IR stars are characteristics of the superwind phase (Iben & Renzini 1983) that occurs at the end of the AGB evolution (Vassiliadis & Wood 1993). Therefore, the observation of OH/IR stars at infrared or radio wavelengths is very important to investigate the physical environments of the CSEs and to study the stellar evolution toward a post-AGB or a planetary nebular phase.
WX Psc (IRC+10011) is a long-period variable OH/IR star at a distance of 590 pc (Le Sidaner & Le Bertre 1996) with a mean infrared variability period of 660 days (Le Bertre 1993), and a high mass-loss rate of 1.3 × 10⁻⁵ M⊙ yr−1 (Ladjal et al. 2010). This star as an oxygen-rich star is one of the strong emitters of SiO, H2O, and OH masers and has been mapped using the Very Long Baseline Interferometry (VLBI). Desmurs et al. (2000) and Soria-Ruiz et al. (2004, 2005) reported that both the v = 1 and v = 2 J = 1 → 0 SiO masers around WX Psc show a ring-like structure, and the v = 2 SiO maser arises from a slightly smaller ring than that of the v = 1 SiO maser. Considering this relative spatial shift between the SiO maser emissions of two transitions, they argued a radiative pumping of the SiO masers rather than a collisional pumping. In the outer region, WX Psc is recognized as an example of bipolar outflow source, which appears at a late stage in the evolution of AGB winds but still at the early stage of the outflow ignition (Vinković et al. 2004). Inomata et al. (2007) also found a collimated bipolar outflow feature in this star from the results of the 22 GHz H2O maser observed with the Japanese VLBI Network.
Recently, the Korean VLBI Network (KVN15 ) has started scientific observations (Lee et al. 2014). KVN consists of three 21 m radio telescopes and is equipped with four frequency bands of H2O 22 GHz and SiO 43/86/129 GHz. The KVN is also operational in combination with the Japanese VLBI Exploration of Radio Astrometry (VERA; Kobayashi et al. 2003); this new combined array called "KaVA" (KVN and VERA array) has also started scientific observations. The performance evaluation tests of KaVA have been well processed, and early scientific results were published in the fields of star-forming regions and active galactic nuclei (Matsumoto et al. 2014; Niinuma et al. 2014). VLBI observations using KaVA as a scientific feasibility test toward evolved stars have been carried out since 2012. Here we present for the first time the results of the first SiO maser imaging with KaVA toward WX Psc.
We describe the KaVA observations and the procedures of data reduction in Section 2, then present the results and discussion in Section 3 and in Section 4, respectively.
2. OBSERVATIONS AND DATA REDUCTION
We carried out VLBI observations of the v = 1 and v = 2 J = 1 → 0 SiO maser lines (at rest frequencies of 43.122079 GHz and 42.820582 GHz, respectively) toward WX Psc on 2012 April 1 using KaVA. This epoch was estimated to be around 0.7 in stellar light curve from near-infrared observations (Le Bertre 1993; Pardo et al. 2004). Figure 1 presents the peak antenna temperature variation of the v = 1 and v = 2 J = 1 → 0 SiO masers of WX Psc, which was monitored with the KVN single-dish antennas from 2009 June to 2012 July (S. H. Cho et al. 2016, in preparation).
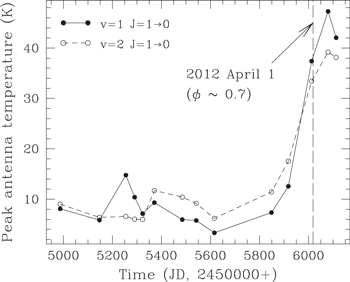
Figure 1. Intensity variability of the v = 1 and v = 2 J = 1 → 0 SiO masers around WX Psc. Filled circles and open circles represent the single-dish observations of KVN, and the vertical dashed line corresponds to the time of this KaVA observation. The conversion factor for KVN is about 12 Jy K−1 at 43 GHz.
Download figure:
Standard image High-resolution imageThe target source, WX Psc, was observed with 20 minute long scans during 8 hr bracketed by scans on a continuum delay calibrator, 4C01.02 (J0108+0135), observed for 3 minutes. A fringe-finder calibrator source, BL Lac (J2202+4216), was also observed every 1.5 hr. This KaVA observation yielded the synthesized beam of 0.62 × 0.56 milliarcsecond (mas) with a position angle of 18 3 at 43 GHz for the uniform weighting in the imaging process. The system noise temperature of Ishigaki antenna of VERA was very high, up to 8000 K during 3 hr, and those of the Yonsei and Tamna antennas of KVN were also very high, up to 4000 K during 2 hr.
In all stations, the observed signals were converted to lower frequency ones and filtered into 16 base band channels (BBCs), each with a bandwidth of 16 MHz. The v = 1 and v = 2 maser lines were recorded simultaneously but in the different BBCs. Of the 16 BBCs, including the maser lines, two were recorded onto SONY DIR 1000 tapes at a rate of 128 Mbits s−1. The observed data was correlated with the Mitaka FX correlator to produce data of 512 spectral channels, yielding a velocity resolution of 0.2 km s−1.
All data reduction was done using the Astronomical Image Processing System (AIPS) package according to the standard procedures for the imaging of the line data at each v = 1 and v = 2 transition. First, the visibility amplitudes for antenna gains and bandpass characteristics of BBCs were calibrated, and then instrumental phase offsets and group delay residuals were calculated by using the scans on the continuum sources. In order to correct the phase shifts due to the errors of antenna coordinates of KVN used in the data correlation, we performed fringe phase correction using the more accurate antenna coordinates of KVN, which was measured in 2014 January. This correction was performed before the tasks related to the phase correction and enhanced the cross power flux density by a factor of two compared with that without the correction.
The phase-referencing technique for the absolute astrometry was not applied in this observation, so we used the astrometric results of Imai et al. (2012) for WX Psc to calculate the position offset between the v = 1 and v = 2 SiO maser. We used the same phase tracking center and the same phase reference channel with those of Imai et al. (2012), who conducted their observations one week before our observations, so we could use their results in our works. The position offset between the phase reference channel and the phase tracking center has been accurately determined from VERA astrometry observations (see Table 2 of Imai et al. 2012). Therefore, we carried out the fringe fitting and self-calibration on a compact and bright maser line channel (7.4 km s−1 in LSR velocity) of the v = 2 SiO maser data set, which is the same velocity channel used as the phase reference maser spot in Imai et al. (2012). Then, the calibration solutions of the v = 2 SiO maser data set were transferred to the v = 1 SiO maser data set and applied to all velocity channels of the v = 1 SiO maser data set. Before transferring the solutions of the v = 2 SiO maser data set, the phase correction related to the position drift of the v = 1 SiO maser spots with respect to the v = 2 SiO maser spots was applied, which was done by the AIPS task CLCOR. The position drift was calculated from the position offset of the phase reference channel of the v = 2 SiO maser with respect to the phase tracking center and the frequency difference between two SiO maser transitions (Gwinn et al. 1992; Imai et al. 2012). We finally obtained the astrometric alignment of the v = 1 and v = 2 SiO maser spots, but found that the image quality was poor compared with the self-calibrated images of the individual maser line using other bright spectral channels. Therefore, we used an another phase reference channel (9.1 km s−1) of the v = 2 SiO maser data set, which gave better fringe solutions compared with the phase reference channel used before. We carried out the same procedures as described above considering the position offset between the old phase reference channel and the new one to make sure the astrometric information was conserved. These additional procedures enhanced the image quality and did not change the astrometric alignment between the v = 1 and v = 2 SiO maser spots.
To identify the individual SiO maser spots which form the maser feature, we used the selection criteria used in the previous works (Imai et al. 2002; Chen et al. 2006). First, the position and the size of each maser spot were determined by fitting the observed brightness distribution to the two-dimensional Gaussian function. The cutoff signal-to-noise ratio (S/N) of 5 for each velocity channel of the image cube was used after several trial tests with different cutoff S/N values from 3 to 7, which were performed to determine the best result, i.e., not only to avoid the selection of side lobes but also to keep as many maser spot candidates as possible. This procedure was implemented by the AIPS task SAD. Then we used the selection rules that the maser spots belonging to the same feature should appear in at least three consecutive velocity channels and be located at nearly the same position, i.e., lie within a beam size. By applying these criteria, we could select the real maser spots from the maser candidates determined from the Gaussian fitting, which show peak-like curves in the intensity-velocity profiles.
3. RESULTS
Figure 2 shows the total power spectra and the cross power spectra recovered in VLBI images of the v = 1 and v = 2 J = 1 → 0 SiO masers observed in WX Psc. The total power spectra were taken at the Iriki VERA telescope used as the reference antenna in our data reduction. The recovered flux density is determined from the sum of those of the maser spots fitted to the image cube. About 33% and 17% of the v = 1 and v = 2 J = 1 → 0 SiO maser emissions were recovered from KaVA in imaging process, respectively. This suggests that the SiO masers around WX Psc have the extended components that are resolved out in the high spatial resolution of KaVA. As shown in Figure 2, the recovered flux density obtained from VERA alone is much lower than that of KaVA, which implies that the short baselines, including KVN, dominate the detection of the extended structures.
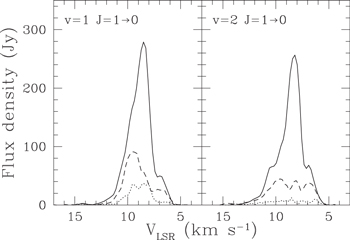
Figure 2. Total power (solid lines), recovered flux of KaVA (dashed lines), and recovered flux of VERA (dotted lines) spectra of the v = 1 and v = 2 J = 1 → 0 SiO masers observed in WX Psc.
Download figure:
Standard image High-resolution imageHere we can compare our results with those in Imai et al. (2012), who observed the same maser source one week before our observations with the combination of VERA telescopes and the 45 m telescope of the Nobeyama Radio Observatory. Imai et al. (2012) obtained the cross power spectra by integrating all the visibilities in full exposure (2.6 hr) in order to detect the v = 3 SiO maser that is much fainter than the v = 2 SiO maser. The long exposure may cause some coherence loss even if visibility calibration was made. Nevertheless, it is a result intrinsic to the maser source that the correlated flux density found in the our results was higher than that in Imai et al. (2012), which is consistent with our results, i.e., lower recovered flux density of VERA than that of KaVA, as shown in Figure 2.
Figure 3 shows the integrated intensity map of the v = 1 and v = 2 SiO masers, in which the clumpy structure and the typical ring-like structure of SiO maser is clearly seen. Figure 3 also shows that the distributions of the v = 1 and the v = 2 SiO masers are very similar to each other and most of the v = 1 SiO maser emission region is spatially overlapped with the v = 2 SiO maser emission region while several v = 2 SiO maser regions show no spatial coincidence with the v = 1 SiO maser. In order to compare the spatial distributions of the v = 1 and v = 2 J = 1 → 0 SiO masers, as shown in Figure 3, we superimpose the v = 1 SiO maser map onto the v = 2 map by using the relative alignment of all maser spots with respect to the phase reference spot of the v = 2 SiO maser, which is derived from the astrometric analysis as described in previous section. The uncertainty in the position offset measured between the v = 1 and v = 2 SiO maser maps is known to be proportional to the estimated uncertainty of the position offset of the phase reference maser spot from the phase tracking center and the frequency difference between the two maser lines (Gwinn et al. 1992). In the present observation, in which the absolute coordinates can be cited from Imai et al. (2012), the uncertainty in the map registration of the v = 1 and v = 2 SiO maser lines is less than 45 μas for about 300 MHz frequency separation, which is small enough to investigate the difference between the spatial distributions of the SiO maser spots of two transitions.
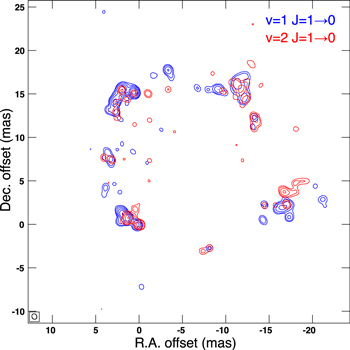
Figure 3. Integrated intensity map of the SiO masers around WX Psc. The blue contour represents the v = 1 J = 1 → 0 SiO maser, and the red contour represents the v = 2 J = 1 → 0 SiO maser. The peak flux is 16.01 Jy beam−1 km s−1 for the v = 1 and 5.50 Jy beam−1 km s−1 for the v = 2 SiO maser. The rms noise levels of the v = 1 and v = 2 SiO maser maps are 16.0 mJy beam−1 km s−1 and 15.4 mJy beam−1 km s−1, respectively. The contour levels are 0.24, 0.48, 1.12, 2.56, 5.12, and 10.24 Jy beam−1 km s−1 for both SiO maser lines.
Download figure:
Standard image High-resolution imageFigure 4 shows the velocity–position distributions of the v = 1 and v = 2 J = 1 → 0 SiO masers. The v = 1 and v = 2 maps are composed of 143 and 128 maser spots which are determined from the maser spot registration described in the previous section. The velocity range of the maser spots is about 10 km s−1, and the typical ring-like structures of the v = 1 and v = 2 J = 1 → 0 SiO masers are also clearly shown. The radii of the v = 1 and v = 2 SiO maser rings are 10.39 ± 0.18 mas and 9.87 ± 0.18 mas, respectively, which are determined from the least squares circle fit for the distribution of the SiO maser spots. Some maser spots are distributed along the radial direction in our results. These spoke-like features are clearly shown in the northwestern part of both SiO maser rings, which are marked A and B in the upper panels of Figure 4. The spoke-like features A and B are divided into two distinct spoke-like features, respectively, as shown in the lower panels of Figure 4. In the spoke-like features of A1, A2, B1, and B2, the line of sight velocities of the maser spots increase along the outward radial direction, indicating outward deceleration of the maser clumps. These outflow motions are approaching us as shown in the blueshifted maser spots with respect to the stellar velocity of 8.5 km s−1.
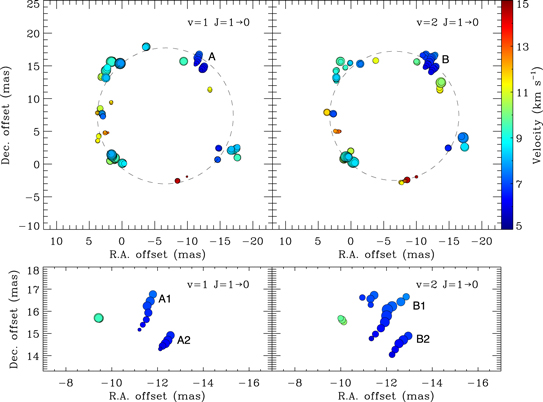
Figure 4. Upper panels: velocity–position maps of the SiO masers around WX Psc. Color represents the velocity, and the filled circle represents the individual maser spot of which the area is proportional to the flux density logarithmically. The size of the largest filled circle in the left panel is adjusted to be equal to that of the right panel for convenience. The dashed ring of each panel is determined from the circular fitting of the distributions of the maser spots. Lower panels: close up plots for the northwestern parts (marked A and B) of the upper panels. The feature denoted as A is divided into two components, A1 and A2, and the feature B is also divided into two components, B1 and B2.
Download figure:
Standard image High-resolution imageIn order to describe the spoke-like features, Matsumoto et al. (2008) proposed the ballistic orbit model which describes the continuously ejected material suffering deceleration due to the stellar gravity. Zhang et al. (2012) also showed that most of the spoke-like features of VY CMa point back to the central star supporting the results of Matsumoto et al. (2008), and this tendency is also clearly seen in our results. We used the ballistic orbit model of Matsumoto et al. (2008) to describe the distance–velocity relation of the spoke-like features. The relation between the radial velocity,  and the projected distance from the star, r, is written as
where  , G is the gravitational constant, M is the stellar mass, i is the inclination angle of the maser feature projected onto the sky plane, and r0 is the distance of the apocenter, where the radial velocity becomes zero, to the center of the star.
Figure 5 shows the observed spoke-like features fitted with the ballistic orbit described as Equation (1). First, we calculated the parameters of M, r0, and i by using the Nelder–Mead algorithm (Nelder & Mead 1965), which is just a simple algorithm to minimize a function of n parameters, for the spoke-like features of A1, A2, B1, and B2, respectively, in order to find the stellar mass that should be fixed above all. The determined parameters are shown in the upper panels of Figure 5, in which we can see that the parameter values of the spoke-like features are very similar to each other except those of the spoke-like feature A2. The mean value of the stellar masses fitted to individual spoke-like features is about 5.8 M⊙, which is used in the following calculations of the parameters of r0 and i. Recent works of Justtanont et al. (2015) show that the extreme OH/IR stars are intermediate-mass stars with masses above 5 M⊙; thus, the calculated stellar mass in our results seems to be reasonable. Next, for the determined stellar mass, we recalculated the parameters of r0 and i for each spoke-like feature by using the curve fitting method with a simple nonlinear least squares algorithm. The lower panels of the Figure 5 show that the individual spoke-like features are well fitted to the ballistic orbits with their own parameters. The parameters of r0 and i of the feature A1 are very similar to those of the features B1 and B2, but slightly different from those of the feature A2.
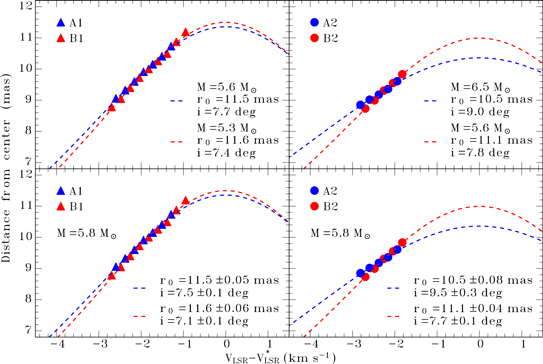
Figure 5. Fitted ballistic orbit (dashed lines) for the spoke-like features (markers) denoted as A1, A2, B1, and B2 in the lower panels of the velocity–position map. Blue represents the v = 1 J = 1 → 0 SiO maser, and red represents the v = 2 J = 1 → 0 SiO maser. Fitted parameters and their uncertainties are shown in the bottom right corner. Upper panels: Parameters of M, r0, and i (see the text for definitions) are determined from the Nelder–Mead algorithm at the same time for each spoke-like feature. Lower panels: Parameters of r0 and i are determined from a simple nonlinear least squares curve fitting method using the average stellar mass, 5.8 M⊙, obtained from the upper panels.
Download figure:
Standard image High-resolution imageIn order to easily compare the average size of the ring structure of each SiO maser, as shown in Figure 6, we superimpose two spot maps of the upper panels of Figure 4. The center positions of two dashed rings, which are derived from the least squares circle fit, are different from each other, so the position of the v = 2 SiO maser map is shifted by the amount of the offsets between the different center positions to align the centers of two rings. The offsets of the center position of the v = 2 SiO maser ring with respect to that of the v = 1 SiO maser ring are +0.0496 mas in the R.A. direction and −0.1187 mas in the decl. direction, respectively. Figure 6 is composed to conveniently show the different average size of the ring-like structure of each SiO maser, and the shifted position of the v = 2 SiO maser map in Figure 6 is not used in any analysis in this work. This underlines the importance of bona fide astrometric alignment, rather than ad hoc methods, which can give misleading results. Figure 6 clearly shows that the v = 2 SiO maser ring is slightly smaller than the v = 1 SiO maser ring by about 0.5 mas.
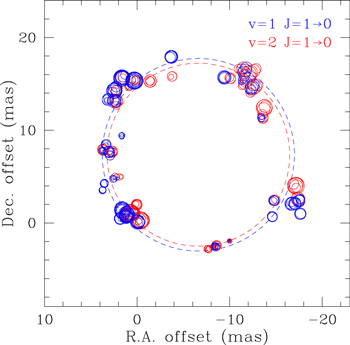
Figure 6. Superimposed map of SiO maser spots around WX Psc. Blue represents the v = 1 J = 1 → 0 SiO maser, and red represents the v = 2 J = 1 → 0 SiO maser. The average size of the ring-like structure of each SiO maser is represented by the blue and red dashed rings, respectively. The position of the v = 2 SiO maser map is shifted by an amount of (−0.0496, +0.1187) mas to align the centers of the two dashed rings (see the text).
Download figure:
Standard image High-resolution imageTo investigate the correlation between the spatial distributions of the v = 1 and v = 2 SiO maser spots quantitatively, we have made an intensity relative distance diagram (Miyoshi et al. 1994), as shown in the upper panels of Figure 7, and calculated the overlapping area for each pair of the closest v = 1 and v = 2 SiO maser spots, as shown in the lower panels of Figure 7. The upper panels show the relation between the flux density of the v = 1 SiO maser spots and the angular distance to the nearest v = 2 SiO maser spot at the same velocity. In our results, 58% of the total v = 1 SiO maser emission (563.7 Jy km s−1) comes from within the 0.6 mas regions around the v = 2 SiO maser spots. The calculations of the intersection of two overlapped SiO maser spots are somewhat difficult due to the elliptical shapes of individual maser spots. To simplify the problem, the SiO maser spots were dealt with as circles of which the radii are half of the minor axes of the elliptical maser spots. In the lower panels of Figure 7, the y axis represents the fraction of the overlapping area to the area of each SiO maser spot used in the upper panel. Among 143 spots of the v = 1 SiO maser, 77 spots (∼54%) are spatially overlapped with the v = 2 SiO maser spots. The ratio of the total overlapping area to the total area of the v = 1 SiO maser spots is about 60%. The right panels are the close up plots of the left panels for the angular distance smaller than 1 mas, in which the most blueshifted (<7 km s−1) and redshifted (>13 km s−1) spots are overplotted to avoid blocking by the rest of the maser spots. The lower right panel of Figure 7 shows that all of the most blueshifted and most redshifted spots of the v = 1 SiO maser are spatially overlapped with those of the v = 2 SiO maser spots within an angular distance smaller than 0.8 mas.
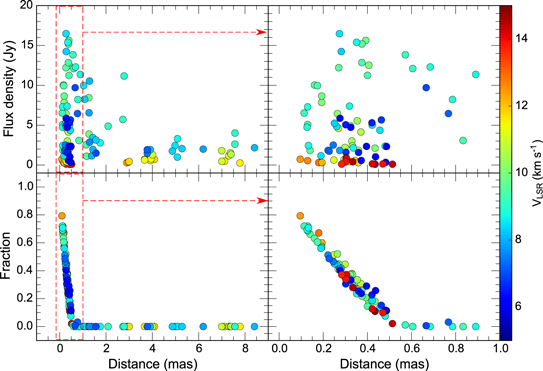
Figure 7. Upper panels: flux density of the individual v = 1 J = 1 → 0 SiO maser spot against the angular distance to the nearest v = 2 J = 1 → 0 SiO maser spot with the same velocity. Lower panels: fraction of the overlapping area of the closest v = 1 and v = 2 SiO maser spots used in the upper plot against the angular separation between those spots. Right panels: close up plots of the red dashed boxes of the left panels for a distance smaller than 1 mas. The most blueshifted (<7 km s−1) and redshifted (>13 km s−1) spots are overplotted on the rest of the spots. Color represents the velocity of the SiO maser spots shown in the all panels.
Download figure:
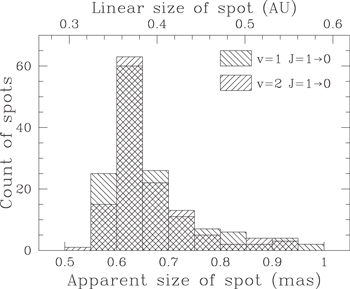
Standard image High-resolution imageFigure 8 shows the histograms of the spot sizes which are calculated from the two-dimensional Gaussian fitting for the brightness distribution of each maser spot. In Figure 8, the lower x axis represents the angular size of the SiO maser spots, and the upper x axis represents the linear size of the SiO maser spots at a distance of 590 pc (Le Sidaner & Le Bertre 1996). The distribution of the spot sizes of the v = 1 SiO maser is very similar to that of the v = 2 SiO maser, and this implies strong physical links between these two SiO masers. A typical apparent size of the maser spot is 0.66 mas in both the v = 1 and v = 2 masers, corresponding to 0.39 AU at a distance of 590 pc, which is larger than the size of the VLBI synthesized beam of 0.59 mas (see Table 1). The typical size of the SiO maser spot at 43 GHz in the late-type stars is known to be in the range of 1012–1013 cm (Colomer et al. 1992; Chen et al. 2006), so our results are consistent with previous results.
Figure 8. Histograms of the spot sizes of the v = 1 and v = 2 J = 1 → 0 SiO masers around WX Psc. The lower x axis is the angular size, and the upper x axis is the linear size.
Download figure:
Standard image High-resolution image
Table 1. SiO Maser Spots around WX Psc
| Average | Average | Median | Median | ||
|---|---|---|---|---|---|
| Tra | Nsb | (mas) | (au) | (mas) | (au) |
| v = 1 | 143 | 0.664 | 0.392 | 0.625 | 0.369 |
| v = 2 | 128 | 0.660 | 0.389 | 0.631 | 0.372 |
Notes.
aSiO maser transition. bNumber of maser spots.Download table as: ASCIITypeset image
4. DISCUSSION
As mentioned in Section 3, the low fraction of the recovered flux in the VLBI image implies the presence of an extended structure of SiO masers observed in WX Psc, of which the size is too large to be sampled by the shortest baseline. As shown in Table 1 and Figure 8, the mean spot size of 0.66 mas is slightly larger than the synthesized beam of 0.59 mas, and most maser spots have a larger apparent size than the beam size. Therefore, the missing flux, 67% for v = 1 and 83% for v = 2, in our results is mainly due to the extended components of SiO masers around WX Psc, which are resolved out in the high spatial resolution of KaVA. The fraction of the cross power recovered in our VLBI image, 33% for v = 1 and 17% for v = 2, is much lower than the 75% of Soria-Ruiz et al. (2005) and is similar to the 25% of Desmurs et al. (2000). The size of the restoring beam of 0.62 × 0.56 mas in our results is slightly larger than the 0.7 × 0.2 mas of Desmurs et al. (2000) and smaller than the 0.8 × 0.5 mas of Soria-Ruiz et al. (2005) at 43 GHz. As mentioned in previous section, we use the uniform weighting in the imaging process to reduce the restoring beam size and to avoid strong side lobes. The restoring beam size for the natural weighting is 0.82 × 0.69 mas, which is mainly affected by the short baselines including KVN. The small restoring beam of the uniform weighting reduces the recovered flux density by about 20% compared with the natural weighting in our results. This implies that the VLBI map of SiO masers around WX Psc is very sensitive to the restoring beam of each VLBI system. Interestingly, the fraction of the recovered flux of the v = 1 SiO maser is about half of that of the v = 2 SiO maser in the results of Desmurs et al. (2000), and vice versa in our results. The stellar phase is about 0.7 in our results, about 0.8 in Desmurs et al. (2000), and about 0.5 in Soria-Ruiz et al. (2005) in stellar light curve estimated from near-infrared observations (Le Bertre 1993; Pardo et al. 2004). Therefore, we can infer that the size of the SiO maser spot may vary with the stellar pulsation period and that it also depends on the maser transitions. However, at this time, it is difficult to determine whether the typical maser spot size is really related to the light curve because the observed maser spot size is strongly affected by the synthesized beam and the number of the samples for WX Psc is not enough.
However, as mentioned in Section 2, the three antennas of the KaVA, Ishigaki, Yonsei and Tamna stations showed very high system noise temperatures during 5 hr in this observation. This causes some calibration solutions for these three antennas to fail in the procedures of our data reduction. This means that the contributions from the short baselines, particularly Yonsei and Tamna, are missing, and these are sensitive to the extended structures of SiO maser. As a result, the recovered flux density of this observation could be lower than expected. Furthermore, the limited coherence in the cross-correlation due to the remaining errors of KVN antenna positions, after the post-correction with AIPS, could also cause the weak recovered flux in our results.
We succeeded in the precise registration of maser maps by comparison to similar contemporary observations, and its uncertainty is small enough to distinguish the position difference between the v = 1 and v = 2 SiO maser spots. As shown in Figure 6, the average ring radius of the v = 2 SiO maser is smaller than that of the v = 1 SiO maser by 0.5 mas for a resolution beam of 0.62 × 0.56 mas at 43 GHz. This value is not so different from the results of previous observations; 0.6 mas for a restoring beam of 0.7 × 0.2 mas in Desmurs et al. (2000), and 1.0 mas for a restoring beam of 0.8 × 0.5 mas in Soria-Ruiz et al. (2005). All results, observed at different stellar phases, are consistent with the fact that the v = 2 SiO maser occurs at a slightly inner region with respect to the v = 1 SiO maser, on average. These small spatial discrepancies between the SiO masers were thought to be consequent on the line overlaps in Desmurs et al. (2000) and Soria-Ruiz et al. (2005). However, it is difficult to argue the pumping mechanism of the SiO masers only based on their average ring sizes, and it is necessary to investigate the spatial coincidence between the individual maser spots.
In Figure 7, we show that 58% of the v = 1 SiO maser emission comes from within the 0.6 mas regions around the v = 2 SiO maser spots, which is comparable to the fractions presented by Miyoshi et al. (1994); 73% for VY CMa and 25% for W Hya. Considering the much higher angular resolution of our observations compared with that (3 × 12 mas) of Miyoshi et al. (1994), we can argue that the v = 1 SiO maser emission is truly coupled with the v = 2 SiO maser. Furthermore, we also show that about 54% of the v = 1 SiO maser spots are spatially overlapped with the v = 2 SiO maser spots in the lower panel of Figure 7. In the calculations of overlapping area between the SiO maser spots, each maser spot was dealt with as a circle of which the radius is half of the minor axis of an elliptical maser spot. This means that the overlapping fraction is underestimated, i.e., at least 54% of the v = 1 SiO maser spots are spatially overlapped with the v = 2 SiO maser spots. The average eccentricity of the elliptical shapes of the v = 1 and v = 2 SiO maser spots belonging to the overlapping pairs is about 0.52 and 0.56, respectively, and the average spot sizes are almost the same within a difference of 1.2%. This indicates that the assumption of the circular shape for the maser spots does not cause a critical bias in our calculations. However, it is still difficult to determine whether the v = 1 and v = 2 SiO maser emission regions are really overlapped with each other and how much these regions are overlaped, because the simple Gaussian fitting for the observed brightness distribution of an individual maser spot has a large uncertainty depending on the size of the synthesized beam. On the other hand, the characteristic spot size of the v = 1 and v = 2 SiO maser measured in this observation is consistent with the typical spot size measured in previous studies (Colomer et al. 1992; Chen et al. 2006), and the restoring beam is smaller than the typical spot size. Therefore, the calculated spot size of the SiO masers in this study can be close to intrinsic size, and KaVA can be used to study the spatial correlation between the SiO masers.
As shown in Figures 3, 4 and 6, there are two pairs of the distinct spoke-like features of the v = 1 and v = 2 J = 1 → 0 SiO masers. Figure 5 also shows clearly the kinematic characteristics of these spoke-like features. The most distinct spoke-like features A1 and B1 have almost the same fitted parameters of r0 and i, while the spoke-like features A2 and B2 have somewhat different values. The projected spatial intervals between the individual spots of the spoke-like feature A2 are smaller than those of other spoke-like features, as clearly shown in the lower panels of Figure 4, thus the inclination angle of the spoke-like feature A2 is fitted to a larger value than those of other spoke-like features. Considering the well matched parameter values of the spoke-like features A1 and B1, we suppose that the deviative characteristics of the spoke-like feature A2, compared with other features, are not intrinsic but originated from the insufficient number of spots that are well fitted.
Two distinct spoke-like features of each SiO maser consist of the most blueshifted maser spots, which are spatially overlapped with each other within an angular distance of 0.8 mas, as shown in the lower right panel of the Figure 7. The most blueshifted and the most redshifted clumps are known to be affected by larger shock velocities compared with other regions, and this implies the spoke-like features are mainly driven by the shock propagation caused by stellar pulsation. In Figures 3, 4 and 6, the v = 2 SiO maser spots are thought to be located at the slightly upper stream of the v = 1 SiO maser spots in the pair of the spoke-like features A1 and B1 because the calculated inclination angles of both features are almost the same. Consequently, our results strongly imply that the spoke-like features of the v = 1 and v = 2 J = 1 → 0 SiO masers are kinematically coupled. Nevertheless, with only this result, we cannot argue which pumping mechanism is dominant in the v = 1 and v = 2 J = 1 → 0 SiO masers because both the radiative and the collisional pumping models predict the strong physical links between these SiO masers (Humphreys et al. 2002; Soria-Ruiz et al. 2004; Gray et al. 2009; Richter et al. 2013; Desmurs et al. 2014).
In addition, Su et al. (2012) reported that the v = 1 and v = 2 J = 1 → 0 SiO masers show significant variability in the intensity, spatial distribution, and the number of spots, depending on the stellar phase of VX Sgr. The relative spatial distribution of the v = 1 and v = 2 SiO masers also varies with the stellar phase in their results. Based on their results, they argued that the dominant pumping mechanism of the SiO masers closely depends on the stellar phase. Therefore, it is unreasonable to argue the general pumping mechanism of the SiO masers based on the results of the single epoch observation, and multi-epoch observations are very important to investigate the SiO maser variability which is closely related with the physical environments of the CSE and the pumping mechanism. We plan to conduct the intensive monitoring observations toward the evolved stars using KaVA.
5. SUMMARY
We report the first KaVA VLBI observational results of the v = 1 and v = 2 J = 1 → 0 SiO maser lines toward the OH/IR star WX Psc. The typical ring-like and clumpy structures of both the v = 1 and v = 2 J = 1 → 0 SiO maser emissions are clearly detected in this observation. The radii of the v = 1 and v = 2 J = 1 → 0 SiO maser rings are 10.39 ± 0.18 mas and 9.87 ± 0.18 mas, respectively, which shows the v = 2 SiO maser occurs at the slightly inner region with respect to the v = 1 SiO maser on average. A typical apparent size of the maser spot is measured to be about 0.66 mas in both the v = 1 and v = 2 masers (corresponding to 0.39 au at 590 pc distance), which agree with the previous results.
The spatial distribution of the v = 1 SiO maser is compared with that of the v = 2 SiO maser through the superposition of the v = 1 and v = 2 SiO maser maps obtained from astrometric analysis with high accuracy. More than 54% of the v = 1 SiO maser spots are spatially overlapped with the v = 2 SiO maser spots, which implies that the v = 1 SiO maser emission is spatially coupled with the v = 2 SiO maser. At the same time, several regions of the v = 2 SiO maser show no spatial coincidence with the v = 1 SiO maser, indicating different physical parameters of their regions from those of the overlaped regions, which are closely related with the masing condition. Our results also show that the distinct spoke-like features of the v = 1 SiO maser are kinematically linked to those of the v = 2 SiO maser. Therefore, we can infer that the v = 1 SiO maser emission is strongly coupled to the v = 2 SiO maser emission based on our results, and this can be good evidence for studying the masing conditions in CSEs. However, there is still a large uncertainty in the estimation of the individual maser spot size due to its large dependency on the synthesized beam. In conclusion, we confirm that KaVA is very promising to investigate the physical environments of the CSE of the evolved stars.
We are grateful to all staff members in KVN and VERA who helped to operate the array and to correlate the data. The KVN is a facility operated by KASI (Korea Astronomy and Space Science Institute). VERA is a facility operated by NAOJ (National Astronomical Observatory of Japan) in collaboration with Japanese universities.
Facilities: VERA - .