Initiation of voluntary movements at free will and ongoing 0.1-Hz BOLD oscillations in the insula—a pilot study
 Gert Pfurtscheller1,2*
  Alexandre Andrade3
  Karl Koschutnig2,4
  Clemens Brunner1,2
  Fernando Lopes da Silva5
- 1Institute for Knowledge Discovery (BCI Lab), Graz University of Technology, Graz, Austria
- 2BioTechMed, Graz, Austria
- 3Institute of Biophysics and Biomedical Engineering, Faculty of Sciences, University of Lisbon, Lisboa, Portugal
- 4Institute of Psychology, University of Graz, Graz, Austria
- 5Center for NeuroScience, Swammerdam Institute for Life Sciences, University of Amsterdam, Amsterdam, Netherlands
Recently we hypothesized that the intention to initiate a voluntary movement at free will may be related to the dynamics of hemodynamic variables, which may be supported by the intertwining of networks for the timing of voluntary movements and the control of cardiovascular variables in the insula. In the present study voluntary movements of 3 healthy subjects were analyzed using fMRI scans at 1.83-s intervals along with the time course of slow hemodynamic changes in sensorimotor networks. For the analyses of BOLD time courses the Wavelet transform coherence (WTC) and calculation of phase-locking values were used. Analyzed was the frequency band between 0.07 and 0.13 Hz in the supplementary motor area (SMA) and insula, two widely separated regions co-active in motor behavior. BOLD signals displayed slow fluctuations, concentrated around 0.1 Hz whereby the intrinsic oscillations in the insula preceded those in the SMA by 0.5–1 s. These preliminary results suggest that slow hemodynamic changes in SMA and insula may condition the initiation of a voluntary movement at free will.
Introduction
How voluntary movements originate is a classic problem in Neuroscience. It is generally assumed that voluntary movements result from neuronal activity in premotor and motor cortical areas that precedes the conscious decision to move. Starting from analyzing the well-known Libet et al. (1983) experiment Brass and Haggard (2008) distinguished three aspects of a voluntary movement: “what” to move, “when” to move, and ultimately “whether” to move or not. Studies in which subjects freely choose between moving the right or left hand showed activation of medial frontal cortex. Brass and Haggard (2010) concluded that premotor and motor cortical areas generate action plans for a movement to occur, while the parietal cortex monitors how these plans are realized. In addition to the role of the medial frontal cortex with the executive motor area (SMA) and higher-order motor area (anterior cingulate cortex, ACC) there is also evidence that the anterior insular cortex (AIC) is involved. The AIC is not only a simple visceral sensory region but also responsible for body awareness and “gut feeling” (Craig, 2009). Both ACC and AIC are co-active in so many behaviors and also during cognition, pain and emotions (Yarkoni et al., 2011). Be as it may, it is noteworthy to underline that the AIC, particularly the rostral-frontal insular cortex (Cauda et al., 2011), besides its putative role in the initiation of movement, i.e., the “when” component, not only has a major role in the integration of visceral sensory information arising from baroreceptors and chemoreceptors within the cardiovascular system but also plays a role in the efferent control of baroreflex function (Verberne and Owens, 1998; Zhang et al., 1999; Craig, 2004). In this relationship it is important to note that one important feature of the baroreflex loop is its strong preference for oscillations around 0.1 Hz (Van Roon et al., 2004). Thus it appears that in the AIC different kinds of neuronal processes are intertwined: those associated with the initiation of voluntary movement, and those involved in the control of cardiovascular functions, although the precise neuronal networks supporting these intertwining processes are not yet clearly defined.
In general terms we may state that voluntary movements are internally driven. But what drives them internally? We hypothesized (Pfurtscheller et al., 2012a,b) that the intention to perform a voluntary movement at a given moment may be related to the dynamics of hemodynamic variables, which may be supported by the intertwined networks responsible for the timing of voluntary movements and for the control of cardiovascular variables, as described above. Preliminary results showed that the initiation of finger movements at free will, which occurs in about 40% of normal subjects studied at relatively constant intervals around 10 s, was time related to slow oscillations of autonomic blood pressure in the resting brain (Pfurtscheller et al., 2010). These oscillations tend to occur at frequencies around 0.1 Hz, the classic Mayer-waves (Mayer, 1876; Julien, 2006).
The goals of this pilot study are, first, to obtain further information about the role of slow hemodynamic oscillations in association with voluntary movement initiation and, second, to investigate more specifically time differences of slow intrinsic oscillations in two widely separated co-active brain areas prior to movement, the SMA and the insula. Furthermore this pilot study should help to clarify whether the popular time-frequency (t-f) tool, the Wavelet transform coherence (WTC), can be used to search for such phase differences in ongoing ~0.1-Hz oscillations and gives therewith references for the planning of a larger group-size study about voluntary movement at free will.
Materials and Methods
Subjects and Experimental Paradigm
Three healthy male subjects aged 27, 30 and 35 years were studied. All were right-handed as determined by the Edinburgh Handedness Inventory. The experiments were in compliance with the World Medical Association Declaration of Helsinki. All subjects gave informed written consent before participating.
The subjects were requested to rest for 5 min with eyes closed, stay awake, and avoid any movements. After a short pause, a 10 min scanning period with self-paced voluntary brisk finger movements followed. Subjects were instructed to press a button at “free will” with the right index finger. No training was performed and no instruction was given about the timing of the movements. Data are reported only from the movement task.
fMRI Image Acquisition and Preprocessing
Functional images were acquired on a 3.0-T scanner (MagnetomSkyra, Siemens, 160 functional echo-planar images, voxel size 3.5 × 3.5 × 3.5 mm3, TR = 1830 ms, TE = 30 ms, FOV = 240 × 240 mm2). Functional data were pre-processed using the DPARSFA toolbox (Chao-Gan and Yu-Feng, 2010). The volumes were corrected for slice time and head motion. The data were normalized to MNI space using the EPI template provided by SPM, resampled to 3 × 3 × 3 mm3 isotropic voxels, and smoothed with a 4 mm FWHM Gaussian kernel. Finally, time courses of 90 regions based on the AAL atlas (Tzourio-Mazoyer et al., 2002) were extracted and signals analysed in left SMA and left insula. In this pilot study we used the AAL atlas based on neuroanatomy and did not make a detailed differentiation of the insula in specific subregions with high spatial resolution (Kelly et al., 2012) and thus used simply more global descriptors, because we focused on slow ongoing activity oscillations in widely separated anatomical areas.
Wavelet Transform Coherence Analyses
Wavelet transform coherence (WTC) is a time- and frequency-specific measure of association between signals that has been applied to brain functional data several times in the past (Klein et al., 2006). Although WTC, being a t-f approach, benefits from high temporal sampling rates such as the ones achieved with electroencephalography, its ability to achieve temporal and spectral specificity in the case of a much slower signal such as fMRI time-series has been demonstrated (Müller et al., 2004; Chang and Glover, 2010). WTC was chosen because it combines the following desirable features: (i) Instances of previous application in the context of fMRI; (ii) Solid theoretical foundations; (iii) Straightforward implementation; and (iv) proper handling of t-f resolution in the sense that temporal resolution increases with frequency while spectral resolution decreases. WTC was applied to the time series of the selected ROI pair using the “Cross wavelet and wavelet coherence” toolbox implemented in MatlabTM (Grinsted et al., 2004). The Morlet wavelet was chosen as mother wavelet. Magnitude and phase components of the resulting t-f maps were extracted. The phase component was used to compute the Phase-Locking Value PLV (Lachaux et al., 1999), which basically reflects stability of the phase difference between two signals across a sliding time window. This computation was performed for every frequency and for every time point, with a window size of 5 cycles.
In this pilot study we used the Rayleigh test (Berens, 2009) to test whether phase differences between insula and SMA BOLD signals are uniformly spread across the trigonometric circle or if they are concentrated in specific segments of the circle. In the case of a significant p-value, the hypothesis of a uniform distribution can be rejected, due to a clustering of the phase differences in one or more segments. P-value plots as a function of frequency can be drawn to show to what extent frequencies in the range of interest (0.07–0.13 Hz) are associated with low p-values. A “dip” in the p-value plot is indicative of frequency-specific non-randomness of phase difference distribution. The computation of the circular histogram allows visualizing the distribution of phase difference values across the time series as well as pinpointing the location of the segment with the largest clustering density.
Hemodynamic Responses
For response calculation the BOLD time courses were linearly detrended for each ROI and resampled from 0.5465 Hz to 10 Hz. The resampling procedure assumes that each BOLD wave is represented by at least 2 samples and no aliasing occurs. In this way oscillations with frequencies lower than the Nyquist frequency of 0.273 Hz can be displayed correctly. Movement onset was used as the trigger. For each response also the trial-to-trial variance was calculated (the standard error, SE, was displayed) and the positive peak after movement was determined. We used paired t-tests to find out whether the positive peak after the button press was significantly different from the average BOLD activity during the baseline period taken from −6 s to −0.5 s before the movement, and whether the latency differences of the selected ROI pairs were significantly different. We conducted individual t-tests for each subject/ROI combination and used Bonferroni correction to control the family-wise error rate.
Results
Single Trial Phase Differences
All p-values of the Rayleigh test were highly significant, and therefore the null hypothesis of uniformly distributed phase differences was rejected throughout. Remarkable is that frequencies around 0.1 Hz correspond to a “dip” in the p-value plot, meaning that this frequency (“dip” frequency) shows the lowest random phase difference distribution within the 0.07–0.13 Hz band (see Table 1 and Figure 1). The most pronounced dip was found at 0.13 Hz in S1 while the dip was relatively broad in S3 with a minimum at 0.07 Hz and very broad in S2 with a dip at 0.09 Hz. This indicates that in S1 one small frequency band displayed a phase coupling while in S2 and S3 the band was broader. Circular histograms (showing the distribution of phase difference values, ranging from 0 to 360°, around the trigonometric circle) are displayed in Figure 2B and the mean time differences (in seconds) between left insula and left SMA are indicated in Table 1. The 0.1 Hz oscillations in the insula preceded those in the SMA by 0.5–1 s.
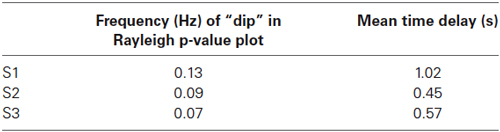
Table 1. “Dip” frequencies obtained by the Rayleigh-test in the range 0.06—Nyquist frequency and corresponding mean time delays in seconds between left insula and left SMA.
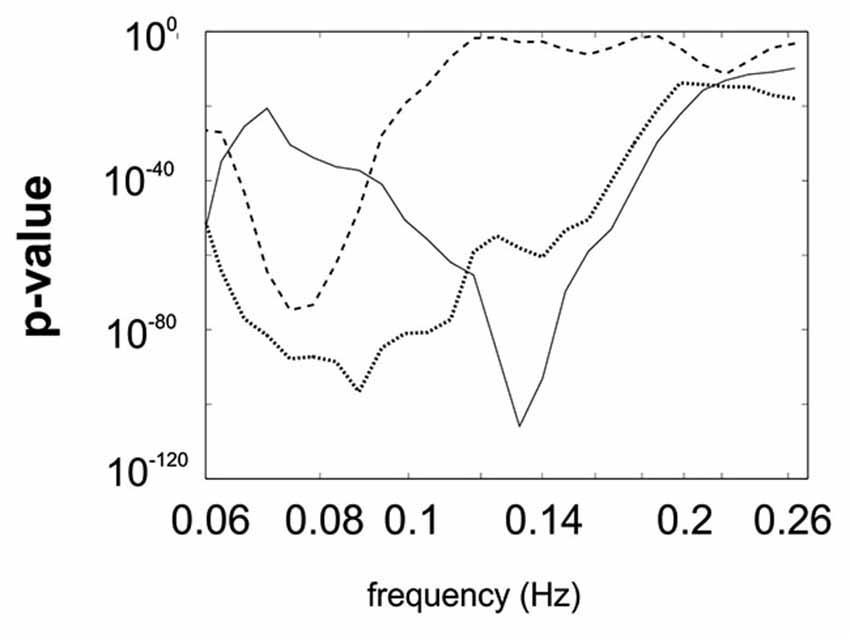
Figure 1. Superimposed p-value plots for the frequency range between 0.06 Hz and Nyquist frequency for the 3 subjects (S1 full line, S2 dotted line, S3 stippled line).
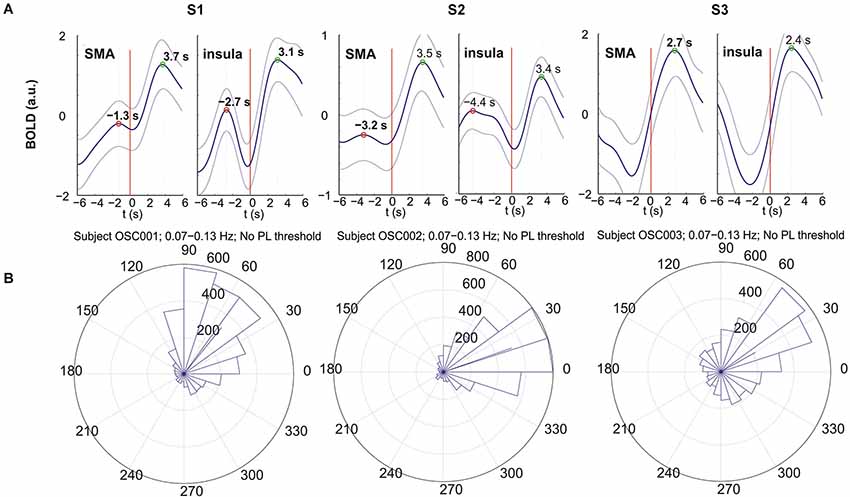
Figure 2. BOLD responses (A) and circular histograms (B) for subjects S1 (left), S2 (middle) and S3 (right). (A) Movement-evoked BOLD responses from left insula (right panel) and left SMA (left panel); the thick line indicates the mean and the 2 thin lines the corresponding ± SE; button press is indicated by the red vertical line. (B) Circular histograms of the phase differences between insula and SMA calculated for the frequency band 0.07–0.13 Hz. This histogram shows the distribution of phase difference values around the trigonometric circle from 0 to 360°. The side length of each triangle reflects the amount of phase values contained within the angle interval enclosed by the triangle. The location of the segments between 0° and ~90° indicates that the oscillations in the insula are leading.
Averaged Responses
Each subject initiated voluntary movements, but displayed different patterns. Namely, subject S1 made 28 finger movements at relatively random intervals with a mean interval of 19.2 s (SD = 8.3 s), S2 performed 78 voluntary movements at relatively regular intervals of 8.1 s (SD = 2.9) and S3 made only 19 movements with a mean interval of 30.2 s (SD = 13.5 s). The averaged evoked BOLD responses (±SE) following button press were studied within the left SMA and left insula (Figure 2A). The large SE indicates a pronounced trial-to-trial variability in each subject. The right part of the curves from 0 (movement-onset) to 6 s post-movement represents a reliable response with peak latencies (indicated in Figure 2A) between 2.4 s and 3.7 s. The results show that all positive peaks are significantly different from the preceding baseline activity (p < 0.05) except for subject S2 (insula). The evoked hemodynamic responses in the left SMA and left insula revealed peak latency differences of 0.6 s (S1: 3.7 s − 3.1 s), 0.1 s (S2: 3.5 s − 3.4 s) and 0.3 s (S3: 2.7 s − 2.4 s) with insula leading (Figure 2A), but only the difference of S1 was significant (p < 0.02).
Discussion
The different movement patterns in the subjects studied (19, 28 and 78 movements, respectively, in 10 min) give evidence that the subjects pressed the button at free will, but also show that in the case of a small number of movements there is still present ongoing intrinsic activity. In this relationship we refer to the findings of Monto et al. (2008) that the slow ongoing intrinsic oscillations reflect excitability changes in cortical networks correlated with slow fluctuations in human psychophysical performance. Thus a movement may be initiated if such an excitability increase passes over a given threshold. Based on this assumption and the different number of movements we propose that in studies of the dynamics of voluntary movements occurring without any instruction about timing, one should consider these movements in the context of two different brain states: namely the resting state and the active state.
In the resting state ongoing intrinsic oscillations around 0.1 Hz were observed in the 2 selected ROIs, the left SMA and the left insula, however, with different dominant frequencies in different subjects and a time difference of ~ 1 s with insula leading. The frequencies (dip frequencies ) were 0.13 Hz in S1, 0.09 Hz in S2 and 0.07 Hz in S3 (see Table 1). This supports not only findings about the existence of ongoing intrinsic oscillations around 0.1 Hz in human oxygen availability, ECoG and EEG signals (Cooper et al., 1966; Pfurtscheller, 1976; Vanhatalo et al., 2004; Foster and Parvizi, 2012; Pfurtscheller et al., 2012b) but also shows that the activity is spreading from the insula to higher-order motor areas. Remarkably, Fox et al. (2007) documented that the ongoing intrinsic neuronal driven fluctuations can have an impact on the spontaneous button press force and induce BOLD changes 2–3 s later. Such a relationship between slow ongoing intrinsic BOLD fluctuations and behavior was named “BOLD-behavior effect”. Further investigations are necessary to check not only whether the “BOLD-behavior effect” plays a role in the initiation of freely-voluntary movements during slow ongoing BOLD oscillations but also about the role of the Mayer-waves. Noteworthy is the finding of a former study (Pfurtscheller et al., 2010) that some subjects initiated voluntary movements frequently at the decreasing slope of the slow blood pressure wave (Mayer-wave).
The active state comprises the preparation and execution of a brisk movement, which is associated with the processing of reafferent input from kinesthetic receptors evoked by the movement itself (Deecke et al., 1969). The movement-evoked BOLD response represents neuronal activation that takes 2–3 s to develop (neurovascular coupling) and peaks in the somatomotor cortex approximately 5–6 s after movement onset (Cunnington et al., 2005; Steinbrink et al., 2006; Fox et al., 2007). If we take into account the neuronal activation in the SMA approximately 2 s prior to the self-initiated movement (Deecke et al., 1969; Ball et al., 1999; Cunnington et al., 2005) the related BOLD response peak is expected at ~ 3–4 s after movement onset. This is in agreement with our results with BOLD peak latencies in the SMA between 2.7 s and 3.7 s (see Figure 2A).
The BOLD responses displayed an oscillatory behavior in all 3 subjects most pronounced in the insula. The period of these responses (time difference between positive post movement and pre movement peaks; see Figure 2A) was the shortest in S1 (~6 s) and the longest in S3 (estimated ~12 s). Interestingly these periods correspond approximately to the periods of the intrinsic oscillations in S1 (~7 s) and S3 (~14 s). This is first evidence that in these subjects the timing of movement-onset was approximately time-locked to the intrinsic activity.
In S2 the period of the oscillatory response was ~ 8 s (see Figure 2A) and corresponding to the mean inter-movement interval of 8.1 s while the intrinsic oscillations had a period of ~ 11 s (dip frequency 0.09 Hz). We can speculate therefore that S2 initiated the voluntary movements at relatively regular intervals of ~ 8 s most likely time-locked to each second respiratory cycle (corresponding to a respiration frequency of ~ 0.25 Hz). Such a respiration-related initiation of voluntary movements is not uncommon and has been documented recently (Pfurtscheller et al., 2010). The direct coupling between respiratory and cardiovascular centers in the brainstem and the existence of a respiration-related stimulation of arterial baroreceptors, cardiopulmonary receptors and stretch receptors in the chest wall (Saul et al., 1991) may contribute to such behavior. The BOLD response latency difference between insula and SMA in S2 was small and not significant, meaning that the responses were about concomitant in insula and SMA which lead to suggest also a respiration-related movement initiation.
The pilot study suggests that the WTC method is suitable to investigate the dominant frequency of slow oscillations in different areas and provide information about phase (time) shifts. However the AAL atlas used did not have the power to delineate precisely the subdivisions of the insular region. Nonetheless we measured the activity of the insular region globally, which may be expected to reflect, at least partially, the activity of AIC, although the insula is not a homogenous structure. We should emphasize that in this paper our primary aim is to report the first results of this approach in a most economical way; this may be considered as the presentation of a proof-of-principle, in which the main findings are put forward. A more extensive and comprehensive study is in preparation.
Given the small amount of data (only 3 subjects and 10 min of data in each subject), novel results are obtained but it is hard to draw valid conclusions. For a large size study the following improvements are recommended: (i) use a short scanning rate (TR < 1 s) to avoid respiration-related aliasing; (ii) record pulse or heart rate within the scanner to check whether the blood pressure waves (Mayer waves) play any role in initiation of movement; (iii) record the breathing cycle to monitor respiration-related movement initiation; (iv) study more pairs of ROIs within the motor and limbic systems to obtain reliable estimates of time differences; (v) investigate phase locking not only during movement but also in the resting state; and (vi) study distinct subregions of the insula and not the insula as a single region.
Conflict of Interest Statement
The authors declare that the research was conducted in the absence of any commercial or financial relationships that could be construed as a potential conflict of interest.
Acknowledgments
This work was supported by the Neuro Center Styria (NCS).
References
Ball, T., Schreiber, A., Feige, B., Wagner, M., Luecking, C. H., and Kristeva-Feige, R. (1999). The role of higher-order motor areas in voluntary movement as revealed by high-resolution EEG and fMRI. Neuroimage 10, 682–694. doi: 10.1006/nimg.1999.0507
Pubmed Abstract | Pubmed Full Text | CrossRef Full Text | Google Scholar
Brass, M., and Haggard, P. (2008). The what, when, whether model of intentional action. Neuroscientist 14, 319–325. doi: 10.1177/1073858408317417
Pubmed Abstract | Pubmed Full Text | CrossRef Full Text | Google Scholar
Brass, M., and Haggard, P. (2010). The hidden side of intentional action: the role of the anterior insular cortex. Brain Struct. Funct. 214, 603–610. doi: 10.1007/s00429-010-0269-6
Pubmed Abstract | Pubmed Full Text | CrossRef Full Text | Google Scholar
Cauda, F., D’Agata, F., Sacco, K., Duca, S., Geminiani, G., and Vercelli, A. (2011). Functional connectivity of the insula in the resting brain. Neuroimage 55, 8–23. doi: 10.1016/j.neuroimage.2010.11.049
Pubmed Abstract | Pubmed Full Text | CrossRef Full Text | Google Scholar
Chang, C., and Glover, G. H. (2010). Time-frequency dynamics of resting-state brain connectivity measured with fMRI. Neuroimage 50, 81–98. doi: 10.1016/j.neuroimage.2009.12.011
Pubmed Abstract | Pubmed Full Text | CrossRef Full Text | Google Scholar
Chao-Gan, Y., and Yu-Feng, Z. (2010). DPARSF: a MATLAB toolbox for “Pipeline” data analysis of resting-state fMRI. Front. Syst. Neurosci. 4:13. doi: 10.3389/fnsys.2010.00013
Pubmed Abstract | Pubmed Full Text | CrossRef Full Text | Google Scholar
Cooper, R., Crow, H. J., Walter, W. G., and Winter, A. L. (1966). Regional control of cerebral vascular reactivity and oxygen supply in man. Brain Res. 3, 174–191. doi: 10.1016/0006-8993(66)90075-8
Pubmed Abstract | Pubmed Full Text | CrossRef Full Text | Google Scholar
Craig, A. D. (2004). Human feelings: why are some more aware than others? Trends Cogn. Sci. 8, 239–241. doi: 10.1016/j.tics.2004.04.004
Pubmed Abstract | Pubmed Full Text | CrossRef Full Text | Google Scholar
Craig, A. D. (2009). How do you feel—now? The anterior insula and human awareness. Nat. Rev. Neurosci. 10, 59–70. doi: 10.1038/nrn2555
Pubmed Abstract | Pubmed Full Text | CrossRef Full Text | Google Scholar
Cunnington, R., Windischberger, C., and Moser, E. (2005). Premovement activity of the pre-supplementary motor area and the readiness for action: studies of time-resolved event-related functional MRI. Hum. Mov. Sci. 24, 644–656. doi: 10.1016/j.humov.2005.10.001
Pubmed Abstract | Pubmed Full Text | CrossRef Full Text | Google Scholar
Deecke, L., Scheid, P., and Kornhuber, H. H. (1969). Distribution o readiness potential, pre-motion positivity and motor potential ofthe human cerebral cortex preceding voluntary finger movements. Exp. Brain Res. 7, 158–168. doi: 10.1007/bf00235441
Pubmed Abstract | Pubmed Full Text | CrossRef Full Text | Google Scholar
Foster, B. L., and Parvizi, J. (2012). Resting oscillations and cross-frequency coupling in human posteromedial cortex. Neuroimage 60, 384–391. doi: 10.1016/j.neuroimage.2011.12.019
Pubmed Abstract | Pubmed Full Text | CrossRef Full Text | Google Scholar
Fox, M. D., Snyder, A. Z., Vincent, J. L., and Raichle, M. E. (2007). Intrinsic fluctuations within cortical systems account for intertrial variabilityin human behavior. Neuron 56, 171–184. doi: 10.1016/j.neuron.2007.08.023
Pubmed Abstract | Pubmed Full Text | CrossRef Full Text | Google Scholar
Grinsted, A., Moore, J. C., and Jevrejeva, S. (2004). Application of the cross wavelet transform and wavelet coherence to geophysical time series. Nonlinear Process. Geophys. 11, 561–566. doi: 10.5194/npg-11-561-2004
Julien, C. (2006). The enigma of Mayer waves: facts and models. Cardiovasc. Res. 70, 12–21. doi: 10.1016/j.cardiores.2005.11.008
Pubmed Abstract | Pubmed Full Text | CrossRef Full Text | Google Scholar
Kelly, C., Toro, R., Di Martino, A., Cox, C. L., Bellec, P., Castellanos, F. X., et al. (2012). A convergent functional architecture of the insula emerges across imaging modalities. Neuroimage 61, 1129–1142. doi: 10.1016/j.neuroimage.2012.03.021
Pubmed Abstract | Pubmed Full Text | CrossRef Full Text | Google Scholar
Klein, A., Sauer, T., Jedynak, A., and Skrandies, W. (2006). Conventional and wavelet coherence applied to sensory-evoked electrical brain activity. IEEE Trans. Biomed. Eng. 53, 266–272. doi: 10.1109/tbme.2005.862535
Pubmed Abstract | Pubmed Full Text | CrossRef Full Text | Google Scholar
Lachaux, J. P., Rodriguez, E., Martinerie, J., and Varela, F. J. (1999). Measuring phase synchrony in brain signals. Hum. Brain Mapp. 8, 194–208. doi: 10.1002/(sici)1097-0193(1999)8:4<194::aid-hbm4>3.0.co;2-c
Pubmed Abstract | Pubmed Full Text | CrossRef Full Text | Google Scholar
Libet, B., Gleason, C. A., Wright, E. W., and Pearl, D. K. (1983). Time of conscious intention to act in relation to onset of cerebral activity (readiness-potential). The unconscious initiation of a freely voluntary act. Brain 106, 623–642. doi: 10.1093/brain/106.3.623
Pubmed Abstract | Pubmed Full Text | CrossRef Full Text | Google Scholar
Mayer, S. (1876). Studien zur Physiologie des Herzens und der Blutgefaesse. Ueber spontane Blutdruckschwankungen. Sitz Kaiser Akad Wiss 74, 281–307.
Monto, S., Palva, S., Voipio, J., and Palva, J. M. (2008). Very slow EEG fluctuations predict the dynamics of stimulus detection and oscillation amplitudes in humans. J. Neurosci. 28, 8268–8272. doi: 10.1523/JNEUROSCI.1910-08.2008
Pubmed Abstract | Pubmed Full Text | CrossRef Full Text | Google Scholar
Müller, K., Lohmann, G., Neumann, J., Grigutsch, M., Mildner, T., and von Cramon, Y. (2004). Investigating the wavelet coherence phase of the bold signal. J. Magn. Reson. Imaging 20, 145–152. doi: 10.1002/jmri.20064
Pubmed Abstract | Pubmed Full Text | CrossRef Full Text | Google Scholar
Pfurtscheller, G. (1976). Ultralangsame Schwankungen innerhalb der rhythmischen Aktivität im Alpha-Band und deren mögliche Ursachen. Pflügers Arch. 367, 55–66. doi: 10.1007/bf00583657
Pfurtscheller, G., Bauernfeind, G., Neuper, C., and Lopes da Silva, F. H. (2012a). Does conscious intention to perform a motor act depend on slow prefrontal (de)oxyhemoglobin oscillations in the resting brain? Neurosci. Lett. 508, 89–94. doi: 10.1016/j.neulet.2011.12.025
Pubmed Abstract | Pubmed Full Text | CrossRef Full Text | Google Scholar
Pfurtscheller, G., Daly, I., Bauernfeind, G., and Müller-Putz, G. R. (2012b). Coupling between intrinsic prefrontal HbO2 and central EEG beta power oscillations in the resting brain. PLoS One 7:e43640. doi: 10.1371/journal.pone.0043640
Pubmed Abstract | Pubmed Full Text | CrossRef Full Text | Google Scholar
Pfurtscheller, G., Ortner, R., Bauernfeind, G., Linortner, P., and Neuper, C. (2010). Does conscious intention to perform a motor act depend on slow cardiovascular rhythms? Neurosci. Lett. 468, 46–50. doi: 10.1016/j.neulet.2009.10.060
Pubmed Abstract | Pubmed Full Text | CrossRef Full Text | Google Scholar
Saul, J. P., Berger, R. D., Albrecht, P., Stein, S. P., Chen, M. H., and Cohen, R. J. (1991). Transfer function analysis of the circulation: unique insights into cardiovascular regulation. Am. J. Physiol. 261, 1231–1245.
Steinbrink, J., Villringer, A., Kempf, F., Haux, D., Boden, S., and Obrig, H. (2006). Illuminating the BOLD signal: combined fMRI-fNIRS studies. Magn. Reson. Imaging 24, 495–505. doi: 10.1016/j.mri.2005.12.034
Pubmed Abstract | Pubmed Full Text | CrossRef Full Text | Google Scholar
Tzourio-Mazoyer, N., Landeau, B., Papathanassiou, D., Crivello, F., Etard, O., Delcroix, N., et al. (2002). Automated anatomical labeling of activations in SPM using a macroscopic anatomical parcellation of the MNI MRI single-subject brain. Neuroimage 15, 273–289. doi: 10.1006/nimg.2001.0978
Pubmed Abstract | Pubmed Full Text | CrossRef Full Text | Google Scholar
Vanhatalo, S., Palva, J. M., Holmes, M. D., Miller, J. W., Voipio, J., and Kaila, K. (2004). Infraslow oscillations modulate excitability and interictal epileptic activity in the human cortex during sleep. Proc. Natl. Acad. Sci. U S A 101, 5053–5057. doi: 10.1073/pnas.0305375101
Pubmed Abstract | Pubmed Full Text | CrossRef Full Text | Google Scholar
Van Roon, A. M., Mulder, L. J., Althaus, M., and Mulder, G. (2004). Introducing a baroreflex model for studying cardiovascular effects of mental workload. Psychophysiology 41, 961–981. doi: 10.1111/j.1469-8986.2004.00251.x
Pubmed Abstract | Pubmed Full Text | CrossRef Full Text | Google Scholar
Verberne, A. J. M., and Owens, N. C. (1998). Cortical modulation of the cardiovascular system. Prog. Neurobiol. 54, 149–168. doi: 10.1016/s0301-0082(97)00056-7
Pubmed Abstract | Pubmed Full Text | CrossRef Full Text | Google Scholar
Yarkoni, T., Poldrack, R. A., Nichols, T. E., Van Essen, D. C., and Wagner, T. D. (2011). Large-scale automated synthesis of human functional neuroimaging data. Nat. Methods 8, 665–670. doi: 10.1038/nmeth.1635
Pubmed Abstract | Pubmed Full Text | CrossRef Full Text | Google Scholar
Zhang, Z. H., Dougherty, P. M., and Oppenheimer, D. (1999). Monkey insular cortex neurons respond to baroreceptors and somatosensory convergent inputs. Neuroscience 94, 351–360. doi: 10.1016/s0306-4522(99)00339-5
Pubmed Abstract | Pubmed Full Text | CrossRef Full Text | Google Scholar
Keywords: 0.1-Hz oscillations, insula, voluntary movement, fMRI, BOLD
Citation: Pfurtscheller G, Andrade A, Koschutnig K, Brunner C and Lopes da Silva F (2014) Initiation of voluntary movements at free will and ongoing 0.1-Hz BOLD oscillations in the insula—a pilot study. Front. Integr. Neurosci. 8:93. doi: 10.3389/fnint.2014.00093
Received: 29 September 2014; Accepted: 19 November 2014;
Published online: 08 December 2014.
Edited by:
Jose Luis Perez Velazquez, Hospital for Sick Children and University of Toronto, CanadaReviewed by:
Andre Chevrier, University of Toronto, CanadaAaron Kucyi, University of Toronto, Canada
Copyright © 2014 Pfurtscheller, Andrade, Koschutnig, Brunner and Lopes da Silva. This is an open-access article distributed under the terms of the Creative Commons Attribution License (CC BY). The use, distribution and reproduction in other forums is permitted, provided the original author(s) or licensor are credited and that the original publication in this journal is cited, in accordance with accepted academic practice. No use, distribution or reproduction is permitted which does not comply with these terms.
*Correspondence: Gert Pfurtscheller, Institute for Knowledge Discovery (BCI Lab), Graz University of Technology, Inffeldgasse 13/4, 8010 Graz, Austria e-mail: pfurtscheller@tugraz.at