Regional Associations of Cortical Superficial Siderosis and β-Amyloid-Positron-Emission-Tomography Positivity in Patients With Cerebral Amyloid Angiopathy
 Anika Finze1
  Hannes Wahl2
  Daniel Janowitz3 Katharina Buerger3
  Jennifer Linn2
  Axel Rominger4
  Sophia Stöcklein5 Peter Bartenstein1,6 Frank Arne Wollenweber3
  Cihan Catak3†
  Matthias Brendel1,6,7*†
- 1Department of Nuclear Medicine, University Hospital of Munich, LMU Munich, Munich, Germany
- 2Department of Neuroradiology, University Hospital of Dresden, Carl Gustav Carus University Dresden, Dresden, Germany
- 3Institute for Stroke and Dementia Research, University Hospital of Munich, LMU Munich, Munich, Germany
- 4Department of Nuclear Medicine, Inselspital, Bern University Hospital, University of Bern, Bern, Switzerland
- 5Department of Radiology, University Hospital of Munich, LMU Munich, Munich, Germany
- 6Munich Cluster for Systems Neurology (SyNergy), Munich, Germany
- 7German Center for Neurodegenerative Diseases (DZNE), Munich, Germany
Objective: This is a cross-sectional study to evaluate whether β-amyloid-(Aβ)-PET positivity and cortical superficial siderosis (cSS) in patients with cerebral amyloid angiopathy (CAA) are regionally colocalized.
Methods: Ten patients with probable or possible CAA (73.3 ± 10.9 years, 40% women) underwent MRI examination with a gradient-echo-T2*-weighted-imaging sequence to detect cSS and 18F-florbetaben PET examination to detect fibrillar Aβ. In all cortical regions of the Hammers Atlas, cSS positivity (MRI: ITK-SNAP segmentation) and Aβ-PET positivity (PET: ≥ mean value + 2 standard deviations of 14 healthy controls) were defined. Regional agreement of cSS- and Aβ-PET positivity was evaluated. Aβ-PET quantification was compared between cSS-positive and corresponding contralateral cSS-negative atlas regions. Furthermore, the Aβ-PET quantification of cSS-positive regions was evaluated in voxels close to cSS and in direct cSS voxels.
Results: cSS- and Aβ-PET positivity did not indicate similarity of their regional patterns, despite a minor association between the frequency of Aβ-positive patients and the frequency of cSS-positive patients within individual regions (rs = 0.277, p = 0.032). However, this association was driven by temporal regions lacking cSS- and Aβ-PET positivity. When analyzing all composite brain regions, Aβ-PET values in regions close to cSS were significantly higher than in regions directly affected with cSS (p < 0.0001). However, Aβ-PET values in regions close to cSS were not different when compared to corresponding contralateral cSS-negative regions (p = 0.603).
Conclusion: In this cross-sectional study, cSS and Aβ-PET positivity did not show regional association in patients with CAA and deserve further exploitation in longitudinal designs. In clinical routine, a specific cross-sectional evaluation of Aβ-PET in cSS-positive regions is probably not useful for visual reading of Aβ-PETs in patients with CAA.
Introduction
Cerebral amyloid angiopathy (CAA) is characterized by leptomeningeal and cortical beta-amyloid (Aβ) accumulation in small vessels (Vinters, 1987). CAA particularly affects the aged population, and it is associated with Alzheimer’s disease (AD; Ellis et al., 1996; Keage et al., 2009; Arvanitakis et al., 2011). Previous studies have indicated that CAA is characterized by vascular occlusion and local ischemia (Olichney et al., 1995; Cadavid et al., 2000; Thal et al., 2009). Besides, the local fragility of the vessels can result in singular or chronic intracerebral or subarachnoid bleeding (Vinters, 1987; Itoh et al., 1993; Qureshi et al., 2001, 2009; Nakata-Kudo et al., 2006; Charidimou et al., 2012). The typical CAA finding of linear cortical superficial siderosis (cSS) winds around the gyri and sulci of the brain and the blood component hemosiderin, in particular, can be measured in gradient-echo-T2*-weighted-imaging (GRE-T2*-WI), a sequence of MRI (Linn et al., 2008, 2010; Kumar, 2010). Recent studies pointed out a diagnostic (Linn et al., 2010; Charidimou et al., 2013a) and prognostic (Charidimou et al., 2013b; Linn et al., 2013; Wollenweber et al., 2019) value of cSS determination in patients with CAA. However, the detailed mechanisms and associations between Aβ aggregation and cSS are still unclear. The aforementioned findings suggest that there is a regional relationship between Aβ accumulation and cSS, and we aimed to test this hypothesis by in vivo imaging. In this regard, fibrillar Aβ is now sufficiently detectable by FDA-approved PET tracers in living patients (Clark et al., 2011; Curtis et al., 2015; Sabri et al., 2015), and modern data analysis pipelines allow to investigate the PET and MRI data in matched spatial orientation (Wollenweber et al., 2014). We hypothesized that regionally pronounced Aβ accumulation leads to a colocalized increase of cSS due to higher vessel vulnerability in these regions. In turn, this could facilitate improved judgment of Aβ-PET positivity by the specific analysis of cSS-positive brain regions. However, in a recent single-case analysis from our group (Brendel et al., 2020b), a patient with probable CAA did not show a regional increase of the Aβ-PET signal in brain areas affected by cSS. Thus, we aimed to explore this phenomenon in a larger cohort of ten patients with CAA who underwent GRE-T2*-WI MRI and 18F-florbetaben Aβ-PET. A detailed segmentation approach was used to investigate the regional agreement between fibrillar Aβ accumulation and cSS.
Materials and Methods
Participants
Ten CAA patients with cSS were investigated in this cross-sectional study. All have been diagnosed with a possible or probable CAA according to the modified Boston criteria (Linn et al., 2010). The presence of cSS was determined by experts using the GRE-T2*-WI MRI sequence. They underwent a standardized 18F-florbetaben PET examination (Barthel et al., 2011). Detailed inclusion and exclusion criteria and study protocols were published elsewhere (Wollenweber et al., 2014, 2019). Five patients were embedded in the Superficial Siderosis in Patients with Suspected Cerebral Amyloid Angiopathy study (SuSPect-CAA; Wollenweber et al., 2019), a prospective, multicenter cohort study (gov: NCT01856699). The other five patients were part of the longitudinal Determinants of Dementia after Stroke (DEDEMAS) cohort study (Wollenweber et al., 2014) (gov: NCT01334749). The data of one patient have already been published as a case report (Brendel et al., 2020b). As a control group [i.e., healthy control (HC)], 14 cognitively healthy individuals who underwent 18F-florbetaben PET with no evidence of CAA or cSS were included. They were cognitively inconspicuous and had no history of cerebral hemorrhage and a negative Aβ status to 18F-florbetaben PET (visual read by a single expert). HCs of the in-house database were excluded a priori if they showed a standardized uptake value ratio (SUVr) over 2.5 standard deviations (SDs) above the mean value (MV) of the other controls in one region to avoid controls at the early stages of Aβ buildup.
Magnetic Resonance Imaging
The MRI examinations were performed on 3.0 Tesla GE Signa HDxt scanners. Since two different study protocols were used, the parameters differ in some cases. In this case, both parameters are given as follows: TE = 9 ms/14 ms, TR = 600 ms/540 ms, flip angle = 20°, slice thickness = 5 mm, spacing between slices = 5.5 mm, acquisition matrix = 320 × 320/256 × 256, reconstruction matrix = 512 × 512, inplane resolution = 0.43 × 0.43 mm/1 × 1 mm.
18F-Florbetaben Positron-Emission-Tomography Imaging
18F-florbetaben PET was carried out on a GE Discovery 690 PET/CT (GE Healthcare) or a Siemens Biograph 64 True X (Siemens, Erlangen, Germany) scanner with harmonized dedicated brain PET reconstruction protocols in terms of spatial resolution via Hofmann phantom measurements (Brendel et al., 2020a). After the intravenous injection of 300.9 ± 16.8 MBq 18F-florbetaben, a low-dose CT of the skull was performed for attenuation correction between 85 and 90 min, and a 20-min emission measurement was started 90 min post injection (Barthel et al., 2011).
Image Data Processing
Figure 1 provides an overview of all methodological steps. First, the T2* sequences were homogenized with N4 bias field correction to minimize segmentation errors due to variances in field intensity (Tustison et al., 2010). Second, expert raters segmented the cSS-affected gyri and sulci in each axial T2* sequence using ITK-SNAP (V3.6) (Yushkevich et al., 2004), by defining cSS with a value of 1 and non-cSS with 0. A brush diameter of 6 mm was used. In the next step, the segmented cSS was smoothed using a 5-mm Gaussian filter to reflect the PET resolution. For each patient, the Hammers Atlas (Hammers et al., 2003, 2008; Gousias et al., 2008), consisting of 83 volumes-of-interests (VOIs), was adapted to the respective GRE-T2*-WI MRI. For seven patients, a three-dimensional (3D) T1-weighted MRI sequence was used to outline the brain into the 83 atlas VOIs using the PNEURO tool implemented by PMOD (V3.5, PMOD Technologies LLC, Zurich, Switzerland). The created VOI-set was then fused into the GRE-T2*-WI MRI of patients using the FUSION tool (V3.5, PMOD Technologies LLC). For the other three patients without 3D T1-weighted MRI, a Hammers VOI-set adapted to the Montreal Neurological Institute (MNI) space (Evans et al., 1993; Collins et al., 1994; Montreal Neurological Institute, 2012) was fused into the GRE-T2*-WI MRI. All subcortical VOIs were excluded for this analysis, reducing the VOI-set to 60 regions (30 in each hemisphere). Using a probability threshold of 90%, the previously adjusted and reduced 60 atlas VOIs were thus defined as cSS-positive (cSS⊕) or cSS-negative (cSS⊖). In a cSS⊕-VOI, all voxels with a value ≥0.1 were subdivided into cSS⊕-with-siderosis (cSS⊕1), and all voxels with a value <0.1 were subdivided into cSS⊕-without-siderosis (cSS⊕0). For cSS⊕-VOIs, the corresponding contralateral VOI was defined as a control region when it was cSS⊖ (contralateral-to-cSS⊕). Finally, the 18F-florbetaben PET was fused into the respective GRE-T2*-WI space, and Aβ SUV was determined from all 60 Hammers (including cSS⊕ and contralateral-to-cSS⊕), cSS⊕1, and cSS⊕0 VOIs. The left and right cerebellum (additional VOIs from Hammers Atlas) were averaged and used as a reference region, which served for the calculation of cortex-to-cerebellum SUVr. In summary, SUVr were determined in cSS⊕, cSS⊕1, cSS⊕0, and contralateral-to-cSS⊕ regions. The co-registered images of one patient were superimposed for a descriptive single-case presentation.
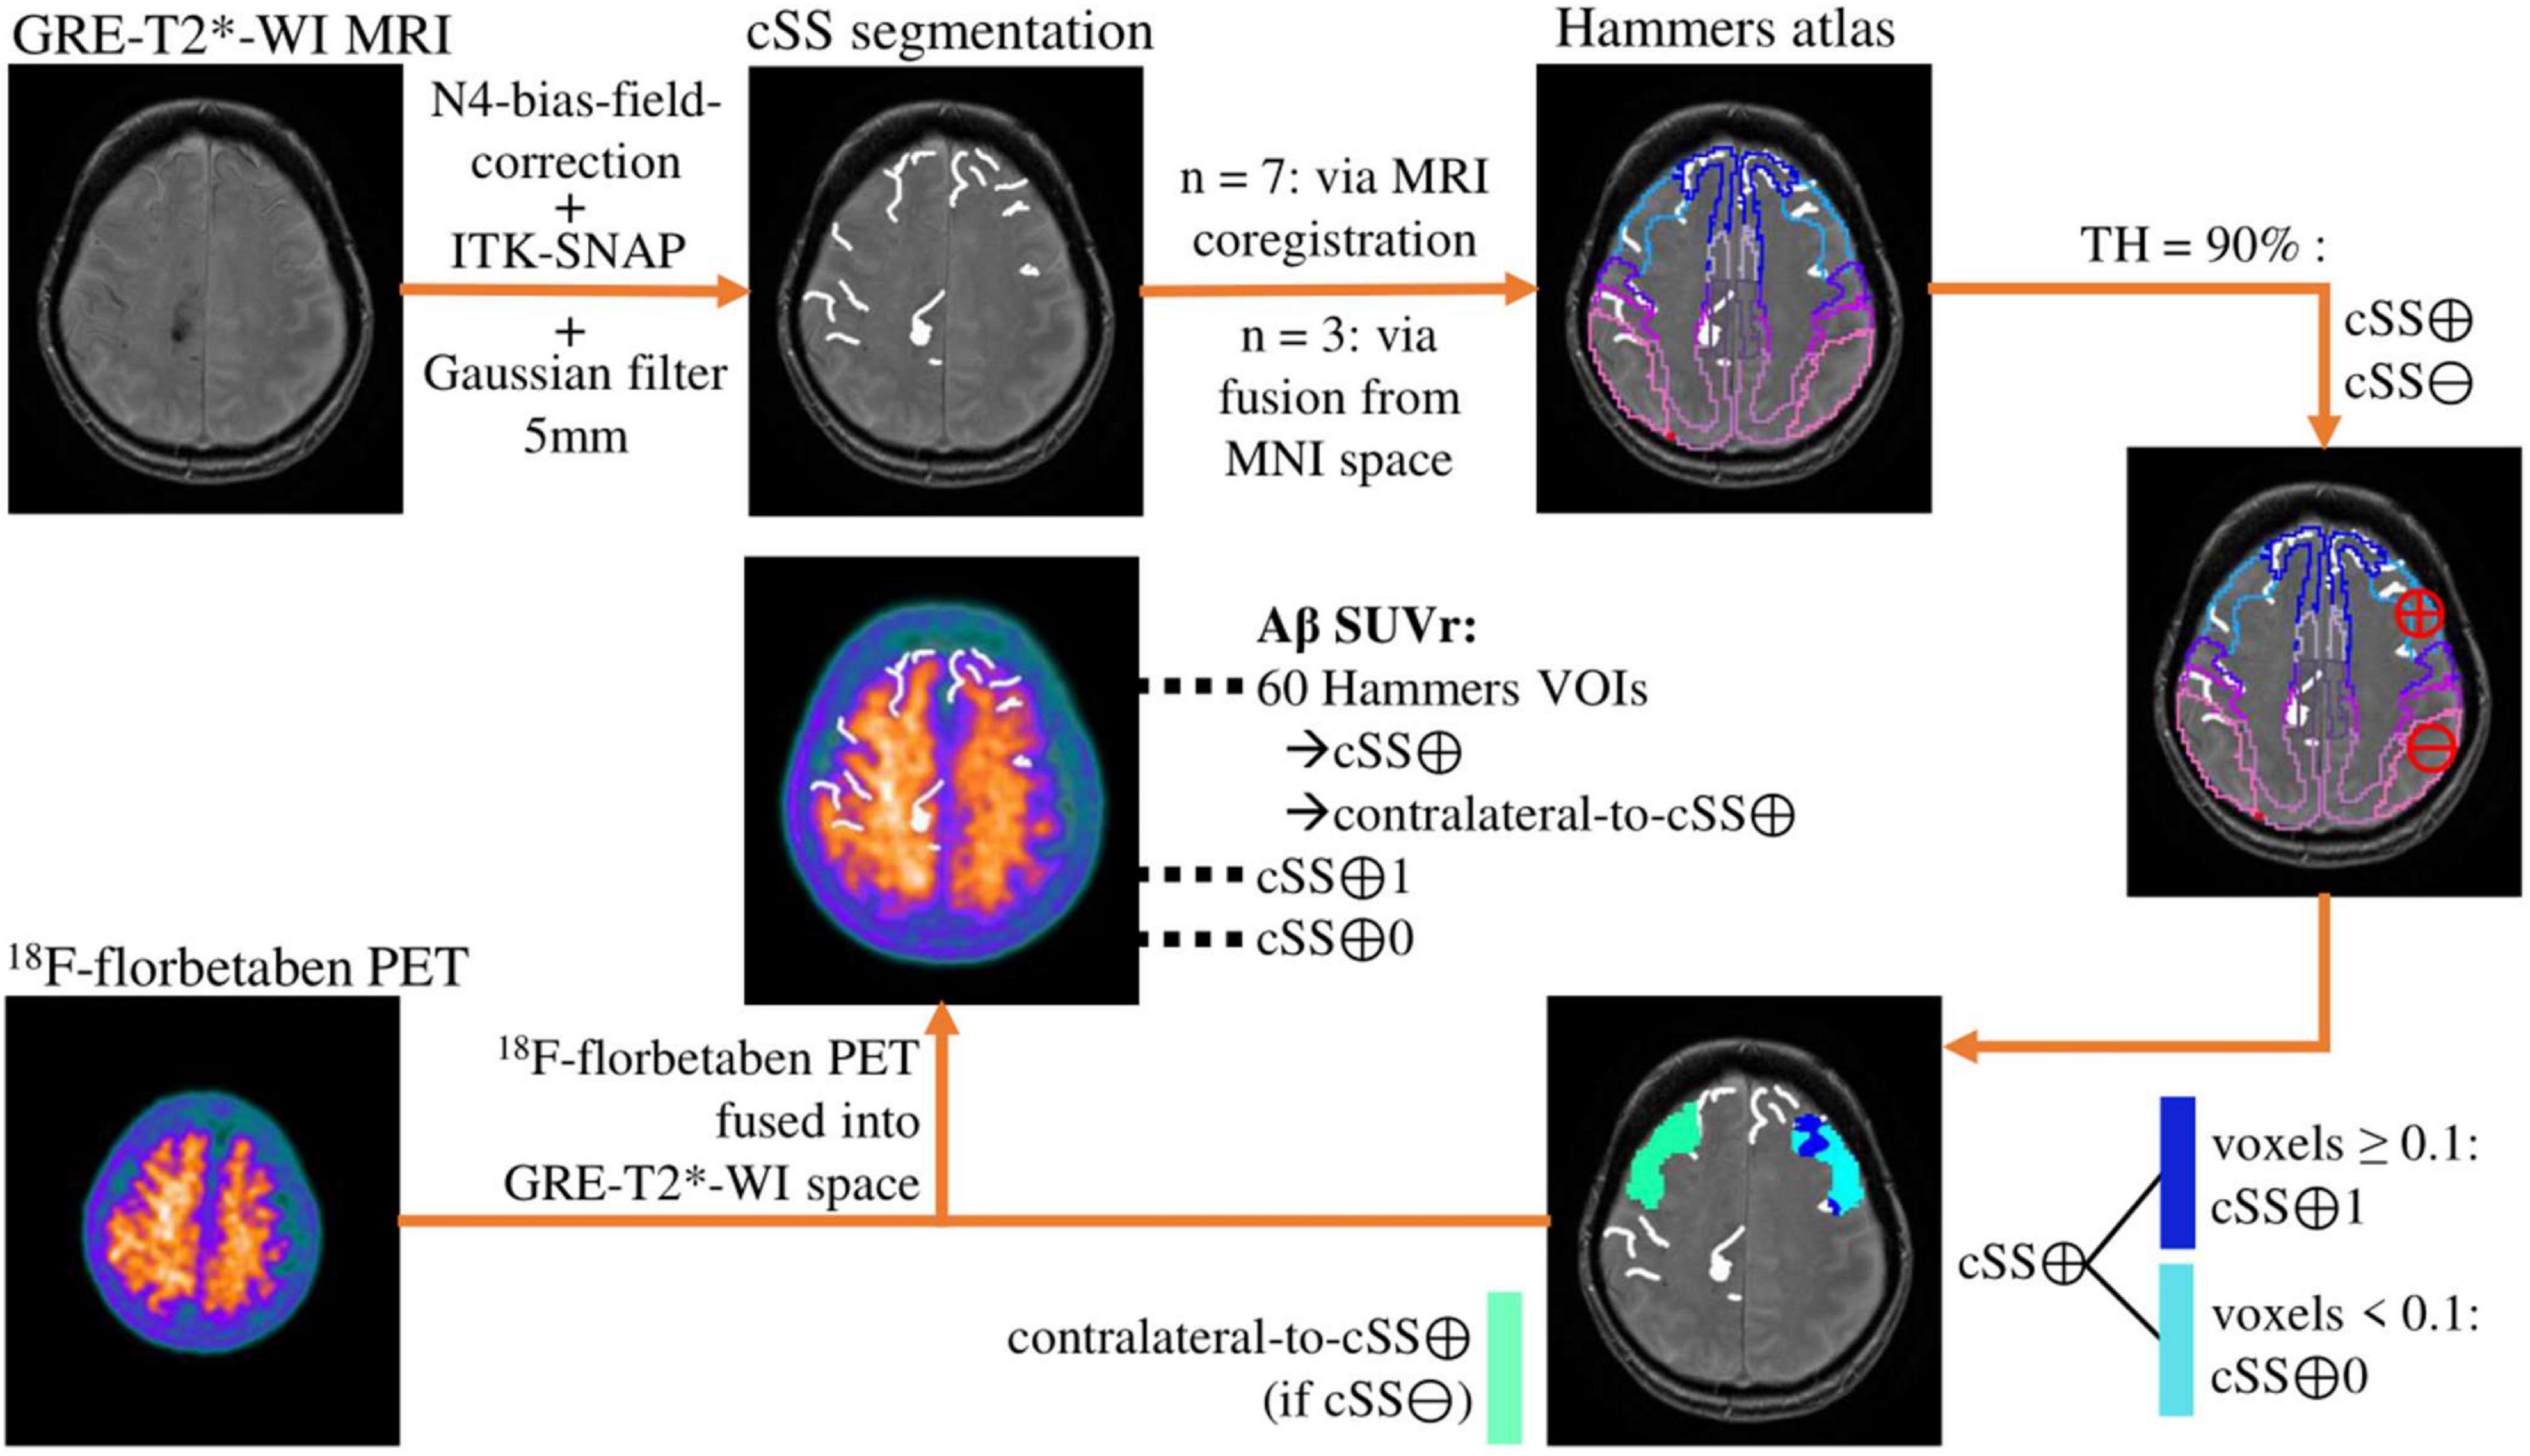
Figure 1. Methodological workflow. The analysis pipeline is illustrated by the images of an exemplary patient. The cortical superficial siderosis (cSS) segmentation is shown without the 5-mm Gaussian filter.
Statistical Analysis
All statistical analyses were carried out with SPSS (V25, IBM, Ehningen, Germany) or R (V4.0.2, R Core Team, 2020, Vienna, Austria). The level of significance was set at α = 0.05. Age was determined by the date of the 18F-florbetaben PET acquisition. Age was compared between the study and control group by a two-tailed Student’s t-test, whereas sex was subjected to a χ2 test.
A semiquantitative region-based classification was performed in all cortical atlas regions (26 frontal, 20 temporal, six parietal, six occipital, and two posterior cingulate gyrus = 60 regions), defining Aβ-PET SUVr ≥ MV + 2.5 SD of the controls as Aβ-positive (Aβ⊕). Furthermore, the regions were divided into cSS-positive (cSS⊕) and cSS-negative (cSS⊖) with a probability threshold of 90%, as already described above. The frequency of Aβ-positive patients in an atlas region was correlated with the frequency of cSS-positive patients by calculating Spearman’s correlation coefficient (rs). The agreement of Aβ-PET positivity with cSS positivity of all single regions was assessed.
For the comparison of SUVr, multiple two-tailed pairwise Student’s t-tests between the four previously defined VOI groups were performed, to account for dependent samples. cSS⊕, cSS⊕1, and cSS⊕0 were compared with each other, as well as cSS⊕0 with the region contralateral to cSS⊕, if it was cSS⊖ (contralateral-to-cSS⊕). These quantitative group comparisons were carried out individually for all common Aβ-PET target regions [i.e., frontal, temporal, parietal, and posterior cingulate gyrus (Brendel et al., 2015)] and for the composite of these regions. To correct for multiple testing, the p-value adjustments were made within each lobe analysis (four t-tests in one lobe) using false-discovery-rate (FDR) correction (Benjamini and Hochberg, 1995). Since there is an additional risk of alpha error accumulation through statistical testing in five cerebral lobes, each p-value was multiplied by five according to the Bonferroni correction (Armstrong, 2014).
Results
The patients presented themselves to the respective clinics with focal neurological symptoms (past intracranial hemorrhage n = 3, memory complaints n = 4, past ischemic stroke or transient ischemic attack n = 2, or presumed focal seizures n = 1). Of the four women (66.2 ± 14.4 years) and six men (78.0 ± 4.9 years), three patients were diagnosed with a possible CAA and seven patients with a probable CAA, according to the modified Boston criteria (Linn et al., 2010). HCs were not significantly different in age (patients: 73.3 ± 10.9 years; HC: 65.9 ± 5.7 years; p = 0.073) and sex (patients: M/F = 6/4; HC: M/F = 8/6; χ2 = 0.020; p = 0.889). Details of the cohort are provided in Table 1.
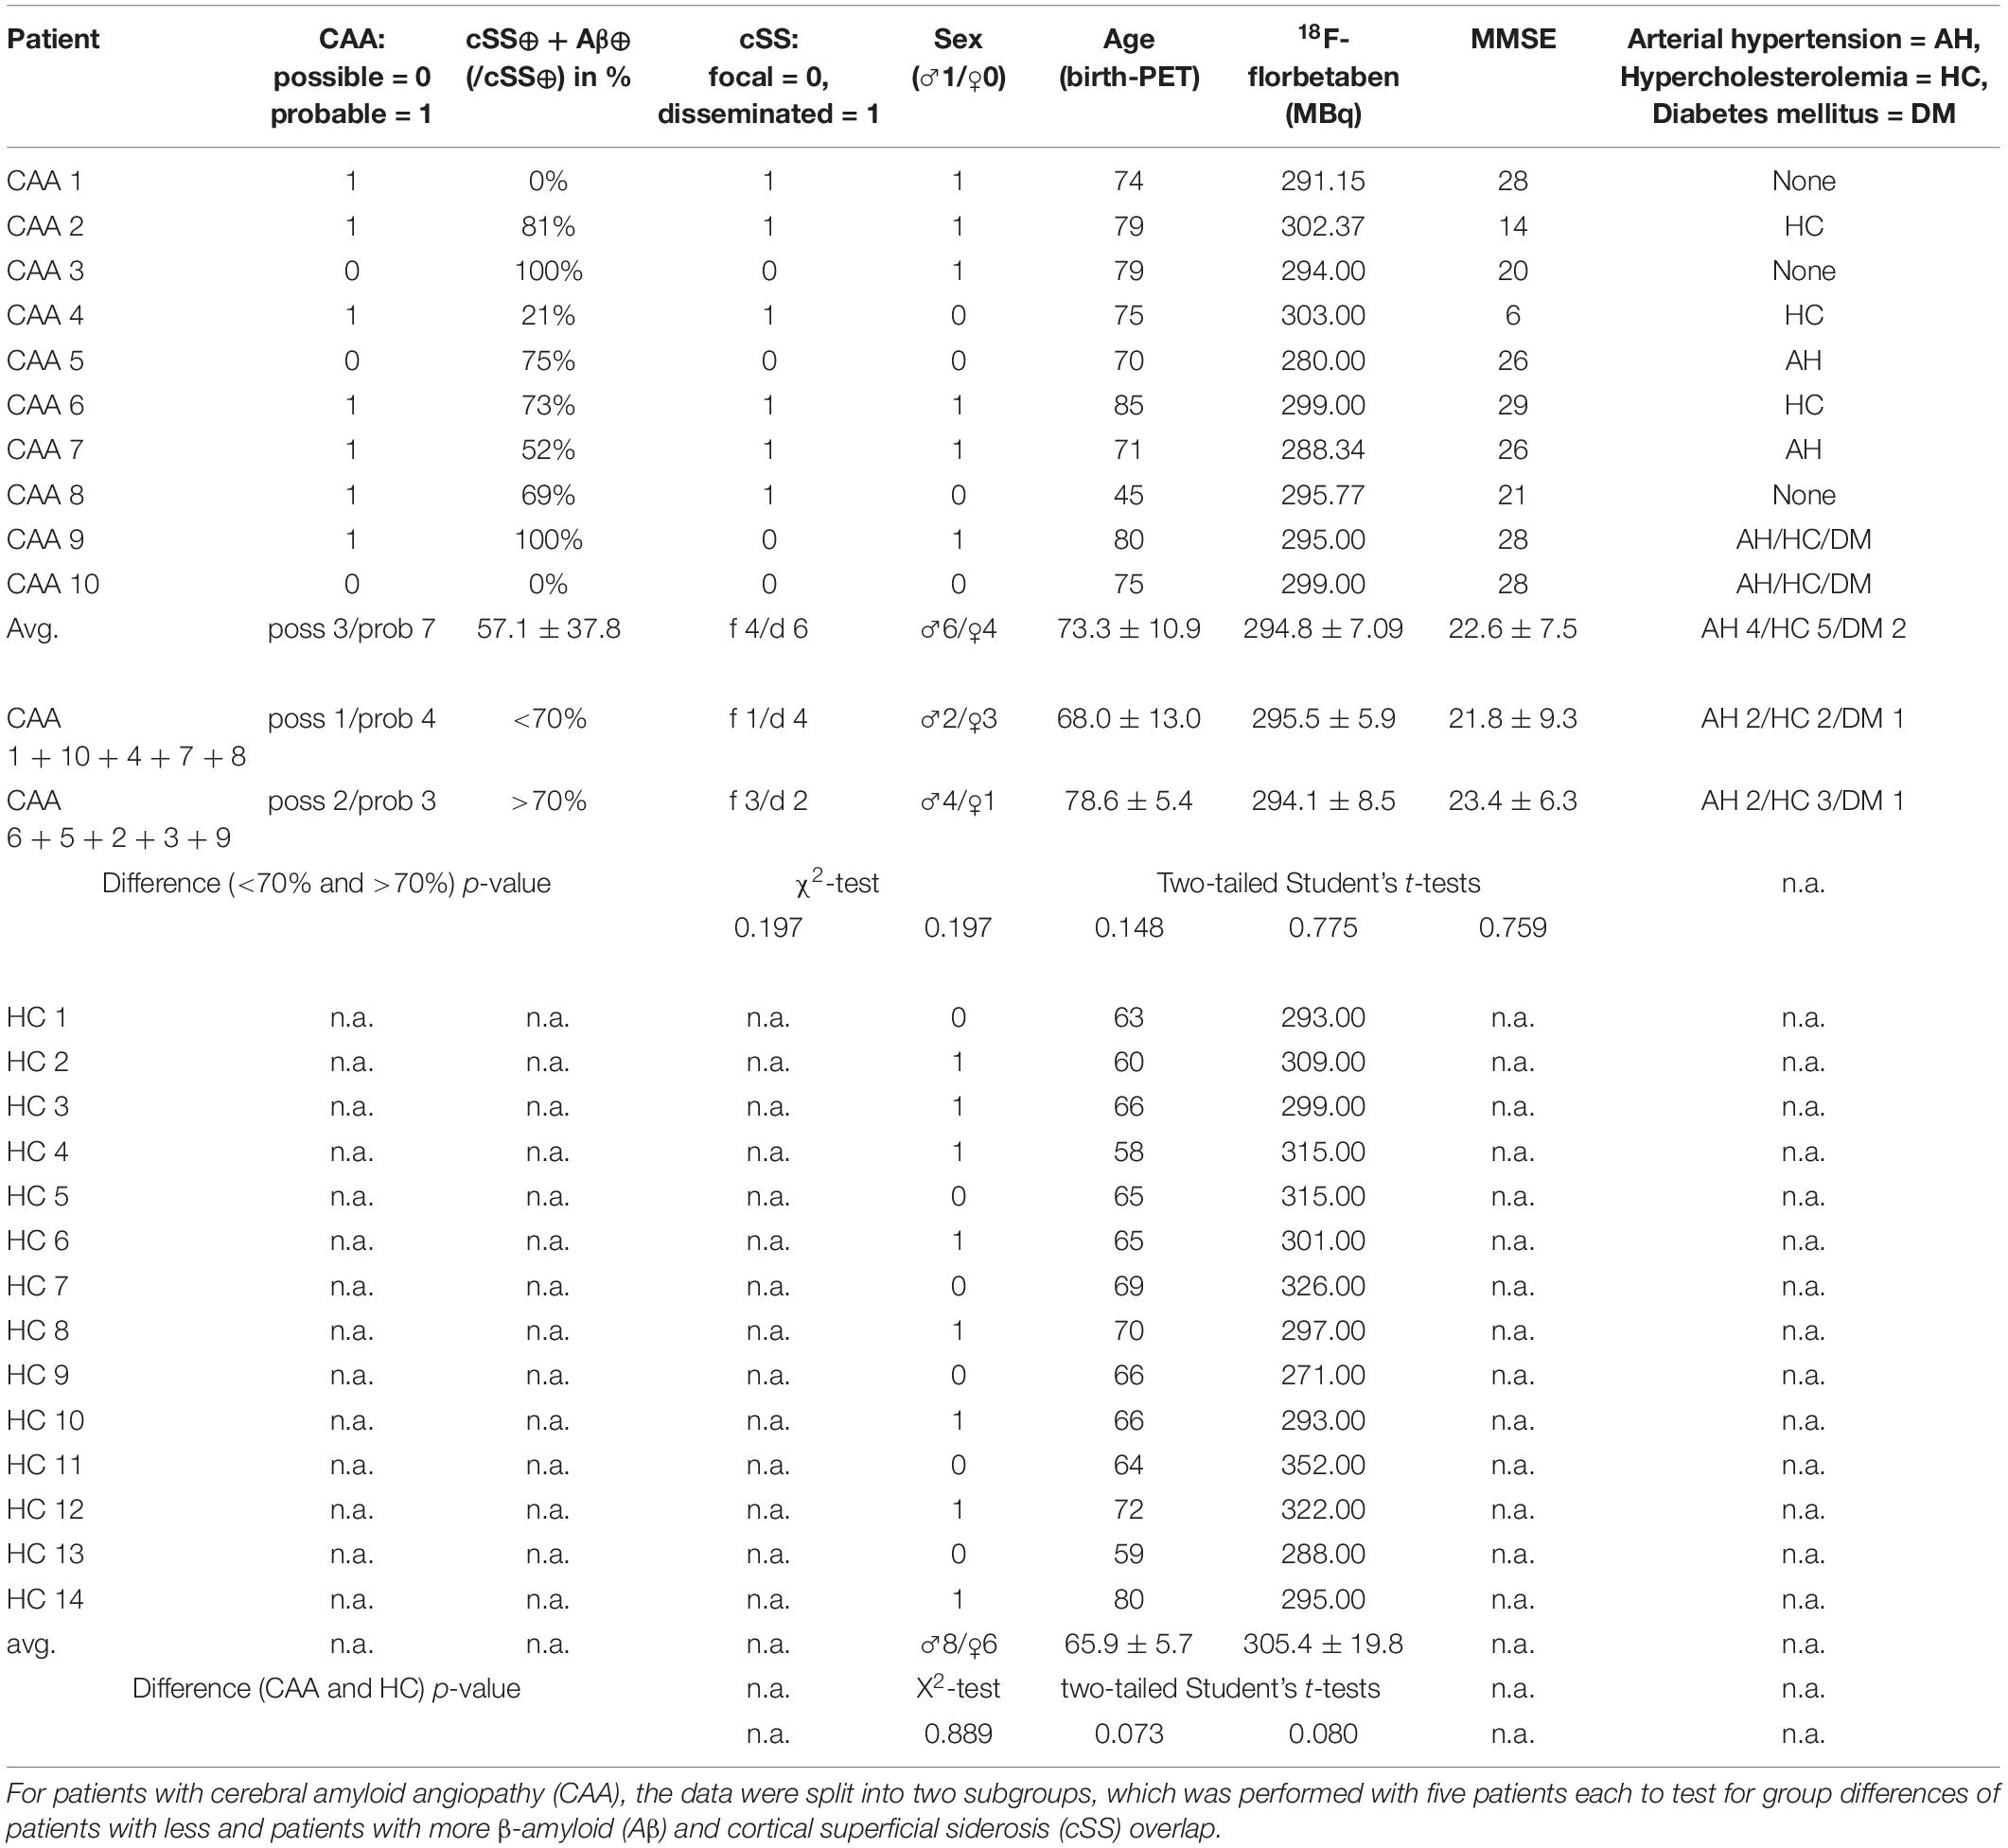
Table 1. Demographics and clinical data of patients and healthy controls (HCs) (same order as Figure 2).
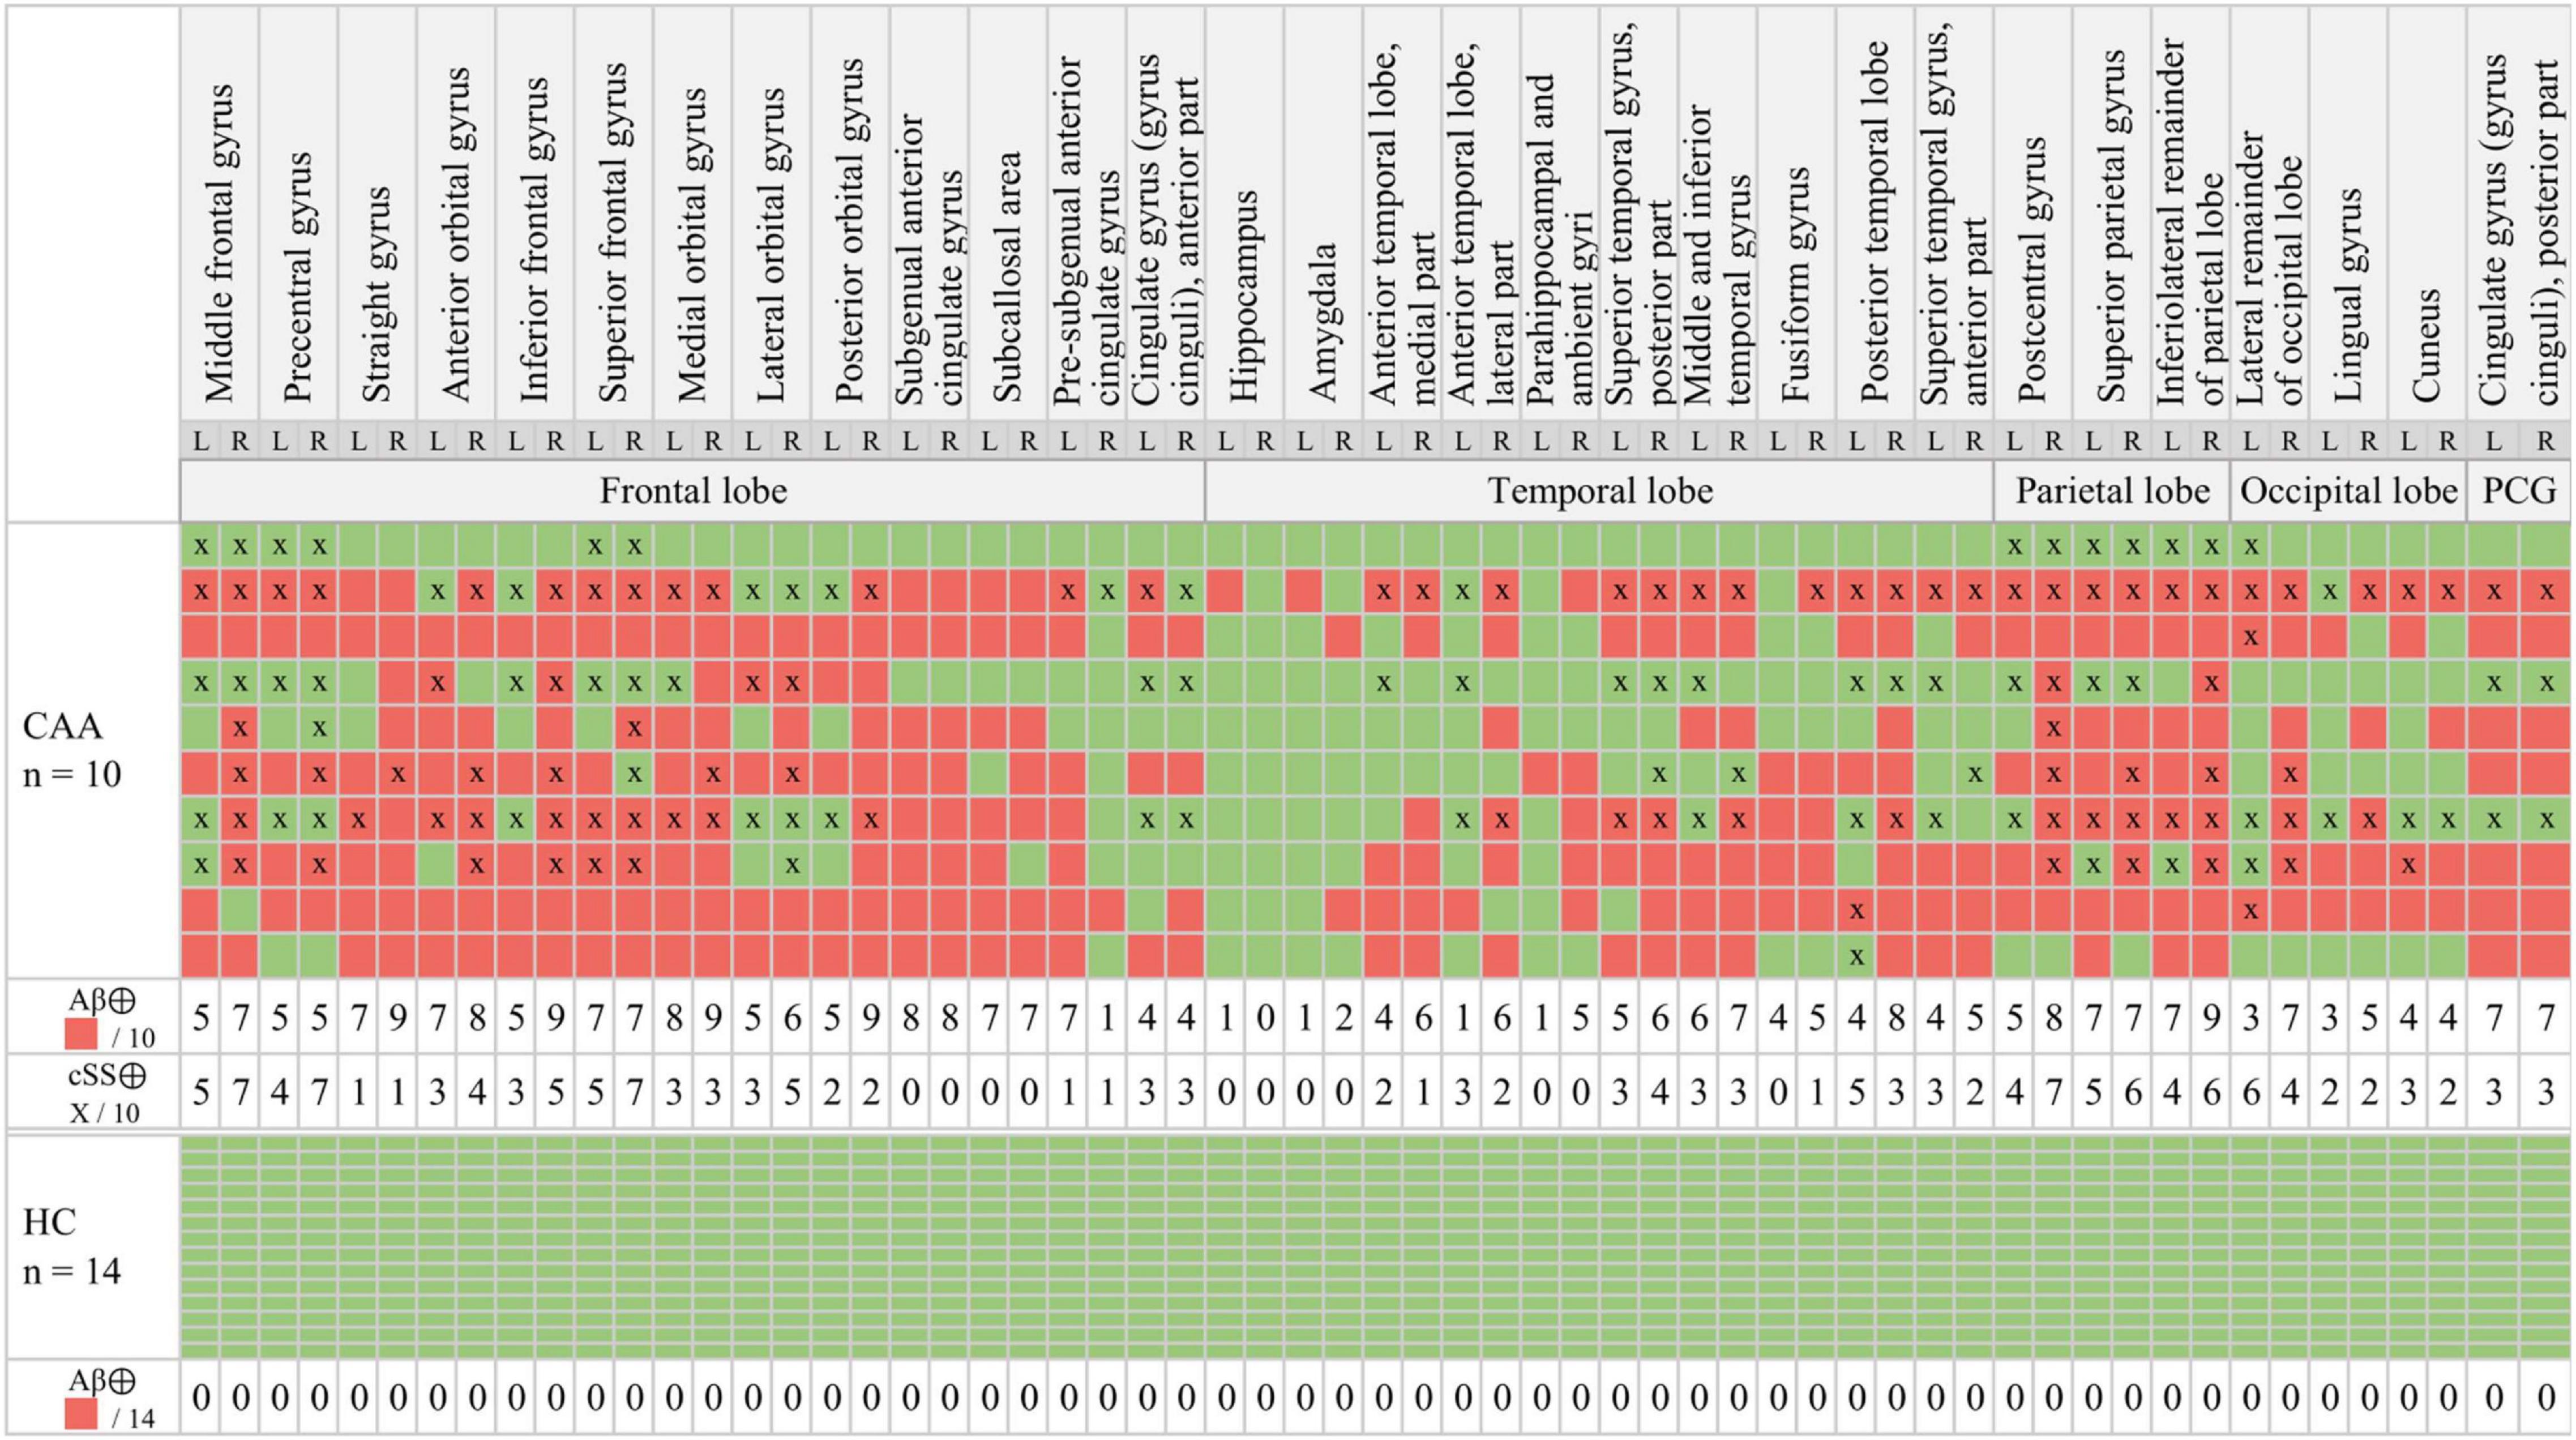
Figure 2. Multiregion classifier. β-amyloid (Aβ): The semiquantitative classification of each brain region (red = Aβ⊕, green = Aβ⊖) was performed by applying a mean value (MV) + 2.5 standard deviations (SDs) threshold obtained from healthy controls (HCs). Cortical superficial siderosis (cSS): cSS⊕ was defined with a probability threshold of 90% (x = cSS⊕).
According to the multiregion classifier (Figure 2), nine patients (9/10 = 90%) showed at least one, and all patients showed an average of 37.0 ± 12.6 Aβ-PET-positive brain regions. Four patients had a focal cSS (≤3 sulci) with a mean of 2.0 ± 1.4 cSS⊕ regions, and the other six patients had a disseminated cSS (>3 sulci) with a mean of 27.0 ± 14.8 cSS⊕ regions (Linn et al., 2010). The patient without any Aβ-positive region was rated with a disseminated cSS on MRI with 13 cSS-positive regions. From a total of 170 cSS⊕ regions in all 10 patients, 40 were observed unilateral, whereas the remaining 130 were observed bilateral (65 in each hemisphere). The frequency of cSS- and Aβ-positive patients (as shown in Figure 2) for each region is plotted in Figure 3A, and Spearman’s Rho analysis showed a slightly significant positive correlation (rs = 0.277, p = 0.032). However, this association was driven by temporal regions characterized by both limited cSS and Aβ-PET positivity (Figure 3B). As shown in Table 2, concurrent cSS- and Aβ-positive atlas regions (94/600 = 15.7%) did not occur more frequently than statistical random distribution. There were no significant differences in patient characteristics among patients with high and low cSS- and Aβ-positive region overlap (Table 1). Transverse brain sections of one CAA patient (female, 75 years) are illustrated in Figure 4.
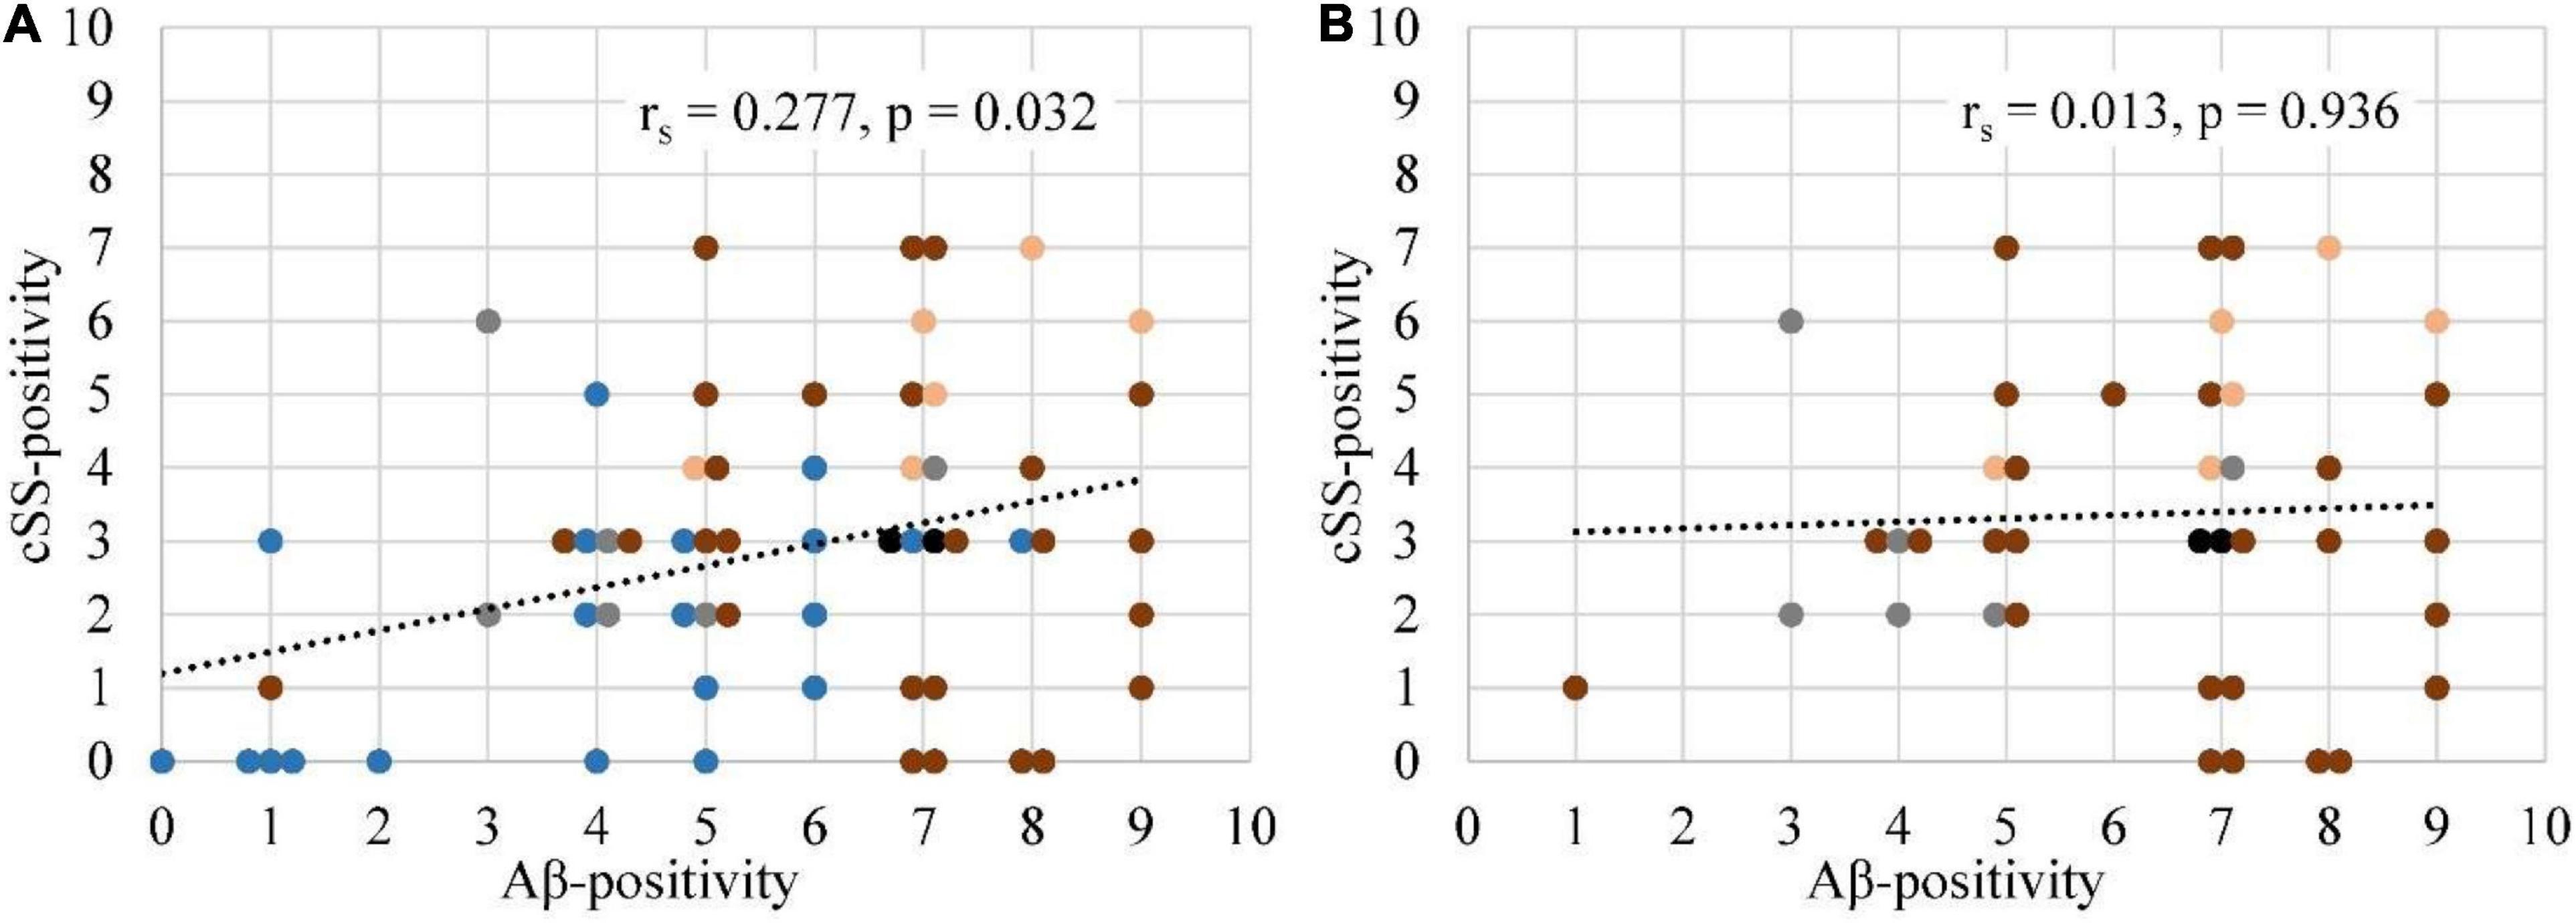
Figure 3. Association between the frequencies of Aβ-PET positivity and cSS positivity. (A) The frequency of Aβ-positive (SUVr ≥ 2.5 SD above the MV of the HCs) patients was correlated with the frequency of cSS-positive (90% probability threshold) patients for all 60 regions. Details are provided in Figure 2. (B) A repeated analysis was performed with the exclusion of temporal regions. The degree of association was calculated by Spearman’s correlation coefficient (rs). If two or more points had the same coordinates, they were slightly scattered in a horizontal plane. Each brain lobe was assigned its own color:  Frontal lobe
  Temporal lobe
  Parietal lobe
  Occipital lobe
  Posterior cingulate gyrus.
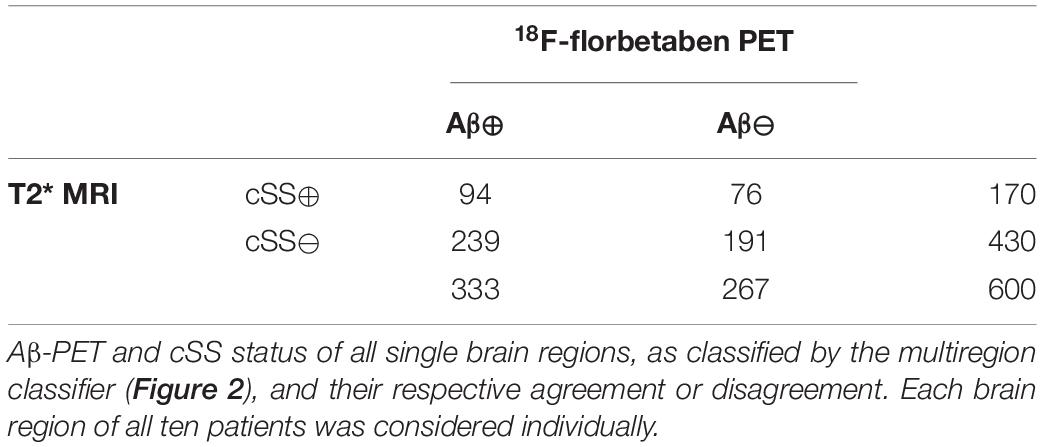
Table 2. Regional Aβ-PET and cSS concordance.
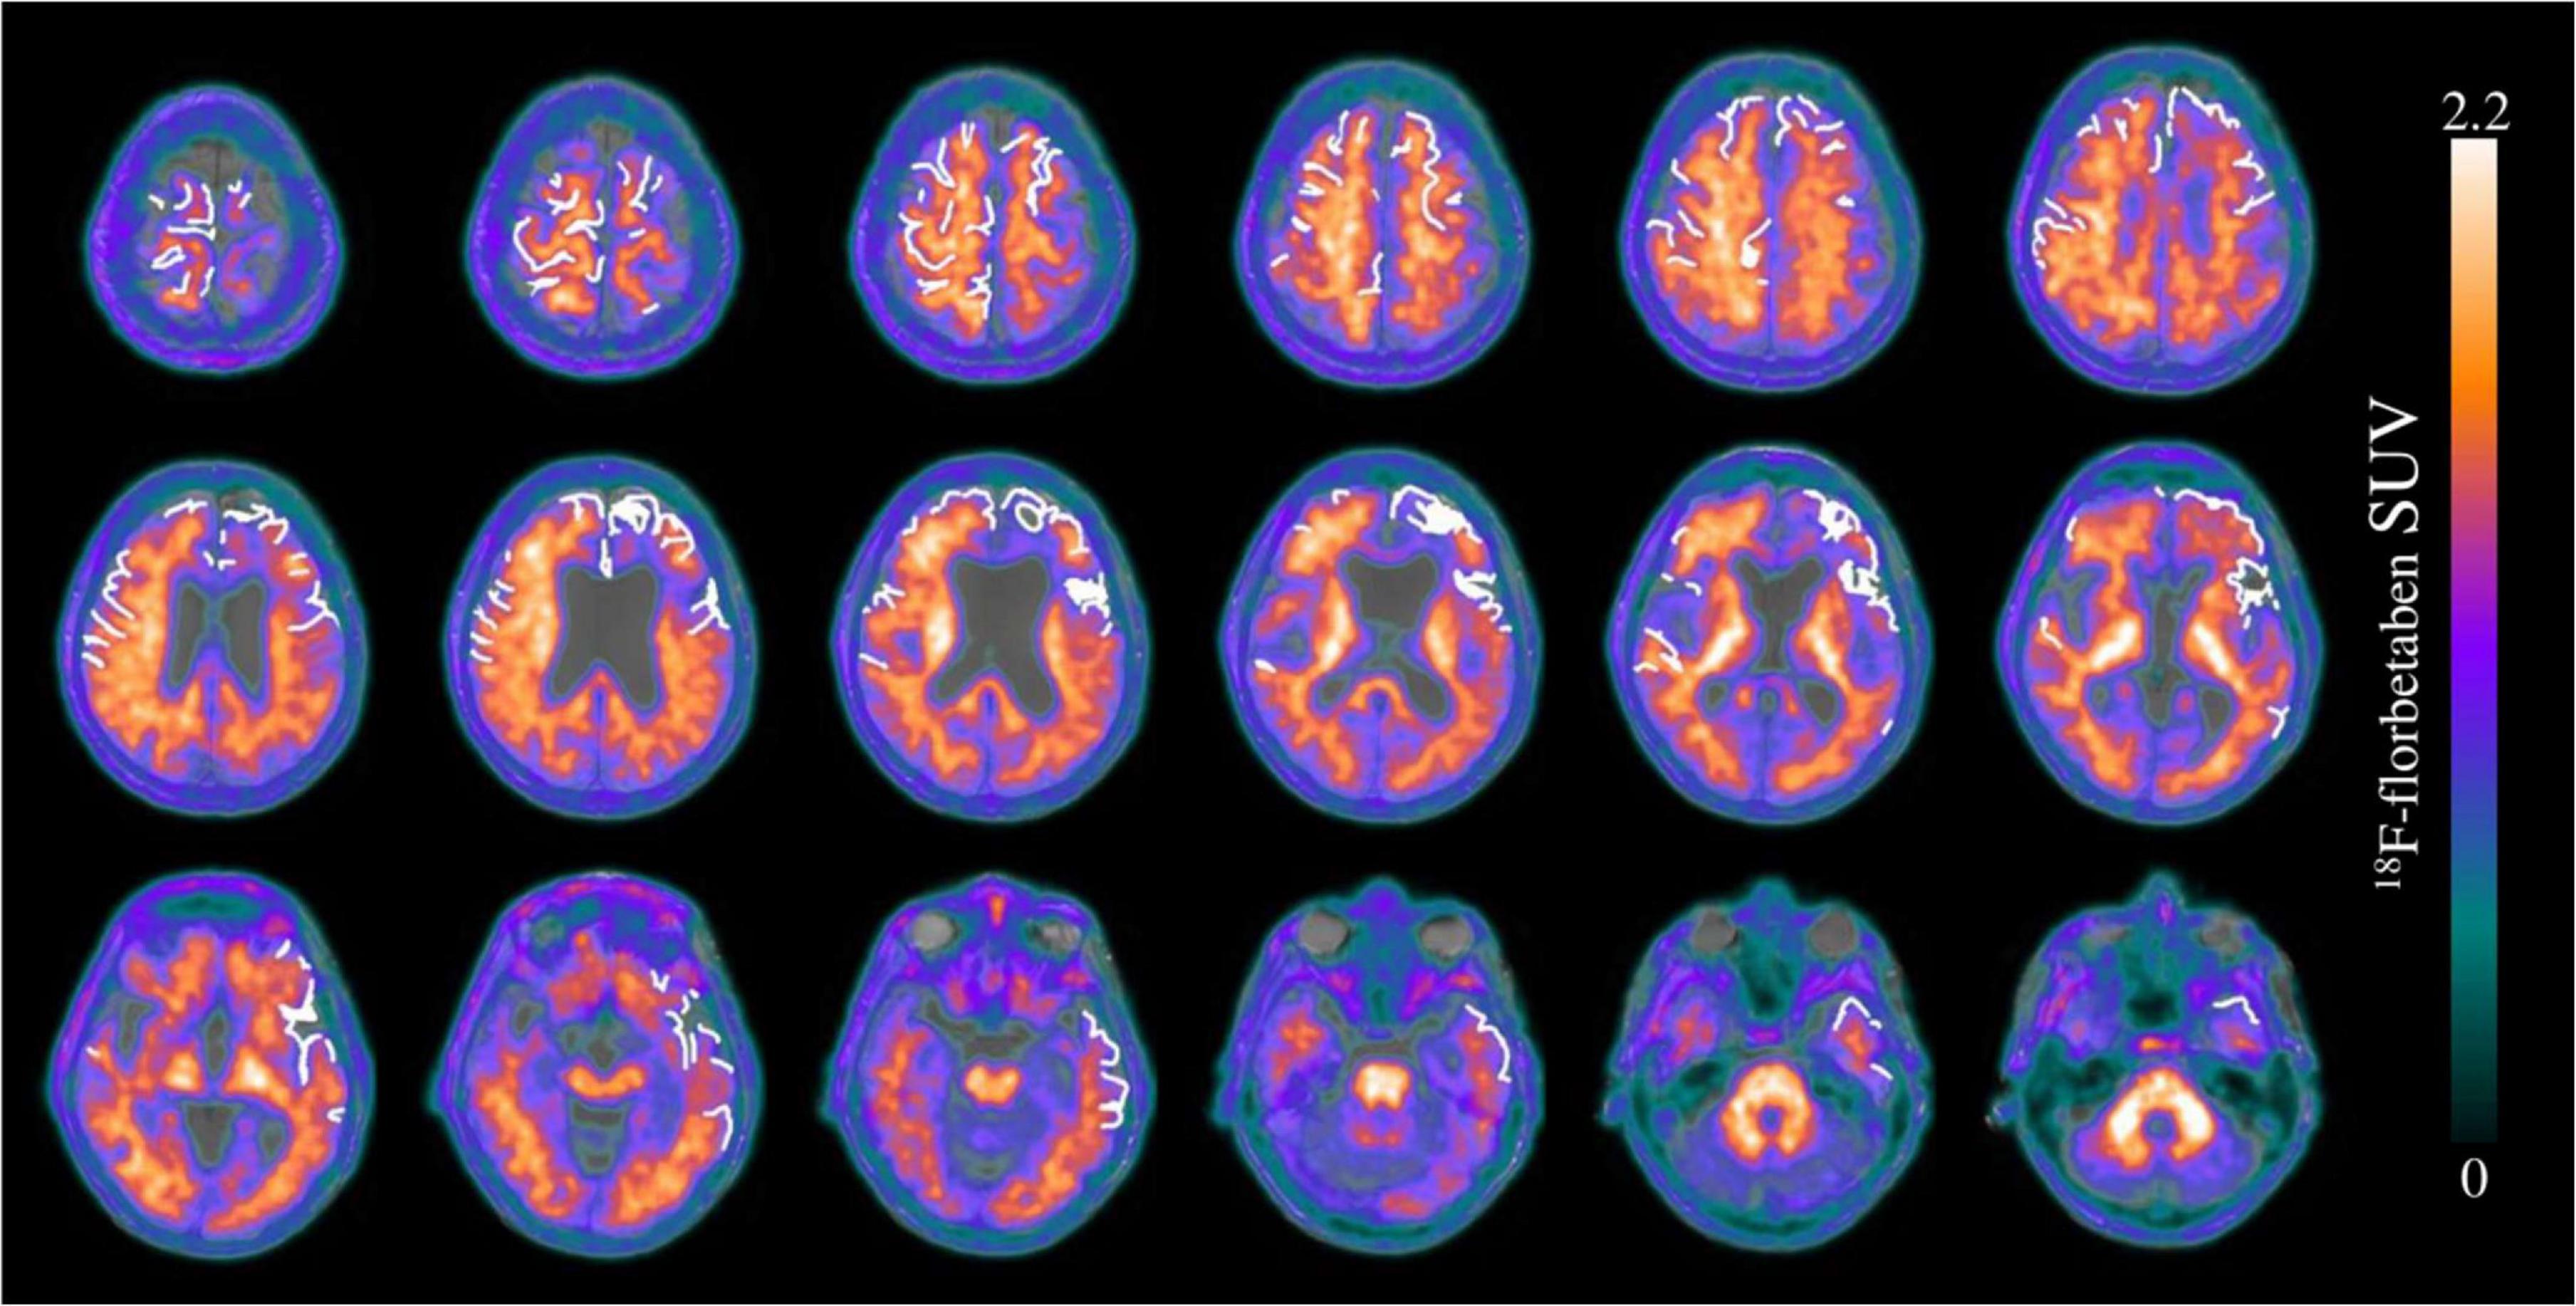
Figure 4. Transverse brain sections of an exemplary patient with cerebral amyloid angiopathy (CAA) (female, 75 years). The superimposition of cSS segmentation (white 0 and 1) and Aβ-PET (SUVr = 0–2.2) on a structural T1 magnetization prepared rapid gradient echo (MPRAGE) MRI sequence. The segmented cSS winded around the gyri and sulci as a linear structure. Since the patient was characterized by more than three affected sulci, cSS was classified as disseminated. A slight right-sided dominance was observed for the Aβ-PET signal, whereas the cSS distribution was left-sided predominantly in the frontal and the temporal lobe.
To substantiate the descriptive results, a detailed quantitative approach was pursued to investigate the regional relationship between cSS and Aβ deposition in more detail. In this study, we tested the SUVr differences between the VOI groups defined earlier. All SUVr MVs and SDs are provided in Table 3A, whereas all p-values of the two-tailed pairwise Student’s t-tests are provided in Table 3B. The results of all composite cerebral lobes (Figure 5A) and the frontal lobe (Figure 5B) are illustrated separately in a boxplot. When analyzing all composite cerebral lobes (n = 151 regions), the group of cSS⊕1 regions revealed significantly lower Aβ SUVr when compared to cSS⊕0 regions (cSS⊕1: 1.462 ± 0.293; cSS⊕0: 1.538 ± 0.265; p < 0.0001), indicating that the tracer uptake was higher in the surrounding brain region of cSS when compared to the direct localization of cSS. This was also reflected by lower SUVr of cSS⊕1 regions when compared to combined cSS⊕ regions (cSS⊕1: 1.462 ± 0.293; cSS⊕: 1.517 ± 0.254; p < 0.001). Thus, we questioned if Aβ SUVr in the vicinity of cSS-positive regions indicates the hypothesized Aβ accumulation due to higher vessel vulnerability. However, we did not find an elevated Aβ SUVr in cSS⊕0 regions when compared to contralateral regions, if they were cSS-negative (= contralateral-to-cSS⊕) (n = 35; cSS⊕0: 1.568 ± 0.300; contralateral-to-cSS⊕: 1.515 ± 0.260; p = 0.603).
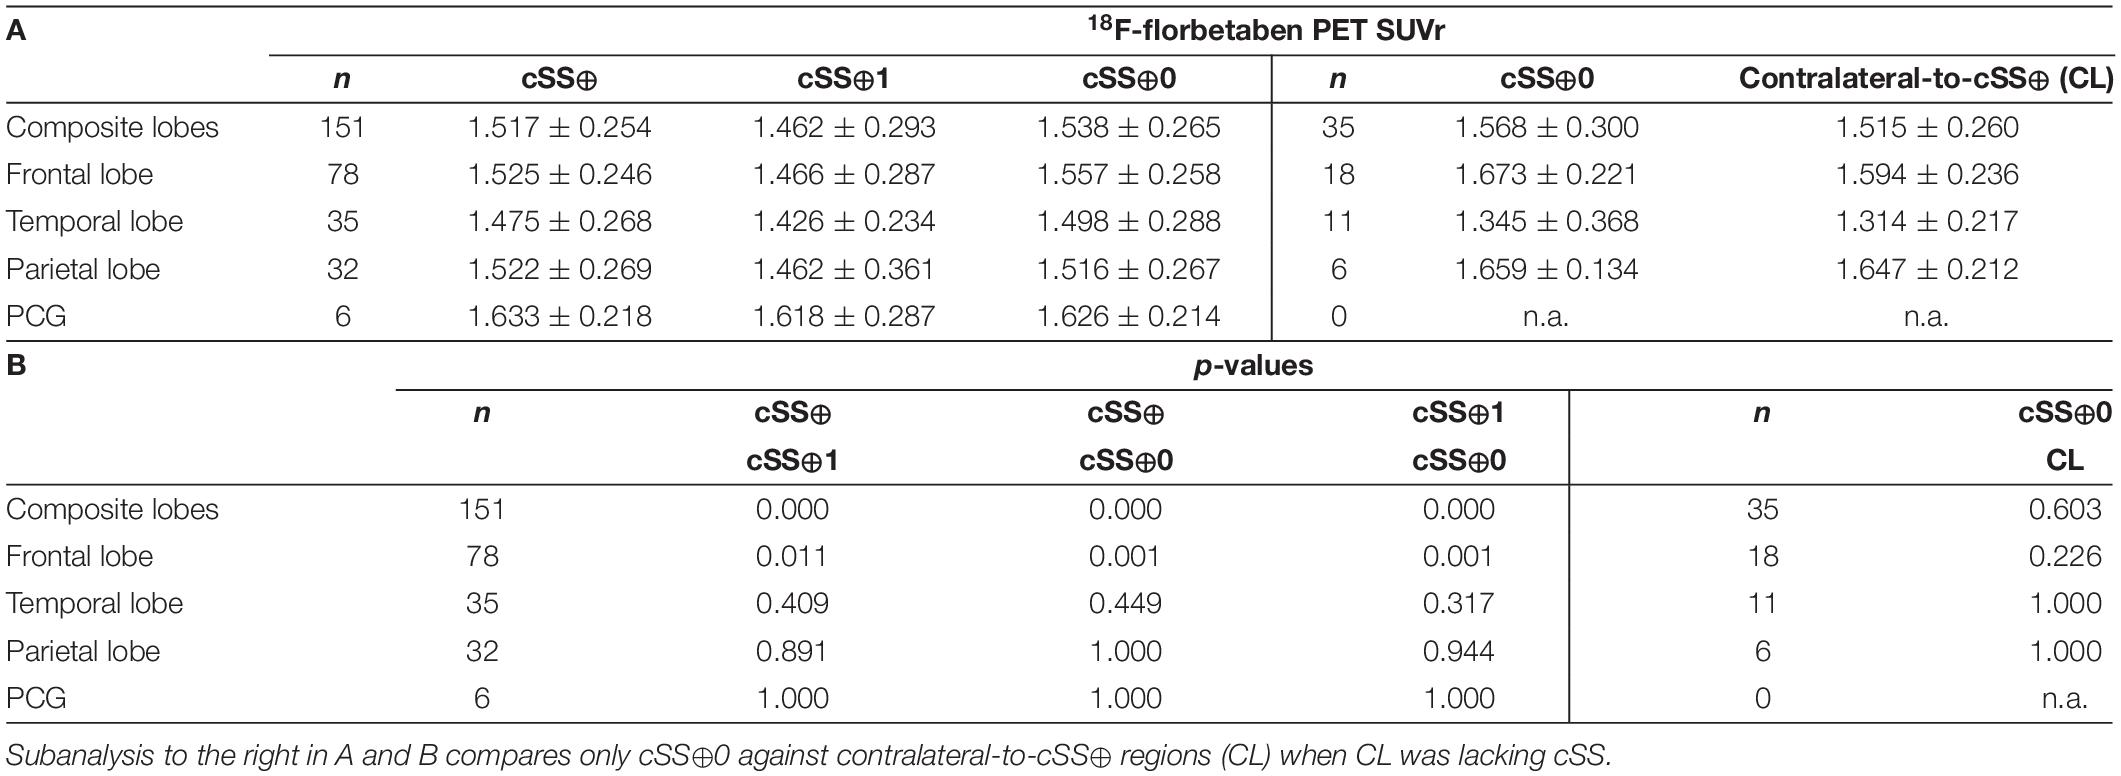
Table 3. 18F-florbetaben PET quantification at group level: (A) Values represent group means (MV) of 18F-florbetaben PET SUVr and their SD and (B) the p-values were derived from two-tailed pairwise Student’s t-tests with false-discovery-rate (FDR) and Bonferroni correction.
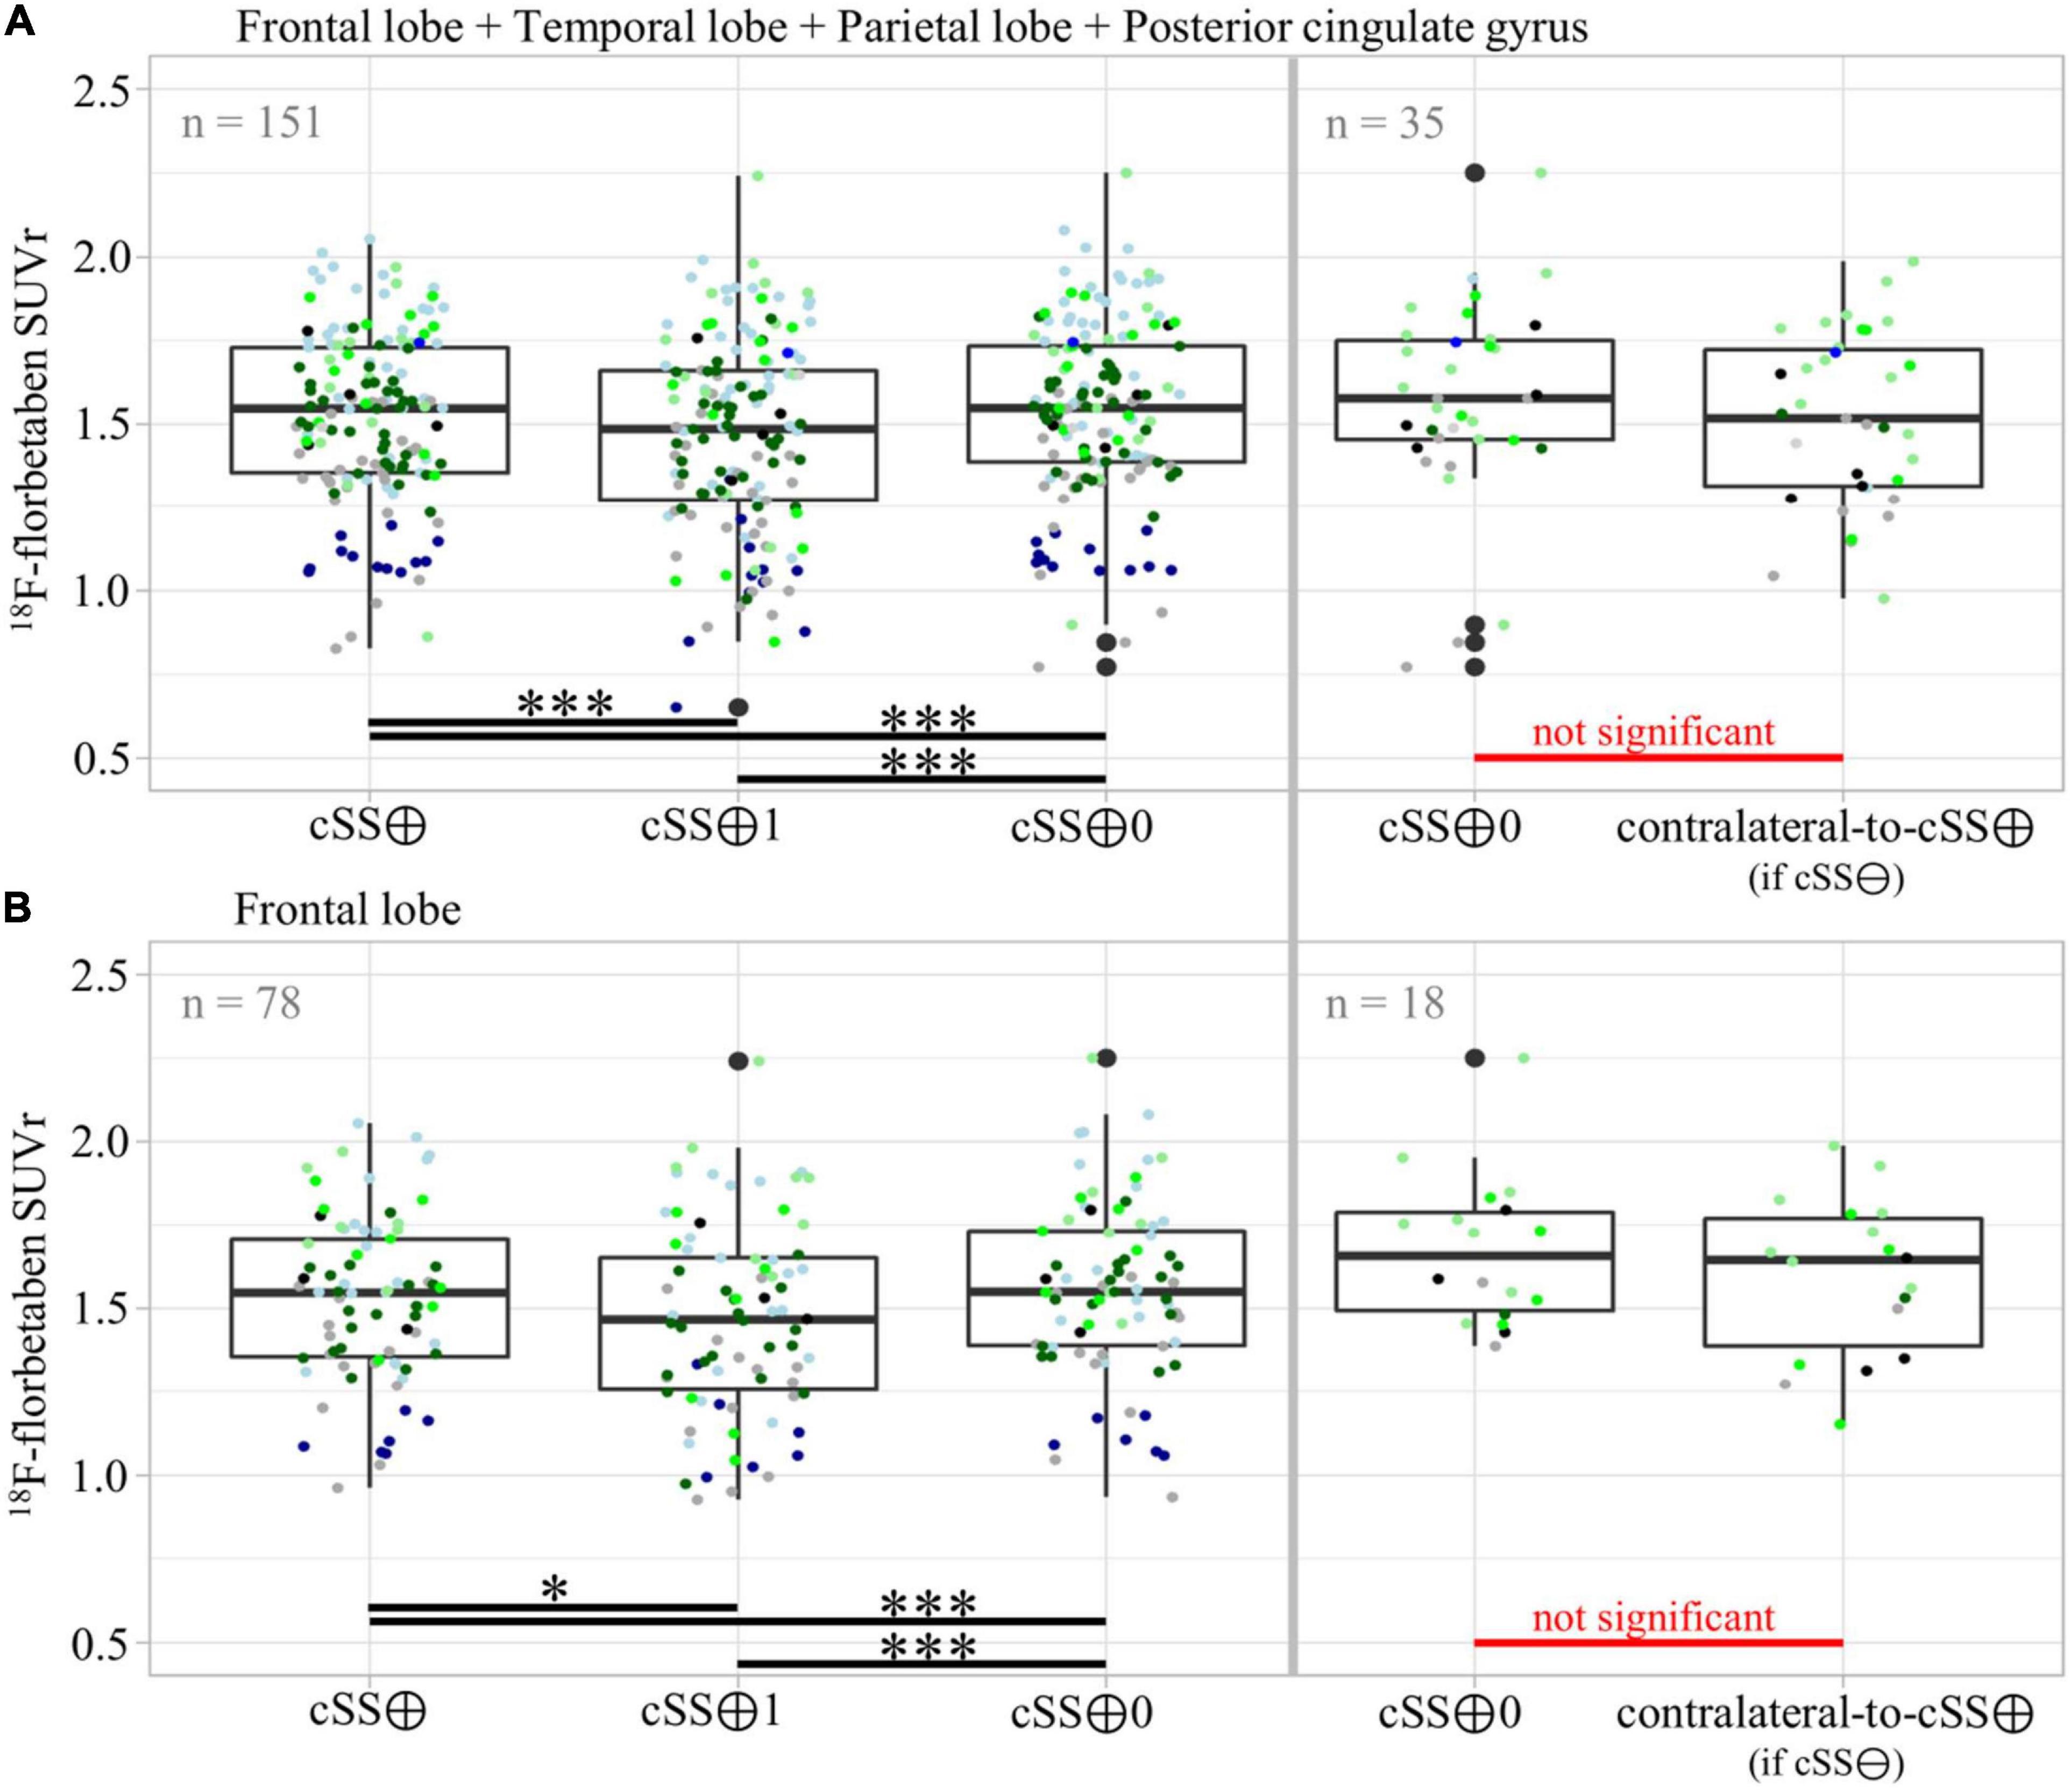
Figure 5. Group differences of Aβ-PET quantification dependent on vicinity to cSS. Pairwise group differences of Aβ-PET SUVr between cSS⊕, cSS⊕1, and cSS⊕0 regions, as well as between cSS⊕0 and contralateral-to-cSS⊕ (if cSS⊖) regions. In (A) all composite cerebral lobes were taken into account, and in (B) the frontal lobe was considered separately. Boxes represent the median, 25th, and 75th percentile. Each of the ten patients was assigned its own color. The descriptive data and respective statistics are listed in Tables 3A,B. Significance levels are indicated by *p < 0.05, ***p < 0.001.
We asked if significant effects could be masked by a combination of regions deriving from different lobes. However, the separate analysis of the frontal lobe (n = 78) still revealed lower Aβ SUVr in cSS⊕1 than in cSS⊕0 regions (cSS⊕1: 1.466 ± 0.287; cSS⊕0: 1.557 ± 0.258; p < 0.001), and these Aβ SUVr were lower than in combined cSS⊕ regions (cSS⊕1: 1.466 ± 0.287; cSS⊕: 1.525 ± 0.246; p < 0.05). We did not find an elevated Aβ SUVr in cSS⊕0 frontal regions when compared to contralateral-to-cSS⊕ regions (n = 18; cSS⊕0: 1.673 ± 0.221; contralateral-to-cSS⊕: 1.594 ± 0.236; p = 0.226). A stand-alone analysis of the temporal lobe, parietal lobe, and posterior cingulate gyrus (PCG) displayed no significant differences between any VOI groups after FDR and Bonferroni correction.
Discussion
Pathogenetic considerations suggest that Aβ accumulation and cSS could have a regional association, and the aim of this study was to evaluate this potential linkage in a cohort of ten CAA patients with cSS pathology and Aβ-PET imaging. We observed that regional Aβ-PET positivity correlated with regional cSS positivity in 60 predefined brain regions. However, concomitant Aβ-PET- and cSS-positive regions did not occur more frequently than expected from a statistical random distribution. Using detailed quantitative segmentation approaches, we explored that brain regions affected by cSS showed decreased Aβ-PET SUVr compared to brain areas in the vicinity to cSS. However, regions in the vicinity to cSS did not show altered Aβ-PET SUVr compared to cSS-negative contralateral brain regions.
For a proper interpretation of our results, the small sample size needs to be considered in detail and as a limitation. One out of the ten patients did not show any Aβ-positive brain region (Figure 2). We used a clear Aβ-negative control cohort with a priori exclusion of outliers in the single regions to ensure sensitivity for Aβ-PET positivity in the single regions of patients with CAA. Thus, we assumed that this single case did not have significant Aβ deposition in the brain. However, all patients were diagnosed with possible or probable CAA according to the modified Boston criteria (Linn et al., 2010), and a positivity rate of 90% fits to previous studies reporting Aβ positivity in patients with probable CAA between 60 and 100% (Jang et al., 2019). The prevalence of CAA increases with age and is associated with dementia syndromes such as AD but often remains asymptomatic until death (Ellis et al., 1996; Keage et al., 2009; Arvanitakis et al., 2011). The age distribution of our study cohort was consistent with the typical age of patients with CAA (Arvanitakis et al., 2011) and was slightly higher than our control group. Only one patient had a CAA atypical age of only 45 years, so a hereditary cause could be considered (O’donnell et al., 2000; Knudsen et al., 2001; Linn et al., 2010). However, this case was not the one without Aβ-positive regions.
As apparent by the analysis of the multiregion classifier (Figure 2), Aβ and cSS affect all cerebral brain lobes. The temporal lobe was less affected by Aβ deposition, which is consistent with the previous literature discussing the occipital lobe as the main CAA localization (Vinters and Gilbert, 1983; Vinters, 1987; Attems et al., 2007, 2011). The cSS of our sample was represented strongest in the parietal lobe and least represented in the temporal lobe. Larger studies refer to the occipital (Shams et al., 2016) or frontal lobe (Zonneveld et al., 2014) as the most cSS-affected lobe, and the temporal lobe, as the less cSS-affected lobe (Zonneveld et al., 2014). Accordingly, previous studies vary as to the main localization of Aβ and cSS, but our sample was in line with the literature. We calculated Spearman’s correlation between the frequency of Aβ-positive patients and the frequency of cSS-positive patients in all 60 atlas regions, showing a slightly positive trend of colocalization (Figure 3). In this study, the temporal lobe showed regions with both low Aβ and low cSS, among them hippocampus and amygdala. Thus, the borderline positive correlation was likely driven by the low positivity rates of both biomarkers in the temporal lobe. This was confirmed by an analysis excluding the temporal lobe, which did not reveal significant colocalization. For an in-depth analysis, we investigated Aβ-PET positivity and cSS in all 600 regions to determine whether Aβ- and cSS positivity are colocalized (Table 2). Since 333 of the 600 regions were Aβ-positive (333/600 = 55.5%) and 170 were cSS-positive (170/600 = 28.3%), we expected 94.4 regions to be both cSS- and Aβ-positive in a statistical random distribution. With 94 out of 600 regions comprising combined cSS- and Aβ positivity, we did not find evidence for a non-random distribution. Similarly, the visual inspection of single cases (Figure 4) did not indicate that increased Aβ deposits are present in direct or immediate vicinity to cSS deposition. This cohort-based finding confirmed the previous case report of one patient from this study (Brendel et al., 2020b).
The atlas-based analysis provided a robust descriptive analysis of cSS and Aβ pathology distribution, but we also applied a methodologically more sophisticated approach to increase sensitivity for colocalization by segmenting the atlas regions. Therefore, we subsegmented all cSS-positive atlas regions (cSS⊕) into a part with only cSS (cSS⊕1) and a part surrounding the cSS but excluding direct cSS (cSS⊕0). The respective contralateral atlas regions were used as a reference group once they were cSS-negative (contralateral-to-cSS⊕). When analyzing all composite brain lobes (Figure 5A) and the frontal lobe separately (Figure 5B), less Aβ-PET signal was observed in regions with only cSS compared to composed atlas regions and compared to cSS surroundings. These group differences were proved to be significant despite rigorous correction for multiple testing. Among other factors, areas with cSS deposits may experience remodeling and structural changes in the brain parenchyma and cortical layers. The structural remodeling also alters the vascular supply and blood flow in the tissue; vessels may recede or be remodeled. This implies that the reduced vascular supply or the reduced cerebral blood flow could underlie the observed SUVr that decreases, since this semiquantitative measure of PET does not account for the alterations of perfusion changes (Berckel et al., 2013). Due to the accumulation of toxic species, not only changes in vascular structures but also neuronal loss and brain atrophy are expected to occur in the vicinity to cSS. In this regard, we did not account for partial-volume-effects (PVE) due to atrophy since our segmentation approach did not fit into available PVE correction models (Brendel et al., 2015). Hence, signal loss due to atrophy could be another confounder of the observed decreased SUVr. Then, the altered plaque morphology in terms of reduced Aβ plaque density could also lead to a reduced signal in PET (Biechele et al., 2021). In this regard, we noted that diffuse and vascular Aβ occurring at cSS sites provides fewer tracer binding sites when compared to cored Aβ plaques which could, in turn, hamper the detection by PET. Further studies with larger cohorts, a longitudinal study design, and complementary immunohistochemical examinations would be desirable to validate our results. Longitudinal studies will be of particular interest to better understand the mechanisms linking the occurrence of amyloid-related imaging abnormalities (ARIA) occurring both spontaneously in CAA-related inflammation with high levels of anti-amyloid autoantibodies (Antolini et al., 2021) and after exposure with monoclonal antibodies against plaque-deposited Aβ of AD immunotherapy (Chantran et al., 2019).
Our results are consistent with recent studies of methodologically different approaches that do not identify Aβ as a key mediator of neurodegeneration after stroke (Hagberg et al., 2020) or do not detect increased Aβ levels in PET in patients with pathologically confirmed CAA burden at the lobar level (McCarter et al., 2021). However, a large-scale population-based study identified a positive association between lobar cerebral microbleeds and Aβ load as assessed by PET, whereas there was no association between deep cerebral microbleeds and Aβ accumulation (Graff-Radford et al., 2019). Furthermore, a recent neuropathological investigation identified associations between advanced CAA in leptomeningeal vessels and cSS (Charidimou et al., 2020). Thus, vascular vulnerability, in general, has associations with Aβ accumulation, but cSS, in particular, does not further increase the regional probability of an elevated Aβ load. The clinical goal of this study was to determine whether there is a diagnostic benefit to look specifically at cSS-affected brain regions when classifying a patient as visually Aβ-positive or -negative. The results of our cohort study suggest that sensitivity for Aβ-PET positivity cannot be increased by considering cSS information from MRI.
Conclusion
The colocalization of Aβ and cSS was not detectable with commonly used PET and MRI methodology in vivo in a small sample of patients with CAA. Therefore, the specific visual judgment of Aβ-PET positivity in cSS-positive regions is probably not a promising approach for the classification of Aβ-PET in patients with CAA.
Data Availability Statement
The raw data supporting the conclusions of this article will be made available by the authors, without undue reservation.
Ethics Statement
The studies involving human participants were reviewed and approved by the Ethics Committee of the Medical Faculty of the Ludwig Maximilian University of Munich. Written informed consent for participation was not required for this study in accordance with the national legislation and the institutional requirements.
Author Contributions
AF contributed to writing, data analyses, and statistical analyses. SS, HW, and JL contributed to MRI data analyses. DJ, KB, FW, and CC contributed to patient recruitment, patient evaluation, and data analyses. AF, AR, PB, and MB contributed to PET scans and PET data analyses. FW, CC, and MB contributed to study design and conception. AF, CC, and MB contributed to writing, drafting, and manuscript conception. All authors added significant scientific input and intellectual content to the manuscript.
Funding
This study was supported by the Deutsche Forschungsgemeinschaft (DFG, German Research Foundation) under Germany’s Excellence Strategy within the framework of the Munich Cluster for Systems Neurology (EXC 2145 SyNergy – ID 390857198).
Conflict of Interest
MB received speaker honoraria from GE Healthcare, Roche and LMI and is an advisor of LMI. AR and PB received speaker honoraria from GE Healthcare. JL received speaker honoraria from Bayer Vital GmbH and is an advisory board member of Mediaire GmbH and Biogen GmbH.
The remaining authors declare that the research was conducted in the absence of any commercial or financial relationships that could be construed as a potential conflict of interest.
Publisher’s Note
All claims expressed in this article are solely those of the authors and do not necessarily represent those of their affiliated organizations, or those of the publisher, the editors and the reviewers. Any product that may be evaluated in this article, or claim that may be made by its manufacturer, is not guaranteed or endorsed by the publisher.
Acknowledgments
We thank all of our patients and their caregivers for making this study possible.
Abbreviations
CAA, cerebral amyloid angiopathy; cSS, cortical superficial siderosis; Aβ, β-amyloid; GRE-T2*-WI, gradient-echo-T2*-weighted-imaging; VOI, volume-of-interest; PVE, partial-volume-effects; SUVr, standardized-uptake-value-(ratio); FDR, false-discovery-rate; HCs, healthy controls; SD, standard deviation; TH, threshold; MV, mean value; MNI, Montreal Neurological Institute; NA, not available; PCG, posterior cingulate gyrus.
References
Antolini, L., Difrancesco, J. C., Zedde, M., Basso, G., Arighi, A., Shima, A., et al. (2021). Spontaneous ARIA-like Events in Cerebral Amyloid Angiopathy-Related Inflammation: a Multicenter Prospective Longitudinal Cohort Study. Neurology 97, e1809–e1822. doi: 10.1212/WNL.0000000000012778
Armstrong, R. A. (2014). Review: when to use the Bonferroni correction. Ophthalmic. Physiol. Opt. 34, 502–508. doi: 10.1111/opo.12131
Arvanitakis, Z., Leurgans, S. E., Wang, Z., Wilson, R. S., Bennett, D. A., and Schneider, J. A. (2011). Cerebral amyloid angiopathy pathology and cognitive domains in older persons. Annals. Neurol. 69, 320–327. doi: 10.1002/ana.22112
Attems, J., Jellinger, K., Thal, D. R., and Van Nostrand, W. (2011). Review: sporadic cerebral amyloid angiopathy. Neuropathol. Appl. Neurobiol. 37, 75–93.
Attems, J., Quass, M., Jellinger, K. A., and Lintner, F. (2007). Topographical distribution of cerebral amyloid angiopathy and its effect on cognitive decline are influenced by Alzheimer disease pathology. J. Neurol. Sci. 257, 49–55. doi: 10.1016/j.jns.2007.01.013
Barthel, H., Gertz, H. J., Dresel, S., Peters, O., Bartenstein, P., Buerger, K., et al. (2011). Cerebral amyloid-β PET with florbetaben (18F) in patients with Alzheimer’s disease and healthy controls: a multicentre phase 2 diagnostic study. Lancet Neurol. 10, 424–435. doi: 10.1016/S1474-4422(11)70077-1
Benjamini, Y., and Hochberg, Y. (1995). Controlling the False Discovery Rate: a Practical and Powerful Approach to Multiple Testing. J. Royal Stat. Soc. 57, 289–300.
Berckel, B. N. M. V., Ossenkoppele, R., Tolboom, N., Yaqub, M., Foster-Dingley, J. C., Windhorst, A. D., et al. (2013). Longitudinal Amyloid Imaging Using 11C-PiB: methodologic Considerations. J. Nucl. Med. 54, 1570–1576. doi: 10.2967/jnumed.112.113654
Biechele, G., Sebastian Monasor, L., Wind, K., Blume, T., Parhizkar, S., Arzberger, T., et al. (2021). Glitter in the Darkness? Non-fibrillar β-amyloid Plaque Components Significantly Impact the β-amyloid PET Signal in Mouse Models of Alzheimer’s Disease. J. Nucl Med. [Epub online ahead of print] doi: 10.2967/jnumed.120.261858
Brendel, M., Barthel, H., Van Eimeren, T., Marek, K., Beyer, L., Song, M., et al. (2020a). Assessment of 18F-PI-2620 as a Biomarker in Progressive Supranuclear Palsy. JAMA Neurol. 77, 1408–1419. doi: 10.1001/jamaneurol.2020.2526
Brendel, M., Catak, C., Beyer, L., Linn, J., Wahl, H., Janowitz, D., et al. (2020b). Colocalization of Tau but Not beta-Amyloid with Cortical Superficial Siderosis in a Case with Probable CAA. Case. Rep. Neurol. 12, 232–237. doi: 10.1159/000506765
Brendel, M., Hogenauer, M., Delker, A., Sauerbeck, J., Bartenstein, P., Seibyl, J., et al. (2015). Improved longitudinal [(18)F]-AV45 amyloid PET by white matter reference and VOI-based partial volume effect correction. Neuroimage 108, 450–459. doi: 10.1016/j.neuroimage.2014.11.055
Cadavid, D., Mena, H., Koeller, K., and Frommelt, R. A. (2000). Cerebral beta amyloid angiopathy is a risk factor for cerebral ischemic infarction. A case control study in human brain biopsies. J. Neuropathol. Exp. Neurol. 59, 768–773. doi: 10.1093/jnen/59.9.768
Chantran, Y., Capron, J., Alamowitch, S., and Aucouturier, P. (2019). Anti-Abeta Antibodies and Cerebral Amyloid Angiopathy Complications. Front. Immunol. 10:1534. doi: 10.3389/fimmu.2019.01534/full
Charidimou, A., Gang, Q., and Werring, D. J. (2012). Review: sporadic cerebral amyloid angiopathy revisited: recent insights into pathophysiology and clinical spectrum. J. Neurol. Neurosurg. Psychiatry 83, 124–137. doi: 10.1136/jnnp-2011-301308
Charidimou, A., Jager, R. H., Fox, Z., Peeters, A., Vandermeeren, Y., Laloux, P., et al. (2013a). Prevalence and mechanisms of cortical superficial siderosis in cerebral amyloid angiopathy. Neurology 81, 626–632. doi: 10.1212/WNL.0b013e3182a08f2c
Charidimou, A., Peeters, A. P., Jager, R., Fox, Z., Vandermeeren, Y., Laloux, P., et al. (2013b). Cortical superficial siderosis and intracerebral hemorrhage risk in cerebral amyloid angiopathy. Neurology 81, 1666–1673. doi: 10.1212/01.wnl.0000435298.80023.7a
Charidimou, A., Perosa, V., Frosch, M. P., Scherlek, A. A., Greenberg, S. M., and Van Veluw, S. J. (2020). Neuropathological correlates of cortical superficial siderosis in cerebral amyloid angiopathy. Brain 143, 3343–3351. doi: 10.1093/brain/awaa266
Clark, C. M., Schneider, J. A., Bedell, B. J., Beach, T. G., Bilker, W. B., Mintun, M. A., et al. (2011). Use of florbetapir-PET for imaging β-amyloid pathology. JAMA 305, 275–283.
Collins, D. L., Neelin, P., Peters, T. M., and Evans, A. C. (1994). Automatic 3d intersubject registration of mr volumetric data in standardized talairach space. J. Comput. Assist Tomogr. 18, 192–205.
Curtis, C., Gamez, J. E., Singh, U., Sadowsky, C. H., Villena, T., Sabbagh, M. N., et al. (2015). Phase 3 trial of flutemetamol labeled with radioactive fluorine 18 imaging and neuritic plaque density. JAMA Neurol. 72, 287–294. doi: 10.1001/jamaneurol.2014.4144
Ellis, R. J., Olichney, J. M., Thal, L. J., Mirra, S. S., Morris, J. C., Beekly, D., et al. (1996). Cerebral amyloid angiopathy in the brains of patients with Alzheimer’s disease: the CERAD experience, part XV. Neurology 46, 1592–1596. doi: 10.1212/wnl.46.6.1592
Evans, A. C., Collins, D. L., and Milner, B. (1993). “3D statistical neuroanatomical models from 305 MRI volumes,” in Proc. IEEE-Nuclear Science Symposium and Medical Imaging Conference. (New York, NY: IEEE).
Gousias, I. S., Rueckert, D., Heckemann, R. A., Dyet, L. E., Boardman, J. P., Edwards, A. D., et al. (2008). Automatic segmentation of brain MRIs of 2-year-olds into 83 regions of interest. NeuroImage 40, 672–684. doi: 10.1016/j.neuroimage.2007.11.034
Graff-Radford, J., Botha, H., Rabinstein, A. A., Gunter, J. L., Przybelski, S. A., Lesnick, T., et al. (2019). Cerebral microbleeds: prevalence and relationship to amyloid burden. Neurology 92, e253–e262. doi: 10.1212/WNL.0000000000006780
Hagberg, G., Ihle-Hansen, H., Fure, B., Thommessen, B., Ihle-Hansen, H., Oksengard, A. R., et al. (2020). No evidence for amyloid pathology as a key mediator of neurodegeneration post-stroke - a seven-year follow-up study. BMC. Neurol. 20:174. doi: 10.1186/s12883-020-01753-w
Hammers, A., Allom, R., Koepp, M. J., Free, S. L., Myers, R., Lemieux, L., et al. (2003). Three-dimensional maximum probability atlas of the human brain, with particular reference to the temporal lobe. Hum. Brain. Mapp 19, 224–247. doi: 10.1002/hbm.10123
Hammers, A., Allom, R., Myers, R., Lemieux, L., Duncan, J. S., and Brooks, D. J. (2008). Imperial-College-of-Science-Technology-and-Medicine Three-dimensional maximum probability atlas of the human brain. Available Online at http://brain-development.org [accessed October 21, 2019]
Itoh, Y., Yamada, M., Hayakawa, M., Otomo, E., and Miyatake, T. (1993). Cerebral amyloid angiopathy: a significant cause of cerebellar as well as lobar cerebral hemorrhage in the elderly. J. Neurol. Sci. 116, 135–141. doi: 10.1016/0022-510x(93)90317-r
Jang, H., Jang, Y. K., Kim, H. J., Werring, D. J., Lee, J. S., Choe, Y. S., et al. (2019). Clinical significance of amyloid beta positivity in patients with probable cerebral amyloid angiopathy markers. Eur. J. Nucl. Med. Mol. Imaging 46, 1287–1298. doi: 10.1007/s00259-019-04314-7
Keage, H. A. D., Carare, R. O., Friedland, R. P., Ince, P. G., Love, S., Nicoll, J. A., et al. (2009). Review: population studies of sporadic cerebral amyloid angiopathy and dementia: a systematic review. BMC Neurol. 9:3. doi: 10.1186/1471-2377-9-3
Knudsen, K. A., Rosand, J., Karluk, D., and Greenberg, S. M. (2001). Clinical diagnosis of cerebral amyloid angiopathy: validation of the boston criteria. Neurology 56, 537–539.
Kumar, N. (2010). Review: neuroimaging in superficial siderosis: an in-depth look. Am. J. Neuroradiol. 31, 5–14. doi: 10.3174/ajnr.A1628
Linn, J., Halpin, A., Demaerel, P., Ruhland, J., Giese, A. D., Dichgans, M., et al. (2010). Prevalence of superficial siderosis in patients with cerebral amyloid angiopathy. Neurology 74, 1346–1350.
Linn, J., Herms, J., Dichgans, M., Brückmann, H., Fesl, G., Freilinger, T., et al. (2008). Subarachnoid hemosiderosis and superficial cortical hemosiderosis in cerebral amyloid angiopathy. Am. J. Neuroradiol. 29, 184–186. doi: 10.3174/ajnr.A0783
Linn, J., Wollenweber, F. A., Lummel, N., Bochmann, K., Pfefferkorn, T., Gschwendtner, A., et al. (2013). Superficial siderosis is a warning sign for future intracranial hemorrhage. J. Neurol. 260, 176–181. doi: 10.1007/s00415-012-6610-7
McCarter, S. J., Lesnick, T. G., Lowe, V., Mielke, M. M., Constantopoulos, E., Rabinstein, A. A., et al. (2021). Cerebral Amyloid Angiopathy Pathology and Its Association With Amyloid-β PET Signal. Neurology 97, e1799–e1808.
Montreal Neurological Institute (2012). The MNI Brain and the Talairach atlas. Available Online at: http://www.bic.mni.mcgill.ca/ServicesAtlases/MNI305 [accessed October 21, 2019].
Nakata-Kudo, Y., Mizuno, T., Yamada, K., Shiga, K., Yoshikawa, K., Mori, S., et al. (2006). Microbleeds in Alzheimer disease are more related to cerebral amyloid angiopathy than cerebrovascular disease. Dement. Geriatr. Cogn. Disord. 22, 8–14. doi: 10.1159/000092958
O’donnell, H. C., Rosand, J., Knudsen, K. A., Furie, K. L., Segal, A. Z., Chiu, R. I., et al. (2000). Apolipoprotein E genotype and the risk of recurrent lobar intracerebral hemorrhage. N. Engl. J. Med. 342, 240–245. doi: 10.1056/NEJM200001273420403
Olichney, J. M., Hansen, L. A., Hofstetter, C. R., Grundman, M., Katzman, R., and Thal, L. J. (1995). Cerebral infarction in Alzheimer’s disease is associated with severe amyloid angiopathy and hypertension. Arch. Neurol. 52, 702–708. doi: 10.1001/archneur.1995.00540310076019
Qureshi, A. I., Mendelow, A. D., and Hanley, D. F. (2009). Review: intracerebral haemorrhage. Lancet 373, 1632–1644.
Qureshi, A. I., Tuhrim, S., Broderick, J. P., Batjer, H. H., Hondo, H., and Hanley, D. F. (2001). Spontaneous Intracerebral Hemorrhage. N. Engl. J. Med. 344, 1450–1460.
Sabri, O., Sabbagh, M. N., Seibyl, J., Barthel, H., Akatsu, H., Ouchi, Y., et al. (2015). Florbetaben PET imaging to detect amyloid beta plaques in Alzheimer’s disease: phase 3 study. Alzheimer’s Dement. 11, 964–974. doi: 10.1016/j.jalz.2015.02.004
Shams, S., Martola, J., Charidimou, A., Cavallin, L., Granberg, T., Shams, M., et al. (2016). Cortical superficial siderosis: prevalence and biomarker profile in a memory clinic population. Neurology 87, 1110–1117. doi: 10.1212/WNL.0000000000003088
Thal, D. R., Capetillo-Zarate, E., Larionov, S., Staufenbiel, M., Zurbruegg, S., and Beckmann, N. (2009). Capillary cerebral amyloid angiopathy is associated with vessel occlusion and cerebral blood flow disturbances. Neurobiol. Aging 30, 1936–1948. doi: 10.1016/j.neurobiolaging.2008.01.017
Tustison, N. J., Avants, B. B., Cook, P. A., Zheng, Y., Egan, A., Yushkevich, P. A., et al. (2010). N4ITK: improved N3 bias correction. IEEE Trans. Med. Imaging 29, 1310–1320. doi: 10.1109/TMI.2010.2046908
Vinters, H. V. (1987). Review: cerebral amyloid angiopathy. A critical review. Stroke 18, 311–324. doi: 10.1161/01.str.18.2.311
Vinters, H. V., and Gilbert, J. J. (1983). Cerebral amyloid angiopathy: incidence and complications in the aging brain. II. The distribution of amyloid vascular changes. Stroke 14, 924–928. doi: 10.1161/01.str.14.6.924
Wollenweber, F. A., Opherk, C., Zedde, M., Catak, C., Malik, R., Duering, M., et al. (2019). Prognostic relevance of cortical superficial siderosis in cerebral amyloid angiopathy. Neurology 92, e792–e801. doi: 10.1212/WNL.0000000000006956
Wollenweber, F. A., Zietemann, V., Rominger, A., Opherk, C., Bayer-Karpinska, A., Gschwendtner, A., et al. (2014). The Determinants of Dementia After Stroke (DEDEMAS) Study: protocol and pilot data. Int. J. Stroke. 9, 387–392. doi: 10.1111/ijs.12092
Yushkevich, P. A., Piven, J., Hazlett, H. C., Smith, R. G., Ho, S., Gee, J. C., et al. (2004). ITK-SNAP. Available Online at: www.itksnap.org [accessed October 21, 2019]
Keywords: cerebral amyloid angiopathy, cortical superficial siderosis, β-amyloid, positron-emission-tomography, magnetic-resonance-imaging, topology, colocalization
Citation: Finze A, Wahl H, Janowitz D, Buerger K, Linn J, Rominger A, Stöcklein S, Bartenstein P, Wollenweber FA, Catak C and Brendel M (2022) Regional Associations of Cortical Superficial Siderosis and β-Amyloid-Positron-Emission-Tomography Positivity in Patients With Cerebral Amyloid Angiopathy. Front. Aging Neurosci. 13:786143. doi: 10.3389/fnagi.2021.786143
Received: 29 September 2021; Accepted: 20 December 2021;
Published: 03 February 2022.
Edited by:
Salvatore Spina, University of California, San Francisco, United StatesReviewed by:
Shannon Risacher, Indiana University Bloomington, United StatesFabrizio Piazza, University of Milano-Bicocca, Italy
Copyright © 2022 Finze, Wahl, Janowitz, Buerger, Linn, Rominger, Stöcklein, Bartenstein, Wollenweber, Catak and Brendel. This is an open-access article distributed under the terms of the Creative Commons Attribution License (CC BY). The use, distribution or reproduction in other forums is permitted, provided the original author(s) and the copyright owner(s) are credited and that the original publication in this journal is cited, in accordance with accepted academic practice. No use, distribution or reproduction is permitted which does not comply with these terms.
*Correspondence: Matthias Brendel, Matthias.Brendel@med.unimuenchen.de
†These authors share senior authorship