Satellite imagery in evaluating oil spill modelling scenarios for the Syrian oil spill crisis, summer 2021
 Panagiota Keramea1
  Nikolaos Kokkos1
  George Zodiatis2*
  Georgios Sylaios1
  Giovanni Coppini3
  Juan Peña4 Pablo Benjumeda4
  Antonio Augusto Sepp Neves3 Robin Lardner2
  Svitlana Liubartseva3 Dmitry Soloviev2 Matteo Scuro3
  Andreas Nikolaidis5 Fabio Viola3
- 1Department of Environmental Engineering, Lab. of Ecological Engineering and Technology, Democritus University of Thrace, Xanthi, Greece
- 2ORION Research, Nicosia, Cyprus
- 3Ocean Predictions and Applications Division, Centro Euro-Mediterraneo sui Cambiamenti Climatici, CMCC, Lecce, Italy
- 4Orbital EOS, Valencia, Spain
- 5Department of Civil Eng. and Geomatics, Cyprus University of Technology, Limassol, Cyprus
The second-largest oil pollution incident in the Eastern Mediterranean Levantine basin, following the oil pollution crisis in Lebanon in 2006, is considered to be the oil leakage from the Syrian Baniyas power plant (summer 2021), during which 12,000 tons of oil were released. At the operational phase, the everyday predictions of oil drift were provided using the MEDSLIK and MEDSLIK-II models in the framework of an agreement between the Mediterranean Operational Network for Global Ocean Observing System (MONGOOS) and the Regional Marine Pollution Emergency Response Centre for the Mediterranean (REMPEC). In this work, we present a novel post-operational comprehensive model-based analysis, conducting a SAR validation in two model outputs: the MEDSLIK and the OpenDrift models. Each simulation is initiated with the operationally acquired EMSA-CSN and ESA SAR images. Moreover, the high-resolution met-ocean fields (CYCOFOS, SKIRON) are used to force the oil drift and transformation in both models. The spill was developed under the calm-wind conditions that prevailed during the incident. We found that the boundary sea currents developed on the periphery of the Lattakia eddies (anticyclonic and cyclonic) were responsible for the fast westward spreading of the oil spill offshore in the NE Levantine, the north-south pathway bifurcation, and re-landing of oil in the extended coastal area of Lattakia. Model outputs were validated against Synthetic-aperture radar (SAR) images with appropriate performance metrics, used for the first time, to assess the capacity of a reliable representation of oil spill drift. The intercomparison between the two oil spill models indicated that both models produce almost similar results, while their validation against the satellite SAR observations illustrates moderate accuracy.
1 Introduction
Oil transportation by ship, oil rig failures, oil tanker accidents, including collisions or sinkings, natural oil leaks from underwater sources, etc., are only a few of the many causes of oil spills in the marine environment. Marine oil spills can have significant effects on ecosystems, public health, and the economies of coastal communities. Hence, the operational forecasting of oil spill pathways into the sea through oil spill advection-dispersion models aims to alert authorities, initiate the optimal response, and ultimately reduce environmental damage. With this knowledge, resources (vessels and aircrafts) may be directed to the most likely site of the oil expansion, and any mitigation methods, such as oil booms and dispersants, can be successfully deployed. These different types of oil spills may have variable effects on the ecosystem, depending on the type (density and viscosity) and quantity of the oil released, meteorological circumstances (mostly atmospheric winds), ocean (hydrodynamics and water column dynamics), and sea state (waves and wave-induced turbulence) conditions (Fingas and Brown, 2018). For this reason, predicting the trajectory and fate of the oil at the early stages of an oil spill, even before routine surveillance activities have been established, is extremely crucial for the success of the authorities’ response (Keramea et al., 2021; Zodiatis et al., 2021). Modeling can also highlight the potential for shoreline harm as an incident develops, assisting in the optimization of clean-up efforts. Any help that operational oil spill modeling can offer could be important, given the tremendous effect and cost of oil spills. Risk evaluation and readiness planning both heavily rely on oil spill modeling. Governmental authorities, oil exploitation and production firms, insurance companies, and other stakeholders can evaluate whether they have the appropriate resources, tools, and procedures to respond by simulating different oil release scenarios and their impacts (Dearden et al., 2022).
When oil spills at sea, it disperses and flows on the water surface with the wind and currents while going through a number of chemical and physical changes (Spaulding, 2017; Zodiatis et al., 2017; Keramea et al., 2021; Dhavalikar and Choudhari, 2022). The accurate wind representation is essential for the reliable oil drift prediction, therefore downscaling is required to improve forecasted wind fields. Recently, Li et al. (2022) introduced machine learning tools through the innovative “adversarial learning approach” to the forecasted wind field correction. The fate of oil in the water is determined by activities collectively known as “oil weathering processes”. Under the influence of wind speed and direction, as well as ocean currents, a variety of weathering processes, including evaporation, emulsification, dispersion, etc., cause the spilt oil in the ocean to break down and spread (Keramea et al., 2021; Zodiatis et al., 2021). At this stage, it is crucial to be able to show that oil spill model forecasts are correct and accurate, as well as that the constraints of a model are fully understood, to utilize them in the decision-making process for oil spill response. The evaluation of model results is the key step in this process. Historical data from three fundamental sources—drifters, satellite observations, and coastal reports—is regularly used to validate oil spill models.
Drifters present continuous, accurate location tracking data over a number of weeks. However, they can also be used to model the 2-D spatial dispersion of an oil slick. They are substantially basic floating GPS devices that are typically employed for the Lagrangian monitoring of ocean currents (De Dominicis et al., 2013b; Song et al., 2018). However, the drifter approach for validation has the drawback that it only offers an assessment on the correctness of advection processes in the model (e.g., the transport of oil by virtue of wind, currents, and wave drift). In that sense, drifter data might be valuable in characterizing the forecasting uncertainty within models.
Synthetic aperture radar (SAR)-equipped satellites can identify oil spills floating on the water. On the sea surface, the effect of dampening the gravity-capillary waves with a distinctive wavelength of several centimeters is constantly present. Radars operating on the same wavelength can distinguish easily between water areas with developed gravity-capillary waves and those with damped gravity-capillary waves. Different types of oil products can dump the gravity-capillary waves by a factor of 10 to 30. Water areas with dampened gravity-capillary waves appear as black zones on SAR images because the radar signal that is emitted does not return to the antenna. Gray spots on SAR images represent regions where a portion of the radar signal that has been scattered (by gravity-capillary waves) has been returned to the radar. The traditional approaches for locating oil spills in SAR pictures mainly concentrate on assessing the geometry and grayscale gradients. The European Maritime Safety Agency’s (EMSA) provided the CleanSeaNet service utilized in the current study to initiate the oil spill models.
Generally, the main principles of oil spill detection involve image pre-processing, image segmentation, feature extraction and classification, based on oil’s spectral signature. Currently, machine learning techniques based on various classifiers (e.g., decision trees, random forests, etc.) have been widely applied to aid oil detection (Vijayakumar, 2023). Technical details and method limitations using SAR images for detection of oil spill are referred in Fingas and Brown (2018) and Dong et al., (2022 Supplementary Materials).
Many satellite constellations, including COSMO-SkyMed (CSK), ERS-2, ENVISAT, RADARSAT, and Sentinel-1, involve SAR equipment on board (Cheng et al., 2014). SAR imagery offers useful synoptic information about the location and extent of the oil spill in the presence of moderate wind speeds and weather conditions (Garcia-Pineda et al., 2009; Kolokoussis and Karathanassi, 2018), and its fundamental benefit against drifter data is that it enables direct comparisons between the results of numerical models and observations of actual oil spills (Cheng et al., 2014). However, the spectral signature of an oil spill may be influenced by the prevailing sea and lighting conditions, oil optical characteristics, film thickness, and water column optical characteristics (Song et al., 2018). Furthermore, these satellites can only provide two or three images, at most, for a normal oil spill before the oil evaporates to a point where it can no longer be identified (Garcia-Pineda et al., 2013; Aghaei et al., 2022). Therefore, due to the swath of the SAR and the duration between satellite revisits, its application for tracking oil spill paths is constrained. Another significant problem is separating oil spills from their imitators (such as algae, rain cells, low-wind regions, etc.) in SAR images. Nevertheless, emergency responders can monitor an oil spill using remote sensing, together with models of chemical changes and mass fluxes, to gain insight into the various physical processes that determine the fate of oil in the ocean (Clark et al., 2010). As a result, SAR images can be used in conjunction with model simulations to obtain more precise information about oil spills (Zodiatis et al., 2012), particularly for oil spill monitoring and tracking during major oil spill occurrences, developing a contingency plan, and evaluating the significance of the oil spill hazard (Dhavalikar and Choudhari, 2022). Coastal reports could also be used to validate the oil arrival time to the beach (Coppini et al., 2018; Liubartseva et al., 2020; Liubartseva et al., 2022).
Numerous studies have been carried out using hypothetical oil spill accident scenarios as well as their accompanying simulations in the Levantine basin (Alves et al., 2016; Kampouris et al., 2021; Liubartseva et al., 2021; Keramea et al., 2022). However, to be operational, a model should respond to real-event occurrences (Lardner et al., 2006; Xu et al., 2013; Hole et al., 2019; Liubartseva et al., 2020; Zodiatis et al., 2022).
Over the last two decades, it has been well documented that the NE Levantine is vulnerable to major oil spill incidents due to the intense shipping traffic and the numerous accidental releases from the fuel tanks of power plant infrastructure and refineries located close to the shoreline.
The first major oil pollution case in the NE Levantine was documented in mid-July 2006, following the heavy crude oil leakage of around 15,000 tons from the fuel tanks of the Jieh power plant (Figure 1), located 30 km south of Beirut (Lardner et al., 2006; Coppini et al., 2011). Following a relevant request from REMPEC regarding the details of the oil pollution during the hostilities between Israel and Lebanon, operational daily oil spill predictions were carried out using the well-established MEDSLIK oil spill model (Lardner et al., 1998; De Dominicis et al., 2013a; Zodiatis et al., 2021) forced by SKIRON and CYCOFOS met-ocean forecasting data. The CYCOFOS sea current forecast for the mid-July 2006 incident showed a northerly flow, parallel to and close to the coasts of Lebanon and Syria, with flow velocities between 0.20-0.30 m/s, while the SKIRON wind forecast showed winds varying in direction between south-west and south, with wind speeds varying between 2 and 7 m/s. Therefore, during the Lebanon oil pollution crisis, the oil spill remained close to the coastal area and heavily polluted the shoreline of Lebanon, the northern part of the Jieh power plant, and partially the southern coast of Syria up to Tartus, Jableh, and the south shoreline of Latakia (Lardner et al., 2006; Coppini et al., 2011). It is important to note that the EU Joint Research Center (JRC) provided some limited satellite remote sensing SAR images during the oil pollution crisis in Lebanon, to verify the oil spill predicts about the level of oil pollution. One year after this incident, the European Maritime Safety Agency (EMSA) launched the CleanSeaNet (EMSA-CSN) Portal1, which provides oil spill warnings to EU Member States based on remote sensing satellite SAR data.
Over a period of five years, from 2007 to 2011, the systematic use of remote sensing SAR data from EMSA-CSN and the European Space Agency (ESA) allowed Zodiatis et al. (2012) to identify more than a thousand potential ship-related oil slicks in the NE Levantine basin, and also to couple the SAR data with the MEDSLIK oil spill model, and to provide operational 24-hour forecasts and 24-hour backtracking of the satellite observed potential ship-related oil slicks.
Among the studied accidents, a small-scale oil spill, known as the “Gastria oil pollution incident” occurred in the mid-July 2013 at the Famagusta Bay coastal sea area in Cyprus (Figure 1) during the refueling of an oil terminal for the needs of the nearby “Kalecik” power station, owned and operated by the Turkish “Aksa” energy company. About 100 tons of heavy crude oil were released. Despite the MEDSLIK model’s hours-ahead prediction that the first impact on the coast would take around 18 hours to reach the shore (Zodiatis et al., 2018), particularly due to the extremely weak winds and sea currents, the oil spillage led to the pollution of the shoreline nearby.
The recent NE Levantine accident was recorded in February 2021, when a considerable number of tar balls washed ashore on the beaches of Israel, Lebanon, and the Gaza Strip. Remote sensing SAR images failed to detect this offshore spill in its initial stages. In response to REMPEC’s request, different met-ocean forcings, such as the SKIRON winds, CYCOFOS sea currents, CMEMS Med MFC sea currents, and ECMWF winds, were used to run the MEDSLIK and MEDSLIK-II oil spill models (Liubartseva et al., 2022). The results of the oil spill modeling were compared with the distribution of the accumulated oil throughout the shoreline to assist the Israeli authorities’ investigation into the origin of the oil leakage, which impacted an extended coastline of Israel up to 160 km long.
Finally, following the Lebanon oil pollution crisis in the summer 2006, the 12,000 tons of crude oil that leaked from the fuel tanks of the Syrian Baniya power plant in summer 2021 is regarded as the second-largest oil pollution incident in the Eastern Mediterranean Levantine basin (REMPEC, 2023). In this oil spill incident, which lasted from August 23 to September 12, 2021, the CMCC, ORION, and Orbital-EOS provided daily oil spill predictions, as part of the MONGOOS-REMPEC agreement, to provide oil spill predictions in causes of major pollution incidents in the Mediterranean Sea (Zodiatis et al., 2022; Keramea et al., 2023b). Oil washed up on the Syrian coast after the spill, with a higher concentration along the southern coast of Latakia. The thick oil (>0.1 mm) that was still on the sea surface was transferred offshore and dispersed widely in the NE Levantine between Syria and Cyprus, posing a threat to the easternmost point of Cyprus (Zodiatis et al., 2022). Also, during this period, the Turkish coast near Samandağ was affected (Zodiatis et al., 2022).
Dhavalikar and Choudhari (2023) attempted to model the Syrian oil spill using a random walk oil spill model and evaluated the accuracy of model predictions according to the Centroid Skill Score (CSS). However, this study was limited to the comparison of simulated trajectories with satellite images, lacking the quantitative assessment in spatial overlap between the modeled oil dispersion forecasts and the observed satellite images.
The present article employs satellite data and images to initiate and evaluate the results produced by a series of oil spill model simulations at the post-operational stage, of the accidental oil release from Syria’s Baniyas power plant in the NE Levantine Basin, at the end of August 2021 (Figure 1). Moreover, this study involved two widely used and state-of-the-art oil spill models, the MEDSLIK and OpenDrift models, in which simulations were performed under similar configurations and met-ocean forcings via the high-resolution hydrodynamic and atmospheric data obtained from the CYCOFOS model (spatial resolution 2 km) and the SKIRON model (spatial 10 km). In parallel, four operational runs were conducted and the predictions of these two oil spill models were compared to the respective SAR satellite images. The satellite-based evaluation of models’ performance utilized quantitative metrics with limited use in oil spill modeling, while introduced metrics used in flood hazard assessment. Section 2 describes the study area, the met-ocean conditions prevailing during the accident, the basics of the MEDSLIK and OpenDrift oil spill models, the oil spill details, the models’ configuration, and the performance metrics used to evaluate the oil spill predictions against remote sensing observations. In Section 3, the results present the analysis of satellite images and oil spill models’ outputs for the various runs. The discussion includes a comparative analysis among these models, together with an assessment of the accuracy of the results using SAR images as a benchmark and comparing model outputs according to a series of performance metrics. Finally, our conclusions are drawn in Section 4.
2 Methodology and data
2.1 The Baniyas power plant oil spill
As reported by REMPEC, after receiving official notification from the Syrian Ministry of Environment, a total of 12,000 tons of crude oil were spilled from the fuel tanks of the Baniyas power plant (PP) in Syria in the NE Levantine Basin (Figure 1) at around 10:00 GMT on August 23, 2021. It is important to note that the oil spilled at sea from the Baniyas PP is of a similar order of magnitude to the oil pollution from the Jieh power plant in Lebanon in mid-July 2006 (Lardner et al., 2006; Coppini et al., 2011). Members of MONGOOS, including CMCC, ORION, and Orbital EOS, provided daily oil spill predictions using satellite remote sensing SAR data from August 25 to September 12, 2021, as part of the MONGOOS-REMPEC agreement, which aims to provide operational oil spill predictions in case of major pollution incidents in the Mediterranean Sea. At the post-operational stage, several modeling simulations were carried out using the MEDSLIK and OpenDrift Lagrangian oil spill models in order to study in detail the spill development, which will be presented in the current article.
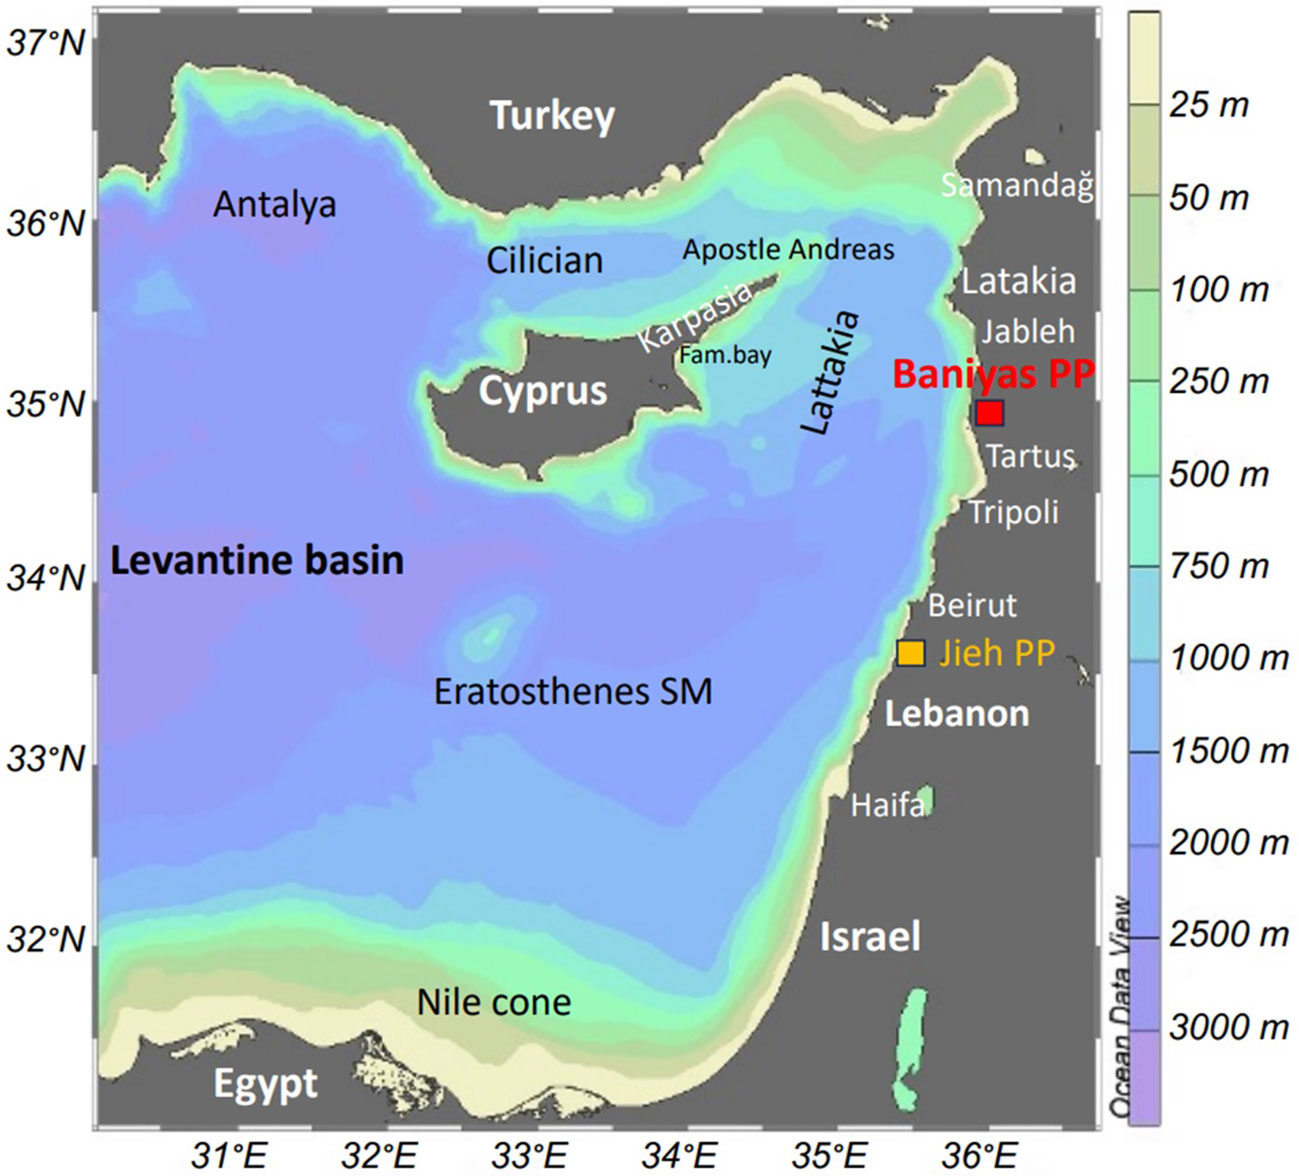
Figure 1 Physiography of the East Levantine basin, showing the Baniyas PP and other locations affected by the Baniyas PP oil spill between the late August and early September 2021.
2.2 Study area and met-ocean conditions
The Levantine Basin is the second-largest basin in the Mediterranean Sea. It is surrounded to the north by Asia Minor (Turkey), to the east by the Middle East (Israel, Lebanon, and Syria), and to the south by the North African coast (Egypt and Libya). The Levantine basin is divided into several sub-basins, including the Rhodes, Antalya, Cilicia, and Lattakia basins. The main elevated bathymetric features are the island of Cyprus, which is located in the northeast corner of the region and the sill elevation of the Eratosthenes Seamount (SM), located south of Cyprus. The basin communicates with the rest of the Eastern Mediterranean Sea through the wide Cretan passage and with the Aegean Sea through the eastern Cretan Arc Straits.
The in-situ data gathered over the last three and a half decades, since the mid-1980s, from dozens of hydrographic campaigns (Hecht et al., 1988; Brenner, 1989; Robinson et al., 1992; Brenner, 1993; Zodiatis et al., 2005; Zodiatis et al., 2016b; Zodiatis et al., 2023), along with data provided by the SeaDataCloud climatology2 and the reanalysis from the Copernicus Mediterranean Monitoring and Forecasting Center (Simoncelli et al., 2019; Pinardi et al., 2015), have all provided insight on the dominant, meso-scale coherent circulation features of the Levantine basin. In the NE Levantine, particular in the Lattakia basin, where the Baniyas PP oil spill was widely spread, the spatial temporal fluctuation of the Lattakia eddies (cyclonic and anticyclonic) between Cyprus and the Lebanon-Syrian coastlines regulates the northward water transport into the Cilician basin.
The sea surface circulation pattern between Cyprus and Syria during the examined period was dominated by two anticyclonic eddies and one cyclonic eddy and a northward jet flowing between the eddy’s boundaries, while along the Syrian coastline in the vicinity of the Baniyas PP, the sea surface currents were generally of northward direction (Figure 2).
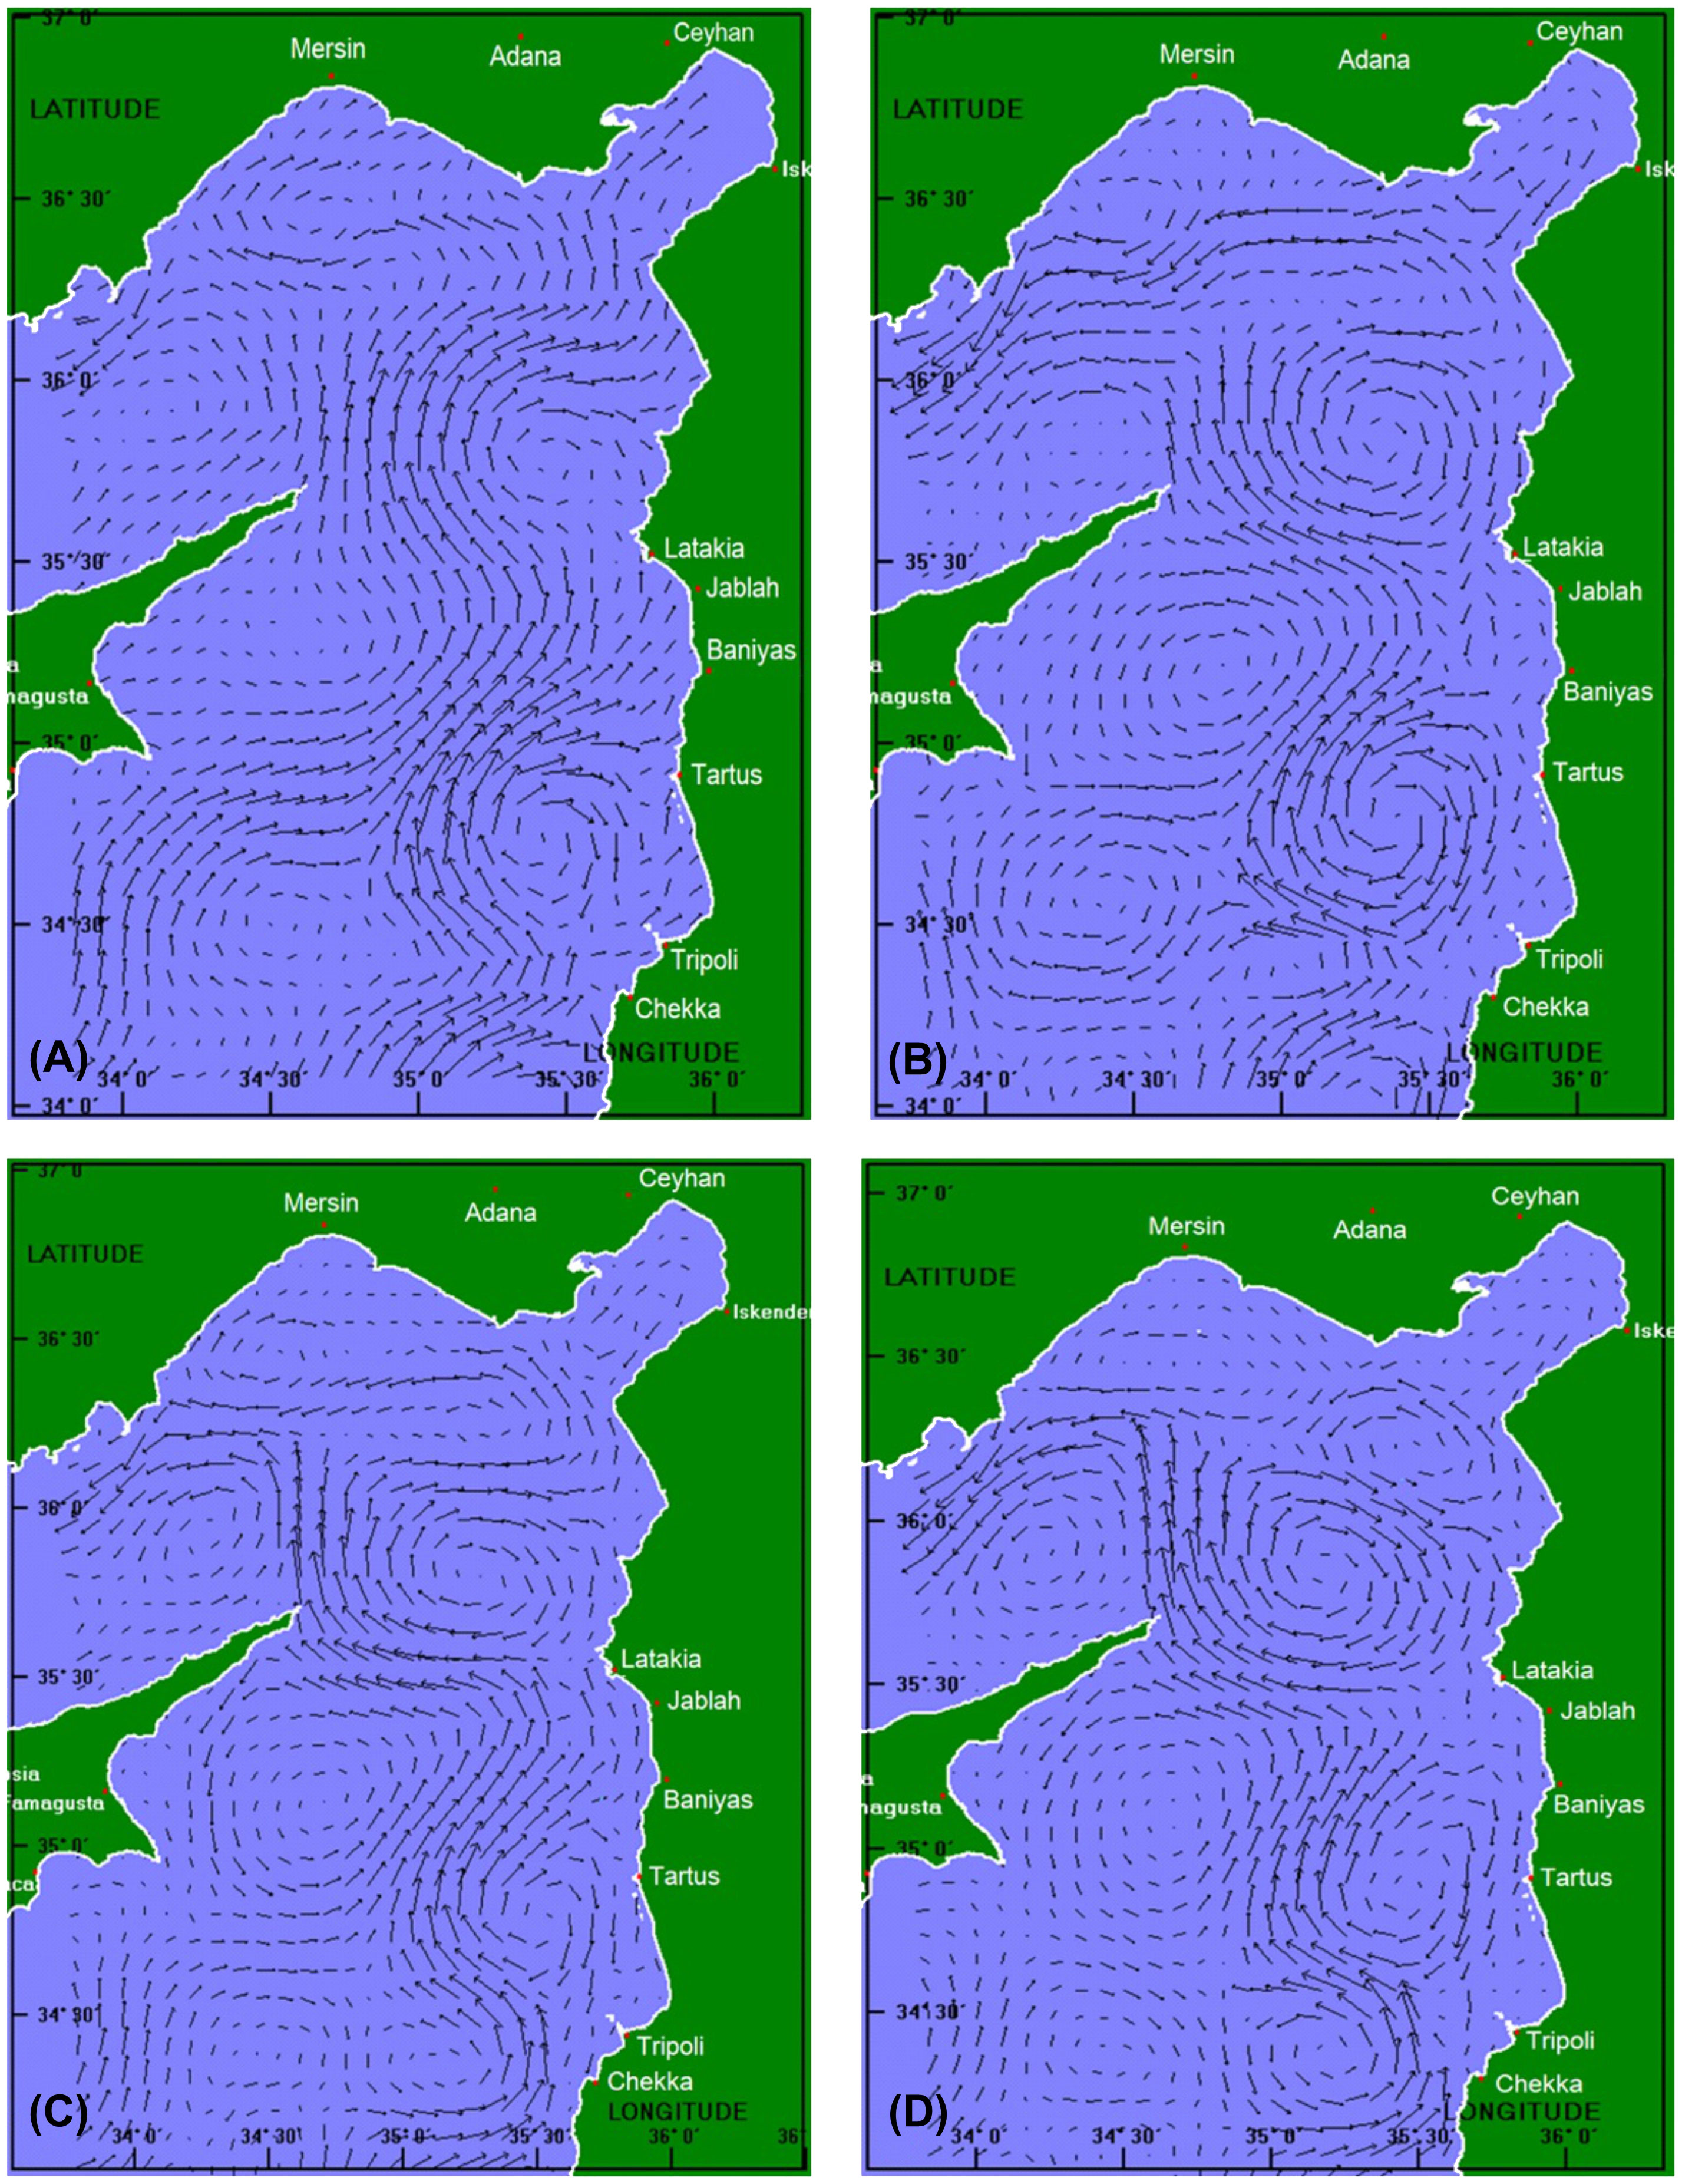
Figure 2 The CYCOFOS sea surface currents, (A) on August 26, 2021, (B) on August 27, 2021, (C) on August 30, 2021, and (D) on September 3, 2021.
In summer periods, the SW winds usually dominates in the Levantine basin, while in the most eastern part of the Levantine, between Cyprus and the Middle East coastline, the winds turn southerly. The SKIRON forecasts in the sea area between Cyprus and Syria showed calm wind conditions from August 23 until August 28, 2021, while later, southerly light breeze to gentle breeze winds prevailed (Figure 3).
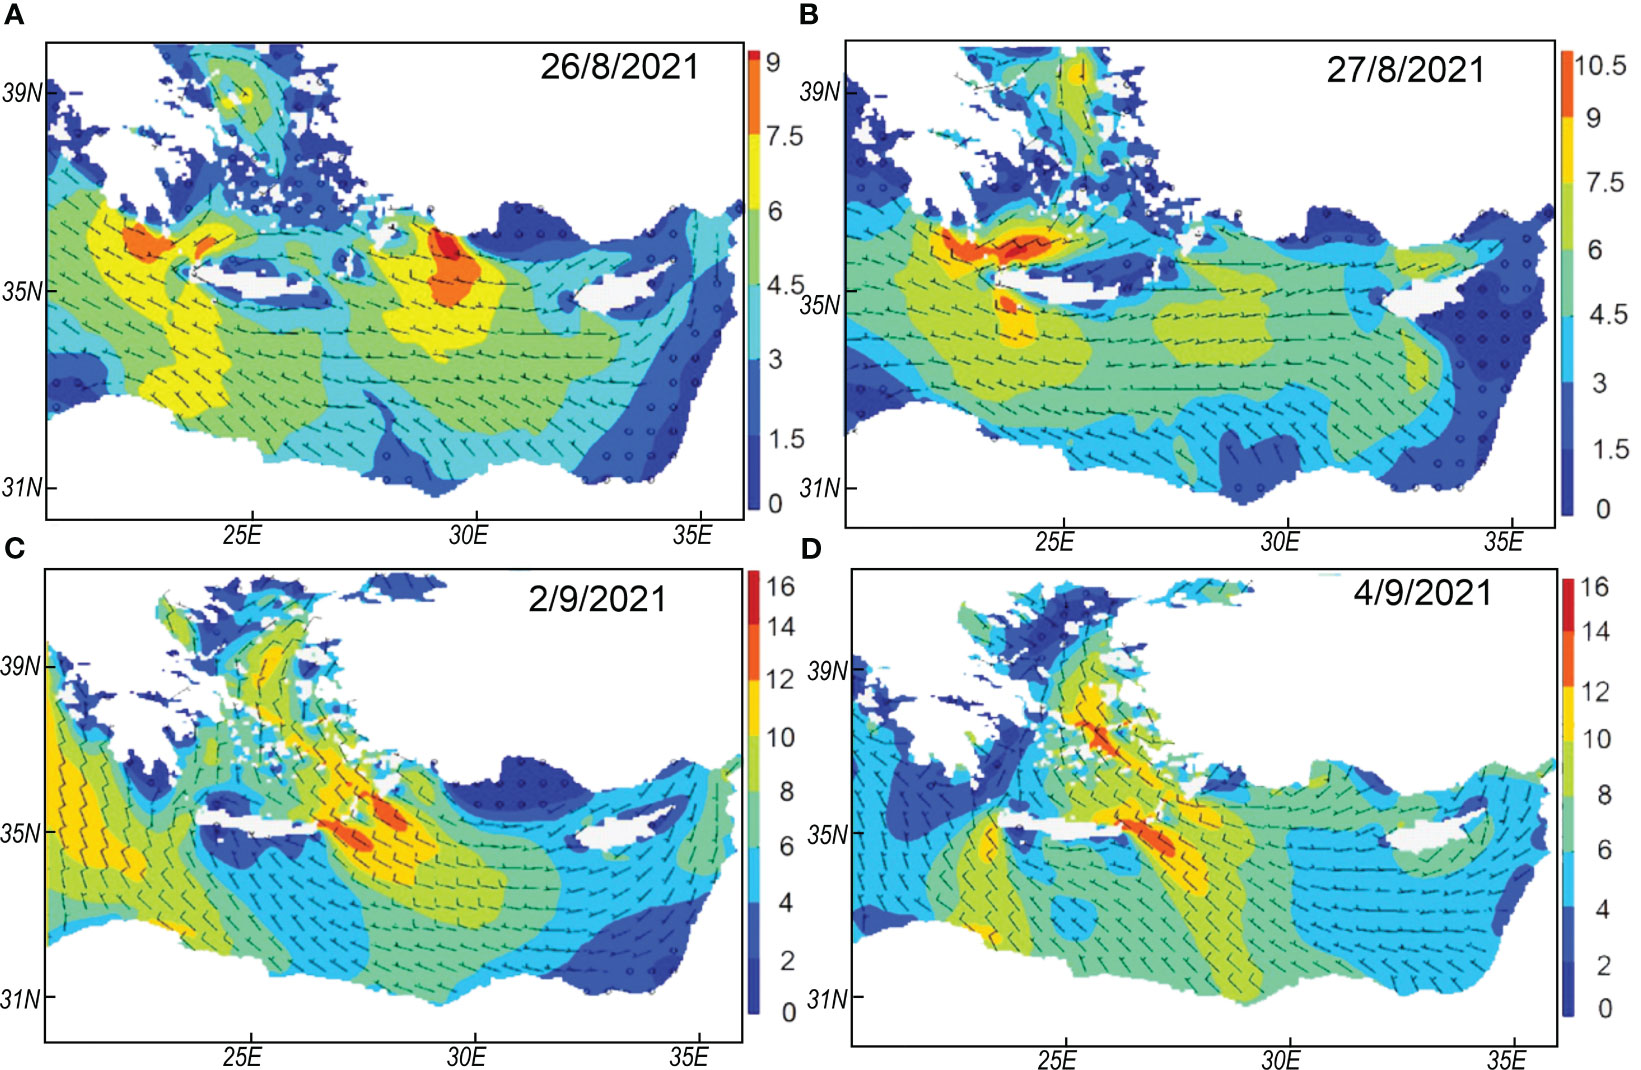
Figure 3 SKIRON forecasts predicted the calm wind conditions to prevail from (A) August 23 to (B) August 28, 2021 and southerly light to gentle breeze winds to prevail from (C) August 29 to (D) September 7, 2021.
2.3 The basics of the MEDSLIK and OpenDrift oil spill models
MEDSLIK is a 3D Lagrangian oil spill model that has been successfully used for more than 20 years to simulate the transport and fate of oil spilled at sea in deterministic and stochastic modes (Lardner et al., 1998; De Dominicis et al., 2013a; Lardner and Zodiatis, 2016; Zodiatis et al., 2021). In the model framework, the oil slick is discretized into constituent particles. Randomized diffusion is applied to account for the sub-grid processes that are not resolved in the meteo-oceanographic models. Two types of the horizontal diffusivity representation are offered, constant coefficients and the Smagorinsky parameterization (Smagorinsky, 1963). The oil transformation processes are calculated by means of the bulk formulae, which describe the changes in the surface oil volume due to three main processes, known collectively as weathering: viscous-gravity spreading, evaporation, and natural dispersion. The formation of water-in-oil emulsion is also taken into consideration. If an oil particle arrives on the coast, the model simulates the adsorption of particles into the coastal environment, taking into account the probability that oil may be washed back into the water.
The model runs the oil spill scenarios according to the initial information about the starting spill location and date, type of the oil, the oil volume or spill rate and duration. In addition, the outputs include information for defensive measures like, for example, booming, skimming, and spraying dispersants on the surface oil slick (Lardner and Zodiatis, 2017). At each time step, MEDSLIK simulates the geographical coordinates of particles and oil concentrations at the sea surface, in the water column, and on the coast. The model uses an oil database composed of 225 types of the oil provided by REMPEC. For MEDSLIK, the default parameters are specified in De Dominicis et al. (2013a).
Moreover, MEDSLIK was operationally used during the largest oil pollution incident in the Eastern Mediterranean to date, i.e., the Lebanese oil pollution crisis, in summer 2006, at the request of the European Civil Protection and REMPEC (Lardner et al., 2006; Coppini et al., 2011; Neves et al., 2015). Besides, MEDSLIK has been validated through SAR satellite images, such as SENTINEL, RADARSAR, and previously ENVISAT received from EMSA-CSN or from European Space Agency (ESA) portals, by Zodiatis et al. (2012). Model predictions were obtained using CYCOFOS high-resolution ocean fields that were compared to those obtained using the lower-resolution MFS hydrodynamics, and both were validated against satellite observations (Coppini et al., 2011). In addition, MEDSLIK has been implemented in numerous test cases in the Levantine basin (Lardner et al., 2006; Alves et al., 2015; Zodiatis et al., 2021; Liubartseva et al., 2022), in the Black Sea (Zodiatis et al., 2012) and in the Red Sea (Hoteit et al., 2021).
OpenDrift3 is a Python-based trajectory framework (Dagestad et al., 2018), developed at the Norwegian Meteorological Institute, that includes a component of an open-source oil-spill transport and fate model called OpenOil (Röhrs et al., 2018). This model combines algorithms with a number of physical processes, such as advection and spreading, evaporation, dispersion, including the wave entrainment of oil (Li et al., 2017), vertical mixing caused by ocean turbulence (Visser, 1997; Li et al., 2017), resurfacing of oil due to buoyancy (Tkalich and Chan, 2002), and emulsification of oil properties (Lehr et al., 2002; Li et al., 2017). The physics of the model are therefore very sensitive to the specification of the oil droplet size distribution, because resurfacing is parameterized based on oil density and droplet size using the Stokes Law (Hole et al., 2018; Hole et al., 2019). The open-source, Python-coded ADIOS Oil Library (Lehr et al., 2002) with 1,000 different oil types is used to obtain the oil properties for OpenOil (Dagestad et al., 2018). For OpenDrift, the default parameters are specified in Dagestad et al. (2018). Moreover, MET Norway makes use of its own, in-house, high-resolution ocean-circulation and meteorological models to produce operational oil-spill forecasts with OpenOil (Röhrs et al., 2018). The model does, however, allow coupling with forecasts of coarser resolution from CMEMS (Copernicus Marine Environmental Service), FVCOM, SHYFEM, CYCOFOS, HYCOM, and Norshelf for ocean state and hydrodynamics, as well as NOAA, ECMWF, and SKIRON wind fields, with netCDF and many other file formats (Keramea et al., 2023a).
In Norway, OpenOil has been operationally used as a search and rescue model and for the contingency planning for oil spills (Hole et al., 2018; Hole et al., 2019), as well as for drifter and oil slick observations in the North Sea (Jones et al., 2016; Röhrs et al., 2018). In addition, the Norwegian Sea (Röhrs et al., 2018), the Gulf of Mexico and the Cuban coast (Hole et al., 2019; Androulidakis et al., 2020; Hole et al., 2021), the Thracian Sea (Keramea et al., 2022), and the Caribbean Sea (Devis-Morales et al., 2022) are just a few locations where the OpenOil has been used.
2.4 Post operational oil spill models’ configuration and simulations
In this work, four consecutive daily runs were performed to simulate the transport and fate of the Baniyas PP oil spill, that spread offshore from August 29 to September 9, 2021, in the NE Levantine. Each simulation attempted to forecast the extent of the oil spill pathway three days ahead from the commencement day. Initially, 20,000 oil particles were positioned within the polygons acquired from the first SAR image. Both the MEDSLIK and OpenDrift models were coupled with winds obtained from SKIRON, which contained hourly data with 10 km resolution. In addition, both models were coupled with hydrodynamic data from the Cyprus Coastal Ocean Forecasting and Observing System (CYCOFOS) database, which contains 6-hour data with a 2 km spatial resolution. A series of consecutive runs were executed by both models with the above-described forcings. At the end of each run, the slick’s location and coverage were obtained. Slick’s location was corrected based on SAR image and was considered as the initial condition for the next model run. In this work, each run is independent and utilizes initial conditions from newly collected SAR images, representing slick’s location and expansion at the beginning of each run, under common met-ocean forecasts produced from the above hydrodynamic and atmospheric models. The configuration characteristics of the consecutive runs are summarized in Table 1.
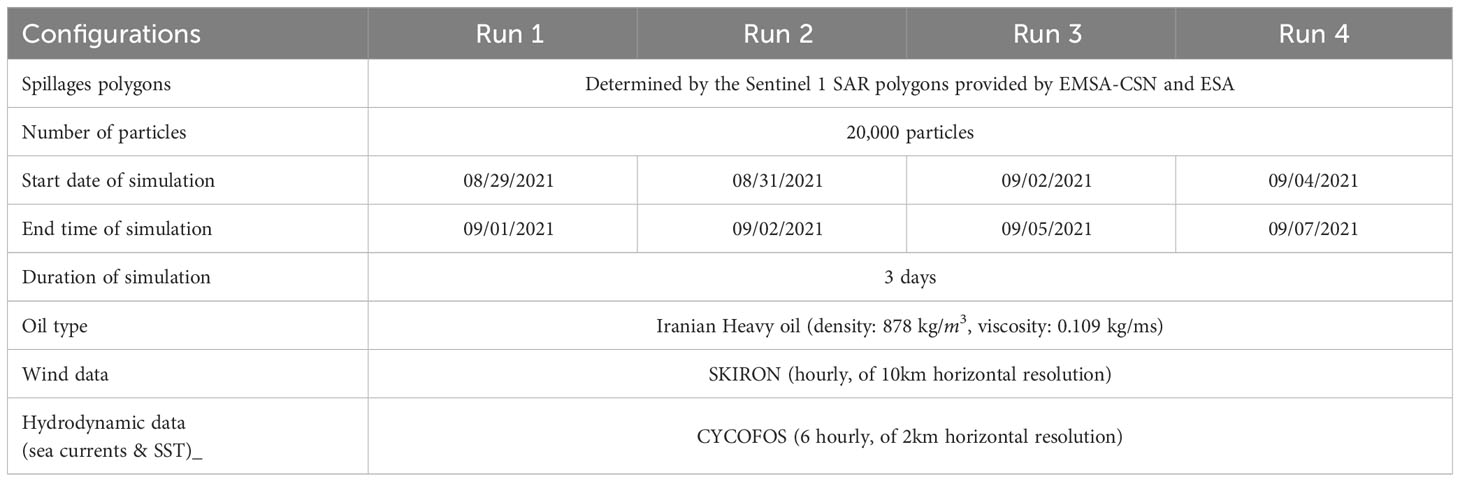
Table 1 Configuration characteristics for the four MEDSLIK and OpenDrift post operational runs.
2.5 Post operational models’ performance metrics
At the end of each model run, the MEDSLIK and OpenDrift results were assessed by comparing the actual oil slick extend, as recorded by the consecutive SAR images, and the forecasted coverage, produced by both models. Four basic performance metrics were established for this validation purpose. The first three metrics have been extensively used in flood modeling, comparing the area coverage of flood model results to satellite images (Wing et al., 2017), while the last has been only recently introduced in oil spill modeling (Dearden et al., 2022).
The first is the Success Rate (SR), defined as:
where the overlapped area is defined by the common coverage between the SAR-derived and the modeled spill, and the total actual area is the SAR-derived area coverage. SR ranges from the worst case of 0 (none of the SAR-derived spills are covered by the model) to the best case of 1 (all of the SAR-derived spills are covered by the model). Note that SR does not consider those areas of the modeled spill that are outside of the actual spill extent.
The second metric is the Failure Rate (FR), defined as:
where the non-overlapped area is defined by the non-common coverage between the SAR-derived and the modelled spill, and the total modelled area is the spill extend produced by both models. Similarly, FR ranges from the best case of 0 (none of the modelled oil spill extent is outside of the actual spill extent) to the worst case of 1 (all of the modelled oil spill extent is outside of the actual spill extent).
In addition, the Critical Success Index (CSI) is a composite measure that combines both SR and FR metrics, which allows for a more inclusive comparison of the spill extent prediction performance. It is computed by dividing the overlapped area by the total area defined by the actual and modeled spill coverage, as:
CSI ranges from the worst case of 0, showing no match between the actual and modelled spill extents, to the best case of 1, which shows the perfect match between the actual and modelled spillages.
Finally, the Centroid Skill Score (CSS) index determines the proximity in the centroids between the predicted by the model and the observed in the SAR image oil spill (Liu and Weisberg, 2011). Firstly, the initial centroid displacement index CI is computed in order to calculate the CSS index:
where Δx is the distance between the geometric centers (centroids) of the actual oil spill area in the SAR-derived and modeled oil spill shape at a specific time instance. is the distance along the diagonal of a bounding box enclosing the reported oil spill zone. As a result, CI is merely a measure of the absolute inaccuracy in predicting the centroid location, and CSS is defined as:
where is a tolerance threshold chosen by the user. In this work we selected , indicating that, for the model to be valid, the distance between the observed and predicted centroids must not exceed the magnitude of the observed length scale.
3 Satellite observations and model-based predictions of the spill movement and fate
3.1 Operational response to the Baniyas PP oil spill
SAR images and data were obtained from EMSA-CSN warning reports in the XML file format and optical satellite OLI-Landsat images—from ESA. Although the oil spill from the Baniyas PP occurred on August 23, 2021, the closer chronologically remote sensing SAR images verifying the oil leakage were obtained at 03:43 GMT and at 15:33 GMT on August 24, 2021, showing the oil spill spreading northward along the Syrian coastline up to Jableh, approximately 7–15 nm, respectively (Figures 4A, B). A day later, at 03:34 GMT on August 25, 2021, the oil spill spread further north (Figure 4C), due to the influence of the coastal sea currents.
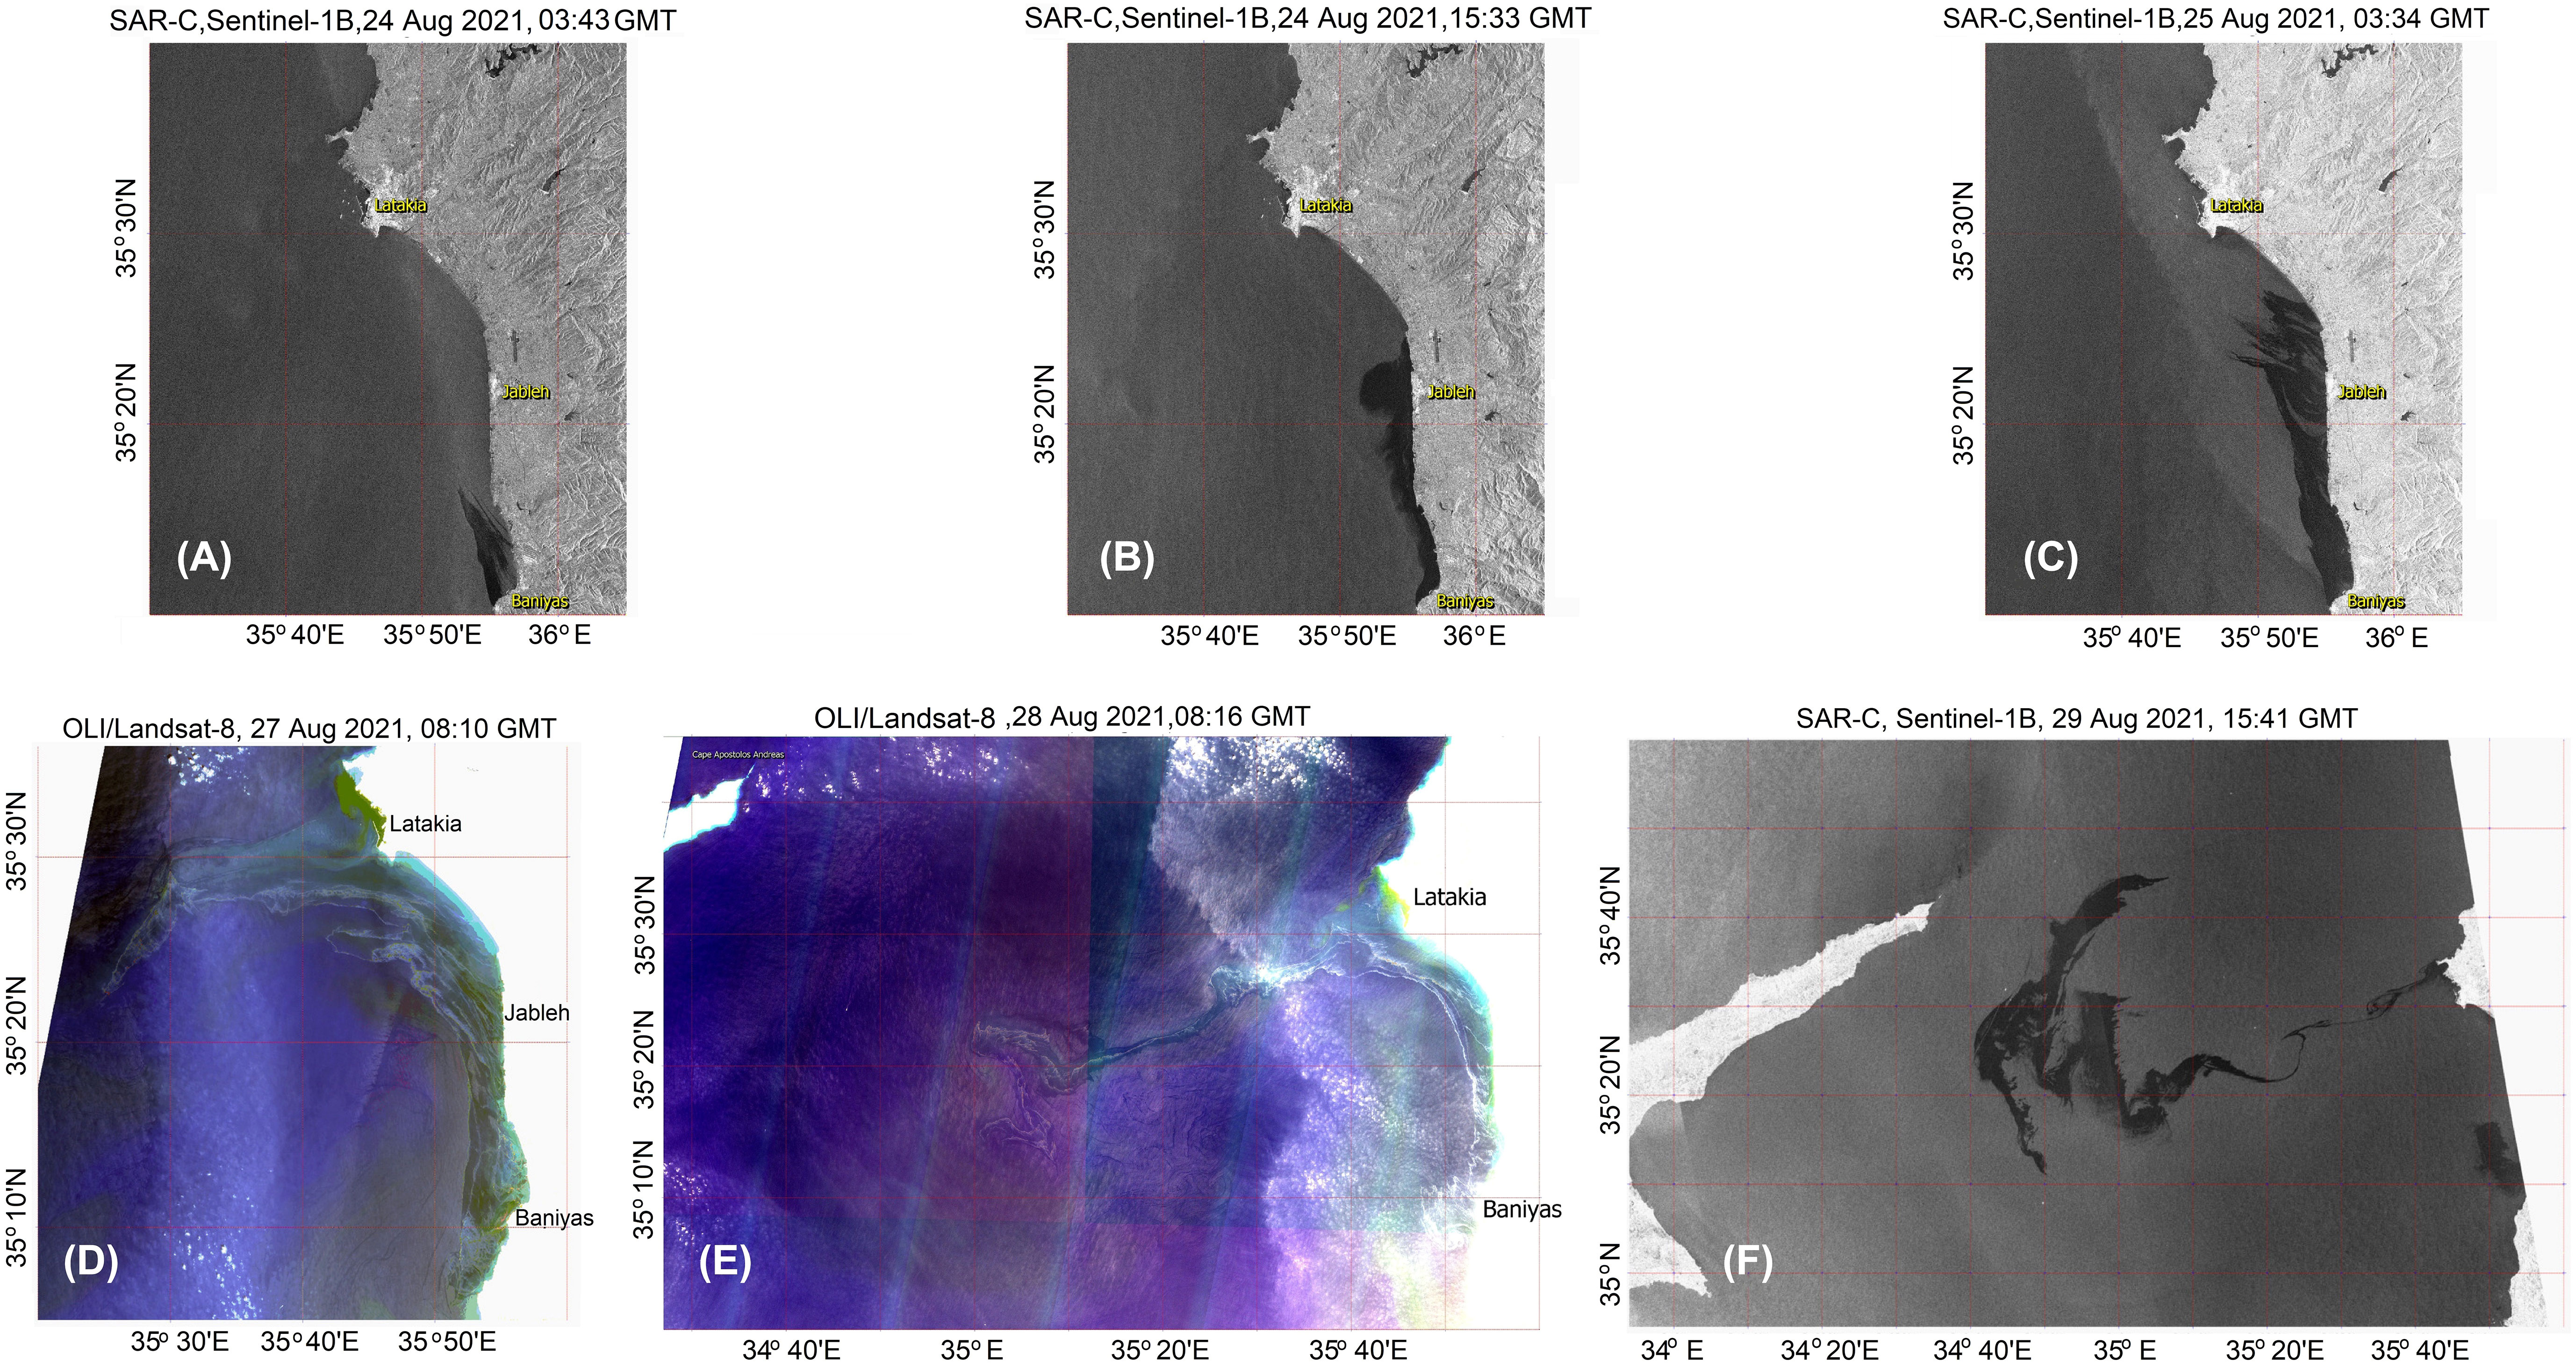
Figure 4 The first SAR image confirming the oil spillage from the Baniyas PP was obtained on August 24, 2021, at 03:43 GMT (A) and 15:33 GMT (B). SAR data was obtained at 03:34 GMT on August 25, 2021 (C). The optical satellite OLI-Landsat image obtained at 08:15 GMT on August 27, 2021 (D) shows the oil slick spreading offshore west from the Latakia coastal area due to the westward strong jet flowing between the local twin anticyclonic-cyclonic eddies. (E) The SAR image obtained at 08:16 GMT on August 28, 2021 shows the extended offshore westward spreading of the oil slick. (F) The SAR image obtained at 15:41 GMT on August 29, 2021, shows the extended bifurcated spread of the oil slick offshore between Cyprus and Syria. (SAR and OLI-Landsat images obtained from EMSA-CSN and ESA).
From 08:15 GMT on August 27 to 15:41 GMT on August 29, 2021, the remote sensing satellite images revealed that while the oil spill was washed up south of the Lattakia coast, part of the remaining sea surface emulsified oil was spread offshore westward as a stream (Figures 4D, E), and therefore it was widely spread in the NE Levantine between Syria and Cyprus (Figure 4F). The fast westward spread of the emulsified oil spill was the combined result of the dominant westward strong currents (Figures 5A, B), generated along the southern and northern periphery of the local twin anticyclone-cyclone eddies, and of the short temporal moderate breeze winds (7 m/s), with a SE-South direction that prevailed early in the morning on August 27, 2021, near the coastal area of Latakia city. The breeze wind was responsible for the initial re-entering of the beached oil at sea from the coastal area of Latakia city, while the strong westward current transferred the oil spill offshore. There, the spillage was bifurcated to the north and south directions, under the influence of the western peripheries of the twin anticyclonic-cyclonic eddies dominating the area. Oil pollution was threatening the Cape of Apostle Andreas, at the most eastern tip of Cyprus, and later the SE coast of Turkey.
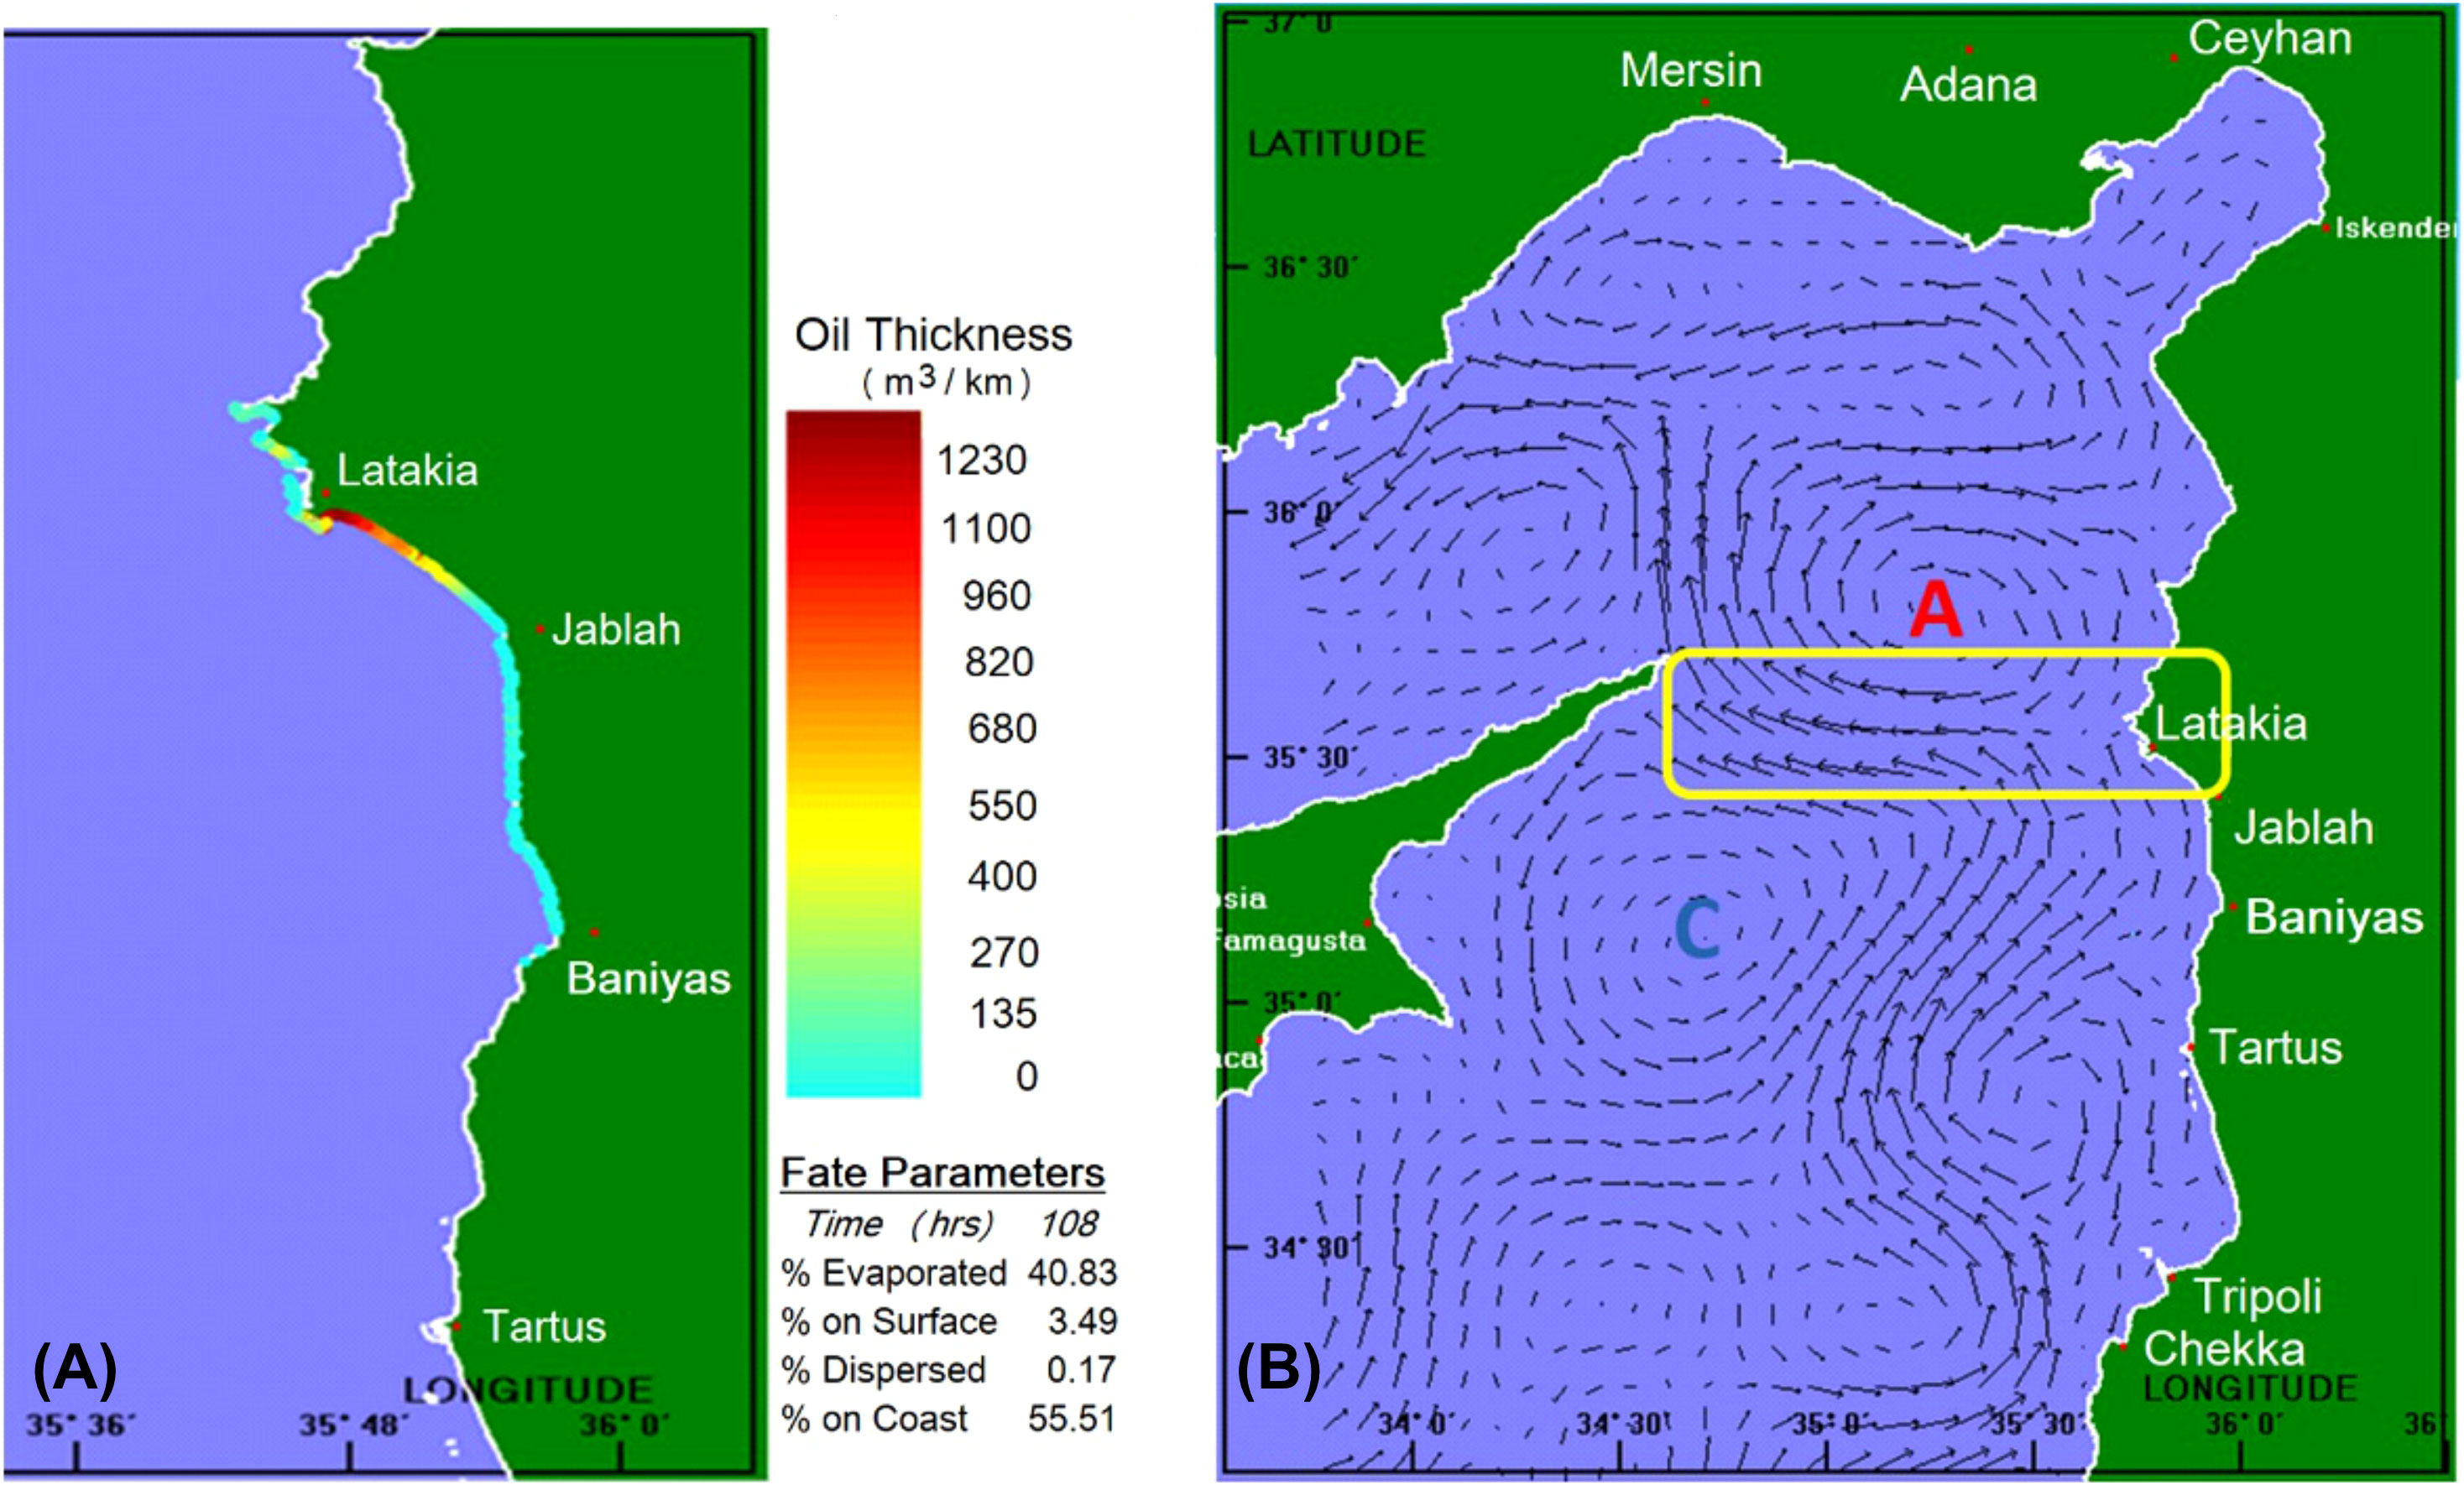
Figure 5 (A) The first MEDSLIK operational oil spill predictions from 25 to 28 August 2021 using the SAR data obtained at 03:34 GMT of the 25th August 2021 (Figure 4C). (B) The CYCOFOS sea surface currents on August 27, 2021, showing the strong westward boundary current at the latitude of the Latakia city coastline, as a result of the dynamic interaction between the Lattakia eddies (anticyclonic and cyclonic).
The first operational Baniyas PP oil spill simulation was carried from 25 to 28 August 2021, using the satellite remote sensing SAR data derived at 03:34 of the 25 August 2021 (Figure 4C). The oil spill predictions showed that most of the oil spill was washed up on the Syrian coast on the 27 August 2021 (more than 55%), while more than 40% was evaporated. The south coast of Latakia city was particularly heavily impacted.
An optical satellite OLI-Landsat image obtained at 08:15 UTC on the 27 August 2021 (Figure 4D) shows that part of the remaining sea surface emulsified oil (less than 3.5%) together with oil that re-entered the sea after it was washed on the broader Lattakia coast, was spread offshore westward. The fast westward spread of the emulsified oil spill resulted from the westward strong surface current, generated along the southern and northern periphery of the local anticyclone and cyclone eddies, respectively, while the short breeze SE wind was responsible for the initial forcing of the slick to re-enter the sea.
The above assumption was verified by the SAR image obtained at the 15:41 on the 29 August 2021 (Figure 4F), showing that the oil spill was not only widely spread westward in the NE Levantine between Syria, Cyprus and Turkey, but was bifurcated to the north and to the south directions, under the influence of the western peripheries of the local anticyclonic and cyclonic eddies. The extended spread of the emulsified oil spills in the NE Levantine, as it was documented by the SAR images, depicted that the oil spill was re-circulated by the local anticyclone eddy. Part of the oil was re-landed on the Syrian coast and part of it was washed up to the Turkish coast near Samandağ, under the increased southerly wind force. The model-predicted oil beaching onto the Samandağ coastline was confirmed by the local media. After the 6th September, the emulsified oil spill was progressively dispersed under the increased wind-wave action.
The superimposed SAR images from August 25 to September 5, 2023 (Figure 6A) show that the evolution and extent of the offshore oil spills were forced mainly by the dominant flow features of the area, thanks to the calm winds. Therefore, the oil spills after their offshore travel, were re-landed on the Syrian coast, mostly at the broader Lattakia coastal area (Figure 6B). Moreover, only the partially emulsified oil was washed up on the southern coast of the Cape Apostle Andreas in Cyprus and along the coastal zone of Turkey, located to the north of Lattakia (Figure 6C).
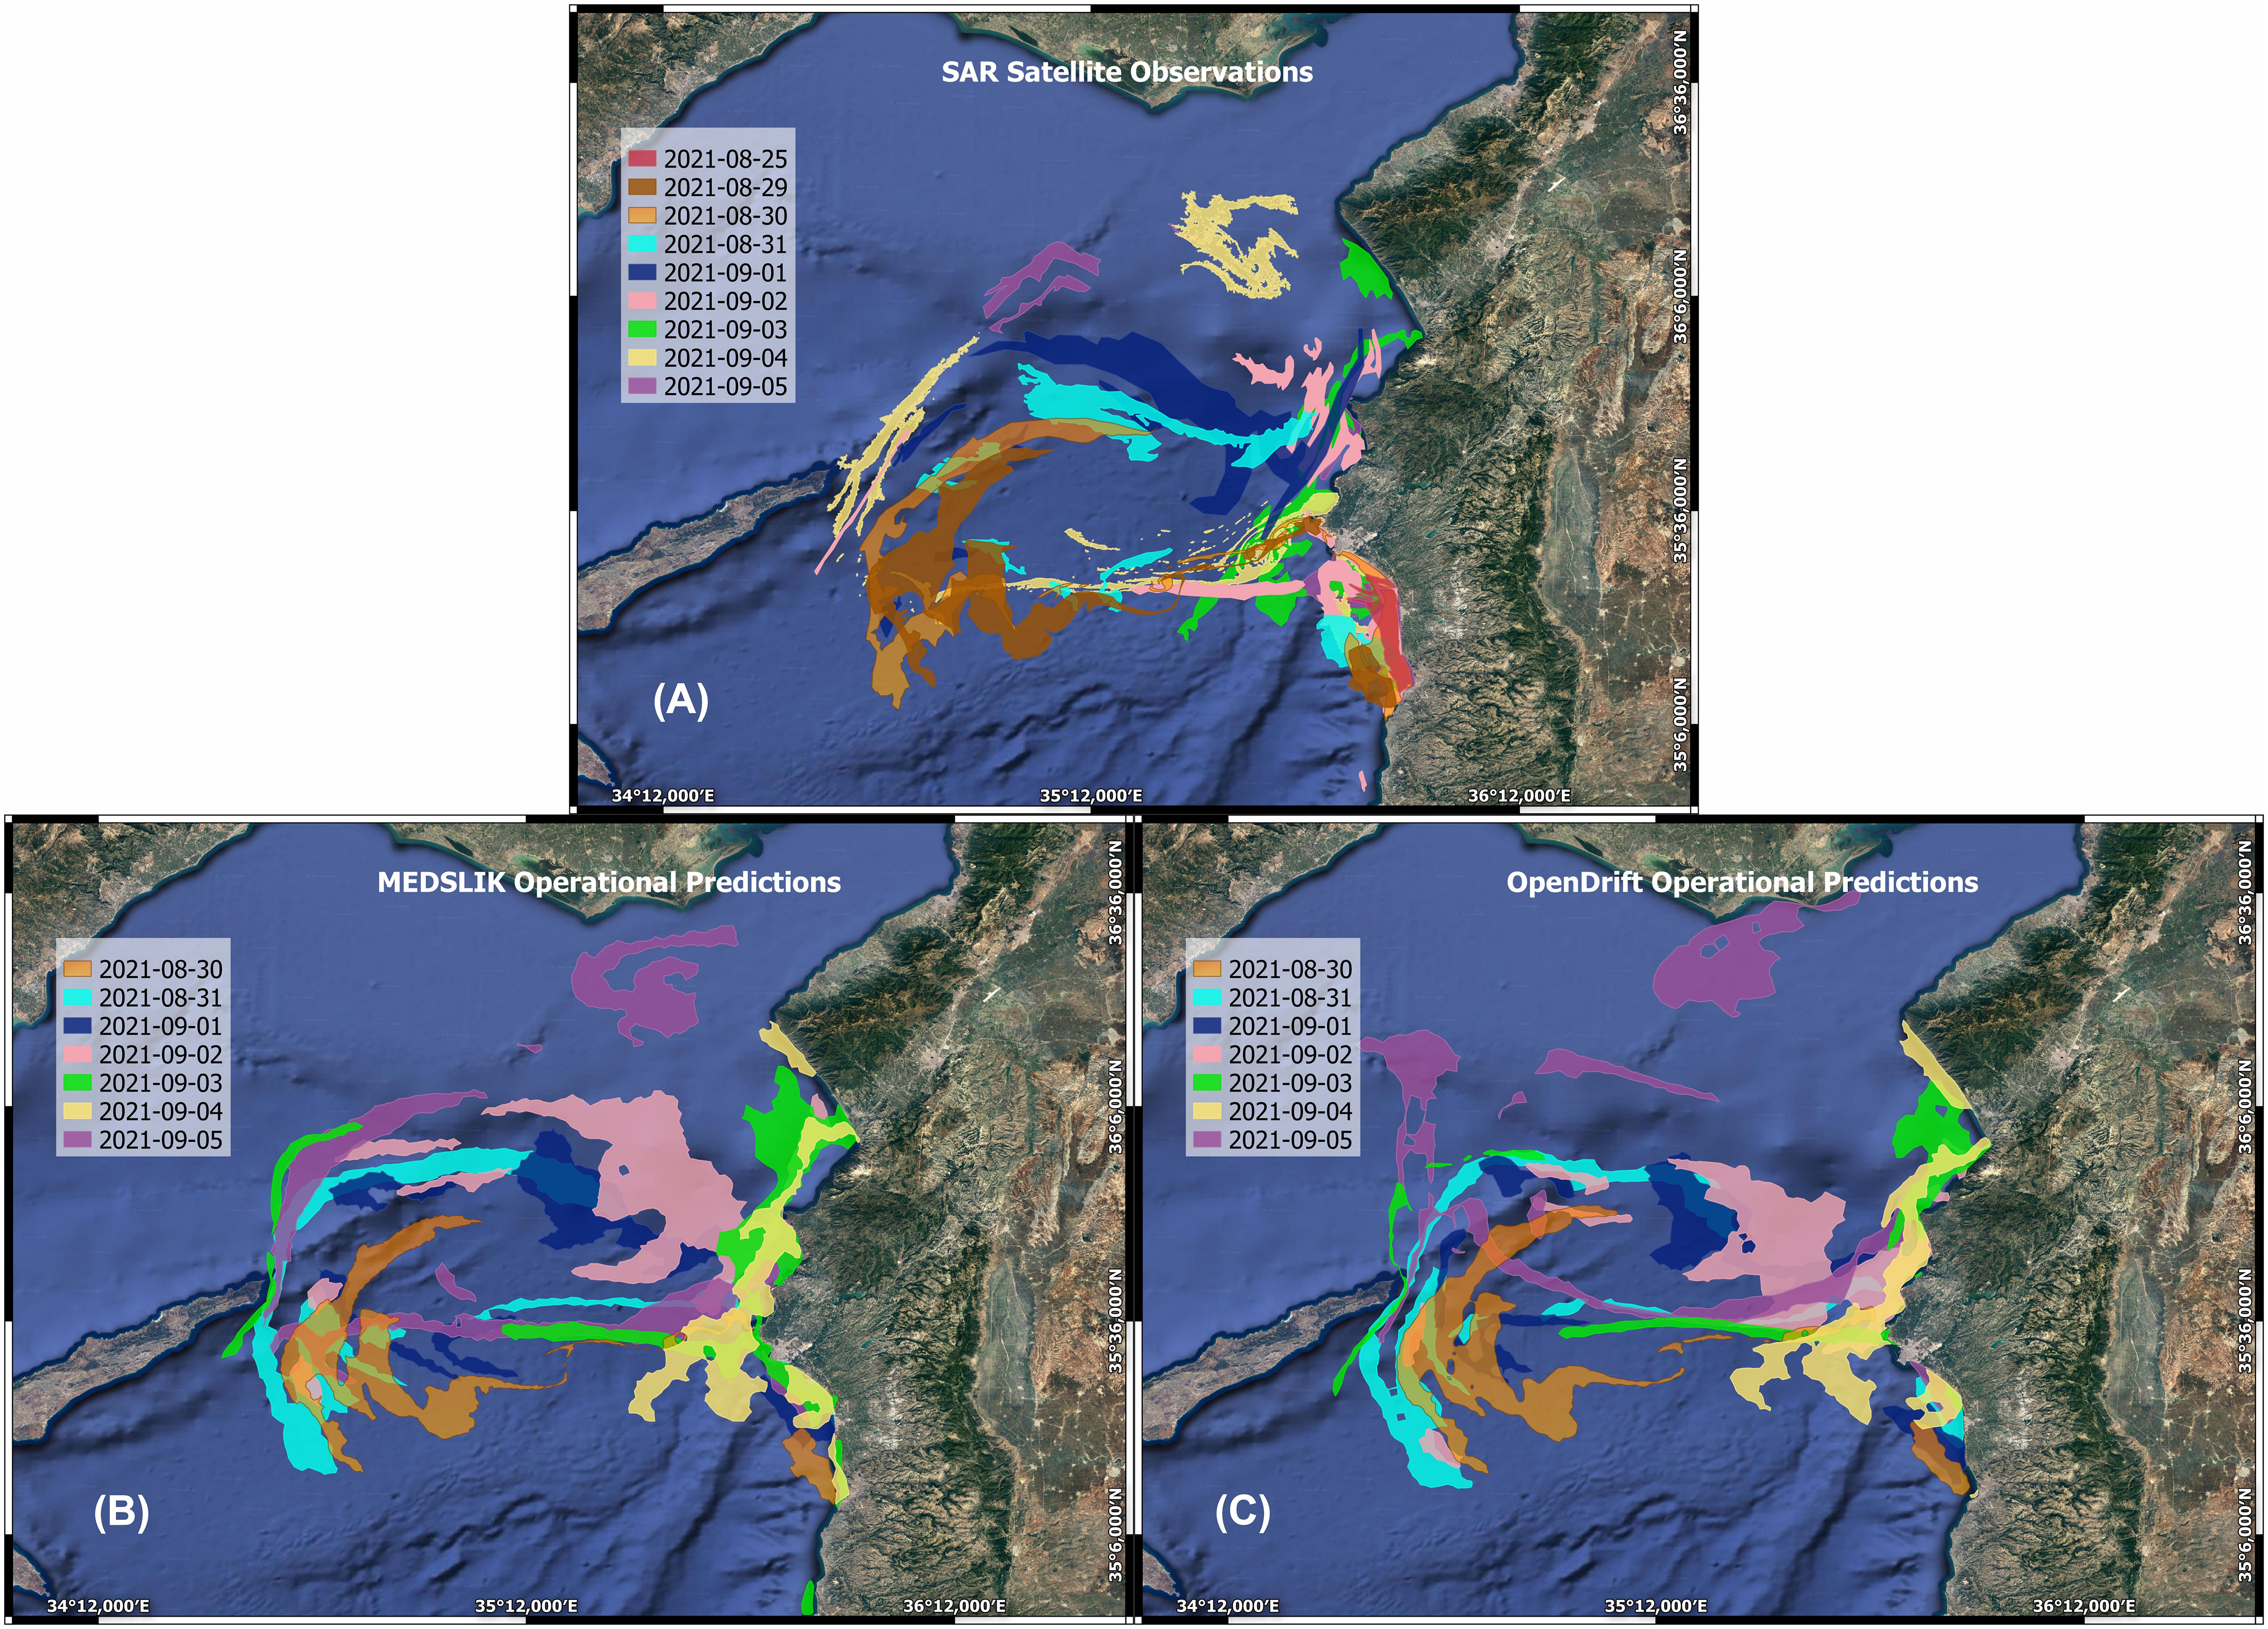
Figure 6 (A) Time evolution of the oil spill from August 25, 2021, to September 5, 2021, according to nine SAR satellite images. (B) Time evolution of the MEDSLIK operational predictions after 48 hours, from August 30, 2021 to September 5, 2021, initiated with the corresponding SAR images. (C) Time evolution of the OpenDrift operational predictions after 48 hours, from August 30, 2021 to September 5, 2021, initiated with the corresponding SAR images.
3.2 Post operational intercomparison scenarios between the MEDSLIK and OpenDrift predictions
Seven SAR images from Sentinel 1, detecting the offshore extent of the emulsified oil spill, were utilized for the purpose of the current metric analysis and the relevant oil spill simulations performed by MEDSLIK and OpenDrift models, using the SAR images obtained on: 29/08/2021 at 15:41 GMT, 30/08/2021 at 03:42 GMT, 31/08/2021 at 08:50 GMT, 01/09/2021 at 08:03 GMT, 02/09/2021 at 08:30, 03/09/2021 at 11:00 GMT, and 05/09/2021 at 15:33 GMT. Each XML file was associated with one specific satellite image and contained information for various oil slicks, each of which had multiple oil patches. Additionally, distinct XML files for each cohesive group of changes that probably belonged to the same package were provided.
3.2.1 Control run
To examine the level of convergence between the MEDSLIK and the OpenDrift oil spill predictions, a control run was initially carried out, using not only the same met-ocean data, but also the same horizontal diffusivity coefficient of 2 m2/s (Figure 7A). The SAR image of August 29, 2021, at 15:41 GMT was used to initiate the oil spill predictions for 12 hours ahead to make them comparable with the SAR image of August 30, 2021, at 03:42 GMT. The comparison of the predicted extent and the area coverage of the oil spills between the two models is shown to be fairly good (Figure 7A). Nevertheless, both models exhibited certain discrepancies, compared to the SAR-derived oil spill extent. After several tests, MEDSLIK showed better convergence with the SAR image of August 30, 2021, at 03:42 GMT, when using spatio-temporal variation in the horizontal diffusivity, based on the Smagorinsky approximation (Smagorinsky, 1963) (Figure 7B). In the following inter-comparison between the two models and between models and SAR images, MEDSLIK used non-constant horizontal diffusion, contrary to OpenDrift.
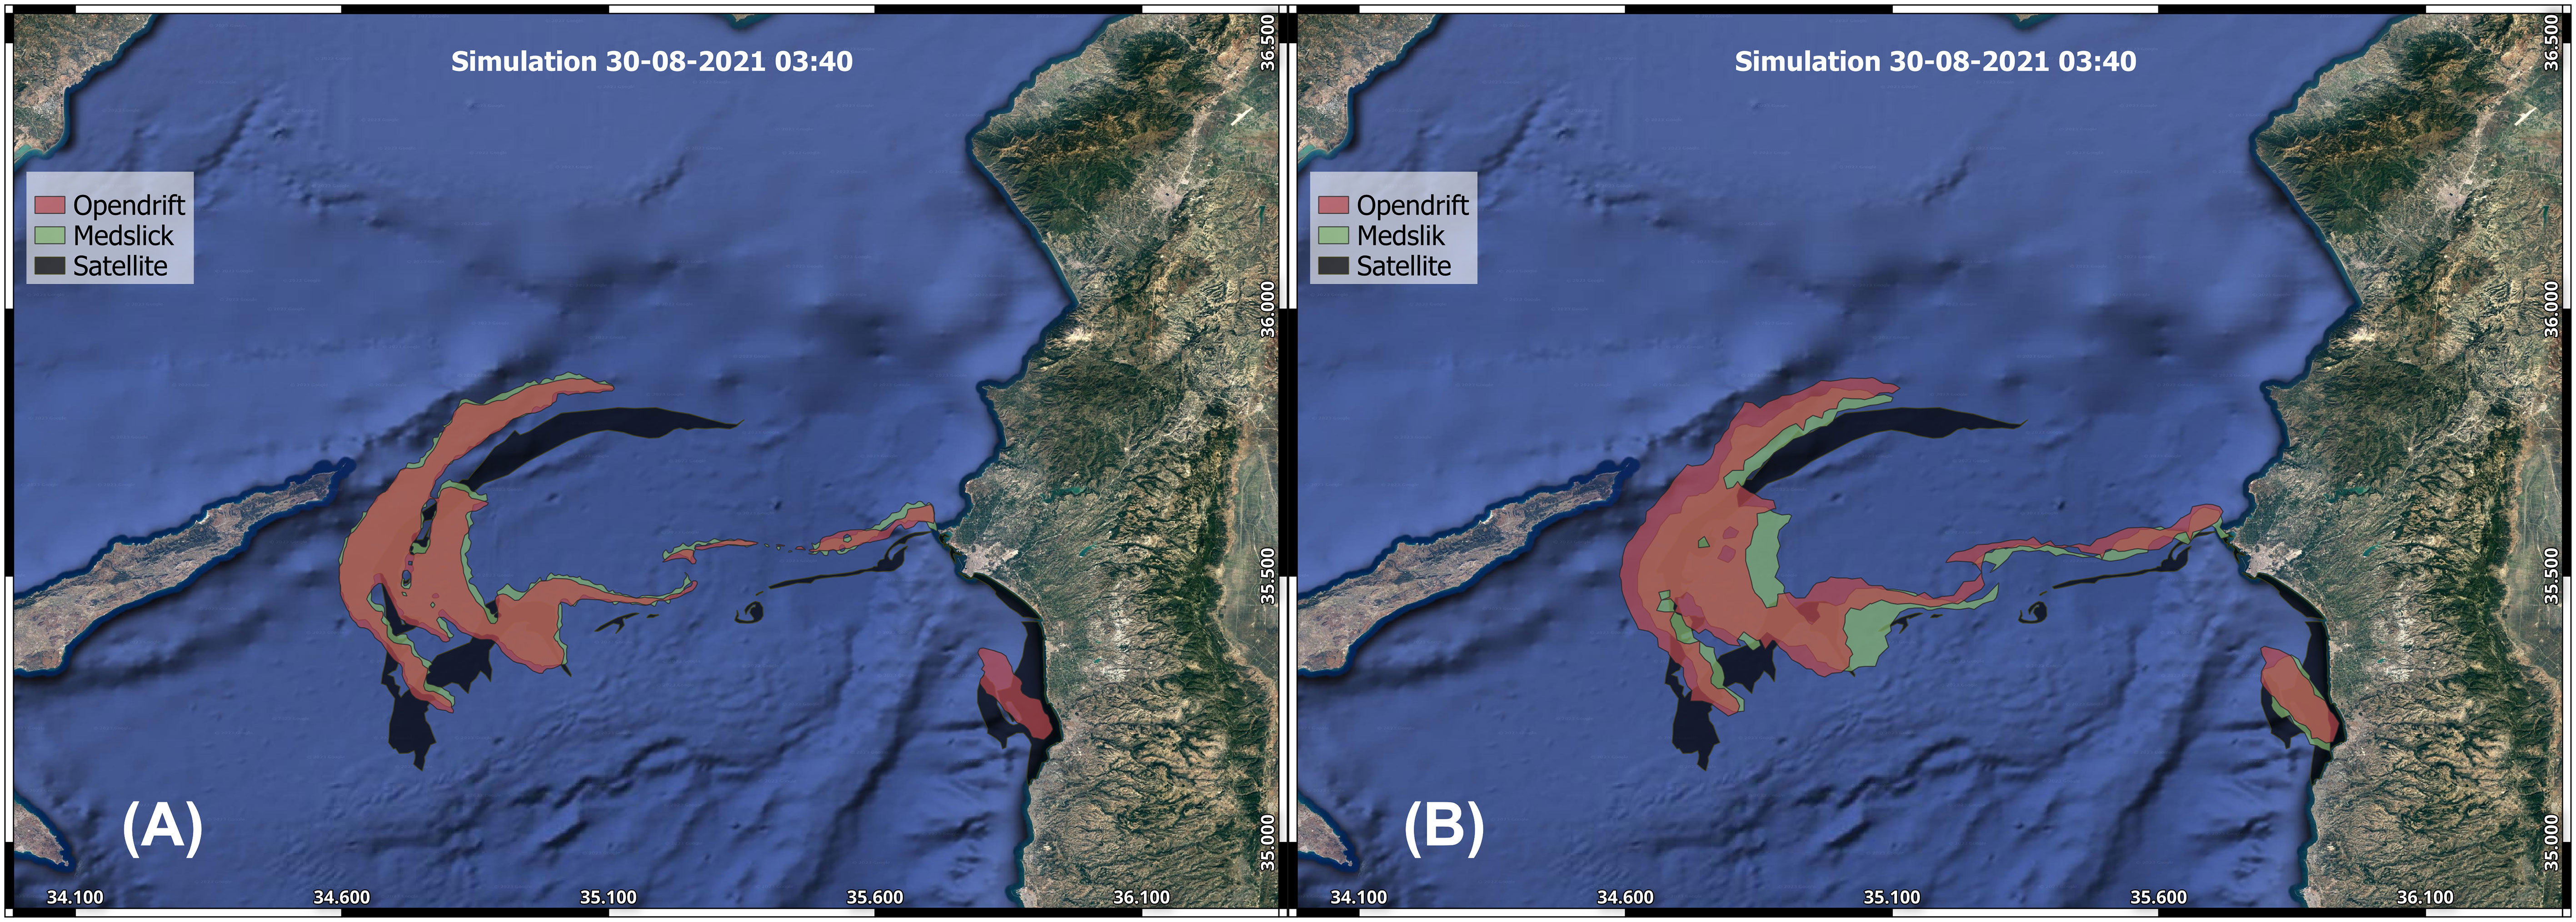
Figure 7 (A) Comparative analysis between MEDSLIK and OpenDrift models (area extend) using the same met-ocean data and same horizontal diffusion, and (B) with satellite data on August 30, 2021, at 03:42 GMT, after 12 hours of simulations initiated with the SAR image on August 29, 2021, at 15:41 GMT, using the same met-ocean data but the different horizontal diffusion. The green color is the MEDSLIK predictions, the brown color is the OpenDrift predictions, and the black color is the SAR data.
3.2.2 Intercomparison runs between the oil spill models
The first oil spill models’ run was initiated using the satellite image of August 29, 2021, at 15:41 GMT. The hourly oil spill predictions lasted until September 1, 2021, at 15:41 GMT. In general, the predictions from both models after 72 hours are very close and similar (Table 2). The main difference between the predictions of these two models lie at the western part of the oil spill, where according to OpenDrift, the oil spill was directed further south, along the southern peninsula of Karpasia (Cyprus), while according to MEDSLIK this movement was restrained. The eastern part of the oil spill seems to be directed northwards of Lattakia, according to OpenDrift, which is not the case in MEDSLIK’s prediction. Moreover, both models appear in agreement that the higher portion of oil remains on the sea surface and even seems to break into two parts, moving towards the northern and southern coasts of the Karpasia peninsula (Cyprus). Therefore, at the end of the three-day simulation, some particles adhered to the southern coastline of the Karpasia peninsula, while a fairly large percentage of the slick adhered to the northern and southern coasts of Syria (Figure 8A).
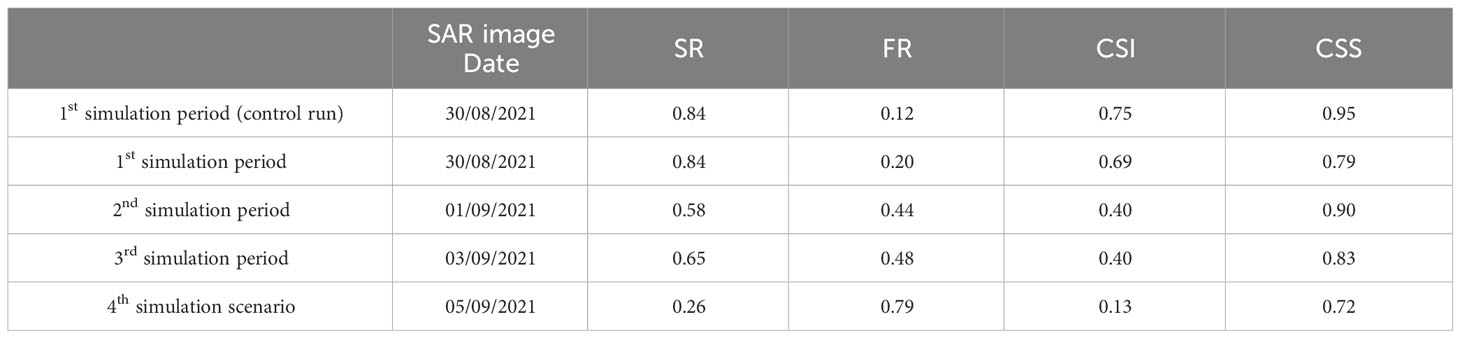
Table 2 Intercomparison metrics between the MEDSLIK and OpenDrift models.
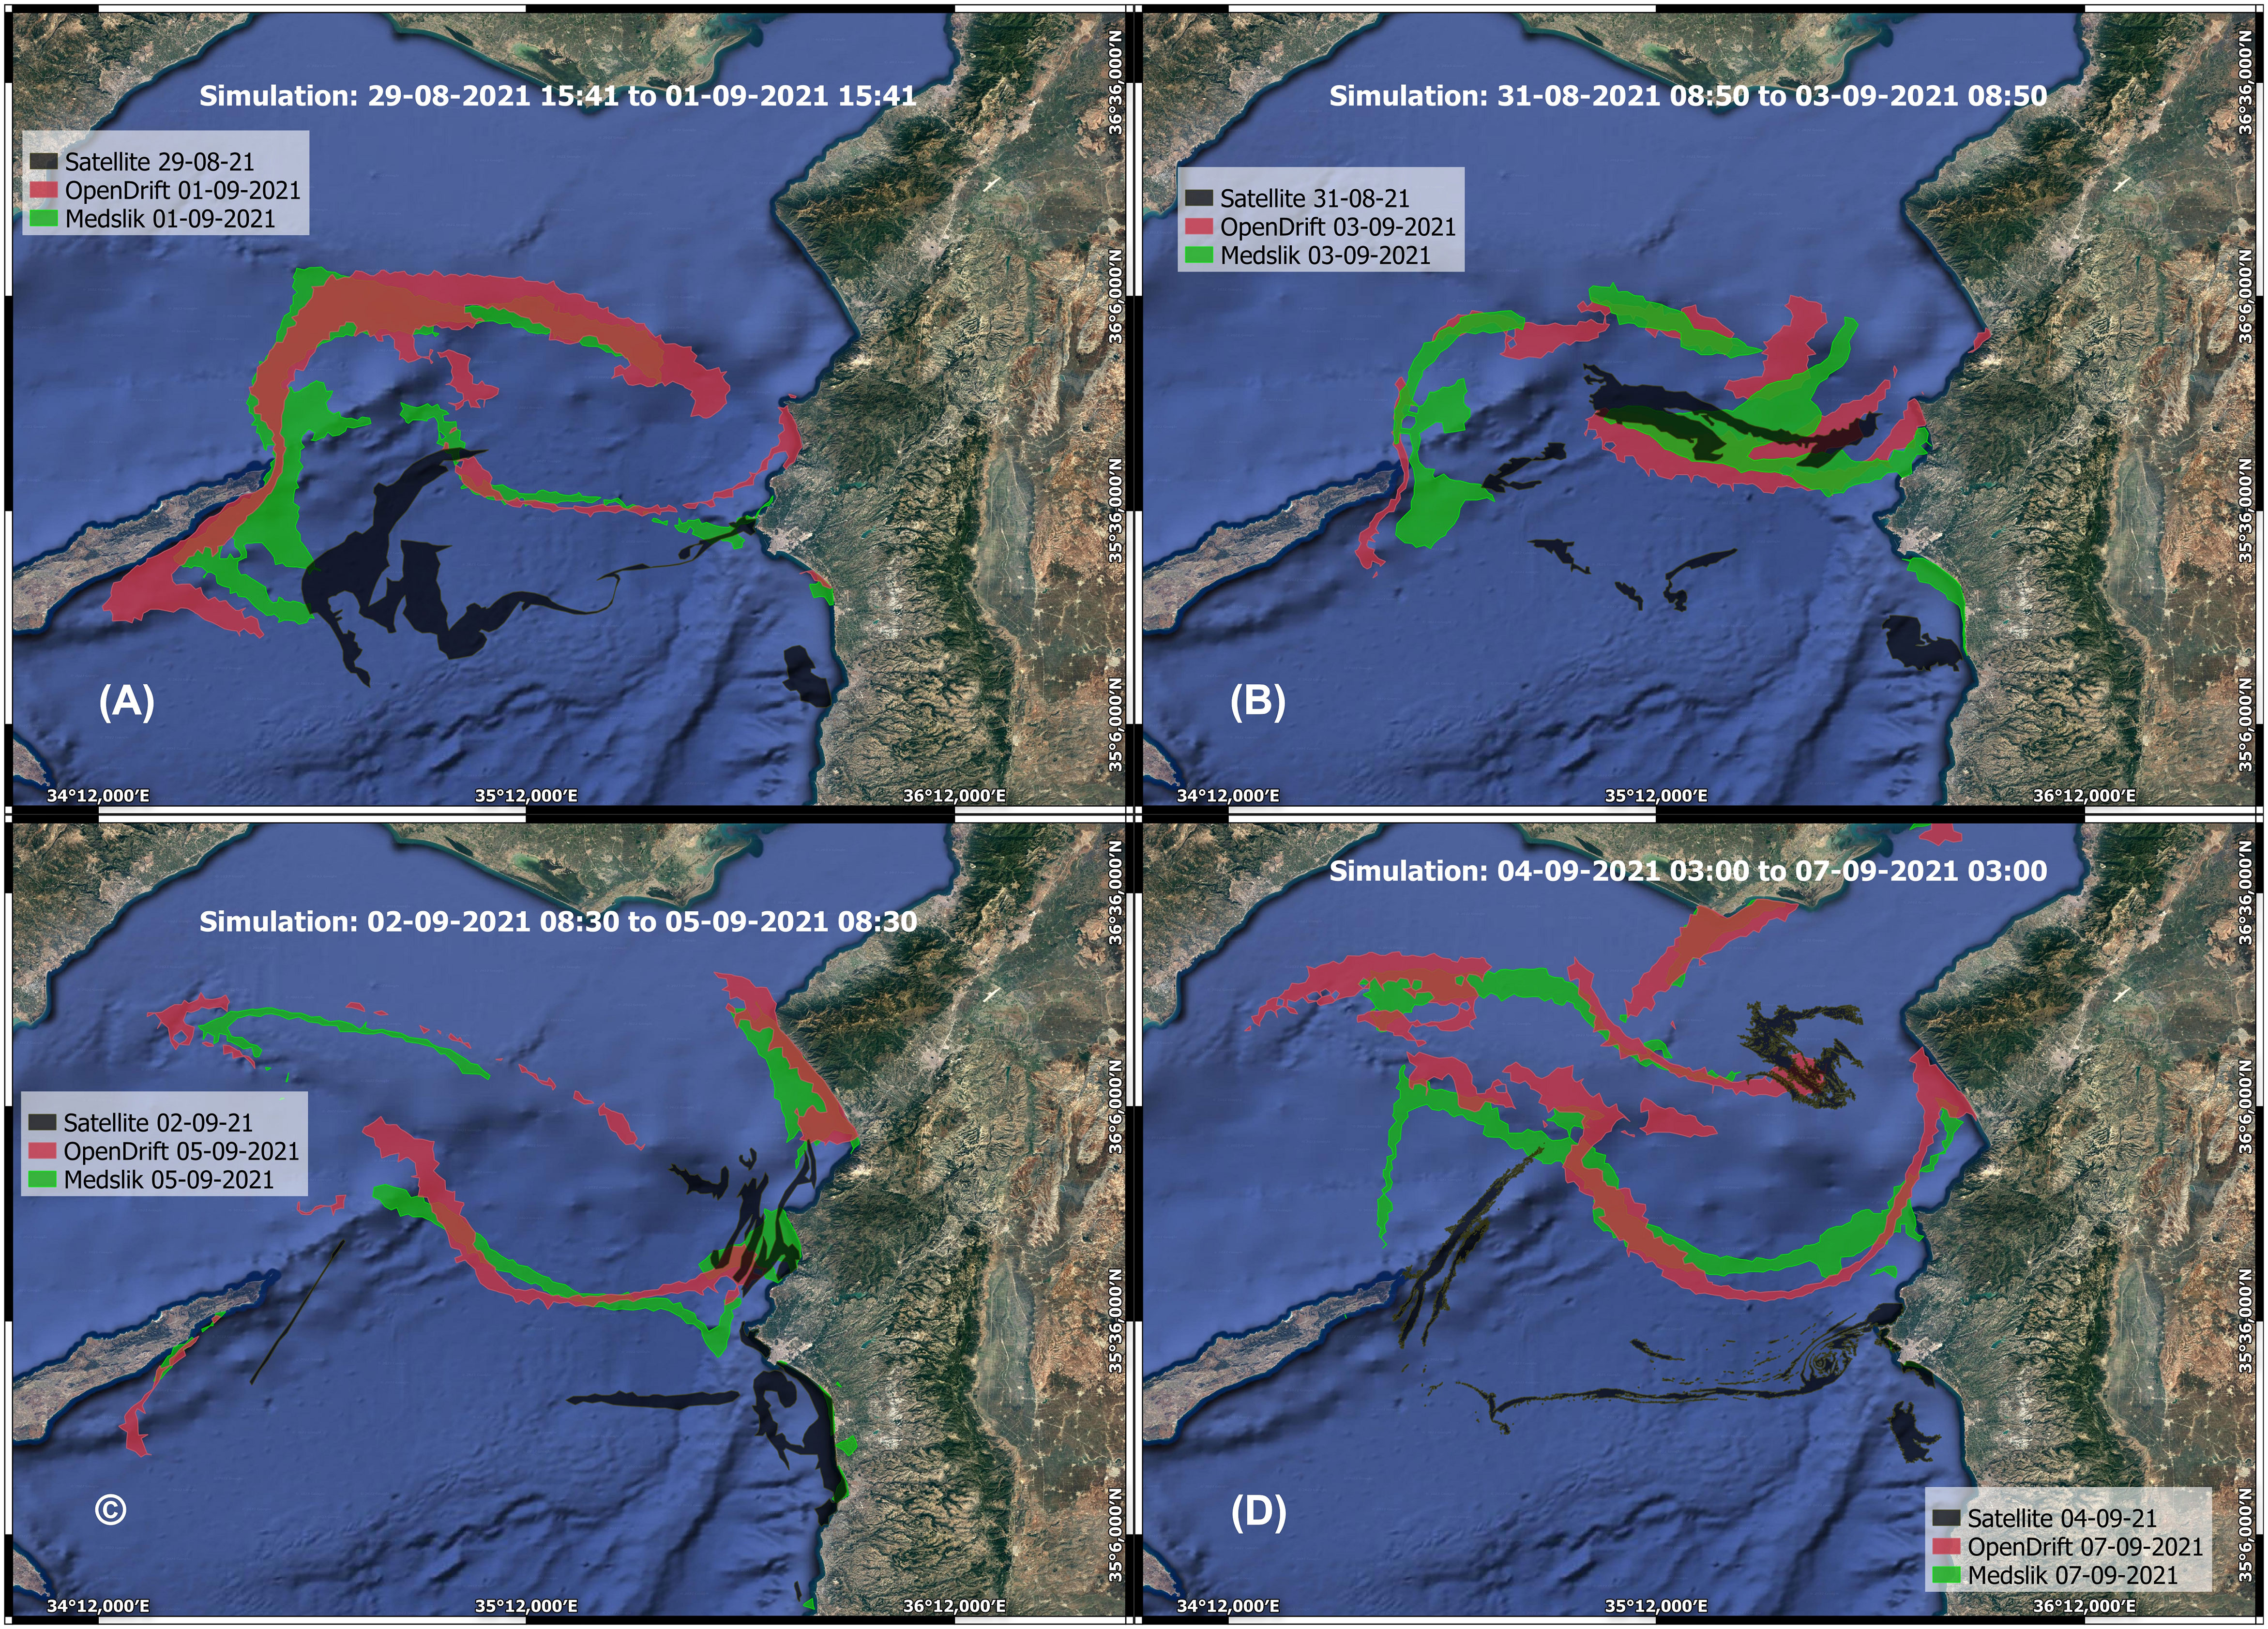
Figure 8 (A) Oil spill simulation at the NE Levantine, between Cyprus and Syria, at the end of a 3-day simulation (starting from August 29 at 15:41 GMT to September 1, 2021 at 15:41 GMT) produced by MEDSLIK and OpenDrift models. (B) Oil spill simulation at the NE Levantine, between Cyprus and Syria, at the end of a 3-day period (from August 31, 2021, 08:50 to September 3, 2021, 08:50) produced by MEDSLIK and OpenDrift models. (C) Oil spill simulation at the NE Levantine, between Cyprus and Syria, at the end of a 3-day period (from September 2, 2021, 08:30 to September 5, 2021, 08:30) produced by MEDSLIK and OpenDrift models. (D) Oil spill simulation at the NE Levantine, between Cyprus and Syria, at the end of a 3-day period (from September 4, 2021, 03:00 to September 8, 2021, 03:00) produced by MEDSLIK and OpenDrift.
The second run was initiated using the SAR image of August 31, 2021, at 08:50 GMT, and the oil spill predictions were carried out by both models until September 3, 2021, at 08:50 GMT. As shown in Figure 8B), both models produced comparable predictions. Besides, a large part of the oil remains on the sea surface, scattered in various places, mainly over the eastern part of Cyprus. According to OpenDrift, some parts of the slick remain on the sea surface to the south of the eastern coast of Cyprus, while a very small portion appears adjacent to the eastern coast of Cyprus and the coast of Turkey. Following MEDSLIK, a significant part of oil adhered to the coasts of Latakia and Jableh. Both models predicted that part of the oil spill would be rewashed to the coast.
Moreover, the third set of simulations was initiated using the SAR images collected on September 2, 2021, at 08:30 GMT. The oil spill predictions were carried out until September 5, 2021, at 08:30 GMT. In this run, the predictions of both models after 72 hours tend to follow the same shape with minor differences. The largest part of the oil adhered to the southeastern coasts of Turkey, while a very small part adhered to the most eastern part of Cyprus. Also, a significant portion of oil was re-washed on the north coast of Latakia, according to MEDSLIK. On the other hand, a small part of the oil remains at the sea surface, south of the eastern coastline of Cyprus, north towards the coasts of Erdemli and Atakent, as well as further east towards the coasts of Adali (Figure 8C).
Finally, the fourth simulation was initiated using the SAR image on September 4, 2021, at 11:00 GMT, producing oil spill predictions until September 5, 2021, at 08:30 GMT. In this run, as shown in Figure 8C, the two models depicted almost similar predictions, after 72 hours from the simulation start. It can be observed that after 3 days of simulation, the largest part of the oil spill was floating on the sea surface and moved towards the eastern coast of Turkey, in the NE Levantine. Thus, part of the oil spill was beached on the coast of Turkey near Karatas. On the other hand, a significant portion of the oil slick was adhered to the southeast coast of Turkey near Antakya, as shown by the OpenDrift, and a small portion of the oil was re-washed near the coast of Latakia in Syria, according to MEDSLIK (Figure 8D).
To ascertain the convergence of the predicted oil spill, extend, and geo-coverage of the two models, the metrics of four indicators were estimated, i.e., the success rate (SR), the failure rate (FR), the critical success index (CSI), and the centroid skill score (CSS) for the four inter-comparison scenarios between MEDSLIK and OpenDrift model results (Table 2).
Based on the estimated inter-comparison metrics between the MEDSLIK and the Open Drift predictions at the end of the first run, it appears that the convergence rate in the oil spill extend approaches 84% in the success rate for both runs with constant and non-constant horizontal diffusivity. For the second simulation period, despite the fact that the convergence rate of the two models is approximately 58%, the centroid skill score index (CSS = 0.90) remains very good. Similarly, for the third run, the convergence rate reaches 65% with a very good centroid skill score index of 0.83. Finally, for the fourth simulation period, the two models exhibit very low convergence (~ 26%), even though the centroid skill score index is rather good (CSS = 0.72). Therefore, in general, the two models reveal quite comparable predictions, having mostly high convergence rates and centroid skill scores, even though MEDSLIK used the variable horizontal diffusion, compared to the constant value used in OpenDrift.
3.3 Intercomparison of MEDSLIK and OpenDrift’s predictions against satellite SAR observations
In this section, the intercomparison between the predicted oil spillages reproduced by the two oil spill models (MEDSLIK and OpenDrift) is evaluated against the corresponding satellite SAR images using the four indices applied previously.
Comparative analysis of the MEDSLIK and OpenDrift oil spill extends against the SAR image on August 30, 2021, at 03:41, i.e., after 12 hours of simulation for the first period, illustrates that both models predict closely to each other, and at certain areas, their oil spill extends were overlaid on each other (Figure 7B). In addition, it is observed that their oil spill extent is very well convergent with the SAR satellite image (Figure 7B). This is indicated by the corresponding indicators in Table 3; SR and FR indices reveal that the convergence rate of both MEDSLIK and OpenDrift with the satellite image is around 33%. This reveals that, aside from the CSS index, model runs with variable horizontal diffusivity performed better in terms of statistical metrics. Furthermore, the Critical Success Index (CSI) depicts much lower value for both models (15%–16%) for first run. On the other hand, the CSS index is very high for both models (CSS = 0.89 for MEDSLIK and CSS = 0.86 for OpenDrift), when compared to the SAR image collected on August 30, 2021, at 15:41.
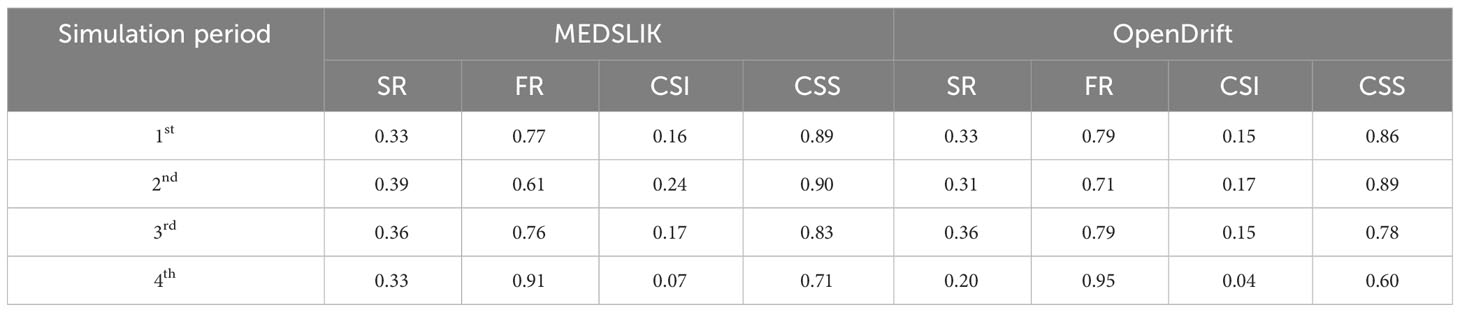
Table 3 Comparison indicators for the MEDSLIK and OpenDrift predictions against the satellite SAR data.
Discrepancies between MEDSLIK and OpenDrift model outputs and the SAR-derived slick may be attributed to: a) the rather low temporal resolution (6 hourly) of the complex hydrodynamic field (cyclonic and anticyclonic eddies and jets forcing the oil spill), b) the limited knowledge of the exact oil properties and oil weathering processes, where a portion of the oil may have evaporated or emulsified, thus remaining undetected, c) oil patchiness, and the sinking and resurfacing of oil patches, affecting the shape and the center of gravity of the slick. Such patches cannot be simulated by the model and when sank cannot be detected by SAR, lowering models’ performance metrics.
The comparative analysis of the MEDSLIK and OpenDrift oil spill extends against the SAR image of September 1, 2021, at 08:03, i.e., after 24 hours of simulation in the second run, which was initiated with the SAR image on August 31, 2021, at 08:50 GMT, shows that both model predictions are very close to each other. At certain areas, the predicted oil spills were overlaid on each other (Figure 9). In addition, it is observed that the simulated oil spill is partially convergent with the SAR satellite image, obtained after 24 hours (Figure 9). This is indicated by the corresponding indicators in Table 3, where for the second simulation period, the SR and FR indicators reveal the convergence rate of MEDSLIK is 39% and for OpenDrift is 31%. In parallel, the Critical Success Index (CSI) seems to be rather low for both models (24% and 17%, respectively). On the other hand, the CSS index is very high for both models (CSS = 0.90 and CSS = 0.89, respectively).
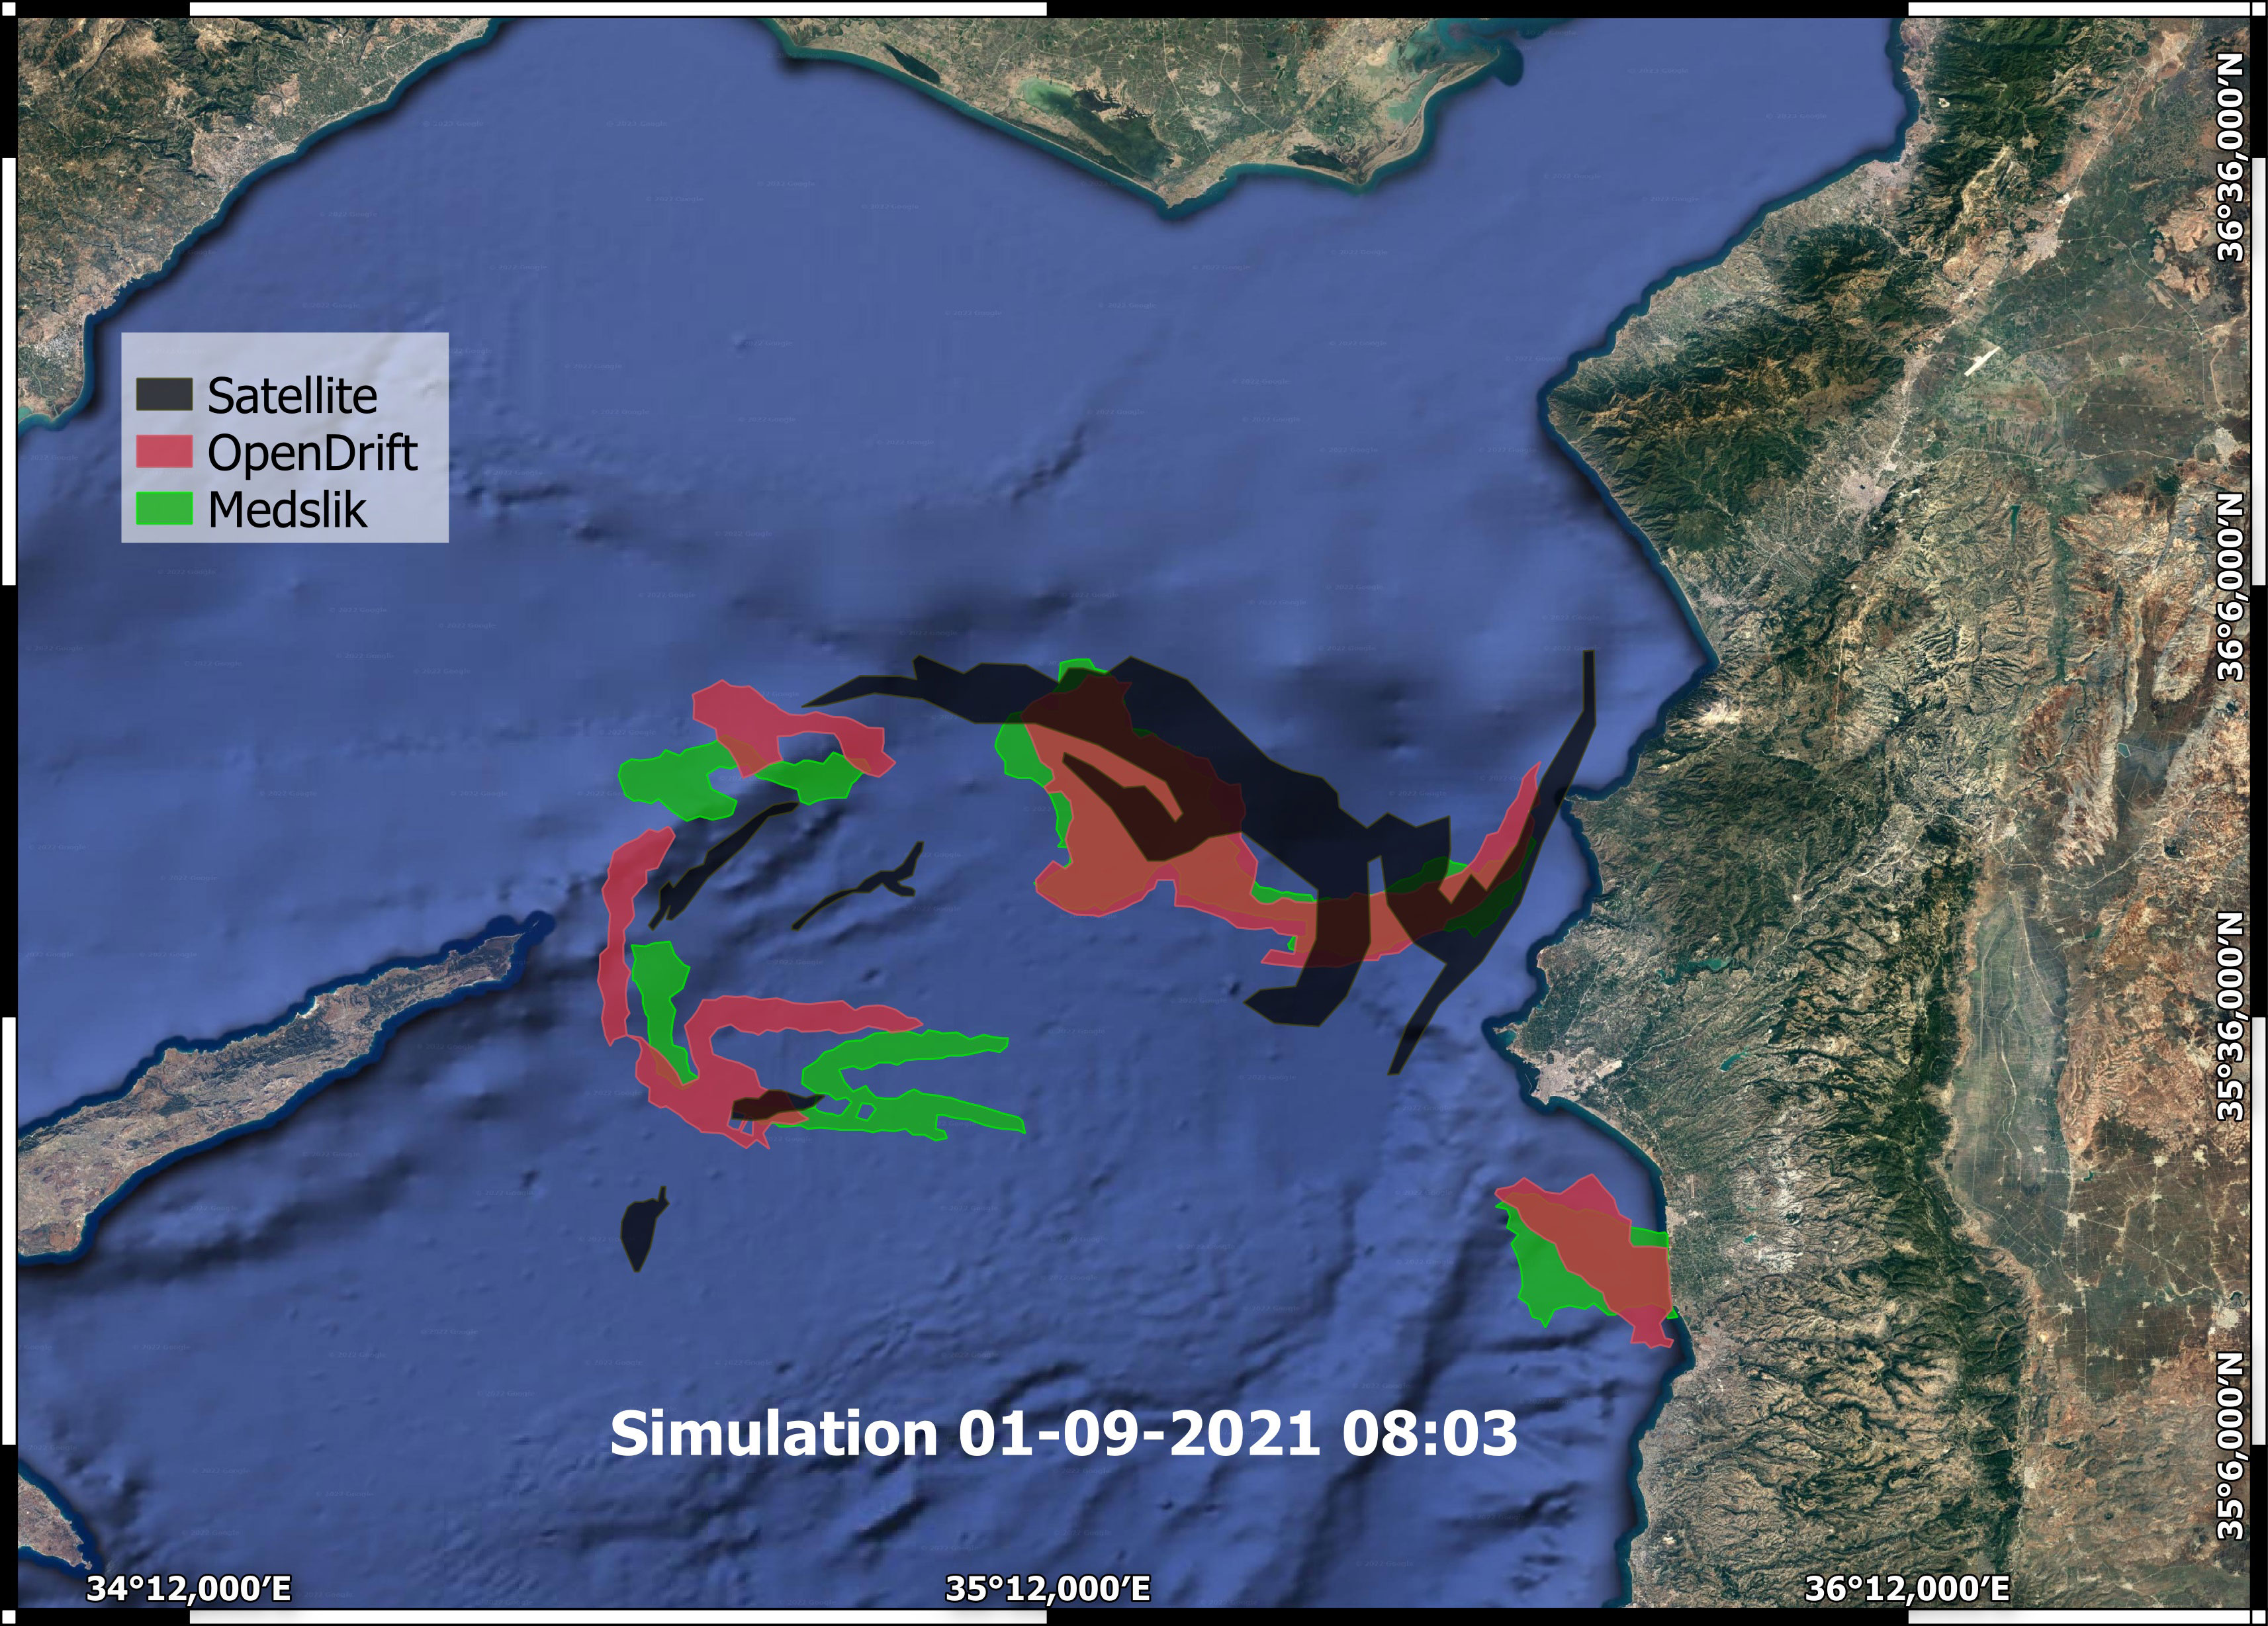
Figure 9 The comparative analysis of the MEDSLIK- and OpenDrift-based oil spill extends against the SAR image of September 1, 2021, at 08:03, after 24 hours of simulation of the first run (initiated with the SAR image of August 31, 2021, at 08:50). The red color expresses the results of OpenDrift, the green color indicates the results of MEDSLIK, and the black color is satellite data.
In the third simulation period, the satellite image obtained on 3/09/21 11:00 and the associated MEDSLIK and OpenDrift results were used for inter-comparison. It is noticed that the oil spill coverage produced by both models was rather similar (Figure 10). This is also shown by the indicators, as their convergence rate is 65%, according to the success rate (SR), while their centroid skill score index (CSS = 0.83) is rather good. The inter-comparison of the two oil spill models (MEDSLIK and OpenDrift) against the SAR image, after 25 hours of simulation (initiated with the SAR image of the 02/09/2021 at 08:30), seems to be fairly good, with the convergence rate of 36% for both models, with a high CSS index of 0.83 for MEDSLIK and 0.78 for OpenDrift.
Finally, in the fourth simulation run the satellite image on September 5, 2021, at 15:33 and the associated MEDSLIK and OpenDrift results were inter-compared. It is noticed that the predicted oil spill coverage after 31 hours of simulation (initiated with the SAR image of 04/09/2021 at 08:09) do not match well. (Figure 11). This is also highlighted by the indicators in Table 3, as their convergence rates are 33% and 20%, respectively, according to the Success Rate (SR). Moreover, it is observed that the results of the two oil spill models show some deviation compared to the satellite image (Figure 11). The CSS index is generally high for MEDSLIK and OpenDrift (CSS = 0.71 and 0.60, respectively).
It is worth mentioning that the CSS values of 0.60–0.90 demonstrate a rather good performance skill in comparison with the Ulysse-Virginia oil spill (the North-Western Mediterranean, 2018), where CSS varied 0.5–0.7 (Liubartseva et al., 2020) and the previous test cases (Liu and Weisberg, 2011; De Dominicis et al., 2014; Ribotti et al., 2019). This confirms that the model performance is progressively improving.
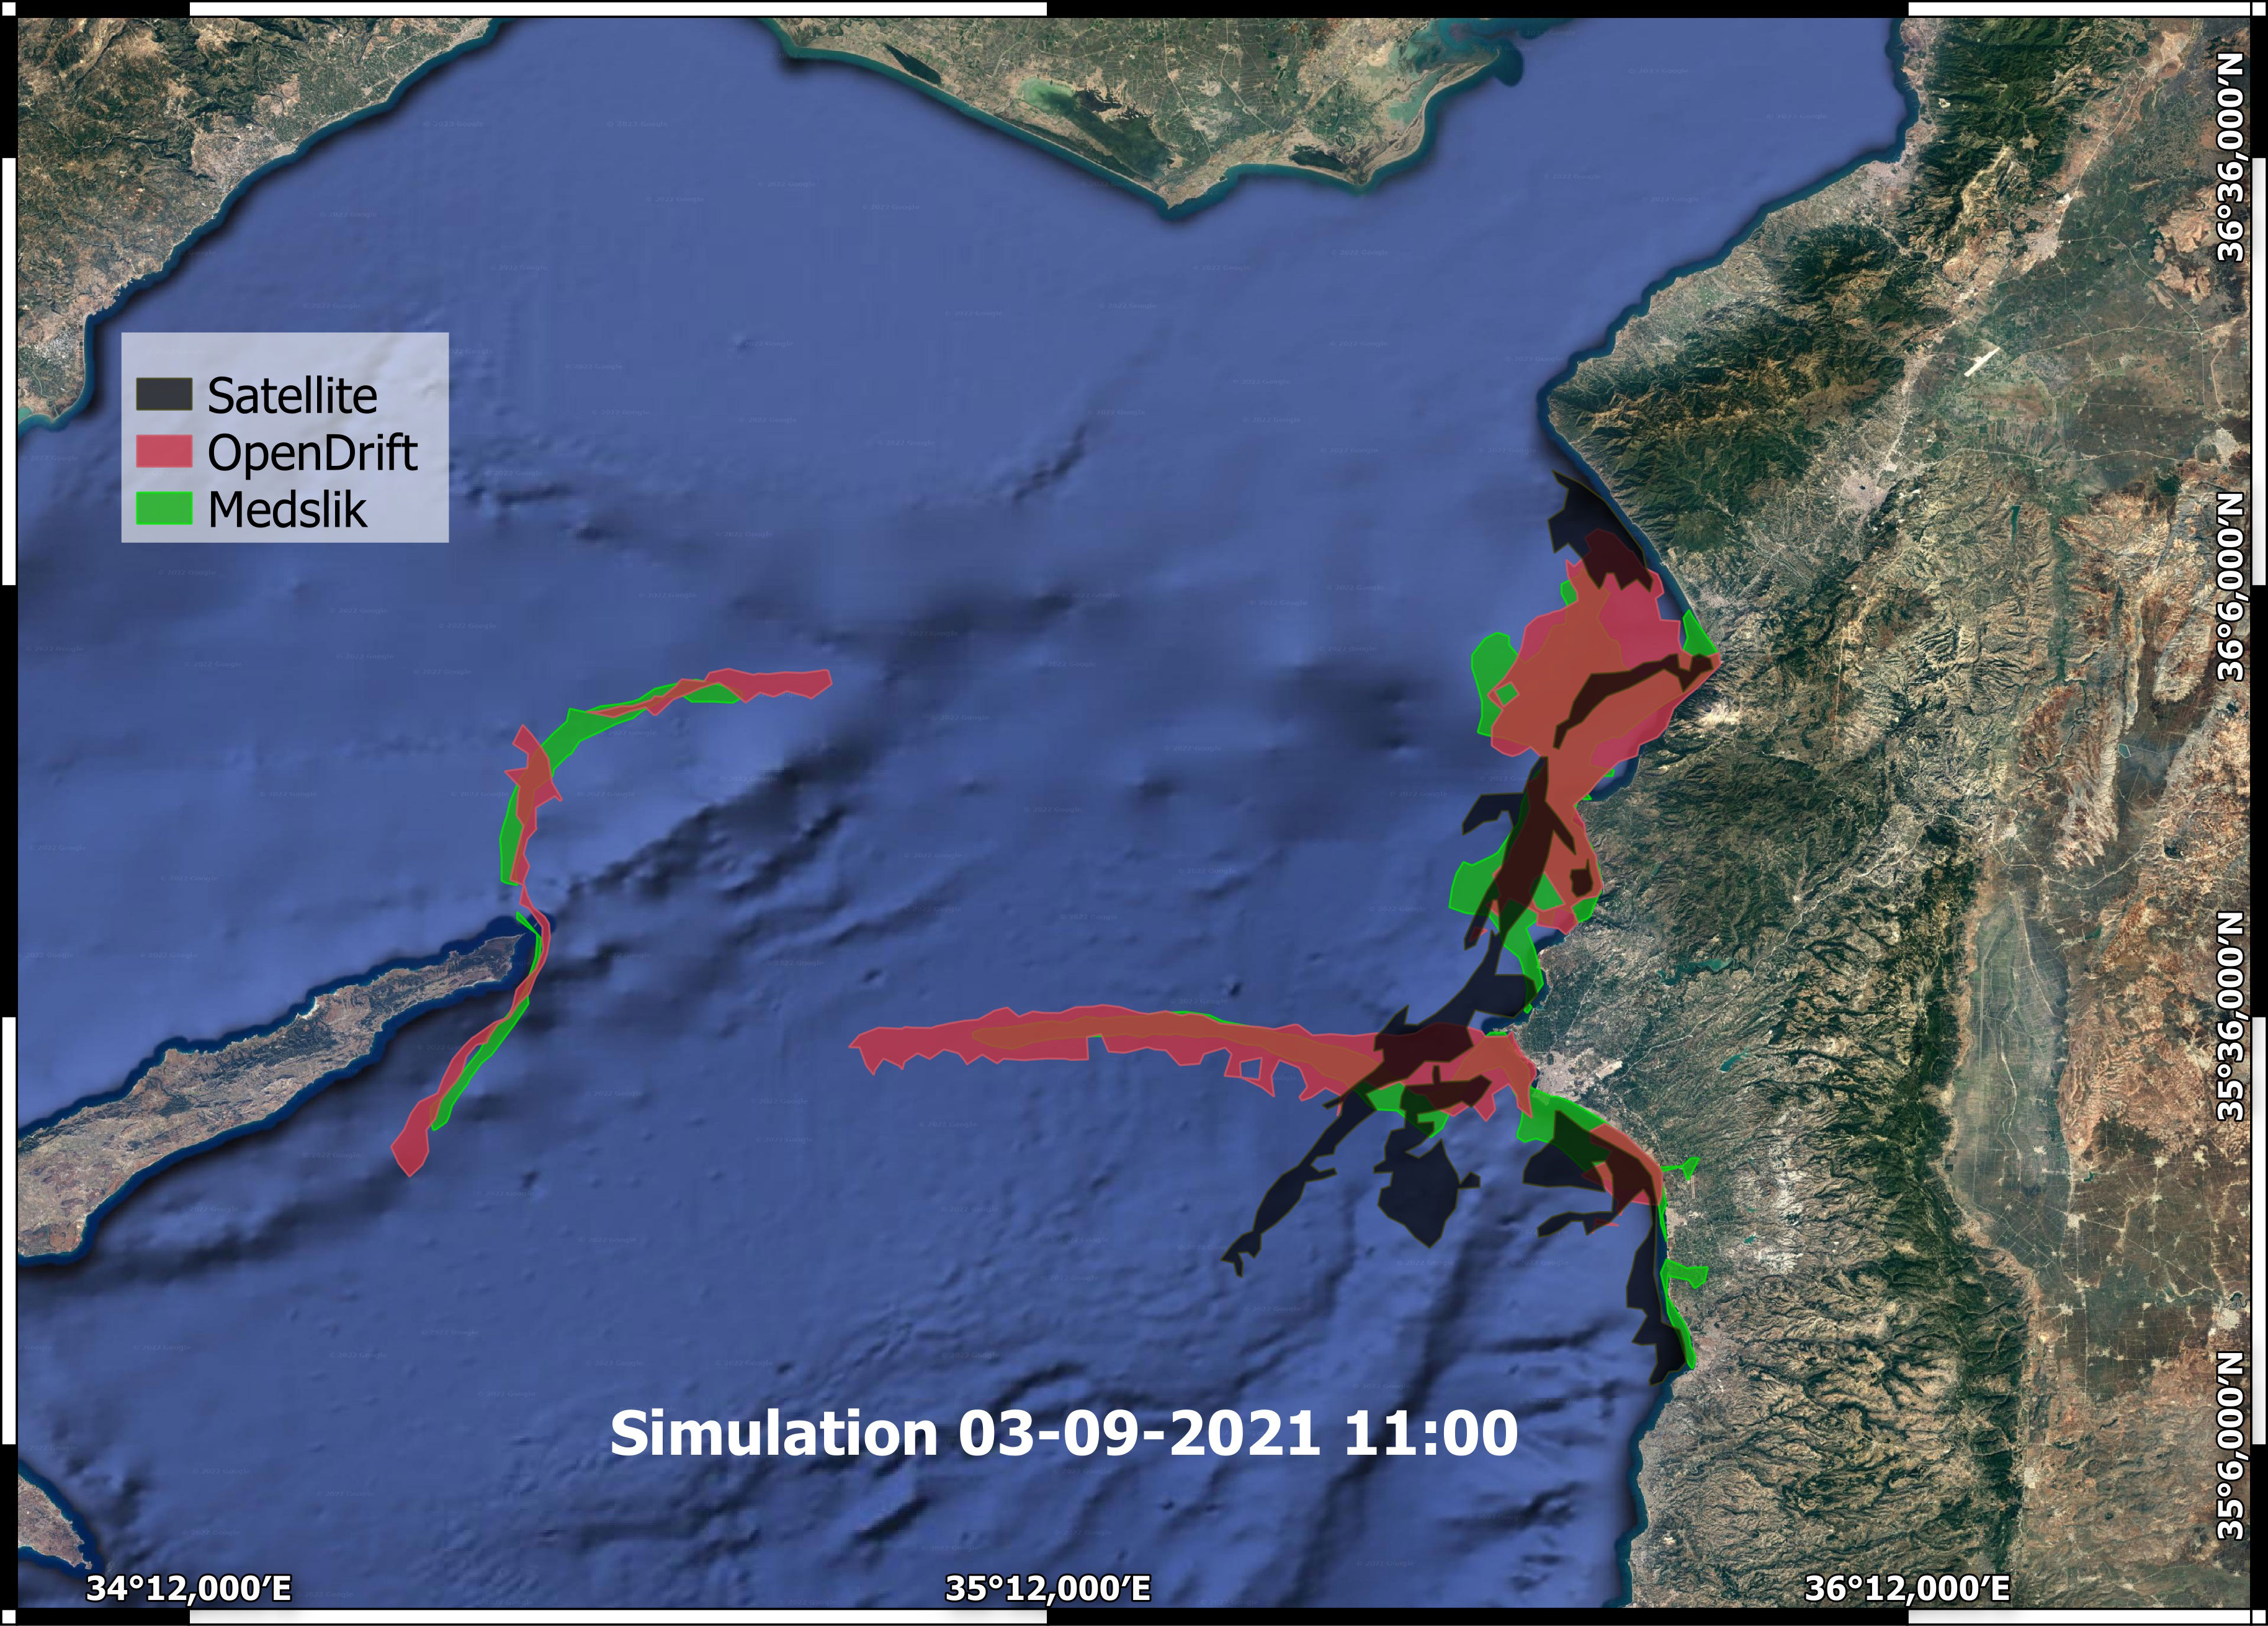
Figure 10 The comparative analysis of the MEDSLIK- and OpenDrift-based oil spill extends against the SAR image on September 3, 2021, at 11:00, after 25 hours of simulation of the third scenario (initiated with the SAR image of September 2, 2021, at 08:30). The red color expresses the results of OpenDrift, the green color indicates the results of MEDSLIK, and the black color is satellite data.
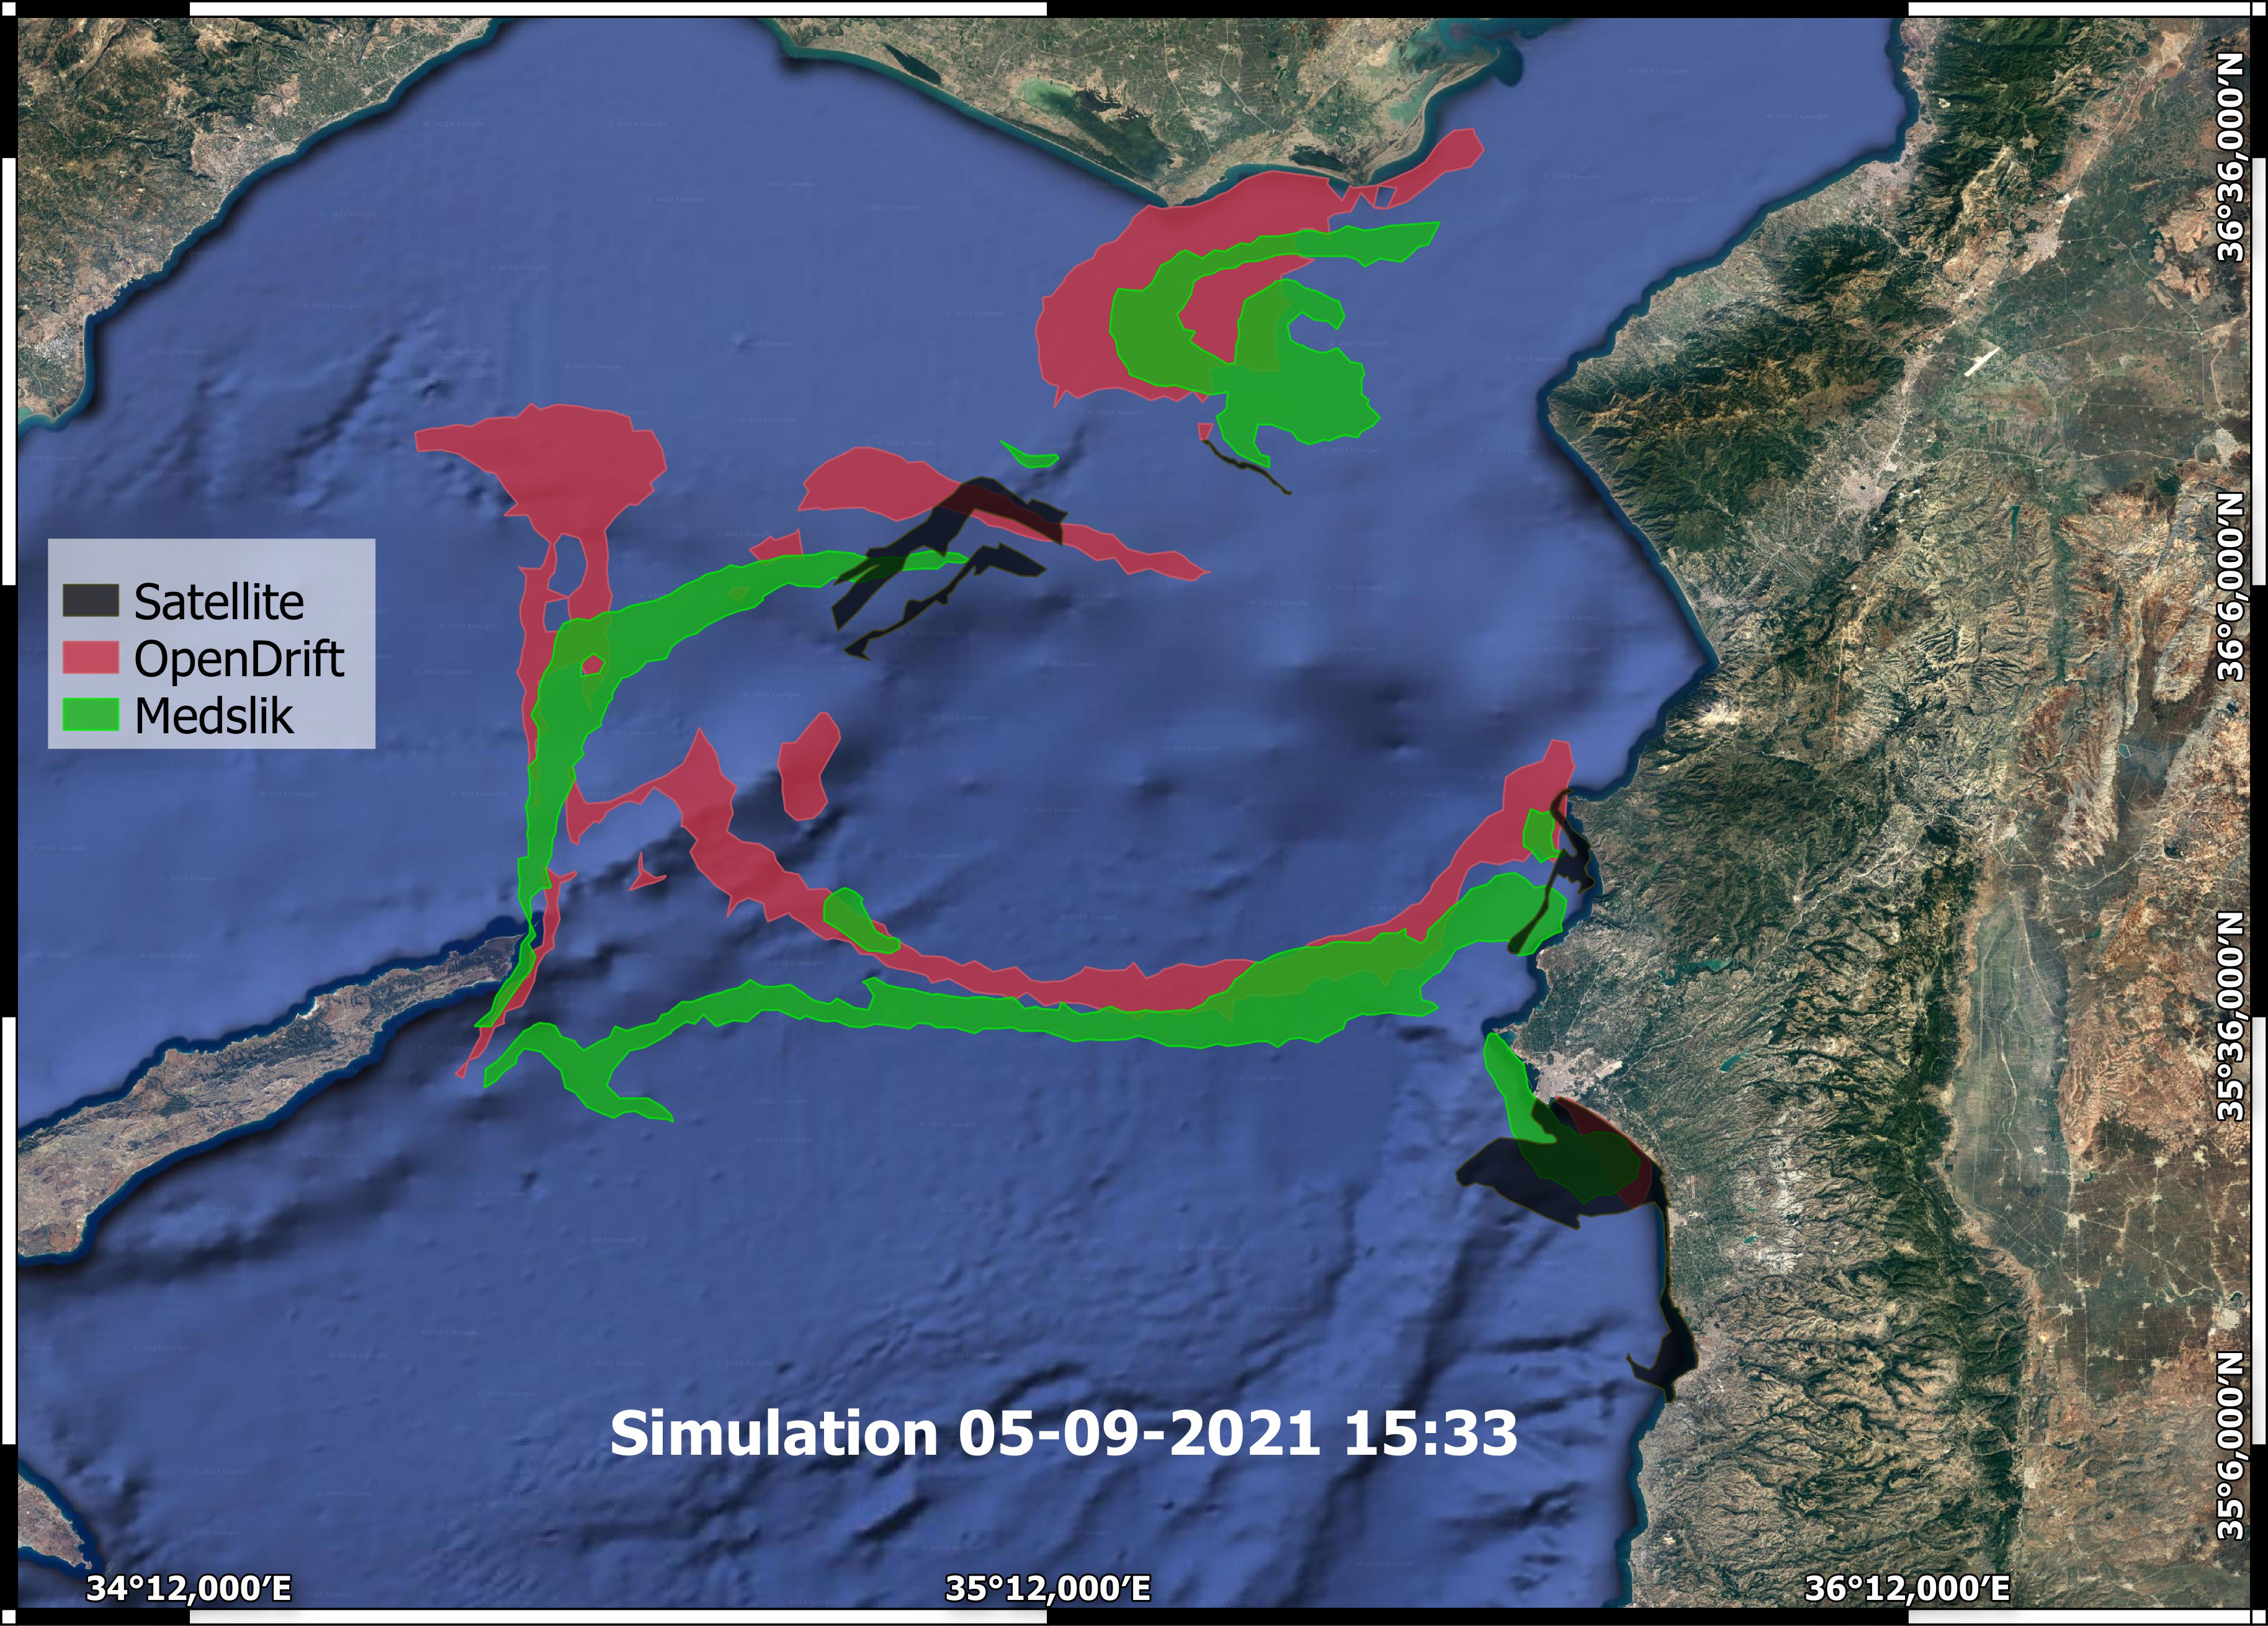
Figure 11 The comparative analysis of the MEDSLIK- and OpenDrift-based oil spill extends against the SAR image on September 5, 2021, at 15:33, after 31 hours of simulation of the third scenario (initiated with the SAR image of September 4, 2021, at 08:09). The red color expresses the results of OpenDrift, the green color indicates the results of MEDSLIK, and the black color is satellite data.
4 Conclusions
The Baniyas PP incident in August–September 2021 is considered the second biggest oil pollution incident in the Eastern Mediterranean Levantine basin, and it was of the same order of magnitude as the one caused by the Jieh PP during the Lebanon oil pollution crisis in July 2006.
For the first time, the Baniyas PP oil spill trajectories and expansions were simulated with the MEDSLIK and the OpenDrift oil spill models and comprehensively analyzed at the post operational stage. The modeling was performed under the same high-resolution met-ocean forcings and configurations (CYCOFOS and SKIRON). Model results were used to evaluate the 3-day forecasted location and extent of the oil spill compared to the respective SAR images, obtained in 12, 24, 25, and 31 hours after the initialization of the oil spill models.
Thus, this work introduces and highlights four suitable, satellite-based quantitative performance metrics (SR, FR, CSI, CSS) to evaluate the spatial overlap from the outcomes of the two oil spill models against SAR satellite observations. The performance metrics quantified the predicted extent from the two oil spill models, showed that: a) the success rate (SR) remains unchanged at fair levels of agreement in all runs of both the MEDSLIK and OpenDrift models, ranging between 0.31–0.39, b) the failure rate (FR) varies between 0.61 and 0.95, among consecutive simulations, c) the critical success index (CSI) reveals rather low values (0.04–0.24), and d) the centroid skill score (CSS) reaches rather high levels, between 0.60 and 0.90. The progressive CSS increase in the oil spill history reveals that oil spill modeling skills are constantly improving. Overall, the estimated metrics for the MEDSLIK oil spill extent in all simulations appeared slightly better than those of OpenDrift, attributed to the fact that MEDSLIK used the variable spatial-temporal horizontal diffusion, as opposed to the constant value used in OpenDrift.
Finally, it should be concluded that the high quality of the employed met-ocean forcing is the key factor explaining the fair agreement model between predictions and the SAR images in the dynamically complex NE Levantine area. Currently, working on real oil spills, we use more satellite-derived data with better quality, which, in turn, stimulates further model development.
Data availability statement
The raw data supporting the conclusions of this article will be made available by the authors, without undue reservation.
Author contributions
PK: Formal analysis, Investigation, Methodology, Validation, Visualization and Writing – original draft. NK: Software, Validation, Visualization, Writing – original draft. GZ: Validation, Visualization, Writing – original draft, Writing- review & editing, Data curation, Formal analysis, Investigation, Methodology, Software, Supervision. GS: Conceptualization, Data curation, Formal analysis, Investigation, Methodology, Supervision, Validation, Writing – original draft, Writing – review & editing. GC: Data curation, Formal analysis, Investigation, Software, Visualization, Writing – review & editing. JP: Writing – review & editing, Data curation, Methodology, Software. PB: Writing – review & editing, Data curation, Methodology, Software. AS: Writing – review & editing, Data curation, Methodology. RL: Software, Writing – review & editing. SL: Writing- review & editing, Data curation, Formal analysis, Investigation, Methodology. DS: Writing – review & editing, Data curation, Methodology, Software, Visualization. MS: Writing – review & editing, Data curation, Methodology, Software, Visualization. AN: Data curation, Methodology, Writing – review & editing. FV: Writing – review & editing, Data curation, Methodology, Visualization.
Funding
The author(s) declare financial support was received for the research, authorship, and/or publication of this article. This research was partially funded by the European Union’s Horizon 2020 Research and Innovation Program (H2020-BG-2018-2020), Grant Agreement number: 101000302 — “Ecoscope: Ecocentric management for sustainable fisheries and healthy marine ecosystems”. The article reflects only the authors’ views and the Commission is not responsible for any use that may be made of the information it contains.
Acknowledgments
The forecasting sea currents data used in the present study are from CYCOFOS downscaled from Copernicus Marine Environmental Monitoring Service for the Mediterranean Sea (Simoncelli et al, 2019; Clementi et al, 2021; Korres et al., 2021), while the forecasting winds are from the SKIRON atmospheric forecasting system of the University of Athens. The satellite data that traced the oil slicks is from ESA and from EMSA CSN. The authors thank Mrs. Marine Argyrou, a Director of the Department of Fisheries and Marine Research (DFMR), and Mr. Marinos Ioannou, a Head of the Marine Service at DFMR, for providing the EMSA CSN warning reports during the operational oil spill predictions.
Conflict of interest
Authors JP and PB was employed by Orbital EOS.
The remaining authors declare that the research was conducted in the absence of any commercial or financial relationships that could be construed as a potential conflict of interest.
Publisher’s note
All claims expressed in this article are solely those of the authors and do not necessarily represent those of their affiliated organizations, or those of the publisher, the editors and the reviewers. Any product that may be evaluated in this article, or claim that may be made by its manufacturer, is not guaranteed or endorsed by the publisher.
Footnotes
- ^ https://csndc.emsa.europa.eu/web
- ^ https://doi.org/10.12770/3f8eaace-9f9b-4b1b-a7a4-9c55270e205a
- ^ https://github.com/OpenDrift/opendrift/
References
Aghaei N., Akbarizadeh G., Kosarian A. (2022). GreyWolfLSM: an accurate oil spill detection method based on level set method from synthetic aperture radar imagery. Eur. J. Remote Sens. 55, 181–198. doi: 10.1080/22797254.2022.2037468
Alves T. M., Kokinou E., Zodiatis G., Lardner R., Panagiotakis C., Radhakrishnan H. (2015). Modelling of oil spills in confined maritime basins: The case for early response in the Eastern Mediterranean Sea. Environ. pollut. 206, 390–399. doi: 10.1016/j.envpol.2015.07.042
Alves T. M., Kokinou E., Zodiatis G., Radhakrishnan H., Panagiotakis C., Lardner R. (2016). Multidisciplinary oil spill modeling to protect coastal communities and the environment of the Eastern Mediterranean Sea. Sci. Rep. 6, 36882. doi: 10.1038/srep36882
Androulidakis Y., Kourafalou V., Robert Hole L., Le Hénaff M., Kang H. (2020). Pathways of oil spills from potential Cuban offshore exploration: influence of ocean circulation. J. Mar. Sci. Eng. 8, 535. doi: 10.3390/jmse8070535
Brenner S. (1989). Structure and evolution of warm core eddies in the Eastern Mediterranean Levantine Basin. J. Geophys. Res. 94, 12593–12602. doi: 10.1029/JC094iC09p12593
Brenner S. (1993). Long term evolution and dynamics of a persistent warm core eddy in the Eastern Mediterranean Sea. Deep Sea Res. Part II Top. Stud. Oceanogr. 40 (6). doi: 10.1016/0967-0645(93)90067-W
Cheng Y., Liu B., Li X., Nunziata F., Xu Q., Ding X., et al. (2014). Monitoring of oil spill trajectories with COSMO-SkyMed X-band SAR images and model simulation. IEEE J. Sel. Top. Appl. Earth Obs. Remote Sens. 7, 2895–2901. doi: 10.1109/JSTARS.2014.2341574
Clark R., Swayze G. A., Leifer I., Livo K. E., Kokaly R., Hoefen T., et al. (2010). A method for quantitative mapping of thick oil spills using imaging spectroscopy: U.S. Geological Survey Open-File Rep. 511167, 1–51. doi: 10.3133/ofr20101167
Clementi E., Aydogdu A., Goglio A. C., Pistoia J., Escudier R., Drudi M., et al. (2021). Mediterranean Sea Physical Analysis and Forecast (CMEMS MED-Currents, EAS6 system) (Version 1) [Data set] (Copernicus Monitoring Environment Marine Service (CMEMS). doi: 10.25423/CMCC/MEDSEA_ANALYSISFORECAST_PHY_006_013_EAS6
Coppini G., De Dominicis M., Zodiatis G., Lardner R., Pinardi N., Santoleri R., et al. (2011). Hindcast of oil spill pollution during the Lebanon Crisis, July–August 2006. Mar. pollut. Bull. 62, 140–153. doi: 10.1016/j.marpolbul.2010.08.021
Coppini G., Gonzalez G., Perivoliotis L., Smaoui M., Liubartseva S., Bourma E., et al. (2018). MONGOOS-REMPEC operational experience during Agia Zoni II oil spill, September 2017. Geophys. Res. Abs. 6745.
Dagestad K. F., Röhrs J., Breivik Ø., Ådlandsvik B. (2018). OpenDrift v1.0: a generic framework for trajectory modelling. Geosci. Model. Dev. 11, 1405–1420. doi: 10.5194/gmd-11-1405-2018
Dearden C., Culmer T., Brooke R. (2022). Performance measures for validation of oil spill dispersion models based on satellite and coastal data. IEEE J. Sel. Top. Appl. Earth Obs. Remote Sens. 47, 126–140. doi: 10.1109/JOE.2021.3099562
De Dominicis M., Falchetti S., Trotta F., Pinardi N., Giacomelli L., Napolitano E., et al. (2014). A relocatable ocean model in support of environmental emergencies – the Costa Concordia emergency case. Ocean Dyn. 64, 667–688. doi: 10.1007/s10236-014-0705-x
De Dominicis M., Pinardi N., Zodiatis G., Archetti R. (2013b). MEDSLIK-II, a Lagrangian marine surface oil spill model for short-term forecasting – Part 2: numerical simulations and validations. Geosci. Model. Dev. 6, 1871–1888. doi: 10.5194/gmd-6-1871-2013
De Dominicis M., Pinardi N., Zodiatis G., Lardner R. (2013a). MEDSLIK-II, a Lagrangian marine surface oil spill model for short term forecasting – Part 1: theory. Geosci. Model. Dev. 6, 1851–1869. doi: 10.5194/gmd-6-1851-2013
Devis-Morales A., Rodríguez-Rubio E., Rincón-Martínez D. (2022). Numerical modeling of oil spills in the Gulf of Morrosquillo, Colombian Caribbean. CT&F-Ciencia Tecnología y Futuro 12 (1), 69–83. doi: 10.29047/01225383.396
Dhavalikar A. S., Choudhari P. C. (2022). Prediction of oil spill trajectory on the ocean surface using mathematical modeling. IEEE J. Sel. Top. Appl. Earth Obs. Remote Sens. 15, 5894–5905. doi: 10.1109/JSTARS.2022.3192352
Dhavalikar A. S., Choudhari P. C. (2023). Modelling and remote sensing of oil spill in the mediterranean sea: A case study on baniyas power plant oil spill. J. Indian Soc. Remote Sens 51, 135–148. doi: 10.1007/s12524-022-01630-8
Dong X., Li J., Li B., Jin Y., Miao S. (2023). Marine Oil Spill Detection from Low-Quality SAR Remote Sensing Images. J. Mar. Sci. Eng 11, 1552. doi: 10.3390/jmse11081552
Fingas M., Brown C. E. (2018). A Review of Oil Spill Remote Sensing. Sensors (2018) 18, 91. doi: 10.3390/s18010091
Garcia-Pineda O., MacDonald I. R., Li X., Jackson C. R., Pichel W. G. (2013). Oil spill mapping and measurement in the Gulf of Mexico with textural classifier neural network algorithm (TCNNA). IEEE J. Sel. Top. Appl. Earth Obs. Remote Sens. 6, 2517–2525. doi: 10.1109/JSTARS.2013.2244061
Garcia-Pineda O., Zimmer B., Howard M., Pichel W., Li X., MacDonald I. R. (2009). Using SAR images to delineate ocean oil slicks with a texture-classifying neural network algorithm (TCNNA). Can. J. Remote Sens. 35, 411–421. doi: 10.5589/m09-035
Hecht A., Pinardi N., Robinson A. R. (1988). Currents, water masses, eddies, and jets in the Mediterranean Levantine Basin. J. Phys. Oceanogr. 18, 1320–1353. doi: 10.1175/1520-0485(1988)018<1320:CWMEAJ>2.0.CO;2
Hole L. R., Dagestad K. F., Röhrs J., Wettre C., Kourafalou V. H., Androulidakis Y., et al. (2019). The DeepWater Horizon oil slick: Simulations of river front effects and oil droplet size distribution. J. Mar. Sci. Eng. 7, 329. doi: 10.3390/jmse7100329
Hole L. R., Dagestad K. F., Röhrs J., Wettre C., Kourafalou V. H., Androulidakis I., et al. (2018). Revisiting the DeepWater Horizon spill: High resolution model simulations of effects of oil droplet size distribution and river fronts. Ocean Sci. Discussions, 1–20. doi: 10.5194/os-2018-130
Hole L. R., de Aguiar V., Dagestad K. F., Kourafalou V. H., Androulidakis Y., Kang H., et al. (2021). Long term simulations of potential oil spills around Cuba. Mar. pollut. Bull. 167, 112285. doi: 10.1016/j.marpolbul.2021.112285
Hoteit I., Abualnaja Y., Afzal S., Ait-El-Fquih B., Akylas T., Antony C., et al. (2021). Towards an end-to-end analysis and prediction system for weather, climate, and Marine applications in the Red Sea. Bull. Am. Meteorological Soc. 102 (1), E99–E122. doi: 10.1175/BAMS-D-19-0005.1
Jones C. E., Dagestad K. F., Breivik Ø., Holt B., Röhrs J., Christensen K. H., et al. (2016). Measurement and modeling of oil slick transport. J. Geophysical Research: Oceans 121 (10), 7759–7775. doi: 10.1002/2016JC012113
Kampouris K., Vervatis V., Karagiorgos J., Sofianos S. (2021). Oil spill model uncertainty quantification using an atmospheric ensemble. Ocean Sci. 17, 919–934. doi: 10.5194/os-17-919-2021
Keramea P., Kokkos N., Gikas G. D., Sylaios G. (2022). Operational modeling of North Aegean oil spills forced by real-time met-ocean forecasts. J. Mar. Sci. Eng. 10, 411. doi: 10.3390/jmse10030411
Keramea P., Kokkos N., Zodiatis G., Sylaios G. (2023a). Modes of operation and forcing in oil spill modeling: state-of-art, deficiencies and challenges. J. Mar. Sci. Eng. 11 (6), 1165. doi: 10.3390/jmse11061165
Keramea P., Kokkos N., Zodiatis G., Sylaios G., Coppini G., Peña J., et al. (2023b). Oil spill modeling assessment of the 2021 Syrian oil spill using SAR imagery and multi-forcing forecasts (Vienna, Austria: EGU General Assembly 2023), 24–28. doi: 10.5194/egusphere-egu23-1573
Keramea P., Spanoudaki K., Zodiatis G., Gikas G., Sylaios G. (2021). Oil spill modeling: A critical review on current trends, perspectives, and challenges. J. Mar. Sci. Eng. 9, 181. doi: 10.3390/jmse9020181
Kolokoussis P., Karathanassi V. (2018). Oil spill detection and mapping using Sentinel 2 imagery. J. Mar. Sci. Eng. 6, 4. doi: 10.3390/jmse6010004
Korres G., Ravdas M., Zacharioudaki A., Denaxa D., Sotiropoulou M. (2021). Mediterranean Sea Waves Analysis and Forecast (CMEMS MED-Waves, MedWAM3 system) (Version 1) [Data set] (Copernicus Monitoring Environment Marine Service (CMEMS). doi: 10.25423/CMCC/MEDSEA_ANALYSISFORECAST_WAV_006_017_MEDWAM3
Lardner R., Zodiatis G. (2016). MEDSLIK oil spill model recent developments (Vienna, Austria: EGU General Assembly Conference Abstracts), EPSC2016–16240.
Lardner R., Zodiatis G. (2017). Modelling oil plumes from subsurface spills. Mar. pollut. Bull. 124 (1), 94–101. doi: 10.1016/j.marpolbul.2017.07.018
Lardner R., Zodiatis G., Hayes D., Pinardi N. (2006). Application of the MEDSLIK oil spill model to the Lebanese spill of July 2016. Proc. EGEMP workshop Monit. activities related to Oil pollut. Lebanon. Eur. Communities ISSN 5593, 75–78.
Lardner R., Zodiatis G., Loizides L., Demetropoulos A. (1998). An operational oil spill model in the Levantine basin (Eastern Mediterranean Sea) (Monaco: International symposium on marine pollution), 5–9. Available at: https://inis.iaea.org/collection/NCLCollectionStore/_Public/30/038/30038989.pdf.
Lehr W., Jones R., Evans M., Simecek-Beatty D., Overstreet R. (2002). Revisions of the ADIOS oil spill model. Environ. Model. Software 17, 189–197. doi: 10.1016/S1364-8152(01)00064-0
Li Y., Huang W., Lyu X., Liu S., Zhao Z., Ren P. (2022). An adversarial learning approach to forecasted wind field correction with an application to oil spill drift prediction. Int. J. Appl. Earth Obs. Geoinf. 112, 102924. doi: 10.1016/j.jag.2022.102924
Li C., Miller J., Wang J., Koley S. S., Katz J. (2017). Size distribution and dispersion of droplets generated by impingement of breaking waves on oil slicks. J. Geophys. Res. Oceans. 122, 7938–7957. doi: 10.1002/2017JC013193
Liu Y., Weisberg R. H. (2011). Evaluation of trajectory modeling in different dynamic regions using normalized cumulative Lagrangian separation. J. Geophys. Res. 116, C09013. doi: 10.1029/2010JC006837
Liubartseva S., Federico I., Coppini G., Lecci R. (2021). Stochastic oil spill modeling for environmental protection at the Port of Taranto (southern Italy). Mar. pollut. Bull. 171, 112744. doi: 10.1016/j.marpolbul.2021.112744
Liubartseva S., Smaoui M., Coppini G., Gonzalez G., Lecci R., Cretì S., et al. (2020). Model-based reconstruction of the Ulysse-Virginia oil spill, October–November 2018. Mar. pollut. Bull. 154, 111002. doi: 10.1016/j.marpolbul.2020.111002
Liubartseva S., Zodiatis G., Coppini G., Sepp-Neves A. A., Penña J., Benjumeda P., et al. (2022). Operational simulations of a Mediterranean oil spill in February 2021. Geophys. Res. Abs., EGU22–E2276. doi: 10.5194/egusphere-egu22-2276
Neves A. A. S., Pinardi N., Martins F., Janeiro J., Samaras A., Zodiatis G., et al. (2015). Towards a common oil spill risk assessment framework–adapting ISO 31000 and addressing uncertainties. J. Environ. Manage. 159, 158–168. doi: 10.1016/j.jenvman.2015.04.044
Pinardi N., Zavatarelli M., Adani M., Coppini G., Fratianni C., Oddo P., et al. (2015). Mediterranean Sea large-scale low-frequency ocean variability and water mass formation rates from 1987 to 2007: A retrospective analysis. Prog. Oceanogr. 132, 318–332. doi: 10.1016/j.pocean.2013.11.003
REMPEC (2023) Incident involving a fuel leakage into the Mediterranean Sea from the Baniyas thermal station, Syria. Available at: https://www.rempec.org/en/news-media/rempec-news/incident-involving-a-fuel-leakage-into-the-mediterranean-sea-from-the-baniyas-thermal-station-Syria-1 (Accessed August 10, 2023).
Ribotti A., Antognarelli F., Cucco A., Falcieri M. F., Fazioliand L., Ferrarin C., et al. (2019). An operational marine oil spill forecasting tool for the management of emergencies in the Italian seas. J. Mar. Sci. Eng. 7, 1–14. doi: 10.3390/jmse7010001
Röhrs J., Dagestad K. F., Asbjørnsen H., Nordam T., Skancke J., Jones C. E., et al. (2018). The effect of vertical mixing on the horizontal drift of oil spills. Ocean Sci. Discuss. 14, 1581–1601. doi: 10.5194/os-2018-100
Robinson R. A., Malanotte-Rizzoli P., Hecht A., Michelato A., Roether W., Theocharis A., et al. (1992). General circulation of the eastern mediterranean. Earth-Sci. Rev. 32, 285–309. doi: 10.1016/0012-8252(92)90002-B
Simoncelli S., Fratianni C., Pinardi N., Grandi A., Drudi M., Oddo P., et al. (2019). Mediterranean Sea Physical Reanalysis (CMEMS MED-Physics) (Version 1) [Data set] (Copernicus Monitoring Environment Marine Service (CMEMS). doi: 10.25423/MEDSEA_REANALYSIS_PHYS_006_004
Smagorinsky J. (1963). General circulation experiments with the primitive equations. Mon Weather Rev. 91, 99–164. doi: 10.1175/1520-0493(1963)091<0099:GCEWTP>2.3.CO;2
Song D., Wang B., Chen W., Wang N., Yu S., Ding, et al. (2018). An efficient marine oil spillage identification scheme based on an improved active contour model using fully polarimetric SAR imagery. IEEE Access. 6, 67959–67981. doi: 10.1109/ACCESS.2018.2876173
Spaulding M. L. (2017). State of the art review and future directions in oil spill modeling. Mar. pollut. Bull. 15, 7–19. doi: 10.1016/j.marpolbul.2017.01.001
Tkalich P., Chan E. S. (2002). Vertical mixing of oil droplets by breaking waves. Mar. pollut. Bull. 44, 1219–1229. doi: 10.1016/S0025-326X(02)00178-9
Vijayakumar S. (2023). “Computational Techniques of Oil Spill Detection in Synthetic Aperture Radar Data: Review Cases,” in Recent Oil Spill Challenges That Require More Attention. Ed. Marghany M. (London, United Kingdom: IntechOpen). doi: 10.5772/intechopen.108115
Visser A. W. (1997). Using random walk models to simulate the vertical distribution of particles in a turbulent water column. Mar. Ecol. Prog. Ser. 158, 275–281. doi: 10.3354/meps158275
Wing O. E., Bates P. D., Sampson C. C., Smith A. M., Johnson K. A., Erickson T. A. (2017). Validation of a 30 m resolution flood hazard model of the conterminous United States. Water Resour. Res. 53, 7968–7986. doi: 10.1002/2017WR020917
Xu Q., Li X., Wei Y., Tang Z., Cheng Y., Pichel W. G. (2013). Satellite observations and modeling of oil spill trajectories in the Bohai Sea. Mar. pollut. Bull. 71, 107–116. doi: 10.1016/j.marpolbul.2013.03.028
Zodiatis G., Brenner S., Gertman I., Ozer T., Simoncelli S., Ioannou M., et al. (2023). Twenty years of in-situ monitoring in the south-eastern Mediterranean Levantine basin: basic elements of the thermohaline structure and of the mesoscale circulation during 1995–2015. Front. Mar. Sci. 9. doi: 10.3389/fmars.2022.1074504
Zodiatis G., Coppini G., Penña J., Benjumeda P., Sepp-Neves A. A., Lardner R., et al. (2022). Operational response to the Syrian oil pollution crisis in 2021. Geophys. Res. Abs., EGU22–E1098. doi: 10.5194/egusphere-egu22-1098
Zodiatis G., Coppini G., Perivoliotis L., Lardner R., Alves T., Pinardi N., et al. (2018). “Numerical modeling of oil pollution in the Eastern Mediterranean Sea,” in The Handbook of Environmental Chemistry Oil pollution in the Mediterranean Sea. International context. Eds. Carpenter A., Kostianoy A. G. (Cham, Switzerland: Springer) 83, 215–254. doi: 10.1007/698_2017_131
Zodiatis G., Drakopoulos P., Brenner S., Groom S. (2005). Variability of the Cyprus warm core Eddy during the CYCLOPS project. Deep Sea Res. Part II Top. Stud. Oceanogr. 52, 2897–2910. doi: 10.1016/j.dsr2.2005.08.020
Zodiatis G., Gertman I., Poulain P. M., Menna M., Sofianos S. (2016b). Two decades of monitoring and forecasting of the circulation in the Levantin–2016). Rapp. Commun. Int. Mer Meídit. 41, 79.
Zodiatis G., Lardner R., Alves T., Krestenitis Y., Perivoliotis L., Sofianos S., et al. (2017). Oil spill forecasting (prediction). J. Mar. Res. 75, 923–953. doi: 10.1357/002224017823523982
Zodiatis G., Lardner R., Solovyov D., Panayidou X., De Dominicis M. (2012). Predictions for oil slicks detected from satellite images using MyOcean forecasting data. Ocean Sci. 8, 1105–1115. doi: 10.5194/os-8-1105-2012
Zodiatis G., Lardner R., Spanoudaki K., Sofianos S., Radhakrishnan H., Coppini G., et al. (2021). “Oil spill modelling assessment,” in Marine Hydrocarbon Spill Assessments. From Baseline Information through to Decision Support Tools. Ed. Makarinskyy O. (Darwin, Australia: Elsevier), 145–197. doi: 10.1016/B978-0-12-819354-9.00010-7
Keywords: oil spill modeling, remote-sensing SAR images, Baniya’s power plant, MEDSLIK, OpenDrift, OpenOil, CYCOFOS, SKIRON
Citation: Keramea P, Kokkos N, Zodiatis G, Sylaios G, Coppini G, Peña J, Benjumeda P, Sepp Neves AA, Lardner R, Liubartseva S, Soloviev D, Scuro M, Nikolaidis A and Viola F (2023) Satellite imagery in evaluating oil spill modelling scenarios for the Syrian oil spill crisis, summer 2021. Front. Mar. Sci. 10:1264261. doi: 10.3389/fmars.2023.1264261
Received: 20 July 2023; Accepted: 21 September 2023;
Published: 09 October 2023.
Edited by:
Peng Ren, China University of Petroleum (East China), ChinaReviewed by:
Yongqing Li, Qingdao University of Science and Technology, ChinaHonglei Zheng, Ocean University of China, China
Giovanni Besio, University of Genoa, Italy
Copyright © 2023 Keramea, Kokkos, Zodiatis, Sylaios, Coppini, Peña, Benjumeda, Sepp Neves, Lardner, Liubartseva, Soloviev, Scuro, Nikolaidis and Viola. This is an open-access article distributed under the terms of the Creative Commons Attribution License (CC BY). The use, distribution or reproduction in other forums is permitted, provided the original author(s) and the copyright owner(s) are credited and that the original publication in this journal is cited, in accordance with accepted academic practice. No use, distribution or reproduction is permitted which does not comply with these terms.
*Correspondence: George Zodiatis, oceanosgeos@gmail.com