Corrigendum: Modelling the Distribution of a Commercial NE-Atlantic Sea Cucumber, Holothuria mammata: Demographic and Abundance Spatio-Temporal Patterns
 Pedro M. Félix1*
  Ana Pombo2 Francisco Azevedo e Silva1 Tomás Simões1 Tiago A. Marques3,4,5 Ricardo Melo1,6 Cristina Rocha3,7 João Sousa2 Eliana Venâncio2 José L. Costa1,5 Ana C. Brito1,6
- 1MARE – Marine and Environmental Sciences Centre, Faculdade de Ciências, Universidade de Lisboa, Lisbon, Portugal
- 2MARE – Marine and Environmental Sciences Centre, ESTM, Polytechnic Institute of Leiria, Leiria, Portugal
- 3CEAUL – Centro de Estatística e Aplicações, Faculdade de Ciências, Universidade de Lisboa, Lisbon, Portugal
- 4Centre for Research into Ecological and Environmental Modelling, The Observatory, University of St Andrews, St Andrews, United Kingdom
- 5Departamento de Biologia Animal, Faculdade de Ciências, Universidade de Lisboa, Lisbon, Portugal
- 6Departamento de Biologia Vegetal, Faculdade de Ciências, Universidade de Lisboa, Lisbon, Portugal
- 7Departamento de Estatística e Investigação Operacional, Faculdade de Ciências, Universidade de Lisboa, Lisbon, Portugal
A Corrigendum on:
Modelling the Distribution of a Commercial NE-Atlantic Sea Cucumber, Holothuria mammata: Demographic and Abundance Spatio-Temporal Patterns.
By Félix PM, Pombo A, Azevedo e Silva F, Simões T, Marques TA, Melo R, Rocha C, Sousa J, Venâncio E, Costa JL and Brito AC (2021) Front. Mar. Sci. 8:675330. doi: 10.3389/fmars.2021.675330
In the original article, there was a mistake in the y-axis legend of Figures 3, 4 and the x-axis legend of Figure S1 (from the Supplementary Material) as published. As in the text, wherever it reads ‘Ind/10 m2’, it should be Ind/100 m2’. The corrected Figures 3, 4 and S1 appear below.
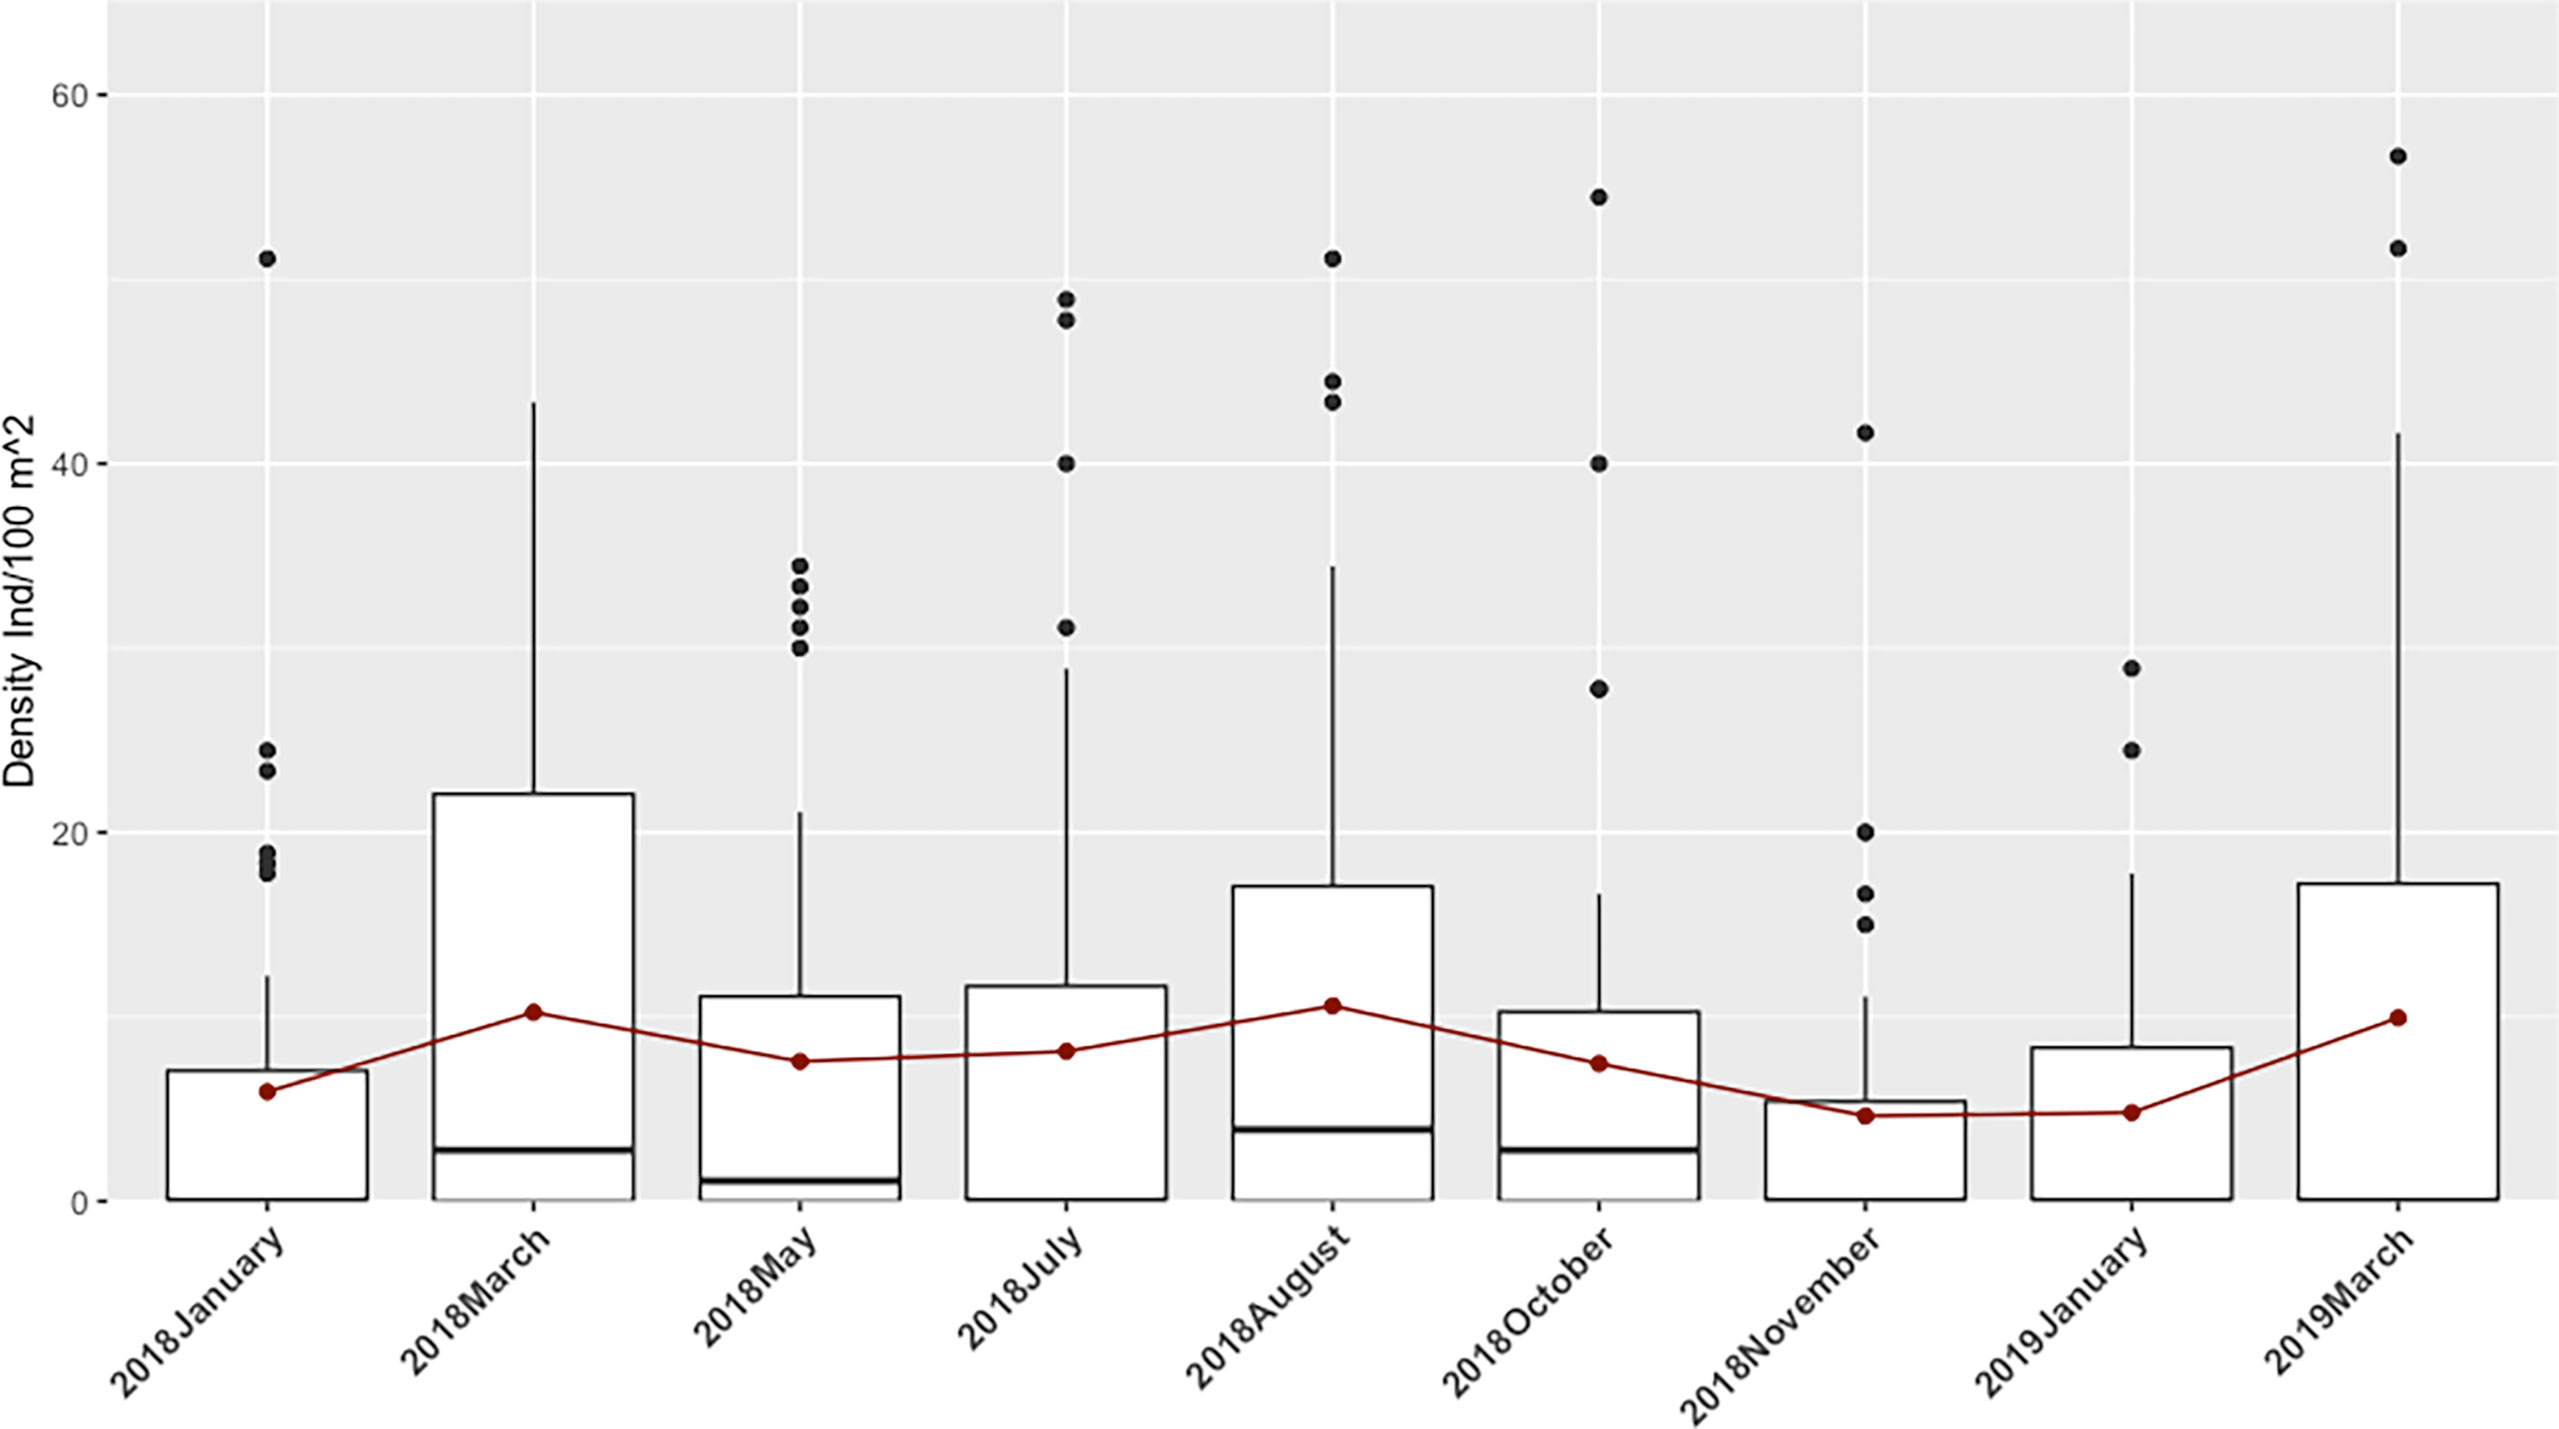
Figure 3 Temporal density data for Holothuria mammata at Arrábida, Setúbal, during the nine month sampling period. Red dots at each month connected by a line represent the evolution of the mean.
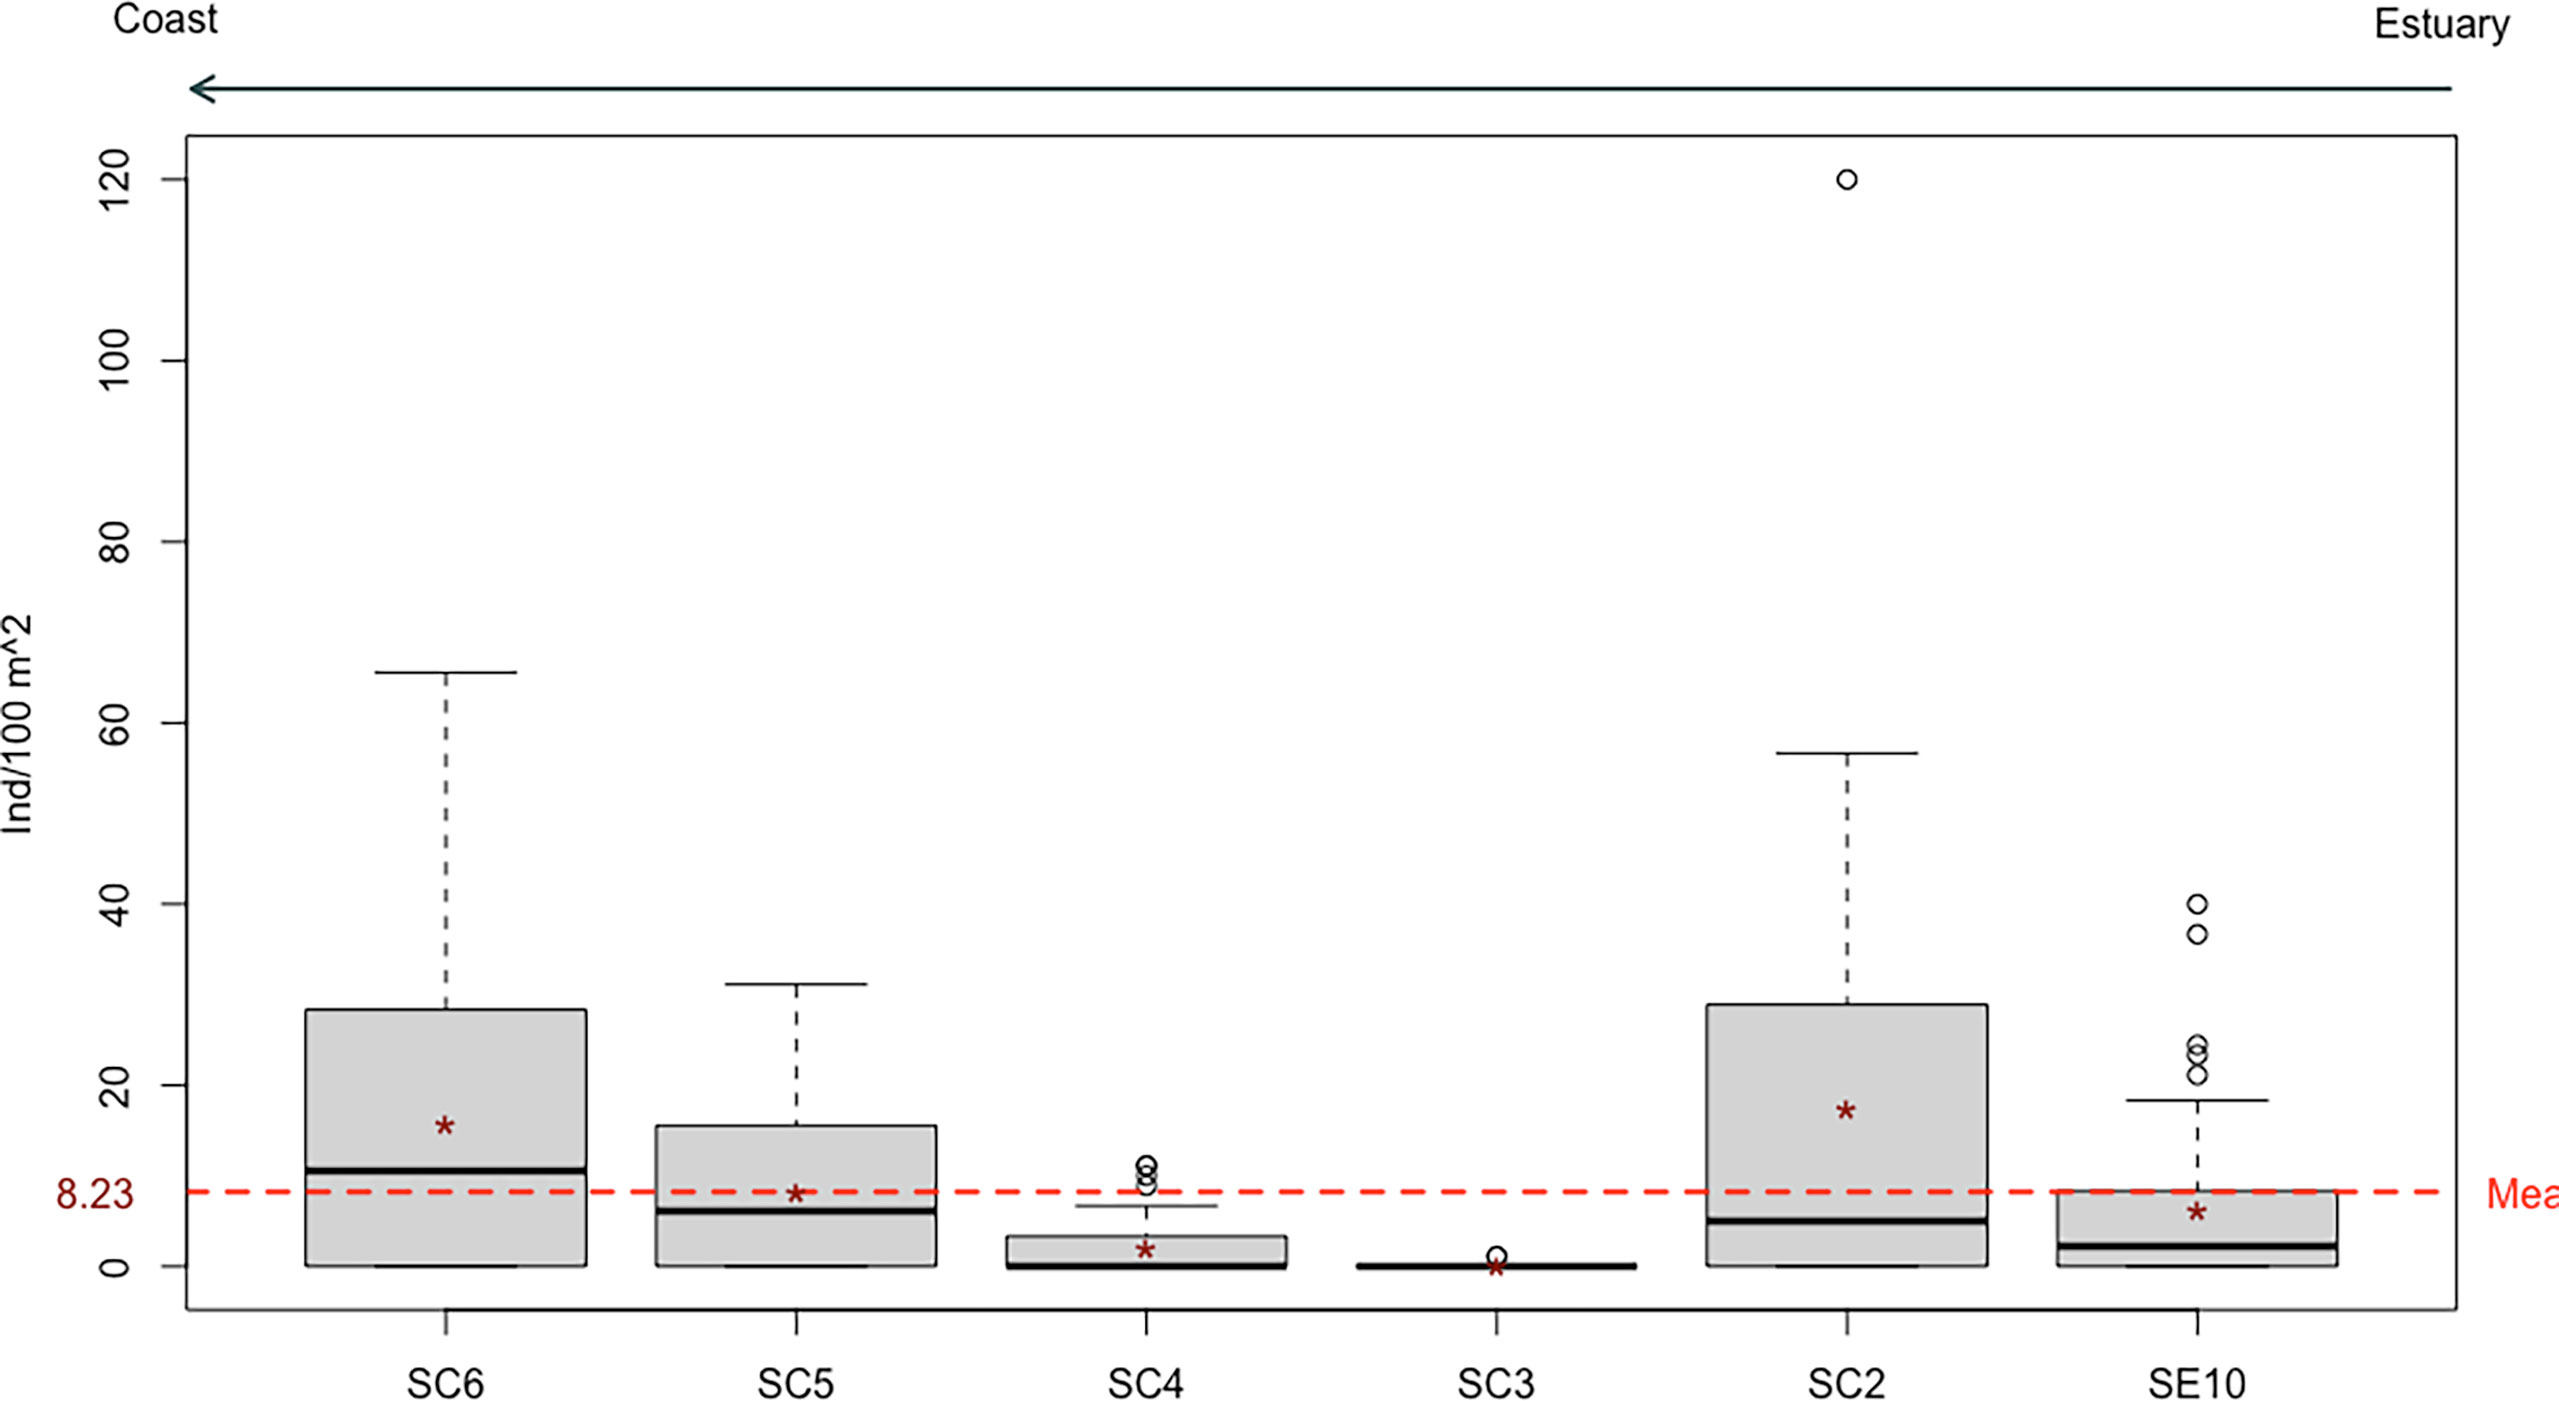
Figure 4 Density of Holothuria mammata by sampling site, arranged according to distance to estuary (left to right). Red dotted line represents the overall mean value. * represents the mean of each sampling station.
In addition, there were multiple errors in the main text. Wherever it reads ‘Ind/10 m2’, should be Ind/100 m2’. The density units were wrongly typed.
A correction has been made to: Results, Space-Time Distribution Patterns, paragraph two:
“Within the area of distribution of H. mammata 2114 individuals, ranging from 119 mm to 510 mm, were observed and counted in a total sampled area of 29160 m2. Density per replicate ranged from 0 to 120 ind/100 m2 (or 12,000 ind/ha – a maximum value recorded at SC2) (Figure 3). The majority of individual counts were made on rock transects (94%), when compared to sand transects. Of those, 68% were settled on a sandy patch. In sand transects, the large majority was, in fact, settled on sand (82%) and remaining on small rocky patches. However, it should be considered that sand transects have very few rock outcrops and in rock transects sandy patches are common. Only a small number of individuals preferred a macroalgal cover, as only 5% occurred in the algal cover of rock transects and none in the algal cover of sand transects. Of all specimens, 34% were found to be sheltered in crevices at the time of sampling (daytime) and these individuals were overall smaller in size (ANOVA: p=0.0086). When comparing sizes between substrates of settlement, individuals occurring on rock were also smaller than those on sand (ANOVA: p< 0.0001) and so are those occurring within an algal cover (ANOVA: p=0.039).”
A correction has been made to: Discussion, paragraph one:
“The population of Holothuria mammata at this NE-Atlantic rocky reef was the healthiest studied up to this moment. It showed the largest individuals reported so far, with a maximum total length of 51 cm, densities up to 120 ind/100 m2 and unimodal size-class distributions. This reflects the good environmental conditions, successful recruitment and an unexploited population. The Mediterranean and other NE-Atlantic regions show populations of this species with lower maximum sizes, the majority between 25 cm and 38 cm (Navarro et al., 2013; González-Wangüemert et al., 2014, 2018; Marquet et al., 2017; Mustapha and Hattour, 2017; Siegenthaler et al., 2017). Previous records show that H. mammata in the NE-Atlantic attain bigger sizes than in the Mediterranean and the largest in the Portuguese coast, with Peniche, a highly productive marine area, presenting the previous largest documented specimen, with 43 cm (González-Wangüemert et al., 2016). Densities found in the present study were also the highest, compared to a maximum density of 55 ind/100 m2 found in the Mediterranean, Aegean Sea (Aydin, 2019a), 16 ind/100 m2 reported in the Canary Islands (Navarro et al., 2013), and particular low densities observed at Ria Formosa (south Portugal) of 1.2 ind/100 m2 (Siegenthaler et al., 2017). However, densities tend to be much lower in habitats without rocky bottoms (Navarro et al., 2013) and Ria Formosa is a shallow mesotidal lagoon lacking the typical H. mammata habitat (Siegenthaler et al., 2017). Like at Peniche, the Arrábida coast is also a highly productive area, benefiting from upwelling events in the summer, nutrient inputs from the estuary and from a complex subtidal habitat (Wooster et al., 1976; Cabeçadas et al., 1999; Costa et al., 2013) that can have positive effects on the condition of the population. The high productivity together with the subtidal distribution of the species, unlike intertidal distributions (Siegenthaler et al., 2017), provide more stable environmental conditions, which may be the reason for higher abundances and lower variation in time.”
The authors apologize for these errors and state that they do not change the scientific conclusions of the article in any way. The original article has been updated.
Publisher’s Note
All claims expressed in this article are solely those of the authors and do not necessarily represent those of their affiliated organizations, or those of the publisher, the editors and the reviewers. Any product that may be evaluated in this article, or claim that may be made by its manufacturer, is not guaranteed or endorsed by the publisher.
Supplementary Material
The Supplementary Material for this article can be found online at: https://www.frontiersin.org/articles/10.3389/fmars.2022.950907/full#supplementary-material
Supplementary Figure 1 | Data distribution of two response variables with a point-mass at zero: density and proportion of individuals on sand substrate, considering the two sample substrates (sand and rock).
Keywords: Holothuroidea, density, size-class distribution, habitat preferences, environmental parameters, rocky reef, Portugal
Citation: Félix PM, Pombo A, Silva FAe, Simões T, Marques TA, Melo R, Rocha C, Sousa J, Venâncio E, Costa JL and Brito AC (2022) Corrigendum: Modelling the Distribution of a Commercial NE-Atlantic Sea Cucumber, Holothuria mammata: Demographic and Abundance Spatio-Temporal Patterns. Front. Mar. Sci. 9:950907. doi: 10.3389/fmars.2022.950907
Received: 23 May 2022; Accepted: 24 May 2022;
Published: 22 June 2022.
Approved by:
Frontiers Editorial Office, Frontiers Media SA, SwitzerlandCopyright © 2022 Félix, Pombo, Silva, Simões, Marques, Melo, Rocha, Sousa, Venâncio, Costa and Brito. This is an open-access article distributed under the terms of the Creative Commons Attribution License (CC BY). The use, distribution or reproduction in other forums is permitted, provided the original author(s) and the copyright owner(s) are credited and that the original publication in this journal is cited, in accordance with accepted academic practice. No use, distribution or reproduction is permitted which does not comply with these terms.
*Correspondence: Pedro M. Félix, pmfelix@fc.ul.pt