Exploring the impact of “double carbon target” on environmental efficiency of coal cities in China
 Yuntong Zhang1
  Zhenling Chen
- 1International College, Krirk University, Bangkok, Thailand
- 2School of Economics, Beijing Technology and Business University, Beijing, China
- 3Contract Pricing Department, North China Power Engineering Co, Ltd. of China Power Engineering Consulting Group, Beijing, China
Chinese government proposed the “Double Carbon Target” (DCT) in 2020 to deal with the increasing global warming crisis. In this regard, the study identifies temporal and spatial evolution characteristics of environmental efficiency through the DEA-SBM model and further explores the impact of DCT on the environmental efficiency of coal cities using scenario analysis method. Empirical results show that: 1) Both economic efficiency and environmental efficiency of China’s coal cities are first rising and then falling during the period 2003–2022, and the gap between coal cities and non-coal cities was very small before 2011, but it begins to be enlarged after 2011. The main reason is environmental regulation has exerted a significant impact on coal cities; 2) the difference in environmental efficiency among coal cities is huge due to their policies for supporting renewable energy. Some cities have broken carbon lock-in by the favorite policy for renewable energy, while others have been trapped into path dependence on the coal-related industry; 3) generally, the more amount of emission reduction required, the lower the environmental efficiency of coal cities in the carbon neutralization scenario. Furthermore, some cities rich of renewable energy resources, such as Erdos, and Xuzhou, still have better environmental performance under different carbon neutralization scenarios, while others will encounter many transformation barriers and even may cause a social crisis. Therefore, it is suggested that some coal cities in northwest China can vigorously develop solar energy to improve environmental efficiency.
1 Introduction
As one of the world’s largest developing countries, China has been undergoing fast urbanization, with the annual migration of approximately 13 million people from rural areas to urban centers. By the end of 2022, China’s urbanization rate reached a record 64.72% and is expected to rise to 75% by 2050. The development of cities has brought strong impetus to China’s economy, but it has also led to massive carbon emissions contributing to the global warming crisis. Especially the coal cities, predominant by coal-related industries, have produced the most carbon emissions. In 2020, the Chinese government proposed a carbon reduction strategy to achieve a carbon peak in 2030 and carbon neutralization in 2060 (“Double Carbon Target” DCT). Achieving DCT will have a huge impact on China’s economic growth mode and energy structure. Changing the energy structure and promoting renewable energy development is the key to achieving the DCT. It will take a relatively short period of time for China to reduce coal consumption significantly, which will significantly impact the development of coal cities. China will largely reduce coal consumption in the future and even take a completely de-coal strategy. In such circumstances, policymakers in the coal cities are eager to understand the impact of the strategy of DCT on the environmental efficiency of coal cities. It is the first step for coal cities to improve their sustainable development ability and actively take measures to adapt to the changes produced by the DCT strategy.
Economic efficiency and environmental efficiency are the main indexes to measure an economy’s economic development and environmental protection, respectively. Of them, economic efficiency focuses on improving economic operational performance, while environmental efficiency simultaneously pays more attention to both economic and environmental operational performance. As a kind of resource-based city, coal cities heavily rely on the exploitation of coal resources to obtain economic development. Still, more carbon emissions are inevitable. A city is considered to be more environmentally efficient if it produces more good outputs under the same polluting emissions, or emits fewer bad outputs under the same good outputs. However, good output and bad output often contradict each other. On the one hand, improving the economic growth of coal cities will produce lots of carbon emissions. On the other hand, reducing carbon emissions will cause an economic recession and a high unemployment rate. Thus, balancing environmental protection and economic growth has drawn many scholars’ attention (e.g., Hou et al., 2018; Zeng et al., 2019; Long et al., 2021). However, there are few studies on the impact of DCT on the environmental efficiency of coal cities.
Environmental efficiency is a wide concern of governments and scholars (e.g., Yang and Yang, 2019; Nakaishi et al., 2021; Han et al., 2022; Kucukvar et al., 2022). Assessing the environmental efficiency of a city can provide policymakers with useful information for sustainable development management. Because the measurement of environmental efficiency involves multi-input and multi-output, which is consistent with the framework of data envelopment analysis (DEA) technology, thus all kinds of DEA models are employed to calculate environmental efficiency, for example, DDF-DEA, RAM-DEA, SBM-DEA, CCR (or BCC)-DEA. SBM-DEA is widely used among them (Zhou et al., 2013; Wang and Yang, 2019; Long et al., 2020; Jiang et al., 2022).
In this regard, this study aims to evaluate environmental efficiency for Chinese coal cities under the DCT strategy, identify the temporal and spatial evolution characteristics of environmental efficiency using the DEA-SBM model, and further explore the impact of DCT on the environmental efficiency of coal cities using 226 Chinese cities. The contributions of this study may be as follows: 1) In view of the environmental efficiency has been widely concerned, we estimate environmental efficiency for 55 Chinese coal cities by comparing non-coal cities 171 based on the framework of SBM-DEA technology. Meanwhile, the economic efficiency is considered a benchmark, and then we can get a full picture of the whole Chinese cities’ environmental efficiency performance. 2) Because it involves predictions for the next 40 years, constructing the roadmap of DCT strategy is too complex and uncertain to describe accurately or clearly; thus, we create three carbon reduction scenarios to investigate the impact of the DCT on coal cities’ environmental efficiency. This setting explores the heterogeneous impact of environmental efficiency of coal cities under DCT.
The structure of this paper is arranged as follows. Section 2 is the literature review relating to the economic efficiency and environmental efficiency of coal cities. Section 3 illustrates how to construct economic efficiency and environmental efficiency under SBM-DEA models. Section 4 presents the data and indicators of this study. Section 5 demonstrates empirical results of the performance of environmental efficiency and the impact of DCT on coal cities’ environmental efficiency, while Section 6 is the conclusion and policy implications.
2 Literature review
2.1 Economic efficiency of coal cities
Economic efficiency mainly refers to Pareto efficiency, which means it is impossible to increase one output without reducing another product. In other words, it reflects that the minimum amount of input is used to create the maximum output value under the constraints of resource scarcity. Usually, the economic efficiency can be resolved into technological efficiency and allocative efficiency. Technical efficiency focuses on increasing the maximum outputs while keeping the inputs constant or reducing the maximum of inputs while keeping the outputs constant. It means the ability to use the least factor input to obtain the maximum benefit. At the same time, allocation efficiency refers to the ability to obtain the maximum benefit by adjusting the input ratio among their factors, given the production technology and factor prices. It reflects the ability to optimize resource allocation. Färe et al. (1989) take the projected distance of decision-making units (DMU) to the production Frontier as a measure of economic efficiency and decomposes it into technical efficiency and scale efficiency, where scale efficiency measures the efficiency improvement caused by scale expansion though comparing the efficiency changes under the assumptions of constant returns to scale (CRS) and variable returns to scale (VRS).
The non-parametric DEA can easily fit the multi-input and multi-output production activities and avoid the awkward circumstance that a bias model is set and random disturbance terms do not satisfy the classical assumptions (Song et al., 2018). Therefore, the non-parametric DEA method is widely applied to assess economic efficiency. It is a relative effectiveness evaluation method based on input-output data. The inefficiency degree of a DMU can be evaluated by the projection distance itself from the production Frontier. In general, if the DMU lies in the production Frontier, it is considered the best score of economic efficiency with a value of 1. In contrast, if the economic efficiency value of a DMU is less than 1, it means it is inefficient and needs to be improved. For example, Guo et al. (2022) measured the marine economic efficiency of 11 coastal areas in China from 2007 to 2017 with the EBM (Epsilon-based measure) model in DEA. They explored its temporal and spatial evolutionary trends. Yan et al. (2020) established an evaluation index system of marine economic efficiency and used the DEA model to empirically evaluate the marine economic efficiency of 11 coastal provinces in China in 2016. The results show that Tianjin, Shanghai, Jiangsu, Fujian, and Shandong have higher economic efficiency, Liaoning and Zhejiang have lower economic efficiency, and Hebei, Guangdong, Guangxi, Hainan, and other provinces are between the two; Li et al. (2011) made a comparative evaluation of the economic efficiency of 31 regions in China and show that there are great differences in the economic efficiency of various regions. The reasons for the differences are different.
As the basic economic unit of modern society, improving economic efficiency is one of the primary objectives of city management and the main index of a city’s competitiveness. Like a factory, improving a city’s economic efficiency can also be understood as the production process from the perspective of input and output. In this aspect, some scholars have focused on evaluating and interpreting economic efficiency at the urban level. For example, Yang et al. (2012)used panel data from 54 cities in China from 2001 to 2010 to conduct a regression analysis and explored the impact of city innovation capacity on urban economic efficiency. The results show that technological infrastructure, innovation output, and technology transfer positively impact economic efficiency. Wang D. et al. (2019) estimated the scientific and technological innovation efficiency and economic efficiency of China’s provinces and cities from 2000 to 2016.
2.2 Environmental efficiency of coal cities
Environmental efficiency, also called eco-efficiency, is a comprehensive efficiency linking environmental protection and economic development. Its concept is more complex and has more factors than economic efficiency. It aims to create economic value while increasing environmental productivity and reducing ecological costs. Due to the different understanding, the concept of environmental efficiency (eco-efficiency) can be generally classified into two categories: 1) The one is economists believe that environmental efficiency is an indicator that reflects the total amount of resources and environmental pressure expressed by the ratio between the total regional economic value and the environmental load. The World Business Council for Sustainable Development (WBCSD) regards environmental efficiency as a business concept, which is defined as reducing resource loss and ecological impact while providing products or services that meet human needs and ensure residents’ quality of life. Based on this understanding, some scholars mainly study environmental efficiency can be interpreted as Environmental Carrying Capacity (ECC) and resource-environmental binding force. 2) The other concept is environmental efficiency, which is confirmed as comprehensive environmental efficiency and refers to the ability to create more goods and services while using fewer resources and creating less environmental impact. According to this concept, activities that create economic value while reducing environmental damage contribute to environmental efficiency. With this in mind, the measurement of environmental efficiency is essential to integrating undesirable outputs (bad outputs) into the production process (Formatting Citation). Here, outputs may consist of two categories, i.e., desirable and undesirable outputs. Desirable outputs (good outputs) are a set of products that all the companies/organizations want to produce. At the same time, undesirable outputs (bad outputs) can be considered pollutant emissions during production activities.
Environmental efficiency measurement has received more attention in recent year, and there has been a growth in the number of studies concerning this topic (For example, Sun et al., 2020; Li and Cui, 2021; Nakaishi et al., 2021; Han et al., 2022; Yi-Chia et al., 2022). The main methods used to calculate environmental efficiency include the ratio evaluation method, ecological footprint method, material flow analysis, and DEA. Among them, DEA, based on multiple inputs and outputs, has been the most widely used method for evaluating environmental efficiency in recent years (Korhonen and Luptacik, 2004; Beltrán-esteve et al., 2017; Chu et al., 2019; Zhou et al., 2020; Wang et al., 2022). When carbon emissions are involved in the production process, proper environmental efficiency evaluation of DEA technology to manage undesirable outputs is necessary. Several approaches are available to manage environmental efficiency in the DEA technical framework: weakly disposable technology for pollution (Kuosmanen, 2005; Färe and Grosskopf, 2009), treating undesirable outputs as inputs (Dyckhoff and Allen, 2001; Hailu and Veeman, 2001), undesirable outputs are transformed into another form (Scheel, 2001; Seiford and Zhu, 2002), and a penalty index is used to replace undesirable outputs (You and Yan, 2011).
However, in the basic model of DEA, the distance from the inefficiency DUM to the production Frontier belongs to the radial measure; that is, the increase or decrease of input-output variables are improved according to the same proportions. In reality, most production processes are not in this case. For example, it is difficult to achieve the same proportional improvement in capital and labor inputs because they have different cost and technology requirements. With this regard, Tone (2001) proposed a non-radial distance SBM model that allowed the change of production factors according to different proportions. Thus, it is used widely. For example, Tao et al. (2016), taking the undesirable output (CO2 emission) into consideration, employed a non-separable input/output SBM model to measure China’s provincial green economic efficiency during 1995–2012. In order to assess the environmental efficiency of the power industry in China, Zhou et al. (2013) first proposed a new non-radial DEA approach by integrating the entropy weight and the SBM model. Zhong et al. (2020) estimate the energy economic efficiency of each city in Yangtze River Urban Agglomeration (YRUA) by the Slack-Based Model (SBM) using data from 2008 to 2017, and the energy economic efficiency is decomposed into pure technical efficiency and scale efficiency. Based on the newly constructed Meta Frontier-Global-SBM super-efficiency DEA (Data Envelopment Analysis) model, Zhong et al. (2020) measured the green economic growth levels of 286 prefecture-level cities in China from 2003 to 2018 and examined their spatiotemporal evolution characteristics and internal influencing mechanisms.
Recently, with the increasing concern of climate change crisis, reducing fossil consumption such as coal to achieve near-zero carbon neutrality has become the primary task for the world. Many countries have put forward carbon peaking and carbon neutrality goals and called for reducing or even stopping coal consumption. The “30–60”carbon peaking/carbon neutral targets proposed by the Chinese government will influence the energy-economic systems in return for the coal cities dominated by coal-related industry. Some scholars have begun to pay attention to the environmental efficiency of China’s coal cities (Ma et al., 2021; Xu and Wang, 2021; Cui et al., 2022; Wu et al., 2023). For example, Wang S. et al. (2019) uses the stochastic Frontier analysis (SFA) based on the assumptions of the Translog production function to assess the eco-efficiency of CIE and the potential promotion of 28 typical coal-mining cities in China. Considering environmental pollution and resource consumption as input indicators and total economic output as the output indicator, Zeng et al. (2019); Zeng et al. (2016) analyze the sustainability of coal cities in China using an association rule mining approach and a decision tree modeling approach; Lin et al. (2020) build potential output gap estimation models incorporating pollutant reduction under both weak and strong disposability assumptions and decompose the total output gap (TOG) into a general environmental efficiency gap (GEEG) and environmental regulation gap (ERG) to explore their internal composition. However, those cities’ reliance on coal resources may fall to a resource curse and heavily environmental pollution; thus, they need improved carbon lock-in breakthrough capacities (Hou et al., 2018) and low-carbon innovation (Qian et al., 2019). Nevertheless, the development path of coal cities is still a concern under the national carbon emission reduction target (Zhang et al., 2020).
However, with the implementation of the dual-carbon target in China at present, coal cities with coal-related industries as the main economic source will face huge pressure of low-carbon transformation. Although previous literature has also studied the impact of environmental regulation on energy efficiency and coal cities (Zhao et al., 2021), the environmental regulation under the dual-carbon target will be more stringent (Xiu et al., 2022). It can be predicted that the coal industry will gradually withdraw from the market. However, the previous literature have not pay more attention on such topic. In conclusion, environmental regulation has a significant impact on the environmental efficiency of coal cities. However, the impact of carbon neutralization target on the environmental efficiency of coal cities still lacks an in-depth analysis.
3 Methodology
3.1 Economic efficiency
Assume there are
where
Model 1) is a non-linear programming form and can be transformed into a linear programming form by the Charnes-Cooper transformation
The relationship between models 1) and 2) is
3.2 Environmental efficiency
Assume this production process also will produce
Where
Model (3) is a non-linear programming form and can be transformed into a linear programming form by the Charnes-Cooper transformation
The relationship between models 3) and 4) is
4 Data and indicators
4.1 The historical data and indicators
When choosing a city sample, we need to exclude resource-based cities except for coal cities. Finally, we selected 226 prefecture-level cities in China, including 55 coal cities and 171 non-resource-based cities from 2004 to 2020.
Referring to previous studies, the input variables include labor force, capital stock, and energy consumption, while the desirable output is GDP and the undesirable output is carbon emissions.
Labor force: The labor force in the coal city is represented by the number of employees per unit at the end of the year.
Capital stock: Adopts the perpetual inventory method, that is,
Energy consumption: Because of the unavailability of energy consumption, we choose the total industrial electricity consumption, natural gas, and liquefied petroleum gas to reflect the energy used for the coal city. According to the conversion coefficient provided in China’s energy statistical yearbook, each energy variety is converted into standard coal, equivalent to getting the coal cities’ total energy consumption.
GDP: It measures the production ability of the coal city; GDP is recognized as a desirable output because it is involved in operational performance and economic growth. It can be obtained directly from China City Statistical Yearbook.
Carbon dioxide emissions: The data cannot be obtained directly from the China Statistical Yearbooks and need to be estimated based on the different types of fossil fuels according to the IPCC. Three fossil fuels are used, including industrial electricity consumption, natural gas, and liquefied petroleum gas. They are first converted into calorific values according to the average net calorific values (unit: Joule/Gram) provided by the China National Bureau of Statistics. Then, they are converted into carbon dioxide emissions according to the default emission factors (unit: Gram CO2/J) suggested in the IPCC Guidelines and National Development and Reform Commission (NDRC) of China.
Missing values of these data are replaced by the mean values of the two adjacent periods. The nominal values such as GDP, the investment amount of fixed assets related to currency representations are converted into the actual values of the base period (2010 = 100) by corresponding price indices. Relevant data are from the China City Statistical Yearbook.
4.2 Data and indicators under double carbon target
According to expert prediction, national development planning, trend extrapolation, and other methods, we predict the relevant data for key years from 2030 to 2060.
1) Labor force in 2030 and 2060. The data for the labor force of the coal cities in 2030 are estimated according to the average growth of the recent 3 years. With the total fertility rate has declined in the future, the total population will decrease to about 700 million in 2060, which is 50% lower than that in 2020 (1.4 billion people). Thus, we estimate the pollution of coal cities in 2060 to decline by 50% based on 2020.
2) Capital stock in 2030 and 2060. With the same method, we estimate this data in 2030 according to the average growth of the recent 3 years. Although this average value is reached 8%–10% in the early year, in the recent 3 years, the value has slowed down to about 3%, and the speed of growth of economic development driven by fixed investment will be slow down in the future, thus we assume the growth value is keep 3% in 2030–2060, we get the related capital investment in 2060.
3) Energy consumption in 2030 and 2060. Energy provides the driving power for the economic system and is closely related to China’s fast economic growth. As the speed of China’s development slows down, as a consequence, the demand for energy consumption will be reduced. In this regard, compared with 2020, we consider the rate of energy consumption in 2030 will increase by 10%. According to the famous Zhongjin Corporation, by 2060, China’s economy will reach a per capita GDP of 4.8 wan dollars, bringing energy demand of 6.73 billion tons of standard coal, an increase of 38% over the current level. Thus, we estimate the energy consumption in 2060 will increase by 38% compared with 2020.
4) GDP in 2030 and 2060. According to the goal of the Chinese government, the economic growth rate was 5.5% in 2020. In addition, due to the adjustment of economic structure and the impulse of the COVID-19, China’s economic growth rate has gradually slowed down in recent years. Thus, we set the rate of 5.5% as a benchmark for 2020–2030. After the carbon peak in 2030, large-scale emission reduction will pose greater pressure on the economic growth of coal cities than that of non-coal cities. In this regard, we set 3% and 5% growth rates for coal and non-coal cities in the year 2030–2060. Finally, we estimate the GDP in 2060 for all cities.
5) Carbon dioxide emissions in 2030 and 2060. The realization of the DCT strategy is inseparable from the government’s emission reduction target planning. According to “the action plan for reaching the carbon peak by 2030″issued by the State Council, the carbon emission density in 2030 will be 65% lower than in 2005. Thus, we can estimate carbon emissions according to the following steps.
Step 1:. To estimate carbon emissions in 2030
The real 2005 total GDP of the 226 cities was CNY 16295.45 billion, and the total carbon emissions were 440,663.72 thousand tons. Therefore, 2005 carbon intensity was 2.7 tons per CNY 10,000. Then, 2030 carbon intensity is 0.94 tons per CNY 10,000 according to the “Action plan for reaching the carbon peak before 2030″, Besides, we have a 5.5% average growth rate based on the 2020 GDP (56,082.5 billion) need to estimate the GDP in 2030 is 90,049.1 billion. Then we get the total carbon emissions of 90,049.1 thousand tons. Finally, the 2030 carbon emissions of each city are obtained by the ratio of carbon.
Step 2:. To predict carbon emissions related to fossil fuel consumption
Carbon neutralization is the balanced state between carbon source and carbon sink. According to practical experience and actual situations, carbon neutralization is not zero carbon emissions. Still, the unavoidable carbon emissions can be neutralized by carbon sink technical (such as land and ocean carbon sinks, CCUS, etc.). Thus, we need to estimate the amount of the unavoidable carbon emissions in a carbon neutralization state. Given that fossil energy consumption is the main source of carbon emissions in China; thus, we predict carbon emissions by estimating the energy consumption structure in the period of carbon neutralization. In this aspect, China’s comprehensive policy assessment (IPAC) model points out that the proportion of non-fossil energy in China needs to be increased to 77% in 2050 under the “double carbon” goals, i.e., the ratio of fossil energy in China is 23% in 2050; Dai Houliang (academician of CAS) believes that the proportion of fossil energy accounts for 20% in 2060 when carbon neutralization, which is consistent with the results from the roadmap for carbon neutralization of China’s energy system. In conclusion, we believe in 2060, fossil energy will account for 20%, and the current energy structure will be reduced by 55% to achieve this goal (the current ratio of fossil energy accounts for 75%), i.e., Probability inference, the range of carbon emission reduction rate is 40%–80% in 2060.
Step 3:. to set a carbon neutralization scenario in 2060
According to the above discussion and considering the uncertainty of low carbon technology, we can set three carbon neutralization scenarios as follows (as shown in Table 1).
• Strong carbon neutralization scenario (H1): carbon emissions decreased by 80% in 2060;
• Common carbon neutralization scenario (H2): carbon emissions reduced by 60% in 2060;
• Weak carbon neutralization scenario (H3), carbon emissions decreased by 40% in 2060.
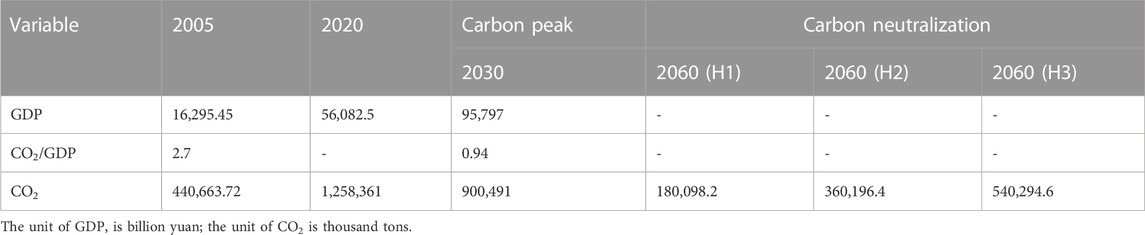
TABLE 1. Three carbon neutralization scenarios in 2060.
5 Results and discussion
5.1 Historical analysis of coal cities
Figure 1 describes the time evolution of coal cities’ economic efficiency and environmental efficiency. We can see:
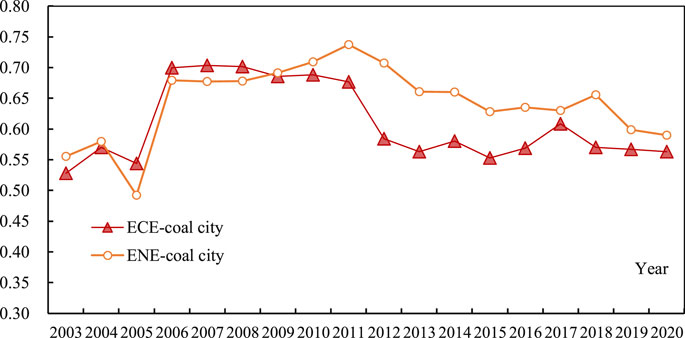
FIGURE 1. The time changes in environmental and economic efficiencies of coal cities.
1) As for the term economic efficiency, on the whole, the economic efficiency of China’s coal cities first showed rising and then falling in 2007. Specifically, the score of economic efficiency rose from the value of 0.5279 in the year 2003 to the maximum value of 0.7034 in the year 2007. The reason is that the acceleration of China’s industrialization process has stimulated a substantial increase in coal demand since 2000, resulting in coal cities’ economic prosperity. Taking Datong, Shanxi province, as an example, its GDP rose from 17.018 billion yuan in 2000 to 56.96 billion yuan after 2008, an increase of 2.3 times in 8 years. However, economic efficiency decreased after 2008, especially after 2011, quickly dropping speed. The reason for the decline in economic efficiency during this period is that the Chinese government has put forward a strategy to encourage green and low-carbon development and has adopted many measures to reduce pollutants. For example, in 2010, the Chinese government launched low-carbon city pilots to reduce carbon emissions through market-oriented tools. Meanwhile, coal-related industries were listed as overcapacity by China’s Ministry of Industry and Information Technology. Under such circumstances, the coal industry’s output is limited, resulting in some coal cities from glory to decline.
2)In terms of environmental efficiency, compared with the turning point of economic efficiency in 2007, the turning point of environmental efficiency of coal cities appeared in 2011. Between 2003 and 2011, the environmental efficiency of coal cities increased from 0.5556 in 2003 to 0.7376 in 2011. This golden development period of the coal city is mainly due to the poor environmental regulation from the government. And the reason why the turning point of environmental efficiency is lagged over economic efficiency is the gain from coal production is bigger than the cost of carbon emissions. However, the government has implemented carbon reduction measures since 2007. However, after 2011, environmental efficiency showed a downward trend, even reaching the lowest point of 0.59 in 2020. The reasons mainly come from two aspects: Severe environmental regulation brings about higher costs than the gains from the output; the other is a capacity reduction policy aiming to limit coal-related industry production capacity. Consequently, the environmental efficiency of coal cities begins to decline under double pressure.
3)From the perspective of the relationship between economic efficiency and environmental efficiency, there are mainly: a) There is a positive correlation between economic efficiency and environmental efficiency, and the correlation coefficient between them is 0.4137 (as shown in Figure 2), which means that as economic efficiency rises to a certain extent, the government will pay more attention to improve environmental efficiency. b) Compared with economic efficiency, there is a time lag in the maximum value of environmental efficiency. The maximum value of economic efficiency appeared in 2007, while the maximum point of environmental efficiency appeared in 2011, which shows that the development of a city starts with economic efficiency. Only when economic efficiency is improved will environmental efficiency follow. c) Before 2011, there was little difference between economic efficiency and environmental efficiency, but after 2011, the environmental efficiency began to be greater than the economic efficiency. It demonstrates the government of coal cities began to pay attention to environmental protection and low-carbon technological innovation in recent years.
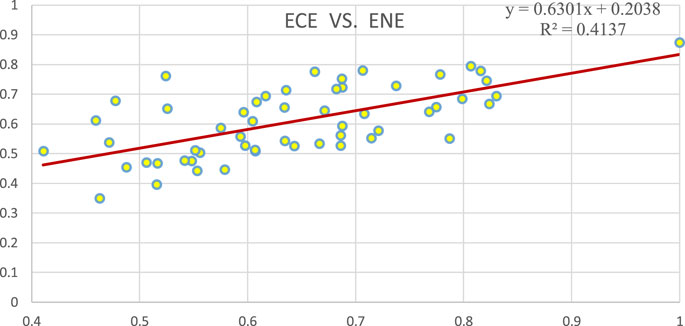
FIGURE 2. Correlation between economic efficiency and environmental efficiency.
The following is a comparative analysis between coal cities and non-coal cities in terms of environmental efficiency and economic efficiency. As shown in Figures 3, 4, We can see:
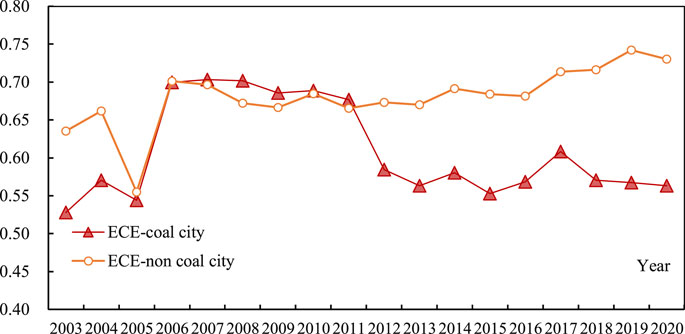
FIGURE 3. The time changes in the economic efficiency of coal and non-coal cities.
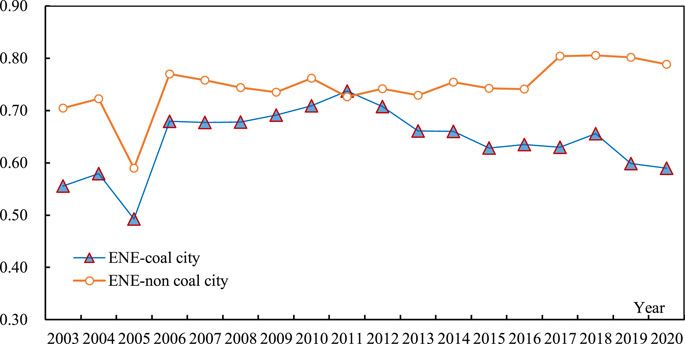
FIGURE 4. The time changes in the environmental efficiency of coal and non-coal cities.
1) In terms of economic efficiency, the gap between coal cities and non-coal cities was very small before 2011, but it began to be enlarged in the period 20,012 to 2020, i.e., the economic efficiency of non-coal cities was higher than that of coal cities. It means that in the early year, without a strict environmental supervision mechanism, coal cities rich in coal resources had economic advantages over non-coal cities. However, after 2011, the economic efficiency of non-coal cities increased greatly, while coal cities showed a sharp decline because of carbon reduction, resulting in an increasing gap between them. It shows that with the increasingly strict national environmental regulations, the advantages of coal cities no longer exist.
2) As far as environmental efficiency is concerned, as shown in Figure 4, on the whole, the environmental efficiency of non-coal cities is higher than that of coal cities. This phenomenon is mainly caused by two types of urban economic development models: coal cities rely on coal resources, and both coal mining and coal chemical processing need to consume a lot of energy and emit a lot of carbon dioxide. The energy consumption of non-coal cities is relatively small, resulting in fewer carbon emissions, so the environmental efficiency of coal cities is less than that of non-coal cities. In addition, the gap between the two types of cities gradually narrowed before 2011 but gradually widened after 2011. With the tightening of national environmental regulations, some traditional coal cities face many barriers to upgrading industrial structure and low-carbon innovation, resulting in the declination of the environmental efficiency of coal cities. While, it is relatively easier for non-coal cities, especially in some economically developed coastal areas, to develop the tertiary industry and conduct low-carbon innovation, thus growing environmental efficiency.
5.2 Historical analysis of different coal cities
Table 2 shows the economic and environmental efficiency rankings of coal cities, from which we can see.
1) The top six coal cities in environmental efficiency are Ordos, Yulin, Haozhou, Guang’an, Jining, and Xuzhou. Under the background of energy transition policy, coal cities represented by the Ordos use rich natural resources to develop photovoltaic, wind energy, and other renewable energy power generation, so their environmental efficiency has always maintained a leading position. Some east region coal cities such as Xuzhou (the average environmental efficiency is 0.8066, and the average economic efficiency is 0.7955) were once trapped in the “resources curse”. However, after the 18th National Congress of the Communist Party of China, they successfully transformed the economic development mode by conducting economic reform policies, such as closing thousands of low-efficiency coal mining enterprises, low carbon technological innovation, and vigorously developing modern service industries. After years of efforts, Xuzhou’s environmental efficiency has been effectively improved.
2) However, other cities such as Shizuishan, Fushun, Guangyuan, Wuhai, Fuxin, and Hegang rank in the last six in terms of environmental efficiency. Most of these cities are traditional resource coal cities. For example, the environmental efficiency values of Fushun and Hegang, located in the old industrial bases of Northeast China, are 0.4592 and 0.4875, respectively. These cities face difficulties such as exhaustion of coal resources and brain drain, thus having the lowest environmental efficiency.
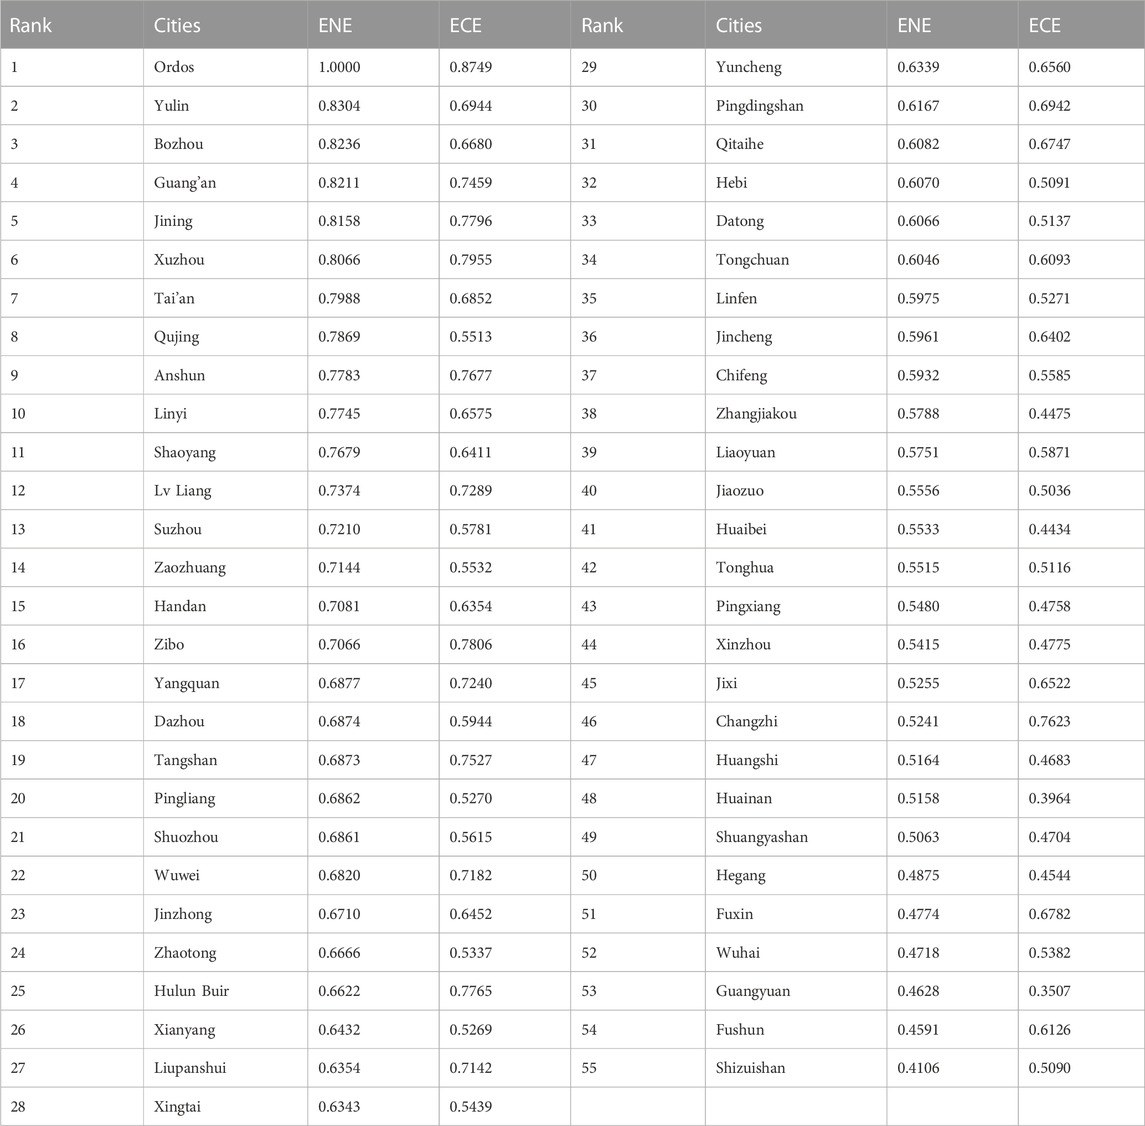
TABLE 2. Economic and environmental efficiencies ranking of coal cities.
3) According to environmental and economic efficiency performance, the coal cities are divided into four categories. As shown in Figure 5, these cities in the first quadrant have higher economic and environmental efficiency, such as Ordos, Xuzhou, Jining, etc.; while the cities in the third quadrant have lower economic efficiency and environmental efficiencies, such as Guangyuan, Huainan and Shizuishan; In the second quadrant, cities such as Changzhi, Fuxin, Jixi, and other cities have high economic efficiency, but low environmental efficiency; in addition, Qujing, Suzhou and other cities in the fourth quadrant have high environmental efficiency, and low economic efficiency. According to these divisions, coal cities can find their own position and coordinate economic development and environmental protection to achieve the ideal state of high environmental efficiency and economic efficiency in the first quadrant.
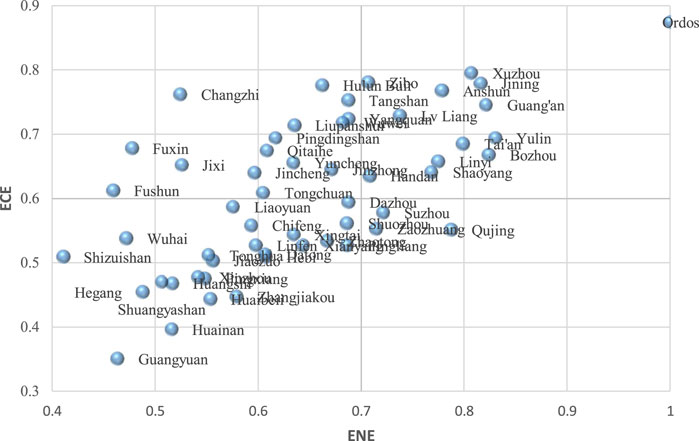
FIGURE 5. Quadrant of economic efficiency and environmental efficiency of coal cities.
5.3 The impact of DCT on coal city
According to the research method of this paper, we have set up three emission reduction scenarios, as shown in Figure 6.
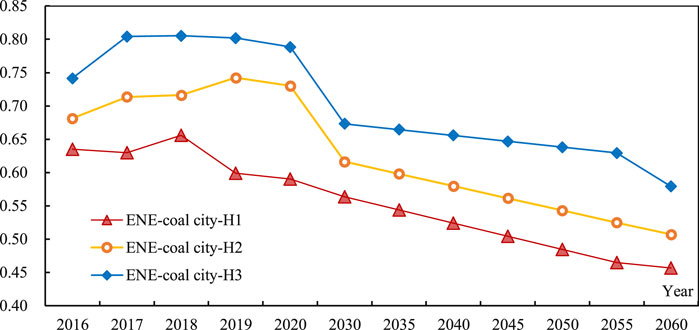
FIGURE 6. The ENE of coal city in the carbon reduction cases.
According to the results, we can see: 1) Under the assumption of strong carbon neutrality (H1), the environmental efficiency drops from 0.8020 in 2020 to 0.6732 in 2030, and in the carbon-neutral period in 2060, the value is only 0.4568. This shows that the reduction of carbon emissions by 80% has the greatest impact on the environmental efficiency of coal cities. In this case, because the amount of carbon emissions has reached the minimum, so the determination of environmental efficiency comes from economic growth. Thus, the poor environmental efficiency of coal cities means a huge economic loss due to severe carbon regulation. 2) Under the assumption of common carbon neutrality (H2), the environmental efficiency drops from 0.7884 in 2020 to 0.6164 in 2030 and continues to decline to 0.507 in 2060; Compared with the H1 scenario, although the environmental efficiency has increased in 2060, it is average only reaches 50.7% of advanced cities. Thus, coal city still encounters much economic loss. 3) Under the weak carbon neutrality assumption (H3), the environmental efficiency drops from 0.7884 to 0.6732 in 2030, dropping to 0.579 in 2060. Compared with the H1 and H2 scenarios, the environmental efficiency has improved significantly because the remaining carbon emissions need to be neutralized their greenhouse gas emissions through the implementation of forestry projects or CCUS technology. However, the CCUS technology, such as the carbon sink technology of thermal power plants, is very expensive because of the lower carbon density in its exhaust gas. Therefore, although the weak carbon-neutral scenario has less impact on economic development, it is most expensive to achieve. In conclusion, carbon peaking and carbon neutrality will pressure coal cities’ economic development. If coal cities have not new economic growth driver in the future, they will be in danger of shrinking or even disappearing.
In order to explore the specific impact of the DCT on each city, Table 3 shows the environmental efficiency of 55 coal cities under different carbon-neutral scenarios. It can be seen that.
1) Under scenario H1, Xuzhou, Ordos, Suzhou, and Hulun Buir have the highest environmental efficiency score, while Yuncheng, Xingtai, and Fushun have the smallest ones of that. The environmental efficiency scores for the former are above 80%, while that of the latter is below 30%. This shows that there are great gaps in environmental efficiency between coal cities in 2060.
2) In addition, as the carbon reduction requirements of the DCT actions get stricter, the environmental efficiency will generally decline with the increase of emission reduction intensity. For example, in the process of H3 to H1 scenarios, the environmental efficiency of Xuzhou is 78.19%, 78.21%, and 83.88%, respectively. However, in some cities such as the Ordos, the environmental efficiency is rising as stricter environmental regulation, with the value of 81.88%,100%, and 100% in H3 to H1 scenarios; That’s because they have got rid of the restriction of a single coal-related industry to format low carbon developed mode. Therefore, even in the face of the strict regulation of the DCT, their environmental efficiency is becoming more and more efficient.
3) On the other hand, traditional coal cities such as Fushun and Xingtai face severe economic and environmental crises. With the gradual increase of emission reduction intensity required by DCT, the environmental efficiency of these cities is gradually reduced. It shows the DCT has a greater negative impact on their economic development because they have not formed new economic growth points due to their over-reliance on coal resources for a long time.
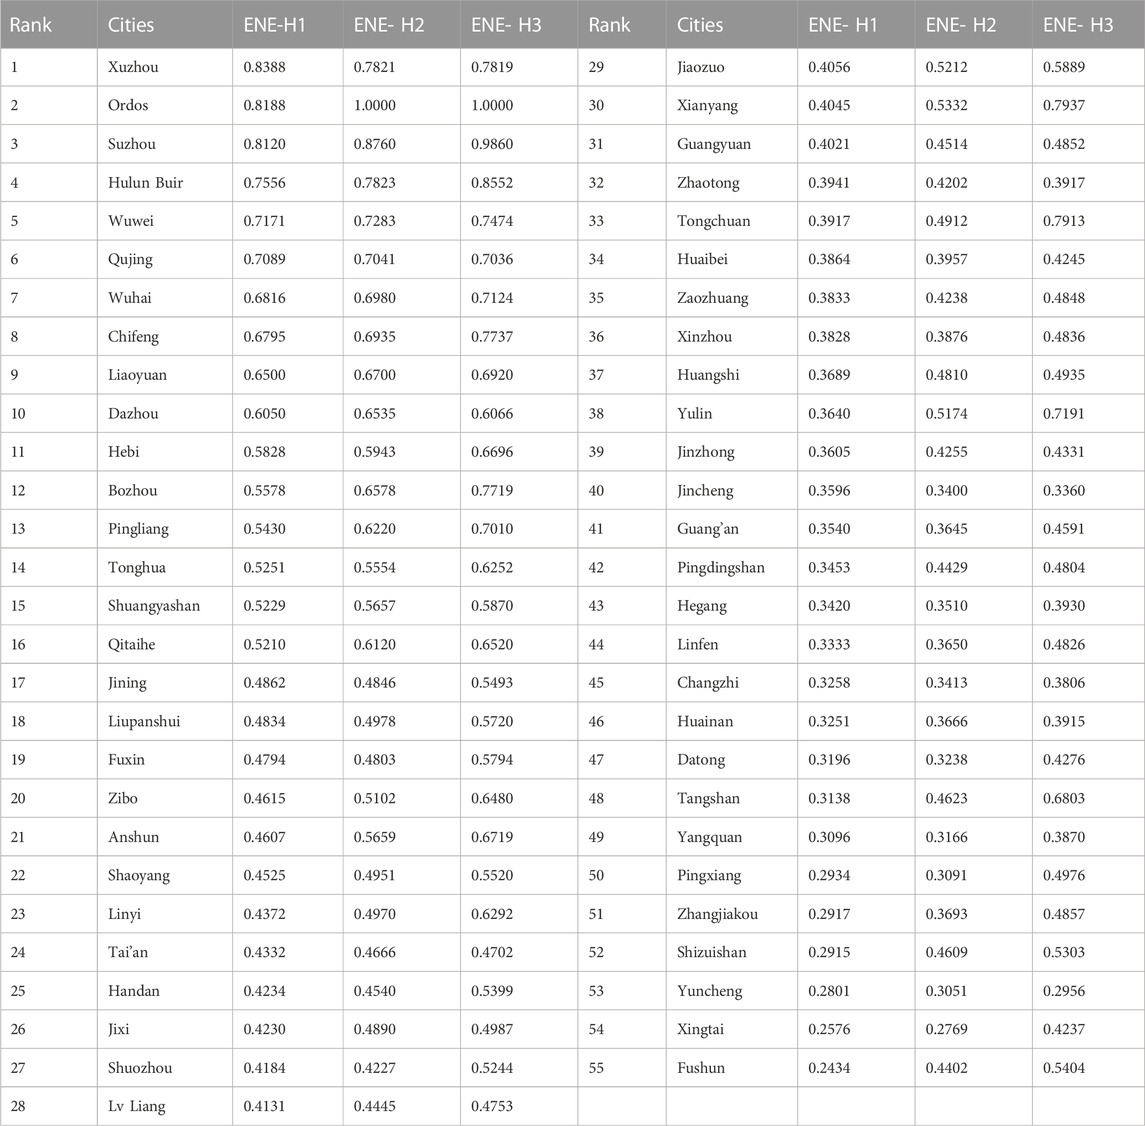
TABLE 3. The ENE of different cities of in the carbon reduce cases.
6 Conclusion and implications
In 2020, the Chinese government proposed a carbon reduction strategy to achieve a carbon peak in 2030 and carbon neutralization in 2060. It means China will largely reduce coal consumption in the future and even take a completely de-coal strategy. In such circumstances, policymakers in the coal cities are eager to understand the impact of the strategy of DCT on the environmental efficiency of coal cities. It is the first step for coal cities to improve their sustainable development ability and actively take measures to adapt to the changes produced by the DCT strategy. This study aims to evaluate environmental efficiency for Chinese coal cities under the DCT strategy, identify the temporal and spatial evolution characters of environmental efficiency using the DEA-SBM model, and explore the impact of DCT on the environmental efficiency of coal cities using 226 Chinese cities. The conclusion and implication of this paper can be drawn as follows.
1) The economic and environmental efficiency of China’s coal cities first rose and then fell during 2003–2022. In addition, the gap between coal cities and non-coal cities are very small before 2011, but it begins to enlarge after 2011. This all demonstrates coal cities began to decline from glory. The reason for the declination is that the coal-related industry has been regulated. Compared with the turning point of economic efficiency in 2007, that of environmental efficiency for coal cities appeared in 2011. Although the government has implemented carbon reduction measures since 2007, the gain from coal production is bigger than the cost of carbon emissions in the early year. However, since 2011, the two aspects, including carbon reduction and capacity reduction measures, have resulted in a large drop in economic growth.
2) On average, the top six coal cities of environmental efficiency are Ordos, Yulin, Haozhou, Guang’an, Jining, and Xuzhou. In contrast, other cities such as Shizuishan, Fushun, Guangyuan, Wuhai, Fuxin, and Hegang rank the last six in terms of environmental efficiency. The two groups have different development modes. Specifically, cities like Ordos are rich in natural resources to develop photovoltaic, wind energy, and other renewable energy power generation, so their environmental efficiency has always maintained a leading position. Some coal cities, such as Xuzhou, were once trapped in the “resources curse”. However, its environmental efficiency has been effectively improved by conducting economic reform policies, such as closing thousands of low-efficiency coal mining enterprises, low carbon technological innovation, and vigorously developing modern service industries. Nevertheless, most of the traditional coal cities are faced with the exhaustion of coal resources and brain drain, making it difficult to find new economic growth drivers.
3) According to our simulation results, the environmental efficiency of coal cities decreases significantly under the three scenarios in the 2060 DCT strategy. The more the amount of emission reduction, the lower the environmental efficiency of coal cities in the carbon neutralization scenario. This shows that coal cities have serious path dependence, which creates serious development innovation barriers. Although the weak carbon-neutral scenario has less impact on the economic development of coal cities, it is the most difficult to achieve because of the high cost of carbon neutralization technology. In conclusion, the DCT strategy will pose a greater pressure on coal cities’ economic development. If coal cities have not fostered new economic growth drivers in the future, they will be in danger of shrinking or even disappearing.
As for the specific impact of the DCT on each city, we find the highest score of environmental efficiency under a strong carbon neutralization scenario (H1) in Xuzhou, Ordos, Suzhou, and Hulun Buir lowest ones are Yuncheng, Xingtai, and Fushun. The score of the former is above 80%, while that of the latter is below 30%. This shows that there are great gaps in environmental efficiency between coal cities in 2060. That is because some cities, such as Ordos and Xuzhou, have gotten rid of resource dependence and formed new growth drivers, while others are facing serious transformation difficulties due to path dependence.
According to the above conclusion, the following implications are opined: 1) In view of DCT strategy has a great impact on the environmental efficiency of coal cities, and if the requirement of carbon emission reduction is too strong, it may lead to a sharp decline in the economy and unemployment of workers. Thus, policymakers need to prepare a plan to deal with a series of problems caused by the economic downturn, timely commit asset restructuring and appease unemployed workers to prevent a series of social problems that may erupt. 2) Due to the excessive path dependence of some traditional cities, it is difficult for them to break out of carbon lock-in by themselves. Therefore, the superior government needs to provide financial and favorable policy support to help them explore the new low carbon development path. 3) For those coal cities that have successfully economic transformation, they should focus on conducting low-carbon technology innovations, such as carbon sink technology as soon as possible and provide technical support and technical cooperation for other cities.
Data availability statement
The raw data supporting the conclusion of this article will be made available by the authors, without undue reservation.
Author contributions
Conceptualization, methodology, funding acquisition: YZ, ZC, HC; Analysis and interpretation: YZ, ZC, HC; Writing, review and editing: YZ; Final approval of the article: YZ, ZC, HC.
Acknowledgments
The authors are grateful for the valuable suggestions of reviewers.
Conflict of interest
JM was employed by North China Power Engineering Co, Ltd. of China Power Engineering Consulting Group.
The remaining authors declare that the research was conducted in the absence of any commercial or financial relationships that could be construed as a potential conflict of interest.
Publisher’s note
All claims expressed in this article are solely those of the authors and do not necessarily represent those of their affiliated organizations, or those of the publisher, the editors and the reviewers. Any product that may be evaluated in this article, or claim that may be made by its manufacturer, is not guaranteed or endorsed by the publisher.
References
Beltrán-esteve, M., Reig-Martínez, E., and Estruch-guitart, V. (2017). Assessing eco-efficiency: A metafrontier directional distance function approach using life cycle analysis. Environ. Impact Assess. Rev. 63, 116–127. doi:10.1016/j.eiar.2017.01.001
Chu, J., Wu, J., Zhu, Q., An, Q., and Xiong, B. (2019). Analysis of China’s regional eco-efficiency: A DEA two-stage network approach with equitable efficiency decomposition. Comput. Econ. 54, 1263–1285. doi:10.1007/s10614-015-9558-8
Cui, S., Wang, Y., Zhu, Z., Zhu, Z., and Yu, C. (2022). The impact of heterogeneous environmental regulation on the energy eco-efficiency of China’s energy-mineral cities. J. Clean. Prod. 350, 131553. doi:10.1016/j.jclepro.2022.131553
Dyckhoff, H., and Allen, K. (2001). Measuring ecological efficiency with data envelopment analysis (DEA). Eur. J. Oper. Res. 132, 312–325. doi:10.1016/S0377-2217(00)00154-5
Färe, R., and Grosskopf, S. (2009). A comment on weak disposability in nonparametric production analysis. Am. J. Agric. Econ. 91, 535–538. doi:10.1111/j.1467-8276.2008.01237.x
Färe, R., Grosskopf, S., Kokkelenberg, E. C., Färe, R., Grosskopf, S., and Kokkelenberg, E. C. (1989). Measuring plant capacity, utilization and technical change: A nonparametric approach. Int. Econ. Rev. Phila. 30, 655–666. doi:10.2307/2526781
Guo, J., Yuan, X., and Song, W. (2022). Driving forces on the development of China’s marine economy: Efficiency and spatial perspective. Ocean. Coast. Manag. 224, 106192. doi:10.1016/j.ocecoaman.2022.106192
Hailu, A., and Veeman, T. (2001). Non-parametric productivity analysis with undesirable outputs: An application to the Canadian pulp and paper industry. Am. J. Agric. Econ. 83, 605–616. doi:10.1111/0002-9092.00181
Han, J., Li, G., Shen, Z., Song, M., and Zhao, X. (2022). Manufacturing transfer and environmental efficiency: Evidence from the spatial agglomeration of manufacturing in China. J. Environ. Manage. 314, 115039. doi:10.1016/j.jenvman.2022.115039
Hou, Y., Long, R., Chen, H., and Zhang, L. (2018). Research on the sustainable development of China’s coal cities based on lock-in effect. Resour. Policy 59, 479–486. doi:10.1016/j.resourpol.2018.09.002
Jiang, X., Ma, H., Wu, X., Zou, Y., and Fu, J. (2022). Evaluation of environmental and economic efficiency of transportation in China based on SBM model. Procedia Comput. Sci. 199, 1120–1127. doi:10.1016/j.procs.2022.01.142
Korhonen, P. J., and Luptacik, M. (2004). Eco-efficiency analysis of power plants: An extension of data envelopment analysis. Eur. J. Oper. Res. 154, 437–446. doi:10.1016/S0377-2217(03)00180-2
Kucukvar, M., Onat, N. C., Kutty, A. A., Abdella, G. M., Bulak, M. E., Ansari, F., et al. (2022). Environmental efficiency of electric vehicles in Europe under various electricity production mix scenarios. J. Clean. Prod. 335, 130291. doi:10.1016/j.jclepro.2021.130291
Kuosmanen, T. (2005). Weak disposability in nonparametric production analysis with undesirable outputs. Am. J. Agric. Econ. 87, 1077–1082. doi:10.1111/j.1467-8276.2005.00788.x
Li, G. R., Ding, Y. Y., and Ma, M. N. (2011). “Comparative study on economic efficiency of each region in China,” in 2011 International Conference on Management Science and Engineering 18th Annual Conference Proceedings, Rome, Italy, 13-15 September 2011.
Li, Y., and Cui, Q. (2021). Analyzing the role of competition and cooperation in airline environmental efficiency through two dynamic environmental cross-efficiency models. Int. J. Sustain. Transp. 15, 850–864. doi:10.1080/15568318.2020.1821415
Lin, H., Zhang, X., Chen, Z., and Zheng, H. (2020). Estimating the potential output and output gap for China’s coal cities with pollutants reduction. Resour. Policy 68, 101703. doi:10.1016/j.resourpol.2020.101703
Long, R., Li, H., Wu, M., and Li, W. (2021). Dynamic evaluation of the green development level of China’s coal-resource-based cities using the TOPSIS method. Resour. Policy 74, 102415. doi:10.1016/j.resourpol.2021.102415
Long, R., Ouyang, H., and Guo, H. (2020). Super-slack-based measuring data envelopment analysis on the spatial–temporal patterns of logistics ecological efficiency using global Malmquist Index model. Environ. Technol. Innov. 18, 100770. doi:10.1016/j.eti.2020.100770
Ma, J., Hu, Q., Shen, W., and Wei, X. (2021). Does the low-carbon city pilot policy promote green technology innovation? Based on green patent data of Chinese a-share listed companies. Int. J. Environ. Res. Public Health 18, 3695. doi:10.3390/ijerph18073695
Nakaishi, T., Takayabu, H., and Eguchi, S. (2021). Environmental efficiency analysis of China’s coal-fired power plants considering heterogeneity in power generation company groups. Energy Econ. 102, 105511. doi:10.1016/j.eneco.2021.105511
Qian, X., Wang, D., Wang, J., and Chen, S. (2019). Resource curse,environmental regulation and transformation of coal-mining cities in China. Resour. Policy 74, 101447. doi:10.1016/j.resourpol.2019.101447
Scheel, H. (2001). Undesirable outputs in efficiency valuations. Eur. J. Oper. Res. 132, 400–410. doi:10.1016/s0377-2217(00)00160-0
Seiford, L. M., and Zhu, J. (2002). Modeling undesirable factors in efficiency evaluation. Eur. J. Oper. Res. 142 (1), 16–20. doi:10.1016/s0377-2217(01)00293-4
Song, Y., Liu, H., Liu, X., and Yang, G. (2018). Measuring the productivity evolution of Chinese regional thermal power industries using global Malmquist-Luenberger productivity index. Int. J. Energy Sect. Manag. 12, 221–243. doi:10.1108/IJESM-11-2017-0007
Sun, H., Pofoura, A. K., Mensah, I. A., Li, L., and Mohsin, M. (2020). The role of environmental entrepreneurship for sustainable development: Evidence from 35 countries in Sub-Saharan Africa. Sci. Total Environ. 741, 140132. doi:10.1016/j.scitotenv.2020.140132
Tao, X., Wang, P., and Zhu, B. (2016). Provincial green economic efficiency of China: A non-separable input–output SBM approach. Appl. Energy 171, 58–66. doi:10.1016/j.apenergy.2016.02.133
Wang, D., Wan, K., and Yang, J. (2019). Measurement and evolution of eco-efficiency of coal industry ecosystem in China. J. Clean. Prod. 209, 803–818. doi:10.1016/j.jclepro.2018.10.266
Wang, H., and Yang, J. (2019). Total-factor industrial eco-efficiency and its influencing factors in China: A spatial panel data approach. J. Clean. Prod. 227, 263–271. doi:10.1016/j.jclepro.2019.04.119
Wang, R., Zhao, X., and Zhang, L. (2022). Research on the impact of green finance and abundance of natural resources on China’s regional eco-efficiency. Resour. Policy 76, 102579. doi:10.1016/j.resourpol.2022.102579
Wang, S., Zhang, J., Fan, F., Lu, F., and Yang, L. (2019). The symbiosis of scientific and technological innovation efficiency and economic efficiency in China-An analysis based on data envelopment analysis and logistic model. Technol. Anal. Strateg. Manag. 31, 67–80. doi:10.1080/09537325.2018.1485889
Wu, H., Wang, Q., Xu, Y., Ye, Y., and Zeng, X. (2023). Coal life-cycle analysis embedded with land–energy nexus of a coal-based city in China. Resour. Environ. Sustain. 12, 100109. doi:10.1016/j.resenv.2023.100109
Xiu, J., Zang, X., Piao, Z., Li, L., and Kim, K. (2022). China’s low-carbon economic growth: An empirical analysis based on the combination of parametric and nonparametric methods. Environ. Sci. Pollut. Res. (In press) online. doi:10.1007/s11356-022-24775-y
Xu, S., and Wang, C. (2021). City image and eco-efficiency: Evidence from China. Environ. Sci. Pollut. Res. 28, 52459–52474. doi:10.1007/s11356-021-14219-4
Yan, Y., Tsydypova, A., and Zhang, Y. Y. (2020). Evaluation of marine economic efficiency of China’s coastal provinces based on DEA model. J. Coast. Res. 112, 315–318. doi:10.2112/JCR-SI112-082.1
Yang, L., Xia, M. J., and Wei, S. H. (2012). “Urban innovative capacity and economic efficiency: Evidence from 54 cities in China,” in 2012 International Symposium on Management of Technology (ISMOT), Hangzhou, China, 08-09 November 2012.
Yang, L., and Yang, Y. (2019). Evaluation of eco-efficiency in China from 1978 to 2016: Based on a modified ecological footprint model. Sci. Total Environ. 662, 581–590. doi:10.1016/j.scitotenv.2019.01.225
Yi-Chia, L., Chompunut, L., Tonapa, P., and Anupong, W. (2022). Measuring the environmental efficiency of the investment for offshore wind power site in Taiwan. Sustain. Comput. Inf. Syst. 35, 100693. doi:10.1016/j.suscom.2022.100693
You, S., and Yan, H. (2011). A new approach in modelling undesirable output in DEA model. J. Oper. Res. Soc. 62, 2146–2156. doi:10.1057/jors.2011.1
Zeng, L., Guo, J., Wang, B., Lv, J., and Wang, Q. (2019). Analyzing sustainability of Chinese coal cities using a decision tree modeling approach. Resour. Policy 64, 101501. doi:10.1016/j.resourpol.2019.101501
Zeng, L., Wang, B., Fan, L., and Wu, J. (2016). Analyzing sustainability of Chinese mining cities using an association rule mining approach. Resour. Policy 49, 394–404. doi:10.1016/j.resourpol.2016.07.013
Zhang, W., Yan, Q., Yuan, J., He, G., Teng, T.-L., Zhang, M., et al. (2020). A realistic pathway for coal-fired power in China from 2020 to 2030. J. Clean. Prod. 275, 122859. doi:10.1016/j.jclepro.2020.122859
Zhao, X., Ding, X., and Li, L. (2021). Research on environmental regulation, technological innovation and green transformation of manufacturing industry in the Yangtze River economic belt. Sustainability 13 (18), 10005. doi:10.3390/su131810005
Zhong, Z., Peng, B., Xu, L., Andrews, A., and Elahi, E. (2020). Analysis of regional energy economic efficiency and its influencing factors: A case study of Yangtze River Urban agglomeration. Sustain. Energy Technol. Assessments 41, 100784. doi:10.1016/j.seta.2020.100784
Zhou, Y., Liu, Z., Liu, S., Chen, M., Zhang, X., and Wang, Y. (2020). Analysis of industrial eco-efficiency and its influencing factors in China. Clean. Technol. Environ. POLICY 22, 2023–2038. doi:10.1007/s10098-020-01943-7
Keywords: environmental efficiency, coal cities, economic efficiency, carbon neutralization, sustainable development
Citation: Zhang Y, Chen Z, Chen H and Mao J (2023) Exploring the impact of “double carbon target” on environmental efficiency of coal cities in China. Front. Environ. Sci. 11:1132251. doi: 10.3389/fenvs.2023.1132251
Received: 05 January 2023; Accepted: 13 February 2023;
Published: 27 February 2023.
Edited by:
Siyu Ren, Nankai University, ChinaReviewed by:
Liang Li, Nanjing University of Information Science and Technology, ChinaJin Zhang, Tsinghua University, China
Copyright © 2023 Zhang, Chen, Chen and Mao. This is an open-access article distributed under the terms of the Creative Commons Attribution License (CC BY). The use, distribution or reproduction in other forums is permitted, provided the original author(s) and the copyright owner(s) are credited and that the original publication in this journal is cited, in accordance with accepted academic practice. No use, distribution or reproduction is permitted which does not comply with these terms.
*Correspondence: Zhenling Chen, chenzhenling2008@163.com ; Huihui Chen, huihui622622@163.com