
Abstract
In this study, the evolution rule of yeild strength and microstructure along the axial, hoop and radial directions of 7050 aluminum alloy ring forging during Regression and re-aging (RRA) heat treatment was studied by using the experimental technology of tensile property test and transmission electron microscope (TEM) and Electron backscatter diffraction (EBSD) observation. During the RRA process, the evolution rule of intragranular and intergranular precipitates along axial, hoop and radial directions of 7050 aluminum alloy ring forging was described by establishing a model. After the pre-aging stage, the yield strength of samples along the axial, hoop and radial directions of forgings shows obvious anisotropy, and the anisotropy decreases gradually after regression and re-aging treatment. The results show that the cause of the larger yield strength anisotropy is the inhomogeneous size and distribution of precipitates after the pre-aging stage; After the regression stage, the cause of the reduction of the yield strength anisotropy is due to the homogeneous distribution of intragranular precipitates; After re-aging treatment, the reasons of further reduction of the yield strength anisotropy are because of more homogeneous distribution of intragranular precipitates and the discontinuous of intergranular precipitates.
Export citation and abstract BibTeX RIS

Original content from this work may be used under the terms of the Creative Commons Attribution 4.0 licence. Any further distribution of this work must maintain attribution to the author(s) and the title of the work, journal citation and DOI.
1. Introduction
7xxx series aluminum alloys are widely used in aviation field because of their low density, ultra-high strength and high toughness [1–5]. The mechanical properties of this kind of alloys mainly depend on the precipitation characteristics during aging. The general precipitation sequence of 7xxx aluminum alloy is proposed as[6–11]: α Supersaturated solid solution → GP (I, II) zones → η' phase → η phase. The GP area and η' phase are the main strengthening phase of 7xxx Al alloy precipitation strengthening [7, 12–14], the precipitation of these two phases can improve the strength of the alloy, the η phase affects the strength and corrosion resistance of the alloy. Proper aging process can control the type and size of precipitates, which plays an important role in improving the strength of the alloy.
RRA is a three-step heat treatment process composed of pre-aging, regression treatment and re-aging, which improves the corrosion resistance while maintaining the high strength of 7xxx aluminum alloy [15]. Among them, pre-aging step can be under peak-aging or T6 state to obtain uniform and fine precipitates; Regression treatment is to dissolve the precipitate formed by partial pre-aging at higher temperature, and re-aging is to age at lower temperature, it is mainly characterized by partially dissolved GP zone and η' phase re-nucleation, η' phase grow up or transform to η phase [16, 17]. At present, researchers' study on RRA process mainly focuses on changing heat treatment process to regulate mechanical properties and corrosion resistance. Sun studied a new RRA process which made 7150 Aluminum alloy obtain good strength and corrosion resistance [18]. Pan studied the effect of RRA on the microstructure and fatigue crack growth behavior of 7050 aluminum alloy thick plate, the results show that RRA treatment can obtain the strength in T6 state and improve the fatigue crack growth resistance [19]. Cao et al Studied the effects of different regression treatments on the microstructure and properties of 7085 aluminum alloy during RRA, the results show that the regression treatment at 160 °C for 1.5 h can obtain ideal mechanical properties and corrosion resistance [20]. 7xxx aluminum alloy will have large property anisotropy during deformation, the research shows that solid solution and aging heat treatment can reduce the anisotropy [21], but there are few reports on the tensile property anisotropy of 7xxx aluminum alloy during RRA process.
In this work, the changes of yeild strength and precipitation morphology along the axial, hoop and radial directions of 7050 aluminum alloy ring forging during RRA heat treatment were studied by using the experimental technology of tensile property test and TEM and EBSD observation. During RRA treatment process, the evolution rule of intragranular and intergranular precipitates along axial, hoop and radial directions of 7050 aluminum alloy ring forging was described by establishing a model, the yeild strength anisotropy after pre-aging was discussed with the strengthening theoretical equation, and the changes of yeild strength anisotropy after regression and re-aging were discussed through precipitation evolution.
2. Experiment
The sample in this paper used the forging blank of ultra-high strength 7050 aluminum alloy ring forging(axial symmetry), and its composition is shown in table 1 [22]. A part of the sample (figure 1) of the original forging is cut by wire cutting for two-stage solution treatment at 470 °C for 2 h and 480 °C for 5 h, and then quenched at room temperature water, after that, the sample is pre-aged at 105 °C for 17 h. After pre-aging treatment, it is directly heated to 190 °C for 30 min (retrogression treatment), then water cooled, and finally, it was re-aged at 120 °C for 23 h. The heat treatment process is shown in figure 2. After pre-aging, regression and re-aging, take samples along the axial, hoop and radial directions of the alloy for mechanical property test and microstructure observation. Details of RRA treatments are listed in table 2, where samples A1, A2 and A3 were pre-aged at 120 °C for 17 h, the samples B1, B2 and B3 were pre-aged at 105 °C for 17 h with the retrogression treatment at 190 °C for 30 min, the samples C1, C2 and C3 were pre-aged at 105 °C for 17 h and re-aged at 120 °C for 23 h with the retrogression treatment at 190 °C for 30 min Column 5 in table 2 clearly shows the directions of each sample along the ring forging.
Table 1. Chemical composition of experimental 7050 aluminium alloy.
| AL | Zn | Mg | Cu | Cr | Zr | Ti | Fe | Si | Mn |
|---|---|---|---|---|---|---|---|---|---|
| Bal | 6.10 | 2.16 | 2.10 | 0.031 | 0.11 | 0.025 | 0.077 | 0.05 | 0.02 |
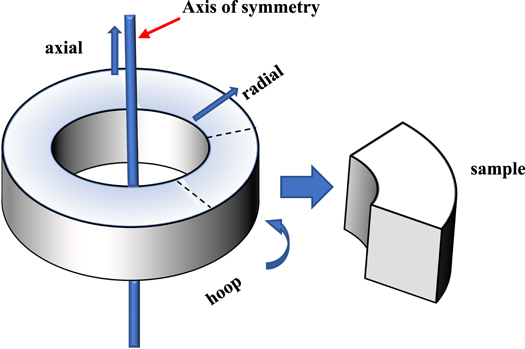
Figure 1. Schematic diagram of sample cutting.
Download figure:
Standard image High-resolution image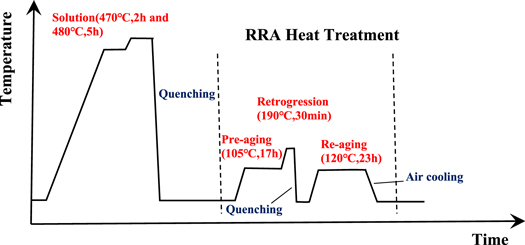
Figure 2. Schematic of heat treatment routes for alloys 7050 samples.
Download figure:
Standard image High-resolution imageTable 2. Detailed RRA treatment for alloy 7050.
| Samples | Pre-aging | Retrogression | Re-ageing | Direction along ring forging |
|---|---|---|---|---|
| A1 | 105 °C,17 h | — | — | axial |
| A2 | — | — | hoop | |
| A3 | — | — | radial | |
| B1 | 190 °C, 30 min | — | axial | |
| B2 | — | hoop | ||
| B3 | — | radial | ||
| C1 | 120 °C, 23 h | axial | ||
| C2 | hoop | |||
| C3 | radial |
The room temperature tensile test is carried out on the American Instron 3369 mechanical testing machine, the size of tensile sample shall be processed according to GB145-85, the diameter, gauge distance and length are 5 mm, 25 mm and 70 mm respectively, and the tensile speed is 1.5 mm min−1. The precipitates of the alloy were observed by Fei Talos 2000X field emission transmission electron microscope, the acceleration voltage was 200 kV and the camera length was 660 nm. The dislocation density of the alloy was analyzed by MiniFlex600 x-ray polycrystalline powder diffractometer, the x-ray was Cu Target Kα ray, which wavelength λ is 0.154 nm. The x-ray scanning ranged from 30° to 90°, of which step length is 10° min−1. The grain features of samples with different treatments were analyzed by EBSD. In this paper, EBSD work was performed using Oxford Nordy Max3 field emission scanning electron microscope and analyzed using HKL Channel 5 Software. The crystal orientation maps were derived from the EBSD measurement scanning over the range of 500 μm × 500 μm with the step size of 1 μm. The grain boundary angle of 2° to 15° is defined as Low angle grain boundary (LAGBs) in EBSD image, which is represented by red line and defined the grain boundary angle of grater than 15° as High angle grain boundary (HAGBs), which represented by black line.
3. Results
3.1. Tensile properties
Figure 3 presents the stress-strain curves of the samples at different stages of RRA process (samples A1, A2 , A3, B1, B2 , B3, C1, C2 and C3). As for the pre-aged samples, it can be seen that the yield strength in sample A2 is the highest, which is 531 MPa, and samples A1 and A3 are 43 MPa and 70 MPa lower than A1 respectively. From pre-aging to retrogression, the yield strength in sample B2 is the highest, which is 576 MPa, and samples B1 and B3 are 24 MPa and 39Mpa lower than B1 respectively. As for re-aged samples, the yield strength in sample C3 is the highest, which is 529 MPa, and sample C1 and C2 are 17 MPa and 23 MPa lower than that in axial direction, respectively. The yield strength has been greatly improved from pre-aing to retrogression. The yield strength in re-aged samples is lower than regression samples, but is higher than that pre-aged samples.
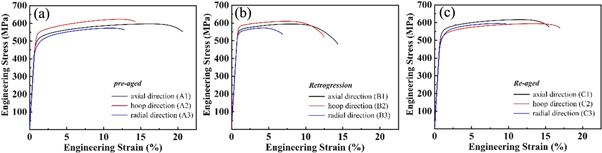
Figure 3. The stress-strain curves of samples at different stage (a) pre-aged (b) retrogression (c) re-aged.
Download figure:
Standard image High-resolution image3.2. Grain boundary and dislocation morphology
Figures 4 and 5 display the micrographs of LAGBs, HAGBs and dislocation morphology in samples A1, A2 and A3, respectively. As for samples A1, A2 and A3, the average grain size are 9.6 μm, 8.8 μm and 10.2 μm respectively, it shows little difference. The average angle of LAGBs in samples A1, A2 and A3 are 2.6°, 2.68° and 2.97°, respectively and the fraction of HAGBs are 48.7%, 43.8% and 33.6%. There are dislocation walls, dislocation cells, dislocation entanglements and other structures can be clearly observed in figure 5. Because grain size and dislocation density changes during aging can be ignored, in this paper, the grain morphology and dislocation morphology of samples B1, B2, B3, C1, C2 and C3 are no longer analyzed.
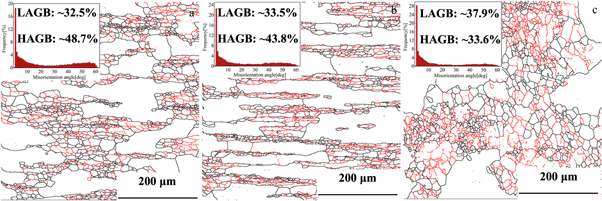
Figure 4. EBSD micrographs of 7050 Al alloy after the pre-aging stage (a) Axial direction (A1); (b) Hoop direction (A2); (c) Radial direction (A3).
Download figure:
Standard image High-resolution image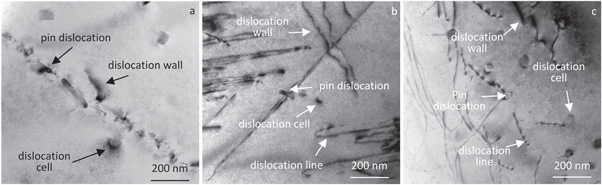
Figure 5. Dislocation micrographs of 7050 Al alloy after the pre-aging stage (a) axial direction (A1); (b) hoop direction (A2); (c) radial direction (A3).
Download figure:
Standard image High-resolution image3.3. Precipitates morphology in RRA heat treatment
Figure 6 presents the TEM micrographs of pre-aged microstructure along the axial, hoop and radial directions (samples A1, A2 and A3), concentrating on the intragranular and intergranular precipitates. Combined with the high-resolution TEM (HRTEM) results (figures 6(c), (f) and (i)), it can be found that the dispersive intragranular precipitates mainly corresponding to GP zone, while some of them are η' phase. Furthermore, the size of intragranular precipitate in sample A1 was measured as about 3.1 nm (figure 6(a)), which is nearly the same as the result in sample A2 (2.8 nm, figure 6(d)). As a comparison, the intragranular precipitate in sample A3 possesses much larger size as 15 ∼ 20 nm (figure 6(g)). It should also be noted that the density of intragranular precipitate in sample A2 is remarkable larger than the other two samples. In addition, the morphology of grain boundary precipitates (GBPs) also is different along the different directions. In the sample A1 (figure 6(b)), continuous GBPs are less than 20 nm in width. As for samples A2 and A3, there are no η precipitates at grain boundaries (GBs) can be observed clearly, however in sample A3, the component phase can be observed at GBs. There are no precipitate free zone (PFZ) can be observed clearly in samples A1, A2 and A3.
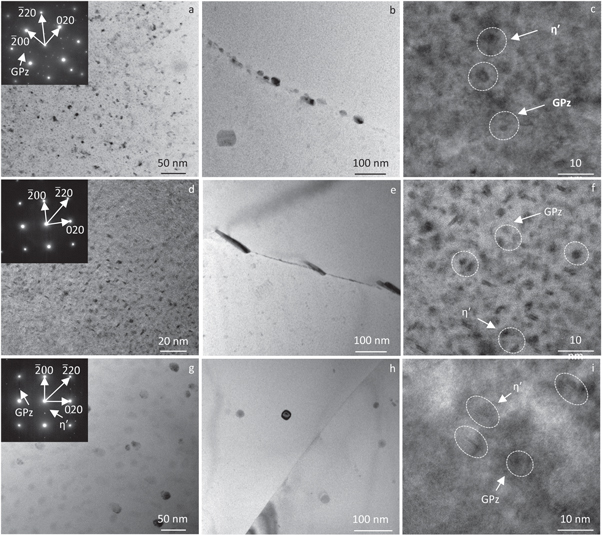
Figure 6. TEM micrographs of intragranular and intergranular precipitates and HRTEM image after the pre-aging stage (a)–(c) axial direction (A1); (d)–(f) hoop direction (A2); (g)–(i) radial direction (A3).
Download figure:
Standard image High-resolution imageFigure 7 presents the TEM micrographs of retrogression microstructure along the axial, hoop and radial directions (samples B1, B2 and B3). There are certain differences in the size and type of intragranular and intergranular precipitates compare with samples A1, A2 and A3, the density of intragranular precipitates is remarkable larger than samples A1, A2 and A3. As for samples B1 and B2 (figures 7(a), (d)), the dispersive intragranular precipitates mainly corresponding to η' and η phase (size of 4 nm). However in sample B3, the intragranular precipitates mainly corresponding to η' and η phases, and their size is about 13 nm (figure 7(g)). The morphology of GBPs also is different along the different directions. In the samples B1 and B2 (figures 7(b), (e)), the η precipitates at GBs become coarser and discontinuous (size of 30 nm, interparticle spacing of 30–50 nm), together with a narrow PFZ (10–20 nm in width). As for sample B3, discontinuous GBPs are about 60 nm in width, the PFZ is 10–20 nm in width.
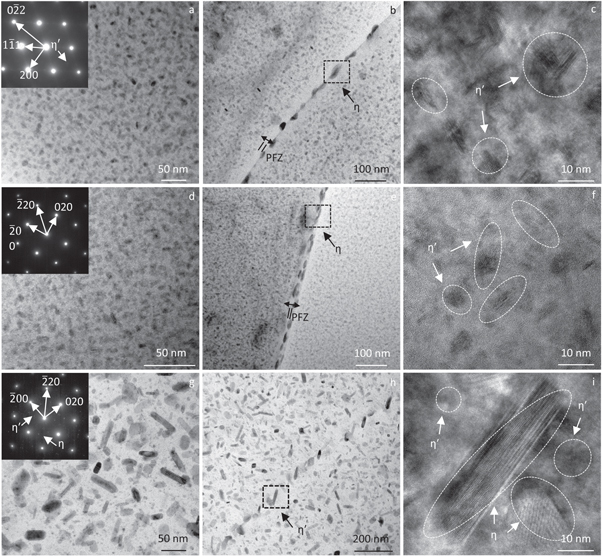
Figure 7. TEM micrographs of intragranular and intergranular precipitates and HRTEM image after the retrogression stage (a)–(c)axial direction (B1); (d)–(f) hoop direction (B2); (g)–(i)radial direction (B3).
Download figure:
Standard image High-resolution imageFigure 8 presents the TEM micrographs of re-aged microstructure along the axial, hoop and radial directions (samples C1, C2 and C3). There are remarkable differences in the size and type of intragranular and intergranular precipitates compare with samples B2, B2 and B3. The size of intragranular precipitates become coarser in samples C1, C2 and C3, indicating that more solute components are consumed in the growth process of precipitates during re-aging. As for samples C1, C2 and C3, the dispersive intragranular precipitates mainly corresponding to GP zone, η' and η phase, showing that re-precipitation was carried out during re-aging, the average size of intragranular precipitates were measured as about 16.6 nm, 14.5 nm and 20.6 nm, respectinely. The η precipitates at GBs become more coarser and discontinuous (size of 100 nm for C1, size of 40 nm for C2 and size of 150 nm for C3), together with wider PFZ (50 nm in width for C1, 30 nm in width for C2 and 100 nm in width for C3).
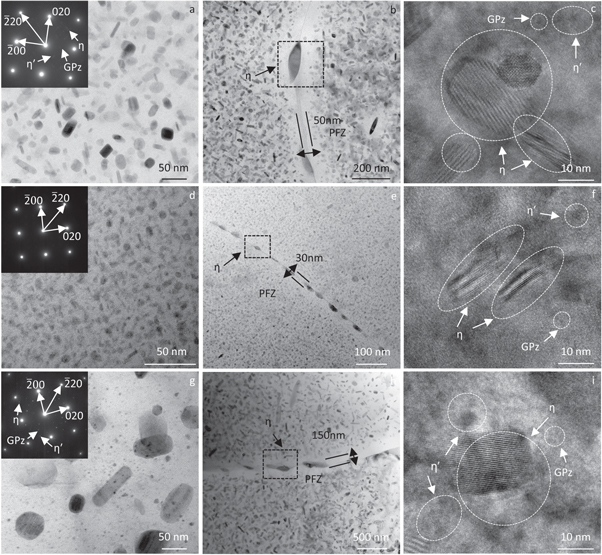
Figure 8. TEM micrographs of intragranular and intergranular precipitates and HRTEM image after the re-aging stage (a)–(c) axial direction (C1); (d)–(f) hoop direction (C2); (g)–(i) radial direction (C3).
Download figure:
Standard image High-resolution image4. Discussion
4.1. Precipitation evolution law in RRA process
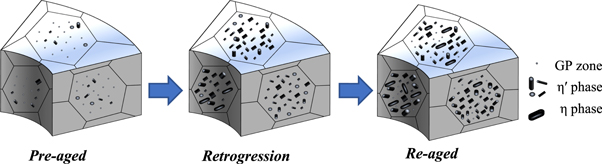
According to the above results, the evolution rule of intragranular precipitates along the axial, hoop and radial directions of the alloy during RRA process can be summarized as shown in figure 9. (i) At the pre-aging stage (figure 9(a)), there was significant difference in the size and distribution of intragranular precipitates. The density of intragranular precipitates (GP zone and η' phase) in radial sample is remarkable smaller than the other two samples, while the size presentes the opposite rule. (ii) At the retrogression treatment (figure 9(b)), the density of intragranular precipitates (η' phase) in samples along the three directions of the alloy is larger than those samples at pre-aged and the size inhomogeneity is smaller than pre-aged samples. As for the axial and hoop samples, the GP zones re-dissolve into the matrix and some of η' phases continue growing are the main precipitation characteristics. In addition to the above characteristics, As for the radial sample, there are also part of η' phase coarsening and transformation to η phase. (iii) At the re-aging stage (figure 9(c)), a small amount of GP zones and η' phases re-precipitate again in the intragranular, the intragranular η' and η phases become coarser and consumes a lot of solutes. As for radial sample, the intragranular η' phases is more coarser than those along other directions.
Figure 9. Schematic diagram of precipitation evolution in RRA process.
Download figure:
Standard image High-resolution image
4.2. Analysis of anisotropy in RRA process
For the yield strength of 7xxx aluminum alloy, we can calculate the theoretical contribution value by strengthening equations such as grain boundary strengthening, dislocation strengthening and precipitation strengthening. In this section, we analyzes the causes of the generation and reduction of yield strength anisotropy by comparing the yeild strength increment contribution of these strengthening mechanisms in the samples along different directions of the ring forging.
4.3. Analysis of anisotropy in RRA process
4.3.1. Grain boundary strengthening
Hall-Petch equation can well describe grain boundary strengthening, and HAGBs strengthening contribution can be described by [23]:

And the contribution from LAGBs follows the equation:

Where ρ0
is the dislocation density between boundaries, due to it has little strengthening effect, so it should not be taken into account, b is the Burgers vector (0.286 nm for fcc Al)[24] , f is the total number fraction of HAGBs, α is a constant (=0.2 for Al alloy) [10, 25, 26]. The  LAGB was the average value of misorientation distribution of the LAGBs calculated from HKL Channel 5 software and
  is the average grain diameter, kH−P
is the Hall-Petch constant about 0.04 MPa m−1/2. The contribution values of HAGBs strengthening and LAGBs strengthening to yield strength are calculated as shown in table 3. It can be seen that as for pre-aged samples, the contribution value of HAGBs strengthening to yield strength in samples is basically the same in samples A1, A2 and A3, and the same result is reflected in the HAGBs strengthening. It indicates that the contribution difference of grain boundary strengthening to the yield strength between the samples in pre-aged (along axial, along hoop and along radial) is negligible basically. In other words, grain boundary strengthening is not the main factor causing the yeild strength anisotropy of the alloy after the pre-aging stage.
is the average grain diameter, kH−P
is the Hall-Petch constant about 0.04 MPa m−1/2. The contribution values of HAGBs strengthening and LAGBs strengthening to yield strength are calculated as shown in table 3. It can be seen that as for pre-aged samples, the contribution value of HAGBs strengthening to yield strength in samples is basically the same in samples A1, A2 and A3, and the same result is reflected in the HAGBs strengthening. It indicates that the contribution difference of grain boundary strengthening to the yield strength between the samples in pre-aged (along axial, along hoop and along radial) is negligible basically. In other words, grain boundary strengthening is not the main factor causing the yeild strength anisotropy of the alloy after the pre-aging stage.
Table 3. The yield strength of grain boundaries contribution after pre-aging.
| Sample | Direction | σHAGB/MPa | σLAGB/MPa |
|---|---|---|---|
| A1 | axial | 9 | 15 |
| A2 | hoop | 9 | 16 |
| A3 | radial | 7 | 17 |
4.3.2. Dislocation strengthening
The strength increment due to dislocation strengthening can be calculated using the Bailey-Hirsch equation[24, 27]:

The dislocation density of intragranular can be calculated by the modified Williamson hall model [28, 29]:

Where ρ is the dislocation density of the intragranular, ΔK = βcos θ/λ, K = 2 sin θ/λ, β is the true full width at half maximum of the diffraction peaks in radians, D is the weight-averaged crystalline size, θ is the diffraction angle, λ is the x-ray wavelength (0.15406 nm),  [30], and
 is the elastic constant of the material, which is 0.304 for 7050 Al alloy, and q is a parameter related to edge dislocation and screw dislocation, which is about 2; H2 is a constant that is a function of the (hkl) reflection, which can be calculated by:[31]
As for pre-aged samples, the yield strength increment due to dislocations strengthening contribution and the dislocation density are listed in table 4. It shows that the contribution difference of dislocation strengthening to the yield strength between the samples in pre-aged (along axial, along hoop and along radial) is negligible basically, so the yeild strength anisotropy caused by dislocation strengthening can be ignored after pre-aging stage.
Table 4. Dislocation density and strengthening contribution due to dislocation after pre-aging.
| Sample | Direction | ρ/1012/m−2 | σdis/MPa |
|---|---|---|---|
| A1 | axial | 15.6 | 18 |
| A2 | hoop | 16.1 | 18 |
| A3 | radial | 7.4 | 12 |
4.3.3. Precipitation strengthening
For the high-strength aluminum alloys such as 7050 alloy, when the size of precipitates is relatively large, the dislocation mainly bypasses the precipitates by Orowan mechanism, the yield strength increment due to the precipitation strengthening can be described by [32, 33]:

Where M is the Taylor factor (3.06 for fcc metals) [34], G is the shear modulus, which is 26.9 GPa for 7050 Al allo, v is Poisson's ratio which is 0.33 for the Al 7050 and λp is the edge-to-edge inter-precipitate distance ( ), r and f are the mean precipitate radius and the volume fraction of precipitates, respectively.
The dislocations are required to either shear the precipitates when the precipitates are mainly GP zone and smaller size of η' phase, then the yield strength increment due to the precipitation strengthening can be described as [35]:

Where A is the constant = (equation (3)), δ is the diameter of precipitates; and r0
is the dislocation core radius, which is 6 Å.
(equation (3)), δ is the diameter of precipitates; and r0
is the dislocation core radius, which is 6 Å.
As for samples A1 and A2, the size of intragranular precipitates is relatively small, so the yield strength increment can be calculated by equation (2), and in sample A3, the size of intragranular precipitates is large so the yield strength increment can be calculated by equation (1). Table 5 lists the yield strength increment due to precipitation strengthening in three pre-aged samples. As for samples A1, A2 and A3, the yield strength increment are 389 MPa, 407 MPa and 334 MPa, respectively, which is consistent same rule with the result measured by tensile test. After the pre-aging stage, the size of GP zone and η' phase in samples A1 and A2 are significantly smaller than that in sample A3 (the density of intragranular precipitates is smaller than A3), indicating that the ring forging is easier to precipitate along the axial and hoop directions during pre-aging state. At the pre-aging state, the contribution of precipitation strengthening along alloy axial and hoop directions (samples A1 and A2) is greater than that along alloy radial (sample A3), which makes the yield strength anisotropy more obvious.
Table 5. Precipitation characteristics and strengthening contribution values in three directions after pre-ageing.
| Sample | Direction | r/nm | f/% | σp /MPa |
|---|---|---|---|---|
| A1 | axial | 1 ∼ 6 | 13.6 | 389 |
| A2 | hoop | 1 ∼ 6 | 13.5 | 407 |
| A3 | radial | 15 ∼ 20 | 12.8 | 334 |
Considering the yeild strength contribution due to grain boundary strengthening, dislocation strengthening and precipitation strengthening, it can be found that the size and distribution inhomogeneity of intragranular precipitates is the main cause of yield strength anisotropy.
4.4. Analysis of anisotropy after retrogression and re-aging treatment
From pre-aging to regression, the increase of yield strength of samples (B1, B2 and B3) is due to the accelerated diffusion of solute with the increase of temperature, during retrogression treatment, the change of density of intragranular precipitates is much faster than that during pre-aging. In addition, low-temperature pre-aging treatment has a great impact on the precipitation size, distribution and density in the subsequent high-temperature regression process, which is conducive to the formation of precipitation in the high-temperature regression process [36], As for samples B1, B2 and B3, the yield strength remarkably enhanced than pre-aged samples (A1, A2 and A3), which is caused by the inceease of density of intragranular η' phase and it enhenced the precipitation strengthening effect. As for sample B3, the intragranular η' phases become coarser than samples B1 and B2, and so it's yield strength was lower than samples B1 and B2.
During heat treatment, the type, size, density and distribution of precipitates and the coherence degree of precipitates with the matrix will affect the anisotropic properties of the alloy. During pre-aging stage, as for the samples A1, A2 and A3, there are great differences in nucleation and growth of intragranular precipitates, it causes the size and distribution of precipitates in different samples to be anisotropic. From pre-aging to retrogression treatment, the density of η' phase is significantly increased in retrogression samples, it reduces the size and distribution anisotropy of intragranular precipitates. This reduces the inhomogeneity for the contribution of precipitation strengthening to the yield strength of the alloy in different directions. The interaction between precipitates and dislocation motion will affect the anisotropy of aluminum alloy [23]. According to previous reports, during heat treatment, with the increase of the precipitate number, the finer the size and the more uniform the distribution, the more obvious the obstruction of dislocation movement [37, 38]. After the pre-aging stage, the density of GP zone and η' phase in samples A1 and A2 is larger than sample A3, however, the size of intragranular precipitates has the opposite rule. As for the samples A1 and A2, the obstruction effect of precipitate relative to dislocation is stronger than sample A3 when the they are stretched, and the weak obstruction effect leads the lower yield strength of sample A3. The uneven distribution of precipitates is improved at retrogression treatment, it reduces the yield strength anisotropy of samples (B1, B2 and B3). The precipitation direction of precipitates is consistent with the main texture orientation, which can reduce the anisotropy of the alloy. The inertial plane of the η' phase is (111) Al, and the orientation relationship with the matrix is: (0001) η'//(111)Al and [1010] η'//[011]Al [39].〈111〉 orientation is the main texture orientation of aluminum alloy under different heat treatment states [40], which is consistent with the precipitation direction of η' phase. The content of η' phase increases with the process of retrogression heat treatment, it significantly reduces tensile yield strength anisotropy of samples. The coherence between precipitates and Al matrix also affects the yield strength anisotropy, the η' phase is semi-coherent with the Al matrix, the yeild strength anisotropy of alloy also reduces due to the increase of to the density of η' phase after the retrogression stage.
As for samples C1, C2 and C3, the yield strength increment due to the precipitation strengthening is listed in table 6, The yield strength increment of samples C1, C2 and C3 are 429 MPa, 416 MPa, and 389 MPa, respectively, it can be found that the three yield strength increment are relatively close, which is consistent same rule with the result measured by tensile test. During re-aging process, the η' phases become much coarser and some of them are transformed to η phase, which increases the percentage of η phase, the η precipitates at GBs become coarser and the PFZs are broadened in width [41], all the precipitation character result the decrease of yeild strength in varying degrees in re-aged samples. The further reduction of the yield strength anisotropy of the of alloy can be explained by the joint action of re-precipitation and precipitate growth. During the retrogression treatment, the GP zones re-dissolve into the matrix, after the re-aging stage, the GP zones and η' phases re-precipitate again and the distribution of intragranular precipitates becomes more homogeneous. In addition, the discontinuous distribution of GBPs can inhibit the propagation of crack sources at grain boundary, which can improve the mechanical property anisotropy of the alloy [40]. After re-aging treatment stage, the discontinuous distribution of GBPs of three samples (C1,C2 abd C3) are obvious, so the yield strength anisotropy is further reduced.
Table 6. Precipitation characteristics and strengthening contribution values in three directions after re-ageing.
| Sample | Direction | r/nm | f/% | σp/MPa |
|---|---|---|---|---|
| C1 | axial | 16.6 | 38.0 | 429 |
| C2 | hoop | 14.5 | 35.1 | 416 |
| C3 | radial | 20.5 | 39.3 | 389 |
5. Conclusions
Through the yeild strength tests and microstructure observations of the 7050 Al alloy ring forging in different directions at different heat treatment states in RRA process, the factors of the yeild strength anisotropy of the alloy were analyzed, and the influence mechanism of RRA process on the anisotropy of the alloy was revealed. The main conclusions are as follows:
- (1)After the pre-aging stage, the yield strength of ring forging along axial, hoop and radial directions shows obvious anisotropy. After regression and re-aging stage, the yield strength of forgings along three directions first increases and then decreases, and the yield strength anisotropy gradually decreases in the RRA process.
- (2)After the pre-aging stage, the intragranular precipitates along the axial, hoop and radial directions of the alloy are GP zones and η' phases, the size of the precipitates along radial direction is larger than those along other directions, while the size presentes the opposite rule, and there is no intergranular η phase can be observed clearly in hoop and radial samples; After the retrogression stage, the GP zones re-dissolve into the Al matrix and some of η' phases continue growing are the main precipitation characteristics, the continuous η precipitates at GBs become coarser, together with a narrow PFZ; After the re-aging stage, a small amount of GP zones and η' phases re-precipitate again in the intragranular. the intragranular η' and η phases become coarser, the η phases at GBs become much coarser and discontinuous and the PFZs are broadened in width.
- (3)The precipitation strengthening effect of the forging along the axial and hoop is stronger than that along the radial., which causes the large yield strength anisotropy after the pre-aging stage. The decrease of the size and distribution anisotropy of intragranular precipitates causes the reduction of yield strength anisotropy in the retrogression samples; The homogeneous distribution of intergranular precipitates and the discontinuous GBPs further reduce the yield strength anisotropy in the re-aged samples.
Data availability statement
The data that support the findings of this study are available upon reasonable request from the authors.