

Abstract
Instrumental records indicate a century-long trend towards drying over western North America and wetting over eastern North America. A continuation of these trends into the future would have significant hydroclimatic and socioeconomic consequences in both the semi-arid Southwest and humid East. Using tree-ring reconstructions and hydrologic simulations of summer soil moisture, we evaluate and contextualize the modern summer aridity gradient within its natural range of variability established over the past 600 years and evaluate the effects of observed and anthropogenic precipitation, temperature, and humidity trends. The 2001–2020 positive (wet east-dry west) aridity gradient was larger than any 20 year period since 1400 CE, preceded by the most negative (wet west-dry east) aridity gradient during 1976–1995, leading to a strong multi-decade reversal in aridity gradient anomalies that was rivaled only by a similar event in the late-16th century. The 2001–2020 aridity gradient was dominated by long-term summer precipitation increases in the Midwest and Northeast, with smaller contributions from more warming in the West than the East and spring precipitation decreases in the Southwest. Multi-model mean climate simulations from Coupled Model Intercomparison Project 6 experiments suggest anthropogenic climate trends should not have strongly affected the aridity gradient thus far. However, there is high uncertainty due to inter-model disagreement on anthropogenic precipitation trends. The recent strengthening of the observed aridity gradient, its increasing dependence on precipitation variability, and disagreement in modeled anthropogenic precipitation trends reveal significant uncertainties in how water resource availability will change across North America in the coming decades.
Export citation and abstract BibTeX RIS
1. Introduction
Global climate change is projected to exacerbate drought severity and extent (Cook et al 2020) and increase precipitation extremes through the 21st century (Singh et al 2013). In North America, extreme precipitation and drought risk have increased in many regions and are projected to increase in response to anthropogenic climate change through the 21st century (Seager 2007b, Williams 2013, Cook et al 2014, 2015, Bishop et al 2019a). Anthropogenic warming has likely exacerbated western drought severity and contributed to one of the most severe droughts in southwestern North America in 1200+ years (Williams et al 2020).
In sharp contrast, eastern North America experienced positive precipitation and reduced warming trends over the past century (Hartmann 2013, Easterling 2017, Mascioli et al 2017). Increased precipitation has been linked to midlatitude Rossby wave patterns in the Northeast (Seager et al 2012), the North Atlantic Subtropical High (NASH) in the Southeast (Li et al 2012), and land use change and the Great Plains low-level jet in the Midwest and Northern Plains (Barandiaran et al 2013, Mueller et al 2016). Cooling or reduced warming trends in the Southeast and Midwest have been linked to land use change (Mueller et al 2016, Nikiel and Eltahir 2019), natural climate variability (Partridge 2018), aerosol emissions (Leibensperger 2012, Yu 2014, Mascioli et al 2017), and evaporative cooling from increased precipitation and reforestation (Pan et al 2004, Portmann et al 2009, Zhang 2020). Regardless of the origin, the combined increases in precipitation and reduced warming have increased soil moisture in eastern North America.
Eastern wetting and western drying have strengthened the east-west North American soil moisture gradient during a period of enhanced global anthropogenic warming with far-reaching impacts. The yield, spatial distribution, and type of cropland and natural vegetation are particularly vulnerable to soil moisture and drought variability (Wang 2014, Seager et al 2018a). Precipitation and moisture transport are affected by upwind soil moisture availability, which impacts drought propagation (or reversal) in adjacent regions (Seneviratne et al 2010, Herrera‐Estrada et al 2019). Soil moisture gradients also moderate regional climate through convection and tornadic activity (Lanicci et al 1987, Gensini and Brooks 2018) and large-scale circulation and storm tracks (Pal and Eltahir 2003, Zhou 2021). Sustained changes in the spatial gradient of soil moisture across North America therefore have the potential to alter the climatology and variability of these systems.
The aridity gradient was previously identified as a major mode of annual-to-decadal drought and circulation variability over North America since 900 CE (Woodhouse et al 2009). The divide of the humid east and arid west has persisted in North American climatology and is often stated to be near the 100th meridian. The divide has experienced shifts during the early-to-mid Holocene (Webb et al 1983, Baker et al 2002) and is projected to shift east by the late-21st century in response to anthropogenic increases in evaporative demand, although the strength of the aridity gradient is projected to weaken (Seager et al 2018a, 2018b).
Tree-ring reconstructions of drought and soil moisture across North America have been used to evaluate and contextualize observed and projected extremes in drought and pluvial events (e.g. Touchan et al 2008, Cook et al 2010, Woodhouse et al 2010, Pederson et al 2013, Cook et al 2016a, 2016b, Williams et al 2020), including studies that have found the recent pluvial to be the largest in at least 400–500 years in the Midwest and Northeast US (Pederson et al 2013, Ford 2014, Maxwell and Harley 2017). No studies, however, have contextualized the recent intensification of the aridity gradient. Here, we (a) evaluate and contextualize the spatial characteristics and physical mechanisms of the modern summer (JJA) aridity gradient within its natural range of climate variability using a tree-ring reconstruction of soil moisture anomalies over central North America, and (b) decompose the effects of observed and anthropogenic climate variability on the recent intensification of the aridity gradient. Through this analysis, we gain a better understanding of what mechanisms drive the aridity gradient outside of its natural range of variability, which is critical to disentangle how trends in natural low-frequency and anthropogenic climate change will impact future North American hydroclimate trends.
2. Materials and methods
2.1. Climate and soil moisture data
We used monthly 1/4° grids of 1901–2020 total precipitation (summed over all days), mean daily maximum (Tmax) and minimum temperatures (Tmin), relative humidity, wind speed, and solar and longwave radiation from a variety of climate data products. The methods used to develop these datasets are detailed in Williams et al (2017) and Williams et al (2020). Observations of long-term, spatially continuous soil moisture do not exist, so we incorporated an updated record of modeled gridded (1/4°) monthly 1901–2020 soil moisture anomalies from Williams et al (2020). The model was forced by the monthly climate data described above and calibrated to optimize agreement with monthly mean 0–200 cm soil moisture plus snow water equivalent as simulated by the Noah land-surface community model (Ek 2003). To avoid the effects of recent anthropogenic trends on baseline estimates, modeled soil moisture and climate data were standardized relative to 1910–1960 climatological means and variances.
2.2. Tree-ring reconstruction of summer soil moisture
We produced gridded (1°) summer (JJA) soil moisture reconstructions across central North America (24–50°N, 66–130°W), which included the contiguous United States, northern Mexico and southeastern Canada, using a network of 2800 chronologies of tree-ring width index values standardized to preserve low-to-medium frequency variability (Melvin and Briffa 2008), predominantly accessed from the International Tree-Ring Databank (www.ncdc.noaa.gov/paleo/treering.html). The tree-ring dataset is an updated version of that used by Stahle et al (2020).
We reconstructed gridded records of standardized JJA 0–200 cm soil moisture anomalies (SMz) using the standard point-by-point nested reconstruction methods used to develop the North American Drought Atlas (Cook et al 1999, 2004, 2010). The SMz data are updated from Williams et al (2020). We produced our own gridded soil-moisture reconstruction rather than the North American Drought Atlas to facilitate comparisons to idealized soil-moisture calculations covering the observational interval described in sections 2.3 and 2.4. Following Williams et al (2020) and Williams et al (2021), we produced an ensemble of reconstructions using varying calibration periods (1901–1978, −1983, −1990, −2000), search radii (50, 100, 150, 200, 300, 400, 500 km), spatial smoothing (1, 3, 5 degrees smoothing), and minimum chronology length (1850-, 1800-, 1750-, 1700-, 1650-, 1600–1978). Reconstruction models were cross-validated using an iterative leave-a-decade out approach (see Williams et al 2020, Bolles et al 2021 for methods), correlating out-of-sample reconstruction time series against the target time series (cross-validated R2).
Following Williams et al (2021), alternate reconstructions then replaced the primary reconstruction (calibration period: 1901–1978, search radius: 150 km, spatial smoothing: 3 grid-cells, minimum chronology length: 1850–1978) when either (a) the corrected Akaike Information Criterion (AICC; Akaike 1974) decreased by at least two without reducing the cross-validated R2 or reconstruction length, or (b) the reconstruction length increased by at least 10 years without reducing R2 or increasing AICC. Maps of the reconstruction parameters are provided in figure S1 (available online at stacks.iop.org/ERL/16/114043/mmedia).
Regionally-averaged SMz reconstructions were calculated for eastern (eastern NA; 24–50°N, 66–100°W; eastern United States and southeastern Canada) and western North America (western NA; 24–50°N, 100–130°W; western United States and northern Mexico), omitting grid cells with R2 < 0.2. The reconstructions were then bias-corrected to match the calibration period variance of the target time series, as variances of regionally-averaged reconstructed time series can shift due to changes in available tree-ring records (Williams et al 2020). Next, regional observed and reconstructed SMz time series were standardized to the 1400–1960 mean and variance (calculated after replacing reconstructed values with observations during 1901–2020). The 'east-west North American aridity gradient' was calculated as eastern minus western NA SMz and is referred to as the 'aridity gradient' for the remainder of the paper. Positive aridity gradient values therefore represent years when SMz anomalies are more positive in eastern than in western NA and negative aridity gradient values represent the opposite. The location of the aridity gradient is dynamic and large historic shifts in the gradient's background mean location could reduce temporal variability in our calculations of east-west aridity differences. However, under a strong radiative forcing scenario, Seager et al (2018b) found the location of the aridity gradient to shift by approximately 2° longitude, small relative to the sizes of our eastern and western NA study regions. It is thus unlikely that our reconstruction of the aridity gradient's strength is strongly impacted by pre-observational shifts in the precise location of the east-west dividing line. Throughout the paper we focus on 20 year running means of regional SMz and the aridity gradient. The reasoning is that the 21st century has thus far been nearly continuously dry across much of western NA while, across much of the eastern NA, annual precipitation totals generally remained high following strong positive trends over the 20th century. As our observational climate data ended in 2020, this study focuses on 20 year running means specifically to compare the strong aridity gradient during 2001–2020 to all other observed and reconstructed 20 year periods.
2.3. Effects of observed climate variability on the aridity gradient
We considered the effects of observed variability in monthly precipitation, temperature, and relative humidity on the aridity gradient to account for the effects of evaporative demand and water limitations. We isolated the effect of potential evapotranspiration (PET; calculated as the Penman-Monteith reference evapotranspiration from Tmax, Tmin, solar radiation, relative humidity, and wind) and then the combined effects of temperature and humidity within PET on SMz as the change in SMz caused by allowing the variable of interest to vary and holding remaining variables at mean 1910–1960 climatology (e.g. Williams et al 2015). The precipitation effect was then isolated as the portion of SMz not attributed to PET.
The same approach was used to isolate the contributions of climate variables during specific seasons (Spring MAM, Summer JJA, Fall SON, Winter DJF). This leads to eight counterfactual seasonal records, where each season is assigned a recalculated version of precipitation or temperature and humidity. Temperature and humidity work together to affect evaporative demand. Contributions of all climate forcing variables to SMz were nearly additive, but nonlinearities prevent the contributions from being perfectly so. Seasonal contributions were therefore rescaled to sum to 100% of each annual contribution and annual contributions were rescaled to sum to the total SMz time series.
2.4. Effects of anthropogenic climate trends on the aridity gradient
We characterized the effects of modeled anthropogenic climate trends on the aridity gradient as the difference between the observed aridity gradient and a counterfactual time series calculated with climate data after removing simulated anthropogenic trends. We characterized anthropogenic climate trends as the multi-model mean trends in precipitation, temperature, and humidity as simulated by 29 models that participated in the sixth phase of the Coupled Model Intercomparison Project (CMIP6) (Eyring et al 2016). Following Williams et al (2020), modeled trends were assessed as 50 year low-pass filtered time series of temperature and humidity and 100 year low-pass filtered precipitation totals from 1850 to 2100, where 1850–2014 data come from the CMIP6 Historical experiment and 2015–2100 data come from tier 1 of the shared socioeconomic pathway 2–4.5 (SSP2-4.5; medium-forcing pathway of +4.5 W m−2) scenario from ScenarioMIP (O'Neill 2016). For precipitation, CMIP6 typically projects smaller anthropogenic trends relative to interdecadal variability, necessitating a longer filter. To reduce effects of outliers, monthly precipitation values were log-transformed prior to filtering. Next, low-pass filtered time series are converted to change since 1901. For precipitation, change since 1901 is calculated as fractional change (each month's filtered precipitation is divided by the filtered value in 1901). Time series of change since 1901 were then subtracted (divided for precipitation) away from the observed time series in order to calculate counterfactual realizations of the observed climate history absent of modeled climate trends. Modeled uncertainty in anthropogenic trends was characterized by the range of trends simulated among the 29 models. The 29 models considered were selected based on availability of monthly precipitation, temperatures, and relative humidity data for Historical and SSP2-4.5 experiments. This approach is described in detail in the supplementary materials of Williams et al (2020), although that study used CMIP5 simulations.
3. Results and discussion
3.1. Climate trends
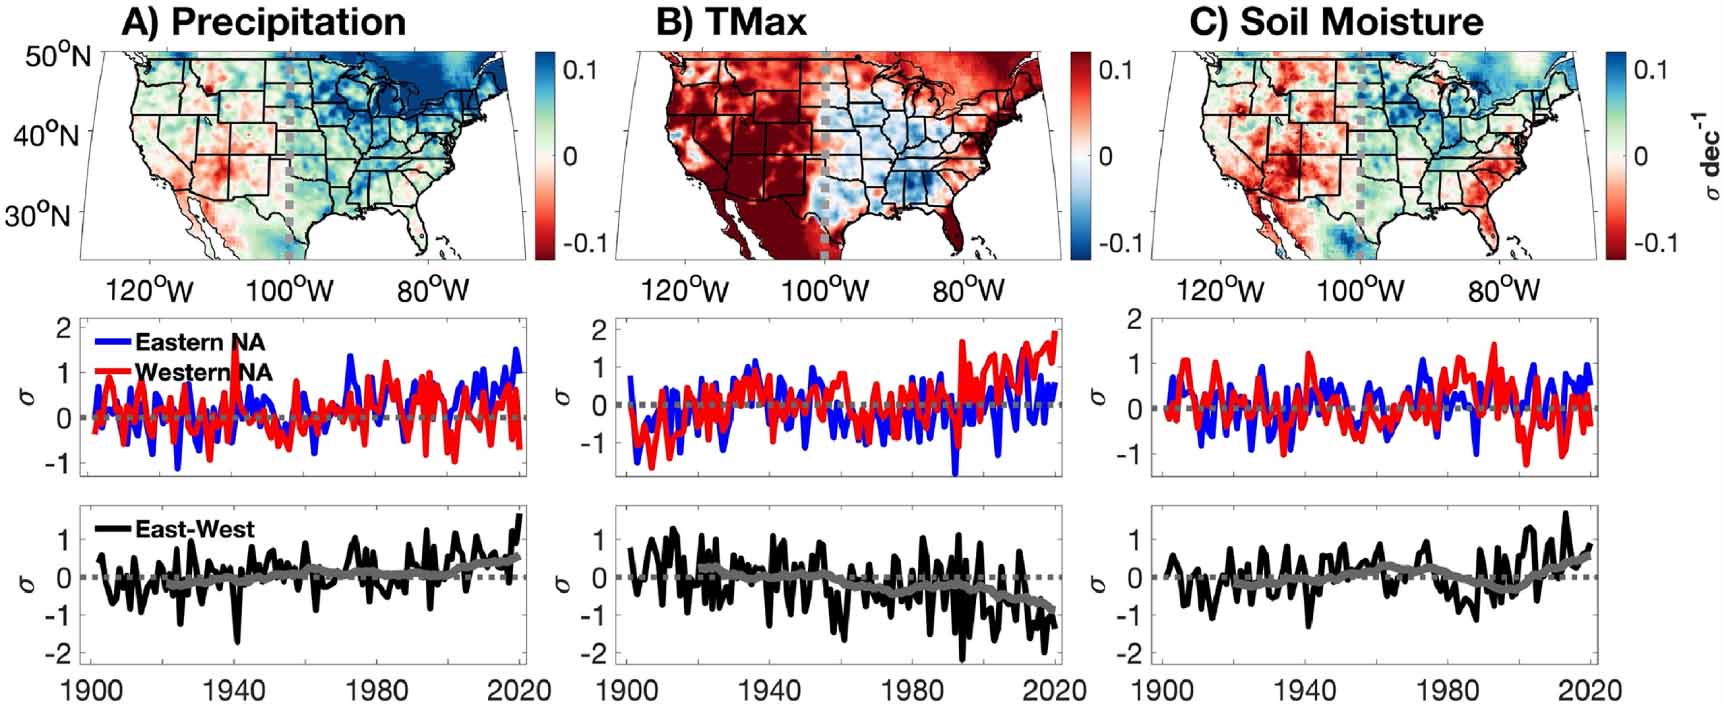
During 1901–2020, 97% of eastern NA land area experienced positive precipitation trends (59% significant; p < 0.05) while 45% of western NA experienced negative precipitation trends (3% significant) (figure 1(a)). For summer Tmax, 37% of eastern NA experienced cooling (8% significant), while 96% of western NA warmed (82% significant) (figure 1(b)). These trends led to a positive trend in the aridity gradient since 1901, with 78% and 64% of eastern and western NA experiencing positive and negative SMz trends (31% and 18% significant), respectively (figure 1(c)). The divergence in eastern versus western hydroclimatic trends has been particularly strong since the 1980s, leading to 2001–2020 being the largest 20 year period of positive aridity gradient in the observed record (figures 1(a)–(c)). These climate trends are consistent with numerous regional studies across North America (Seager et al 2012, Easterling 2017, Mascioli et al 2017, Williams et al 2017, 2020, Bishop et al 2019a, 2019b).
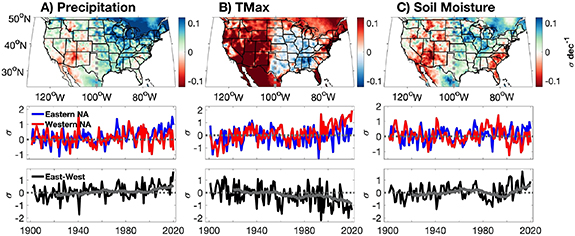
Figure 1. 1901–2020 standardized climate trends (top), regionally-averaged eastern (<100°W; eastern NA) and western North America (>100°W; western NA) time series (middle), and eastern minus western NA difference (east-west; bottom) in (a) Climgrid water year (prior year October—current year September) precipitation totals, (b) Climgrid summer (June—August) mean daily maximum temperature, and (c) Noah land-surface model-calibrated 0–200 cm summer soil moisture fraction. Dashed grey line in top panels: 100°W. Grey line in bottom panels: 20 year running mean assigned to final year in each 20 year window.
Download figure:
Standard image High-resolution image3.2. Tree-ring reconstruction of aridity gradient
The observed aridity gradient has a consistent east-west contrast in correlations with tree-ring width records across North America (figure 2(a)). This indicates the tree-ring network's potential to contextualize the recent strengthening of the aridity gradient. Reconstructions of gridded SMz were generally more skillful in the West than in the East and many grid cells in the Northeast and Midwest were disqualified (R2 < 0.2) (figure 2(b)). However, the gridded SMz reconstruction still overlaps with 85% of eastern NA land area that experienced 1901–2020 soil moisture increases (figure S2). Reconstructed western and eastern NA SMz (R2 = 0.79 and 0.67, respectively) and the aridity gradient (R2 = 0.68) were skillful back to 1400 CE (figure 2(c)).
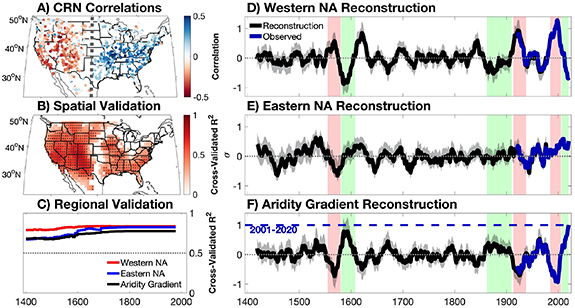
Figure 2. Summer east-west North American aridity gradient reconstruction. (a) Correlation between observed 1901–1978 observed aridity gradient and North American tree-ring network chronologies (CRN); (b) cross-validated reconstruction skill of gridded soil moisture reconstructions (R2; black dots: R2 ⩾ 0.4; white: R2 < 0.2 or reconstruction does not extend to 1400 CE); (c) time-resolved cross-validated R2 of reconstructions of the aridity gradient (black) and regionally averaged standardized anomalies of soil moisture in eastern (blue) and western (red) North America; and time series of reconstructed (black) and observed (blue) 20 year running-mean standardized anomalies of (d) western and (e) eastern North America soil moisture and (f) the aridity gradient. Gray shading in (d)–(f): 95% reconstruction confidence interval (see Williams et al 2020 for methods); pink and green shading in (d)–(f): most negative and positive aridity gradient extremes; blue dotted line in (f): 2001–2020 mean; running-mean values in (d)–(f) are assigned to the final year in each 20 year window.
Download figure:
Standard image High-resolution imageWe evaluated 20 year running means of reconstructions and observations of western NA SMz, eastern NA SMz, and the aridity gradient to contextualize the 2001–2020 extreme aridity gradient relative to the past six centuries. In western NA, there were four distinct multi-decade pluvial events during the early- and late-20th, early-17th, and mid-to-late 16th centuries, and three multi-decade drought events in the late-19th, late-16th to early-17th, and early-21st centuries (figure 2(d)). In eastern NA, multi-decadal variability was generally less pronounced than in the West, consistent with Herweijer et al (2007). The largest multi-decade swings in the east consisted of long-term drying in the mid-to-late 1500s, wetting in the late 1500s to early 1600s, and wetting in the 20th and early-21st centuries (figure 2(e)). Opposing SMz trends in eastern and western NA led to distinct peaks in the aridity gradient reconstruction, and the strongest positive (wet east, dry west) gradients occurred in 2001–2020, 1574–1593, and 1846–1865 (ordered from most to least positive). The strongest negative gradients (dry east, wet west) occurred in 1976–1995, 1549–1568, and 1906–1925 (ordered from most to least negative) (figure 2(f)). The latter period includes the noted North American pluvial centered in the west (Fye et al 2003, Woodhouse et al 2005, Cook et al 2011). Over the past few decades, the swing from the most negative aridity gradient of −0.91 σ in 1976–1995 to the most positive mean aridity gradient of +1.00 σ in 2001–2020 resulted in the most rapid aridity gradient reversal since 1400 CE (Δ = + 1.91 σ). This reversal was rivaled only by the late-1500s reversal (Δ = + 1.52 σ) from −0.73 σ in 1549–1568 to +0.79 σ in 1574–1593.
The 2001–2020 aridity gradient remained the most positive when we retained all gridded soil moisture reconstructions (including R2 < 0.2; figure S3). We repeated the reconstruction over longer and shorter time frames, finding the magnitude of the 2001–2020 positive aridity gradient is highest for the shortest reconstructions, as these reconstructions represent more of eastern NA that experienced 20th-century wetting and exclude higher-amplitude hydroclimatic swings of the Medieval period (figure S4).
The second-most positive aridity gradient in our reconstruction (1574–1593) coincided with the well-documented late-16th century megadrought in western North America (Stahle 2000, Cook et al 2018, Williams et al 2020) although the East was not as anomalously wet relative to 2001–2020 (figure 3(a)). Interestingly, the late 16th-century positive gradient immediately followed the second-most extreme negative aridity gradient in the reconstruction (1549–1568), similar to the record-breaking swing from 1976–1995 to 2001–2020 (figure 2(f)). But in the case of 1549–1568, the negative gradient was dominated by dry conditions in the eastern Great Plains (figure 3(b)). The third-highest positive and negative aridity gradients respectively occurred in the mid-19th and early-20th centuries. These events were promoted by the mid-19th century Civil War drought in the West (Herweijer et al 2006, 2007) and one of the wettest periods in the West on record (Fye et al 2003, Woodhouse et al 2005, Cook et al 2011), respectively (figures 3(c) and (d)). The most extreme aridity gradient magnitudes were influenced by the Southwest drought and the Midwest and Northern Plains pluvial during 2001–2020 and a late-20th century Southwest pluvial during 1976–1995 (figures 3(e) and (f)).
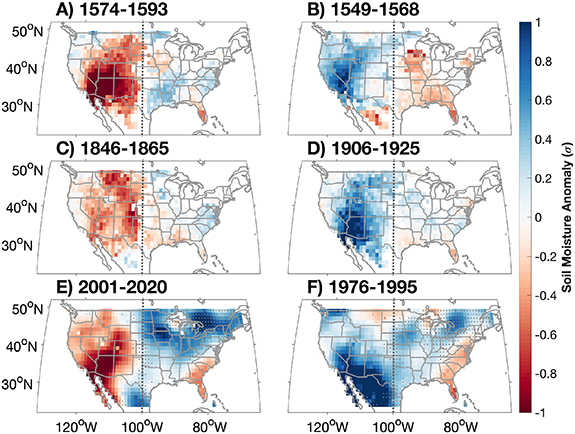
Figure 3. Maps of composite standardized soil moisture anomalies corresponding to the top 3 ranked 20 year positive (a), (c), (e) and negative (b), (d), (f) aridity gradient extremes since 1400: (a) 1574–1593, (b) 1549–1568, (c) 1846–1865, (d) 1906–1925, (e) 2001–2020, and (f) 1976–1995. Observed (model forced by observed climate) soil moisture used for (e) and (f), and dots indicate observed grid cells excluded from the reconstruction (R2 < 0.2).
Download figure:
Standard image High-resolution image3.3. Effects of observed and anthropogenic climate trends
The observed precipitation increase in the Midwest and Northeast was the main driver of the 2001–2020 aridity gradient extreme. Annual temperature and humidity (T + H), primarily in western NA, positively forced the aridity gradient (+12% effect relative to 2001–2020 aridity gradient magnitude) (figure 4(a)), but the annual precipitation forcing (+100%), mostly driven by positive eastern NA precipitation anomalies, accounted for the vast majority of the 2001–2020 aridity gradient anomaly (figure 4(b)). Given the strong negative SMz anomalies observed in the Southwest, we expected stronger roles for T + H on the 2001–2020 aridity gradient. The drying effects of T + H in the Midwest, however, dampened the effects of these variables on the aridity gradient while the drying effects of precipitation in the Southwest strengthened the aridity gradient (figures 4(a) and (b)). The >100% forcing from precipitation and T + H on the 2001–2020 aridity gradient was balanced by a −12% forcing from wind and solar radiation. While the T + H forcing was most positive during winter (+7%), the precipitation forcing was most positive during summer (+62%) and spring (+20%) (figures 4(c) and (d)), with weaker forcings (<11%) from the remaining seasonal contributions. The summer precipitation forcing resulted from long-term wetting in the Midwest and Northeast and some recent drying across the intermountain West (figure 4(e)).
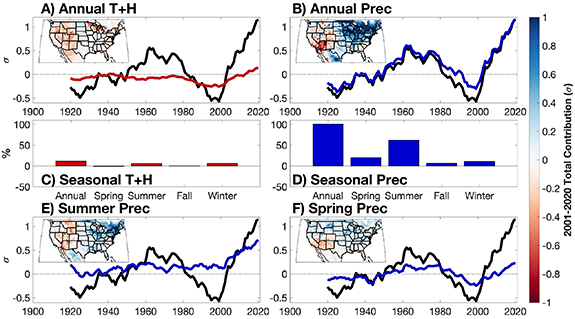
Figure 4. Effects of observed climate variability on the aridity gradient. Time series plots showing the 20 year running-mean observed aridity gradient (black lines) and contributions of observed climate (colored lines) since 1901, and inset maps showing climate contributions to 2001–2020 soil-moisture anomalies (a) and (b), (e) and (f). Effects of annual (a) temperature and humidity (T + H) and (b) precipitation (Prec), percent contribution of observed annual and seasonal climate variability (bars) to 2001–2020 aridity gradient magnitude for (c) temperature and humidity and (d) precipitation, and effects of (e) summer and (f) spring precipitation.
Download figure:
Standard image High-resolution imageTurning to the 1976–1995 negative aridity gradient, it received more balanced forcings from both annual T + H (−51%) and precipitation anomalies (−42%) (figures 4(a) and (b)), predominantly from above-average spring and winter precipitation across the West and negative spring T + H forcings in the Midwest, suggesting that climate anomalies in the West were more important in promoting the negative aridity gradient extreme of 1976–1995 than the positive extreme of 2001–2020. While both observed and reconstructed aridity gradient indices suggest SMz variability in the western NA was the primary driver of past aridity gradient extremes, the recent positive aridity gradient extreme was principally driven by a century-long increase in eastern precipitation.
The contribution of anthropogenic climate change was confounded by high inter-model uncertainty. CMIP6 ensemble-mean anthropogenic precipitation trends were simulated to account for 15% of the observed 2001–2020 aridity gradient anomaly, which was counteracted by a slight negative forcing of –2% from anthropogenic trends in T + H (figure 5(a)). That is, the multi-model mean precipitation increases positively forced SMz in the East more than in the West. Notably, there was considerable inter-model spread in the contribution of anthropogenic precipitation trends to the aridity gradient (figures 5(b) and (d)). Modeled effects of anthropogenic T + H trends were more consistent, with all models simulating a warming-driven drying effect across the study domain and 52% of models indicating a negative effect on the historical aridity gradient (figures 5(c) and (e)).
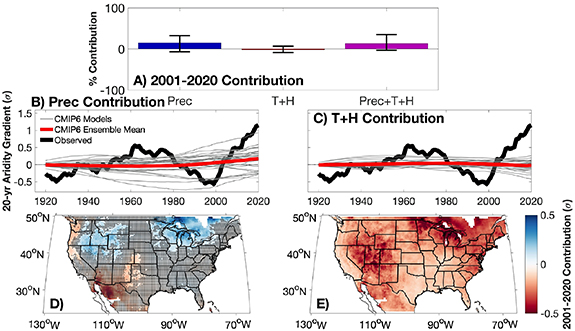
Figure 5. Effects of anthropogenic climate trends on the aridity gradient. (a) Percent contribution of CMIP6 multi-model mean to 2001–2020 aridity gradient anomalies (whiskers: model interquartile range); time series plots showing the 20 year running-mean observed aridity gradient (black lines) and CMIP6 contributions to observed aridity gradient anomalies (colored lines) since 1901 for annual (b) precipitation (Prec) and (c) temperature and humidity (T + H); and maps showing CMIP6 mean trend contributions to 2001–2020 soil-moisture anomalies for (d) precipitation and (e) temperature and humidity (stippling: <75% model agreement on sign).
Download figure:
Standard image High-resolution imageThe above results imply a large degree of uncertainty in the effect of anthropogenic climate trends on the aridity gradient to date. First, individual models exhibited a wide range of variability in terms of how anthropogenic climate change affects regional precipitation trends. Second, models consistently simulated more ubiquitous warming across North America than was observed. Both could indicate that the effect of anthropogenic climate trends on the aridity gradient are not accurately represented by CMIP6 climate models. It is also plausible, however, that the multi-model mean is an accurate representation of anthropogenic forcing and that the recent intensification of the aridity gradient was dominated by internal climate variability. Resolving uncertainties in modeled regional anthropogenic climate trends, especially precipitation trends, will be critical to understand the future evolution of the aridity gradient, improve annual-to-decadal prediction of regional-to-continental hydroclimate variability, and prepare the agricultural industry for shifts in soil moisture gradients over North America.
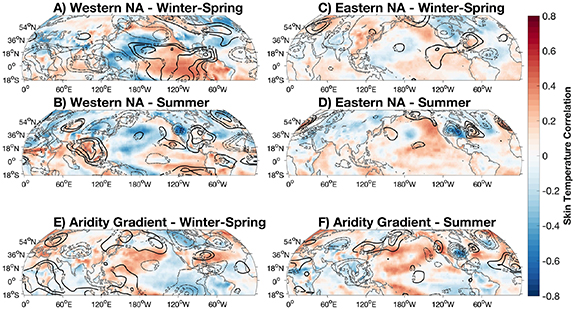
Last, to evaluate the impacts of atmospheric dynamics on aridity gradient variability, we calculated regional SMz and aridity gradient correlations with 1948–2020 National Center for Environmental Prediction and National Center for Atmospheric Research Reanalysis monthly 200 hPa geopotential height and skin temperature data (Kalnay 1996). Positive aridity gradients were associated with a winter-spring atmospheric wave train that sheltered the western NA from Pacific storms, likely linked to cool eastern tropical Pacific sea surface temperatures (figure 6). It is well-documented that 21st century drought conditions in western NA were associated with anomalously cool conditions in the tropical Pacific (Delworth et al 2015, Lehner et al 2018) and that similar conditions were likely responsible for some or all of the reconstructed western North American megadroughts of the last millennium (Seager et al 2007a, 2015, Huang and Xie 2015, Cook et al 2018, Steiger et al 2019, 2021).
Figure 6. 1948–2020 summer (June–August) SMz from western (a), (b) and eastern NA (c), (d), and summer aridity gradient (e), (f) correlations with NCEP-NCAR skin temperature (colors) and 200 hPa geopotential heights (contours) during preceding winter-spring (December–May; (a), (c), (e) and concurrent summer (b), (d), (f).
Download figure:
Standard image High-resolution image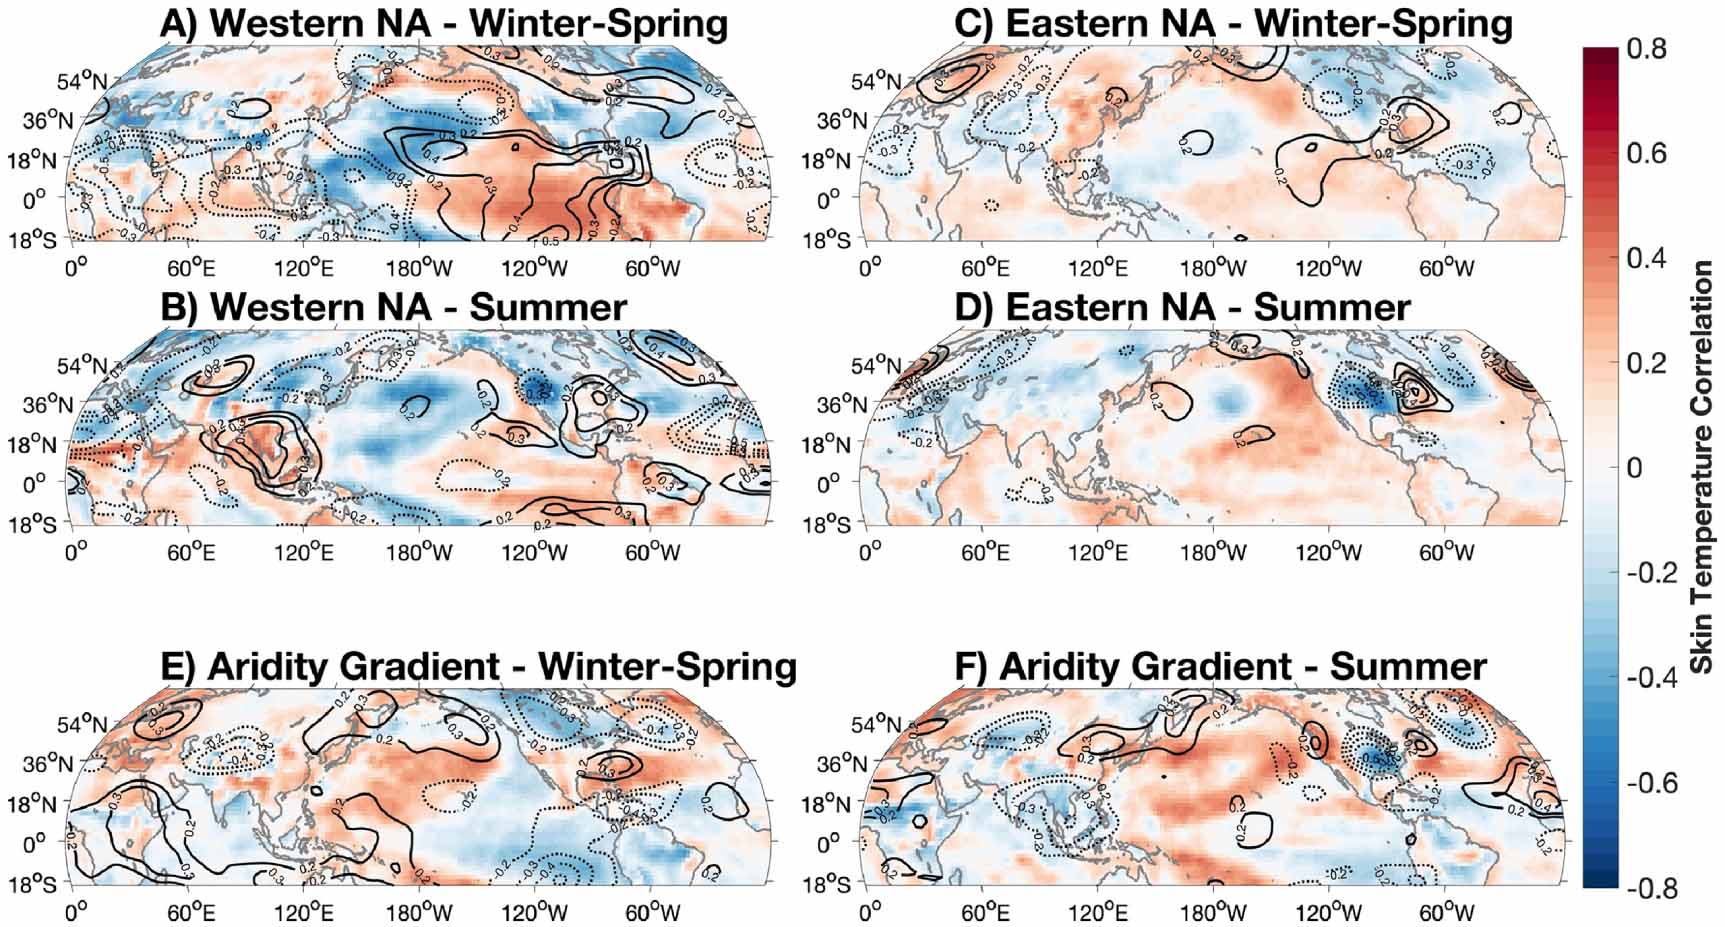
While western hydroclimatic variability was the dominant driver of decadal variability in the aridity gradient over the past 400 years, the exceptional 2001–2020 aridity gradient magnitude was exacerbated by increased summer precipitation in eastern NA. During the summer months, positive aridity gradients were associated with a midlatitude wave train over North America, which likely promoted increased storm track activity in the Great Plains and Southeast (figure 6). While past studies have dynamically linked eastern precipitation variability to the NASH and the Great Plains Low-Level Jet providing enhanced moisture transport from the Gulf of Mexico into eastern North America (Weaver and Nigam 2008, Seager et al 2012, Bishop et al 2019a), the results here do not establish a link between the NASH and the summer aridity gradient. Further research into recent trends in both Pacific and Atlantic teleconnections with North American hydroclimate will be needed to establish dynamic causes and accurately project future changes in this phenomenon, especially the long-term eastern precipitation trend. This work motivates further work to understand land-atmosphere interactions and the degree to which regional soil-moisture trends, or trends in soil-moisture gradients, may feedback to affect climate at regional-to-continental scales (e.g. Seneviratne et al 2010, Koster et al 2016).
4. Conclusions
Our tree-ring reconstructions of North American summer soil moisture anomalies provide a robust estimate of how the east-west North American aridity gradient has varied over the past six centuries and demonstrates that the 2001–2020 aridity gradient was very likely the most extreme 20 year gradient since at least 1400 CE. These reconstructions introduce a novel conceptual model for hydroclimate variability that could improve predictions of spatial and temporal variability in North American drought and floods. In the reconstruction, previous interdecadal variations in the aridity gradient closely followed western North American soil moisture variability, but the extreme gradient observed in recent decades, and ongoing as of fall 2021, was largely driven by a century-long increase in eastern North American soil moisture. The ongoing extreme positive aridity gradient was immediately preceded by the most negative extreme gradient in the reconstructed record, making the transition from negative to positive decadal aridity gradient anomalies the most rapid in over 600 years. The 2001–2020 aridity gradient was largely driven by precipitation increases in eastern North America, particularly in summer, with minor additional effects from recent temperature and humidity increases and spring precipitation decreases in western North America. CMIP6 simulations suggest that anthropogenic climate trends were not major contributors to the 2001–2020 aridity gradient, though interpretation of anthropogenic climate effects is confounded by inter-model disagreement among regional anthropogenic precipitation trends and disagreement between observed and simulated temperature and humidity trends in the East.
Recent and potentially ongoing trends toward drying in western North America and wetting in eastern North America, and notable disagreements between observed hydroclimatic trends and those simulated by climate models to arise from anthropogenic forcing, especially in the East, underscore a concerning uncertainty in how human and natural systems will be impacted by changes in water supply through the 21st century (e.g. Frei et al 2002, Luce et al 2012, Pederson et al 2013). The fluctuating strength of the east-west North American aridity gradient has been a natural, multi-decadal mode of hydroclimate variability across North America for centuries (Woodhouse et al 2009) but its evolution and impacts through the late-21st century remain uncertain. Further research will be needed to identify the aridity gradient effects of large-scale circulation on pan-continental soil moisture gradients, the degree to which the east and west trends are dynamically related, and how the aridity gradient affects North American climate via land-atmosphere interactions. In addition to changes in the aridity gradient, models project aridification and a reduction in surface water availability across much of the continent largely due to warming (Mankin et al 2017, 2018, Seager et al 2018b), which could alter the strength and extent of the aridity gradient in the coming decades. The water resources and food security of tens of millions will be impacted by the hydroclimate trends investigated here, escalating the need to resolve the causes of and future changes in regional moisture availability.
Acknowledgments
This research was supported by the NASA Earth and Space Science Graduate Student Fellowship (80NSSC17K0402), the National Science Foundation (AGS-1703029 and AGS-1401400), and NOAA award NA17OAR4310126. MPR was supported by the NOAA Climate and Global Change Postdoctoral Fellowship Program, administered by UCAR's Cooperative Programs for the Advancement of Earth System Science (CPAESS) under Award #NA18NWS4620043B.
Data availability statement
The data that support the findings of this study are available upon reasonable request from the authors.