Performance of Earthworm-Enhanced Horizontal Sub-Surface Flow Filter and Constructed Wetland

1
School of Civil Engineering, Southeast University, Sipai Lou 2#, Nanjing 210096, China
2
Southeast University-Monash University Joint Research Centre for Water Sensitive Cities, Nanjing 210096, China
*
Author to whom correspondence should be addressed.
Water 2018, 10(10), 1309; https://doi.org/10.3390/w10101309
Submission received: 15 June 2018
/
Revised: 10 September 2018
/
Accepted: 17 September 2018
/
Published: 22 September 2018
(This article belongs to the Special Issue Sponge Cities: Emerging Approaches, Challenges and Opportunities)
Abstract
:In this study, the performance of the horizontal sub-surface flow filter (HSSFF) and constructed wetland (HSSFCW) experimental units enhanced with earthworms was investigated for the treatment of construction camp sewage wastewater. All the experimental units (filter and constructed wetland) were filled with the same filler except Eisenia foetida earthworms and Lolium perenne Linn plants. The performance of the earthworm-enhanced filter (EEF) and the earthworm-enhanced constructed wetland (EECW) was compared to that of the blank filter (BF) units. The results revealed that the removal efficiencies for chemical oxygen demand (COD), ammonium-nitrogen (NH4+-N), total nitrogen (TN) and total phosphorus (TP) in EEF were higher than the BF unit. In order to optimize the operating conditions, the experiments were conducted in three different water levels. The results revealed that the removal efficiencies of EEF for these pollutants are the highest in experimental conditions no. 2 (water level ~30 cm; HRT ~3 days; hydraulic load ~4.05 cm/day; and Inflow discharge ~0.27 L/h). Compared to the EEF and BF units, the EECW has higher removal efficiency for COD and TN and has more stable performance than the filters. This work will aid the design and improvement of filters and CWs for treatment of effluent wastewater from construction camps. The selection of appropriate hydraulic parameters and experimental conditions could be very beneficial in achieving the goal of implantation of low impact development (LID).
1. Introduction
With the increase in the investment and scale of China’s construction industry, the environmental impact, especially the impact of sewage discharged from construction camps, is attracting more and more attention. Since many construction camps are very far away from the municipal pipe network, it is very expensive to discharge sewage from construction camps into the municipal pipe network. Most of the sewage is discharged on the spot after simple treatment, which ultimately causes serious pollution to the surrounding water bodies. In general, the amount of sewage in construction camps varies with human activities and seasons. Its main pollutant index includes suspended solids (SS), COD and ammonium-nitrogen (NH4+-N). A filter is a biological treatment structure, which can be employed to remove pollutants from air and water [1]. It consists of a filler and biofilm on the surface of the filler, which integrates solid–liquid separation technology and biological treatment technology. The mechanism of the pollutant removal process in filters involves microbial metabolism filtration, adsorption and sedimentation of the matrix [2]. The filter system can be divided into two categories according to the flow style, including horizontal sub-surface flow filters and vertical sub-surface flow filters. It is usually used for the secondary treatment or advanced treatment of municipal sewage [3].
The removal efficiency of the filter depends on the growth and maintenance of microorganisms that are attached to the filler surface [1]. In addition, the type of filler also affects the efficiency. Various substrates, such as sand, soil, bark, charcoal and granular activated charcoal (CAC), have been used as the filler, which forms the biofilm attachment surface [4]. In the research of Kong et al., the performance of a filler mixed with crushed stone, zeolite and ceramsite was better than that of limestone, with the former removal efficiency of COD, NH4+-N, TN and TP being 74.10%, 94.14%, 73.57% and 69.53%, respectively [5]. Simultaneously, the effect is influenced by other factors, such as filtration rate, initial water quality, temperature and oxygen content in the system [6]. However, filters still have some limitations. First, if the back washing system is lacking, the matrix channel can be easily blocked by the organic matter that has not decomposed [7]. Secondly, because the medium chemisorption is the main mechanism for dephosphorization, filters may lose their phosphorus removal capability after working for 1 or 2 years as the adsorption capacity gradually depletes during operation [8,9]. Thus, how to strengthen the effect of filters has become an important research area.
In some earlier studies, researchers planted decontamination plants in filters to improve its efficiency, which creates an environment that is similar to constructed wetlands (CWs). The constructed wetland system is a unique ecological environment that consists of a packed bed, plants, organisms and microorganisms in the substrate, which has a certain length to width ratio and a ground line gradient. When the polluted water flows through the wetland, it can be purified efficiently through filtration, adsorption, sedimentation, ion exchange, plant uptake and microbial decomposition, etc. [10]. Kenatu et al. constructed three HSSFCWs (planted with Vetiveria zizanioide and Phragmites karka and one without plants) to investigate the performance of contaminant removal and their results showed that the removal rates in planted CWs were higher for all parameters than that in unplanted CW [11]. In order to further improve the sewage treatment effect, researchers introduced earthworms into the filter. It was reported that adding earthworms to the sludge treatment wetlands had a positive effect on sludge characteristics [12,13]. Xu et al. reported that earthworms can increase the above-ground biomass, enzyme activity, nitrification potentials and total number of bacteria [14]. In addition, it was reported that earthworms can effectively improve the matrix channel clogging conditions [15], thereby improving the hypoxic environment in the wetland system [16,17,18]. Vermicompost can improve soil structure, increase soil fertilizer, promote plant growth and promote the absorption of nitrogen, phosphorus and other organics [9,19,20,21]. However, earthworms in filters have yet been used to treat construction camp sewage wastewater.
Therefore, the objectives of the current study were to investigate the growth of earthworms in horizontal sub-surface flow filter (HSSFF) and the performance of earthworm-enhanced filter (EEF) for treating the wastewater released from construction camp under local conditions. In addition, the effect of various influencing factors, such as temperature, HRT and water level, were also investigated in this current study.
2. Material and Methods
2.1. Experimental Units
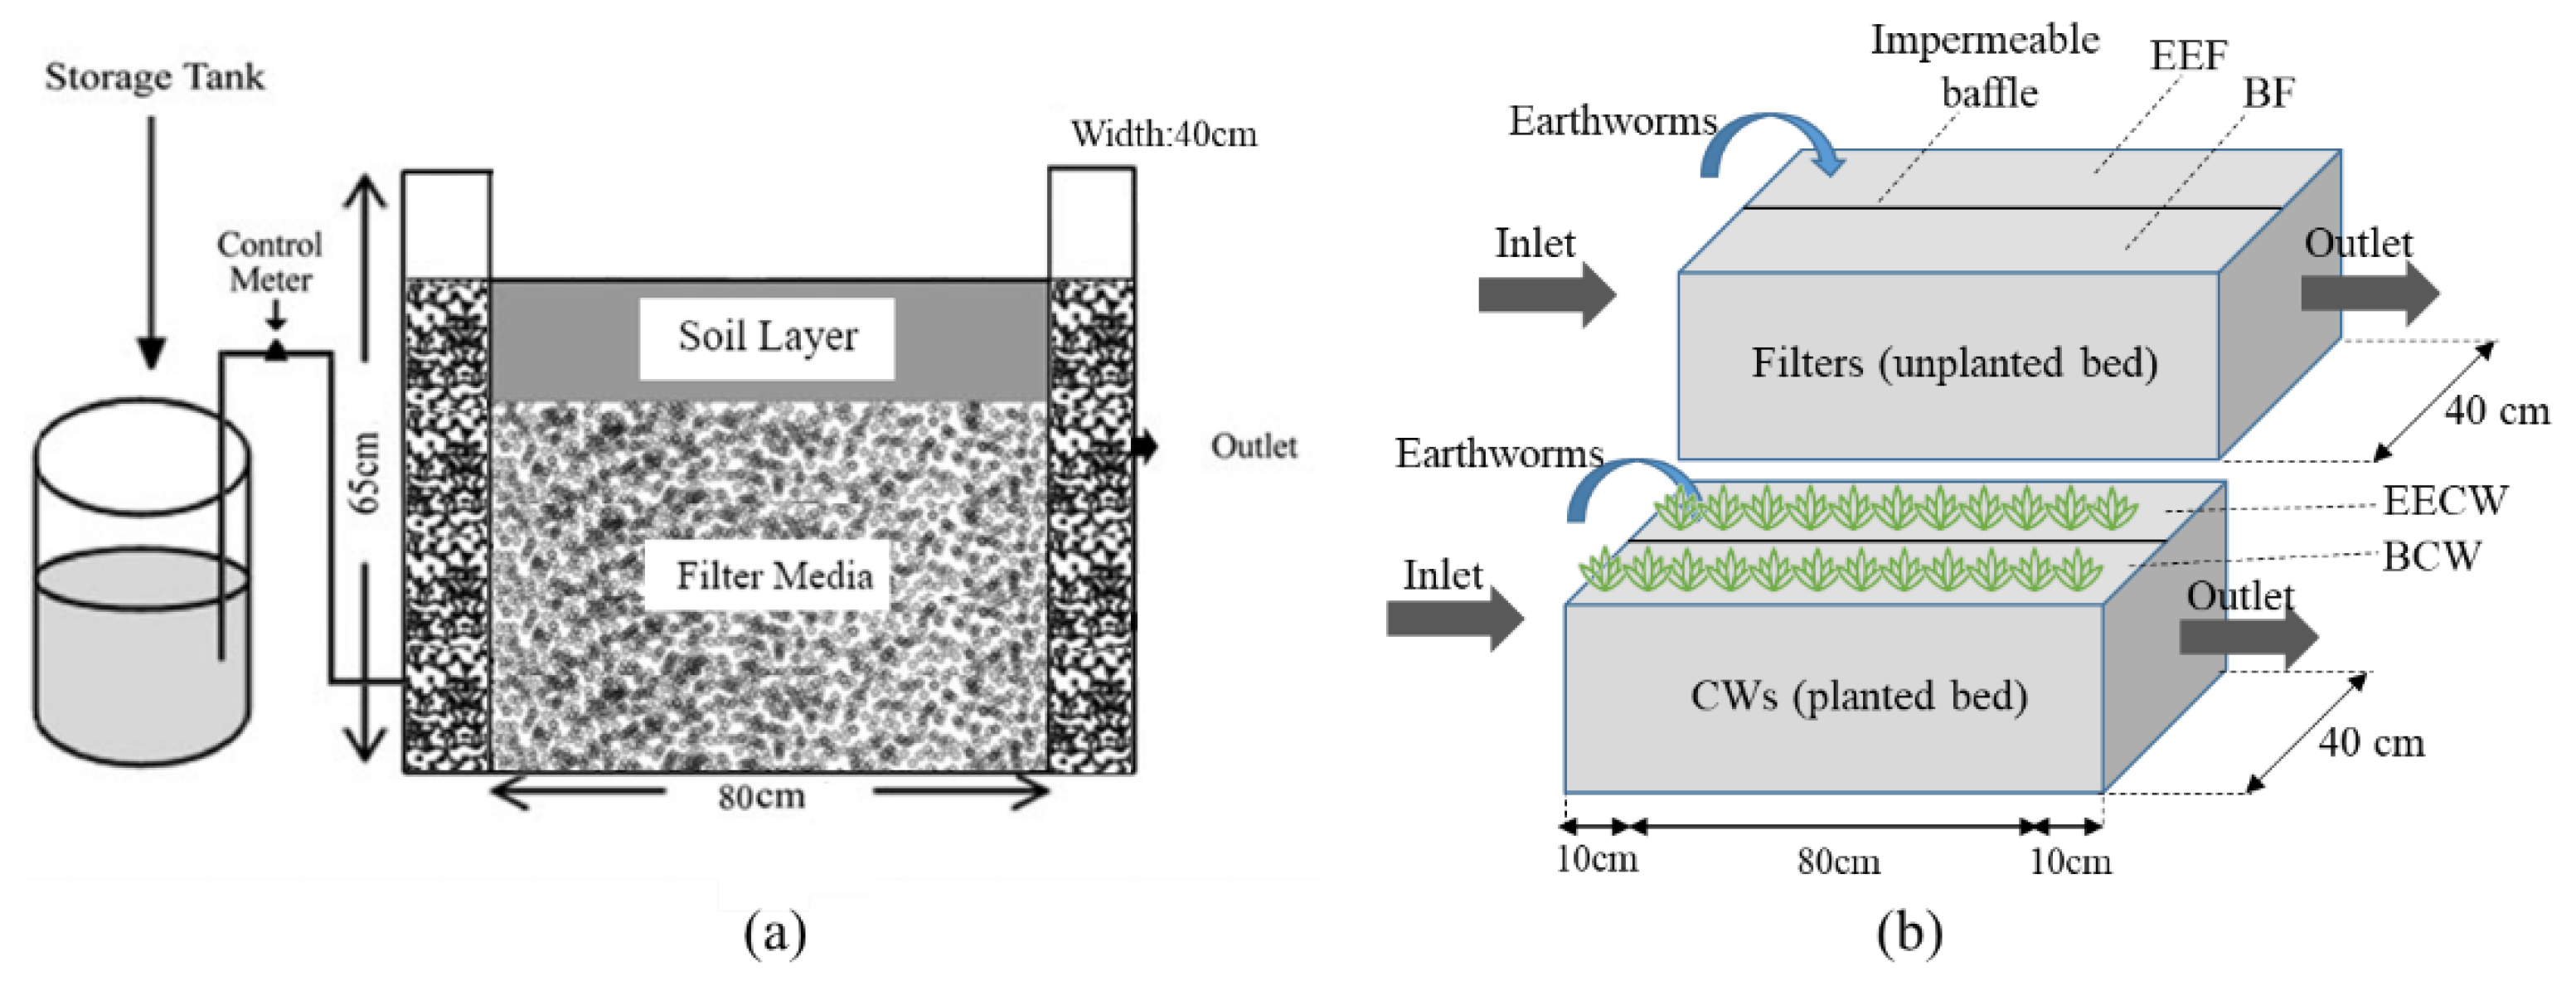
Experimental CW and filter units, which are referred as HSSFCW and HSSFF, were constructed in our Laboratory at “Southeast University-Monash University Joint Research Centre for Water Sensitive Cities,” located in Nanjing, China (Figure 1). The experimental device consists of a high water storage tank, water inlet, filter and water outlet. The experimental equipment was made of organic glass and the water pipes were made of polyvinyl chloride (PVC).
The size of the experimental device was as follows: 100 cm length, 40 cm width and 65 cm height. Filter units were divided into three parts: inlet area (10 cm), treatment area (80 cm) and outlet area (10 cm) in the current study. Therefore, the total length was 100 cm long, while the treatment area was 80 cm long. The device was divided longitudinally into two identical parts by an impermeable baffle. It can be considered that the two filters are mutually independent. The purpose of the baffle design was just to save lab space. Furthermore, the size of the experimental units for each side was as follows: 100 cm length, 20 cm width and 65 cm height. The treatment area of the experimental unit (matrix) was a surface soil layer with a height of 20 cm. The gravel layer had a height of 30 cm (gravel size approximately 1–2 cm diameter), which was placed below the soil layer. The device inlet and outlet were 10 cm long, which was filled with gravel (gravel size approximately 2–4 cm diameter). The CWs units were the same as filter units apart from being planted with Lolium perenne Linn plants (Figure 1b). According to the experimental measurements, the porosity of the matrix was 40%. The porosity was calculated by the following formula [22]:
where V0 represents the apparent volume (m3), the gravel volume plus the interspace volume; and V represents the absolute volume (m3), the gravel volume.
2.2. Earthworm Selection and Placement
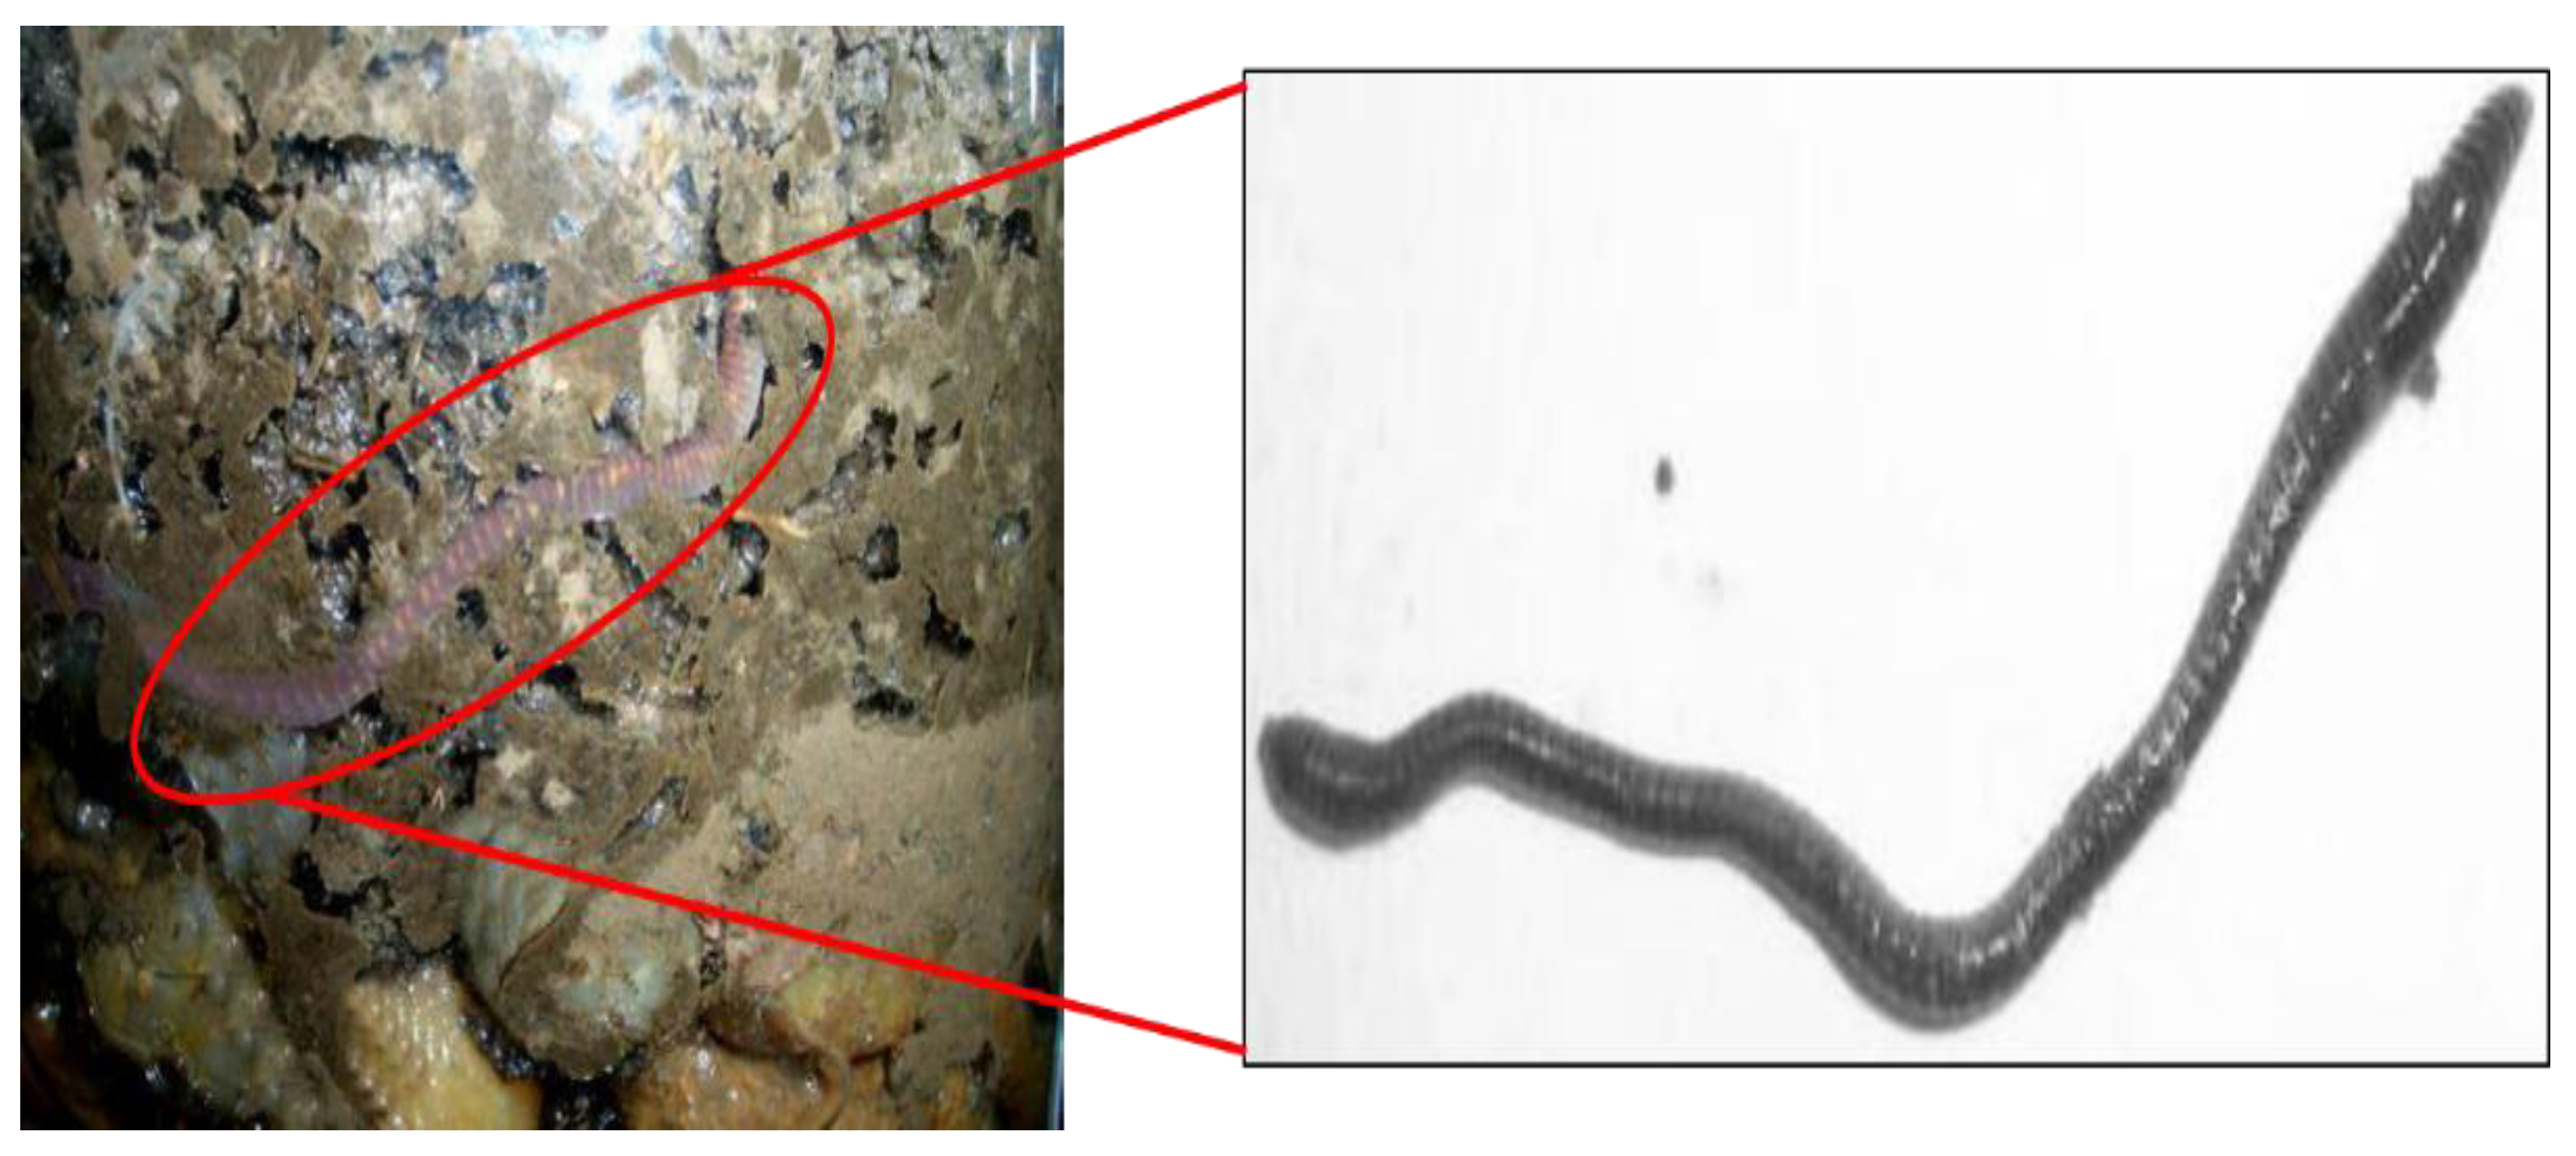
The earthworm species Eisenia foetida was selected for this current study (Figure 2). These earthworms were purchased from an earthworm farm located in Changlu town, Liuhe district, Nanjing, China. A total of 20 “Eisenia foetida” earthworms were placed in one HSSFF system, while the other system was a BF to explore the differences in the performance of ordinary filters and EEF. Similarly, 20 “Eisenia foetida” earthworms were placed in one HSSFCW system, while the other system was a BCW.
2.3. Chemicals and Experimental Water Quality
In this current study, synthetic water was used to simulate the sewage. The quality of wastewater released from construction camps was investigated before starting the experiment. The chemicals included analytical reagent (AR), glucose, starch, peptone, carbamide, MgSO4·7H2O, NaHCO3, CaCl2, FeSO4·7H2O, KH2PO4 and MnSO4·7H2O. These were all acquired from Sinopharm Chemical Reagent Beijing Co., Ltd. (Beijing, China) and were used for the synthesis of wastewater. The water distribution experimental scheme is listed in Table 1. In order to simulate the real situation, fluctuating concentrations of pollutants were set, which are listed in Table 2.
2.4. System Operation and Sampling
The experimental units of filter and CW systems were fed continuously with synthetic wastewater at the rate (0.27 L/h) that was equivalent to a 3-day hydraulic retention time (HRT). The HRT was calculated by the following formula [22]:
where represents the effective porosity of media (% as a decimal); L represents the length of bed (cm); W represents the width of bed (cm); D represents the average depth of water in bed (cm); and Q represents the inflow discharge (cm3/day).
Water levels are an important consideration in the operation of filter units, which have significant effects on the activity of earthworms and the performance of pollution removal. In order to investigate the best conditions for pollutant removal, three water levels were set in the current experiment, which are listed in Table 3. The initial commissioning phase for filter units lasted for 60 days, before the performance of the system was monitored in a period of 105 days (summer of 2017). In the first 35 days, the filter system was operated in experimental condition 1. After this, it changed to experimental condition 2 in the second period (approximately days 36–70). During approximately days 71–105, the system was operated in experimental condition 3 and the matrix was not replaced during the process. The CW units were planted with Lolium perenne Linn for 150 days so that plants can develop their root system where the biofilm can also develop very well. The experiments were started after the plants grows up to 10 cm above the ground and lasted for 20 days.
The water samples were collected with at a sampling interval of seven days to analyze following water quality parameters: temperature, pH, COD, NH4+-N, TN and TP. Prior to transferring earthworms into the filter, their initial mean weight was measured. Therefore, the initial mean weight of earthworm was the same. After 7 days, the weight of earthworms in each layer were measured respectively, before the final mean weight in each layer was also calculated more than 3 times in a simulation experimental column. However, in the filters, we just measured once and collected soil layer without dismantling the system to find out the earthworms that were present in the system.
2.5. Sample Analysis
Temperature and pH were measured by the mercury thermometer, INESA, Shanghai, China), pH meter (HANNA, Padova, Italy) and portable dissolved oxygen (DO) analyzer (INESA, Shanghai, China), respectively. COD was measured by the standard procedure described in APHA [23]. Pollutants, such as NH4+-N, TN and TP, were determined by UV–visible spectrophotometer (SHIMADZU, Kyoto, Japan).
2.6. Characterization of Pollutant Removal Effect
The removal efficiency was used to describe the pollutant removal effect of the filter. It can express the differences in the performance of the filters and the CWs. The removal efficiency (η) was calculated by the following formula.
where η is the removal efficiency (%); Cin is the concentration of the influent (mg/L); Cout is the concentration of the effluent (mg/L). For a specific water quality parameter, a higher η value means better removal performance.
3. Results and Discussion
3.1. Growth and Distribution of Earthworms
The growth and distribution of earthworms are important prerequisite knowledge in the current study because earthworm activity directly affects the operating status of filters. The weight change of earthworms was used to evaluate their growth status. Earthworms were placed in the device in March. The related experimental results were observed 7 days later and recorded in Table 4.
A total of 20 Eisenia foetida earthworms were introduced only in the soil, not in the gravel. Hence, it is clear that earthworms were mainly distributed in the soil layer close to the gravel. It was reported in earlier research that due to their need for food and air, most earthworms live in the boundary between the soil and gravel [15]. The soil near the interface between the soil and the gravel layer adsorbs more organic matter, with these soils with adsorbed organic matter being suitable for the growth of earthworms. On the other hand, the activity of earthworms is greatly affected by light and they live in the deep soil (15–20 cm) for most of the time. They are less affected by temperature. The results revealed that the mean weight of earthworms increased in the four layers of soil, from which the growth rate was calculated. It can be seen that the growth rate increases with the depth of the soil, which reflects the fact that earthworms experience better growth when they are close to gravel and water level. It can be seen the earthworm colors were different in the different soil layers from Figure 3. The color was dark in 0~10 cm soil, while it was light in 10~20 cm soil. In the rearing of earthworms, when they had a better metabolism, their body color is bright and shiny, while they have strong activity. On the contrary, when the growth of earthworms was slow, their body color was dark and they move slowly [24]. Therefore, the body color of earthworms also proved that it was suitable to survive in the soil near the gravel.
3.2. Pollutants Removal Effect of EEF and EECW
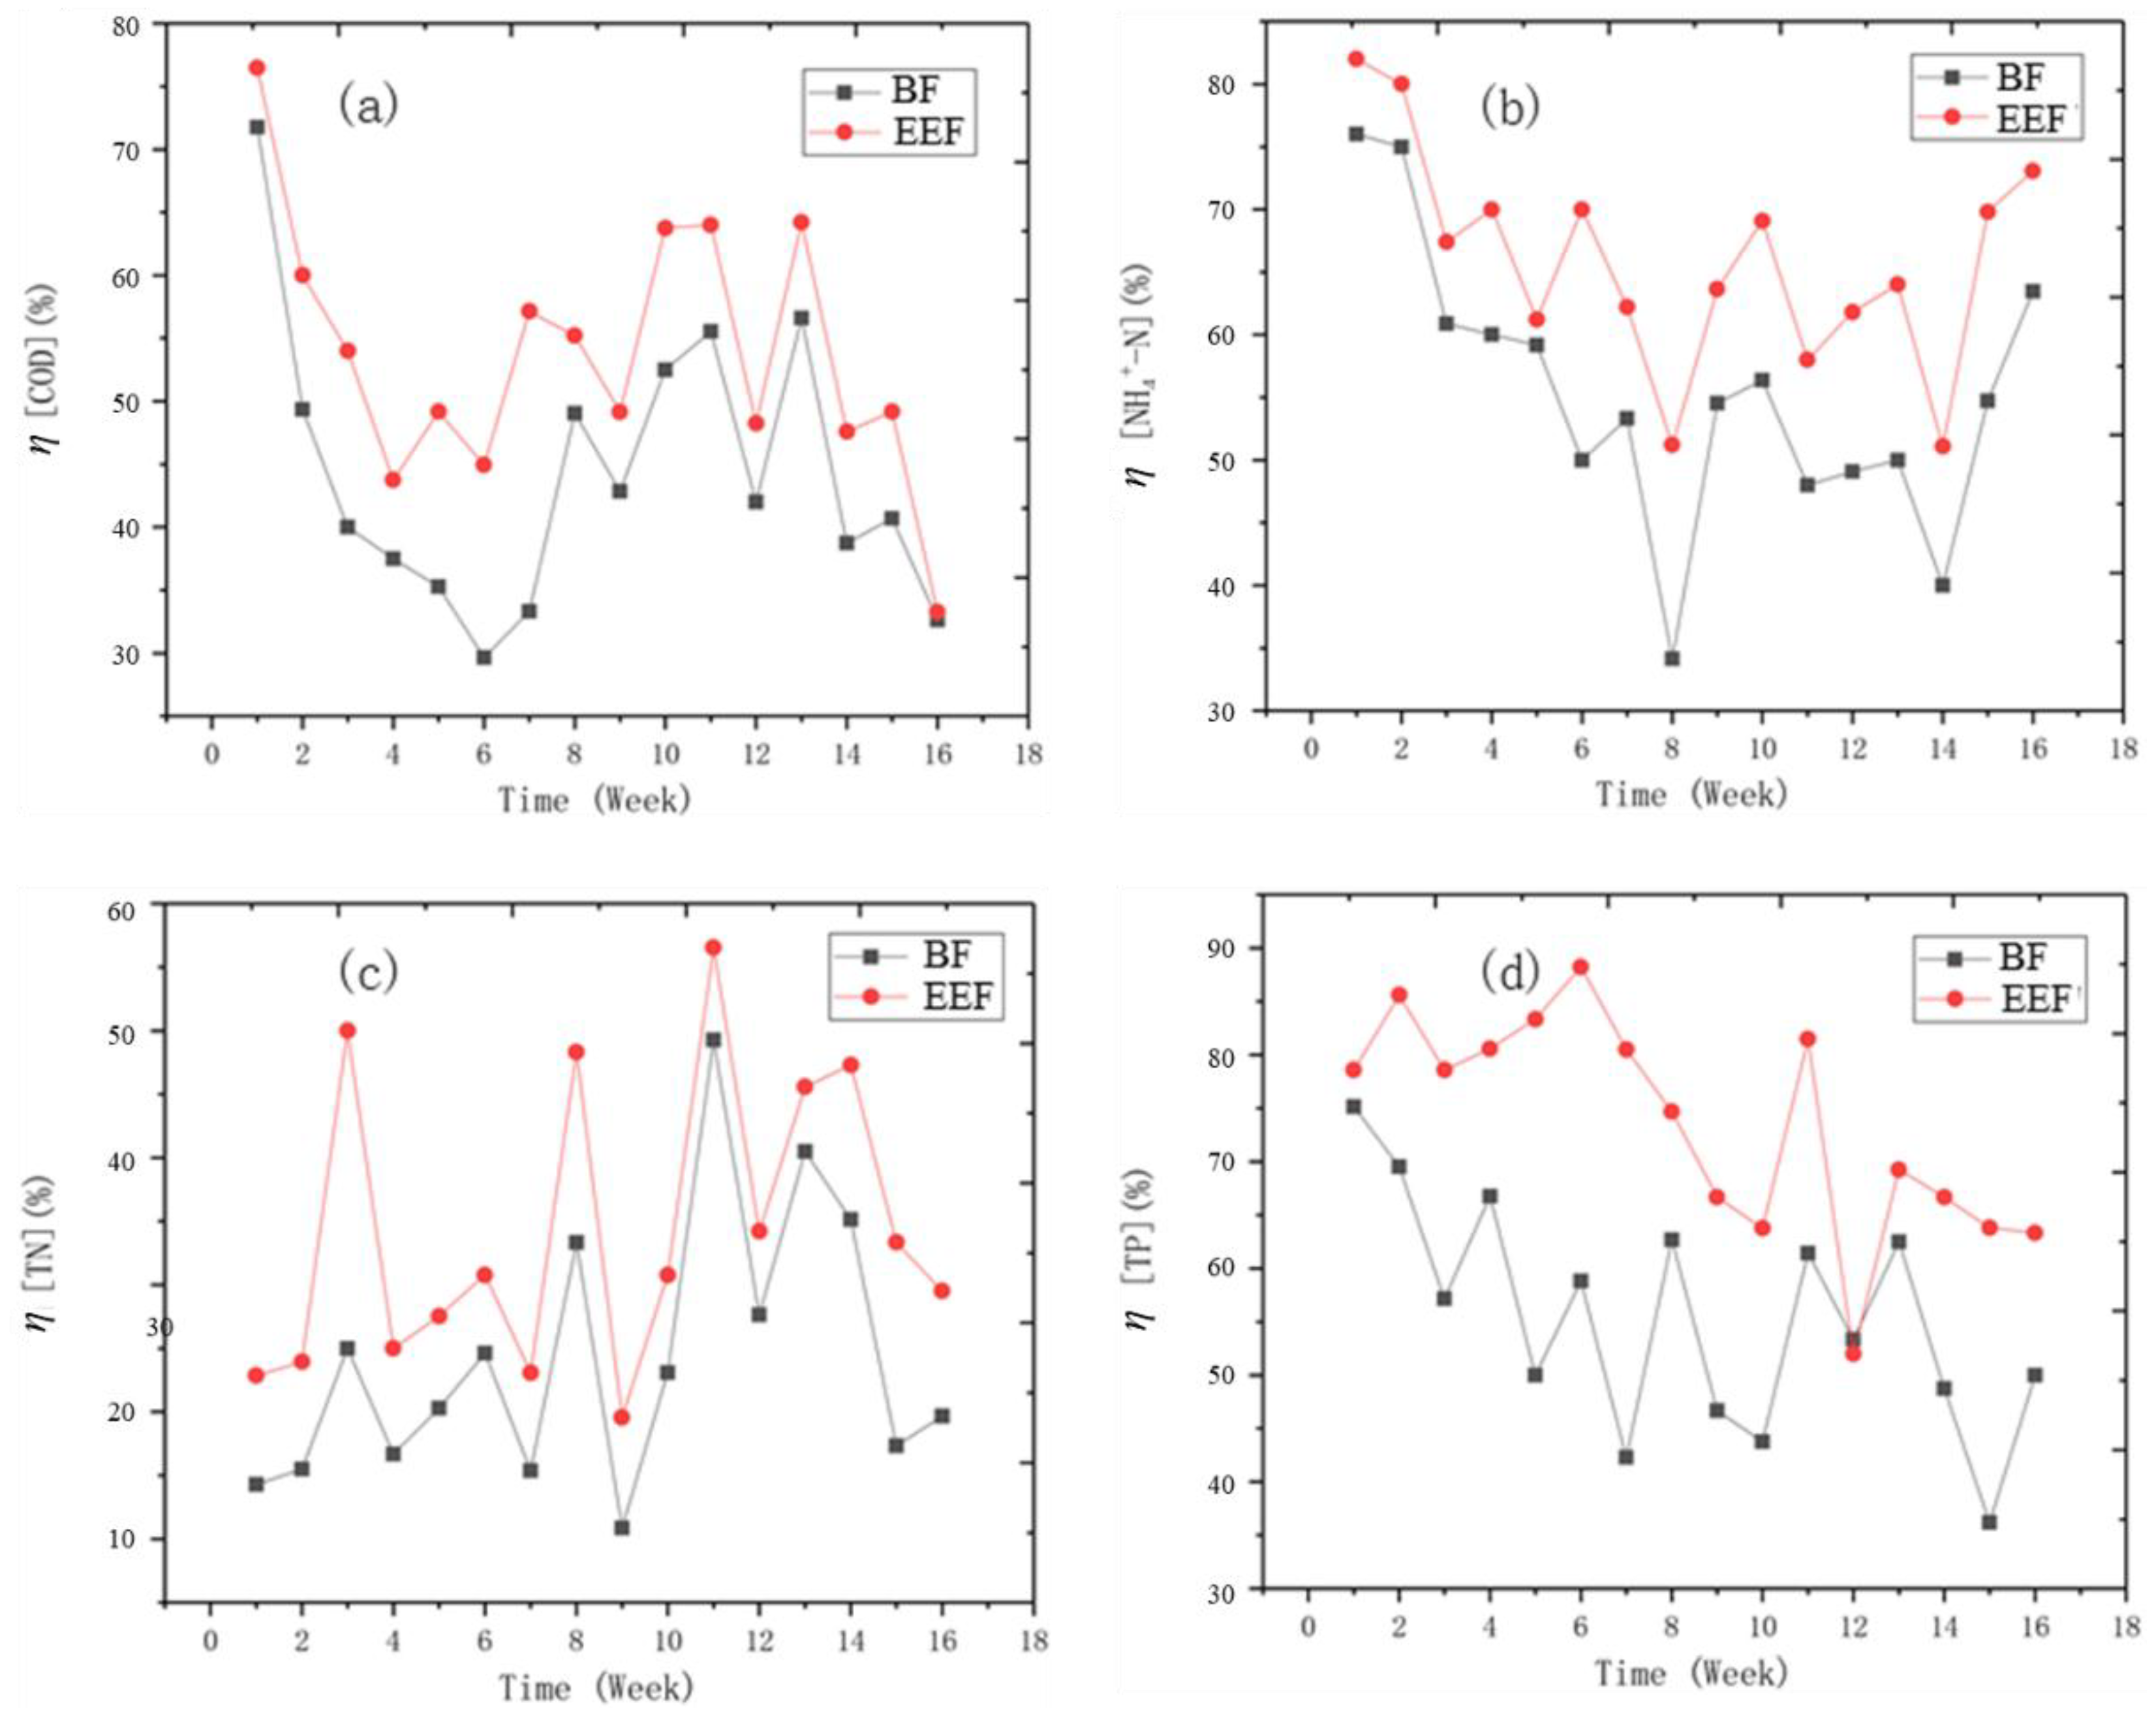
The performance of the EEF and BF were monitored for 16 weeks. The analysis results were listed in Figure 4. It can be seen that the pollutant removal effect of EEF and BF fluctuated constantly. The average EEF removal efficiency of COD, NH4+-N, TN and TP were 53.8%, 65.9%, 34.3% and 73.6%, respectively. In contrast, the average BF η of COD, NH4+-N, TN and TP were 44.2%, 55.3%, 24.3% and 55.3%, respectively. The area load of COD, NH4+-N, TN and TP were 16.2 g/m2/day, 2.03 g/m2/day, 2.84 g/m2/day and 0.12 g/m2/day, respectively. These results differ from the findings of Kenatu et al. who used unplanted HSSF CW with the hydraulic retention time of six days and obtained η[BOD] of 73%, η[NH4+-N] of 61.0%, η[NO3−-N] of 55.5% and η[PO43−] of 67.6% as well as an areal load of BOD of 5.5–6.16 g/m2/day. [11]. Reza et al. found that for compost leachate, with the hydraulic retention time of five days, η of COD, NH4+-N and TN were 26.2%, 17.1% and 35.0%, respectively, while the areal loads of COD, NH4+-N and TN were 785.6 g/m2/day, 1.64 g/m2/day and 29.67 g/m2/day, respectively [25]. The removal effects in this current study were found to be lower compared with the findings of the above-mentioned study [25]. They have also reported that the percentage reductions of COD, NH4+-N and TN increases with the increasing HRT [25]. In addition, these removal results depend on the type of matrix and certain environmental conditions, such as pH, redox potential, temperature, organic matter content and the concentrations of certain nutrients or even the presence of heavy metals [26,27].
Figure 4 shows that the effect of EEF was better than that of BF unit. The activity of earthworms could leave many tiny holes in the soil, which can increase the oxygen content in the micro-environment. It is reported earlier that the behavior of earthworms can enhance the activity of microorganisms [28]. Earlier studies have also revealed that the total bacterial count, the numbers of ammonifier, ammonia-oxidizing bacteria and nitrite-oxidizing bacteria as well as urease and protease activities in the upper layer were positively related to earthworms [29,30,31].
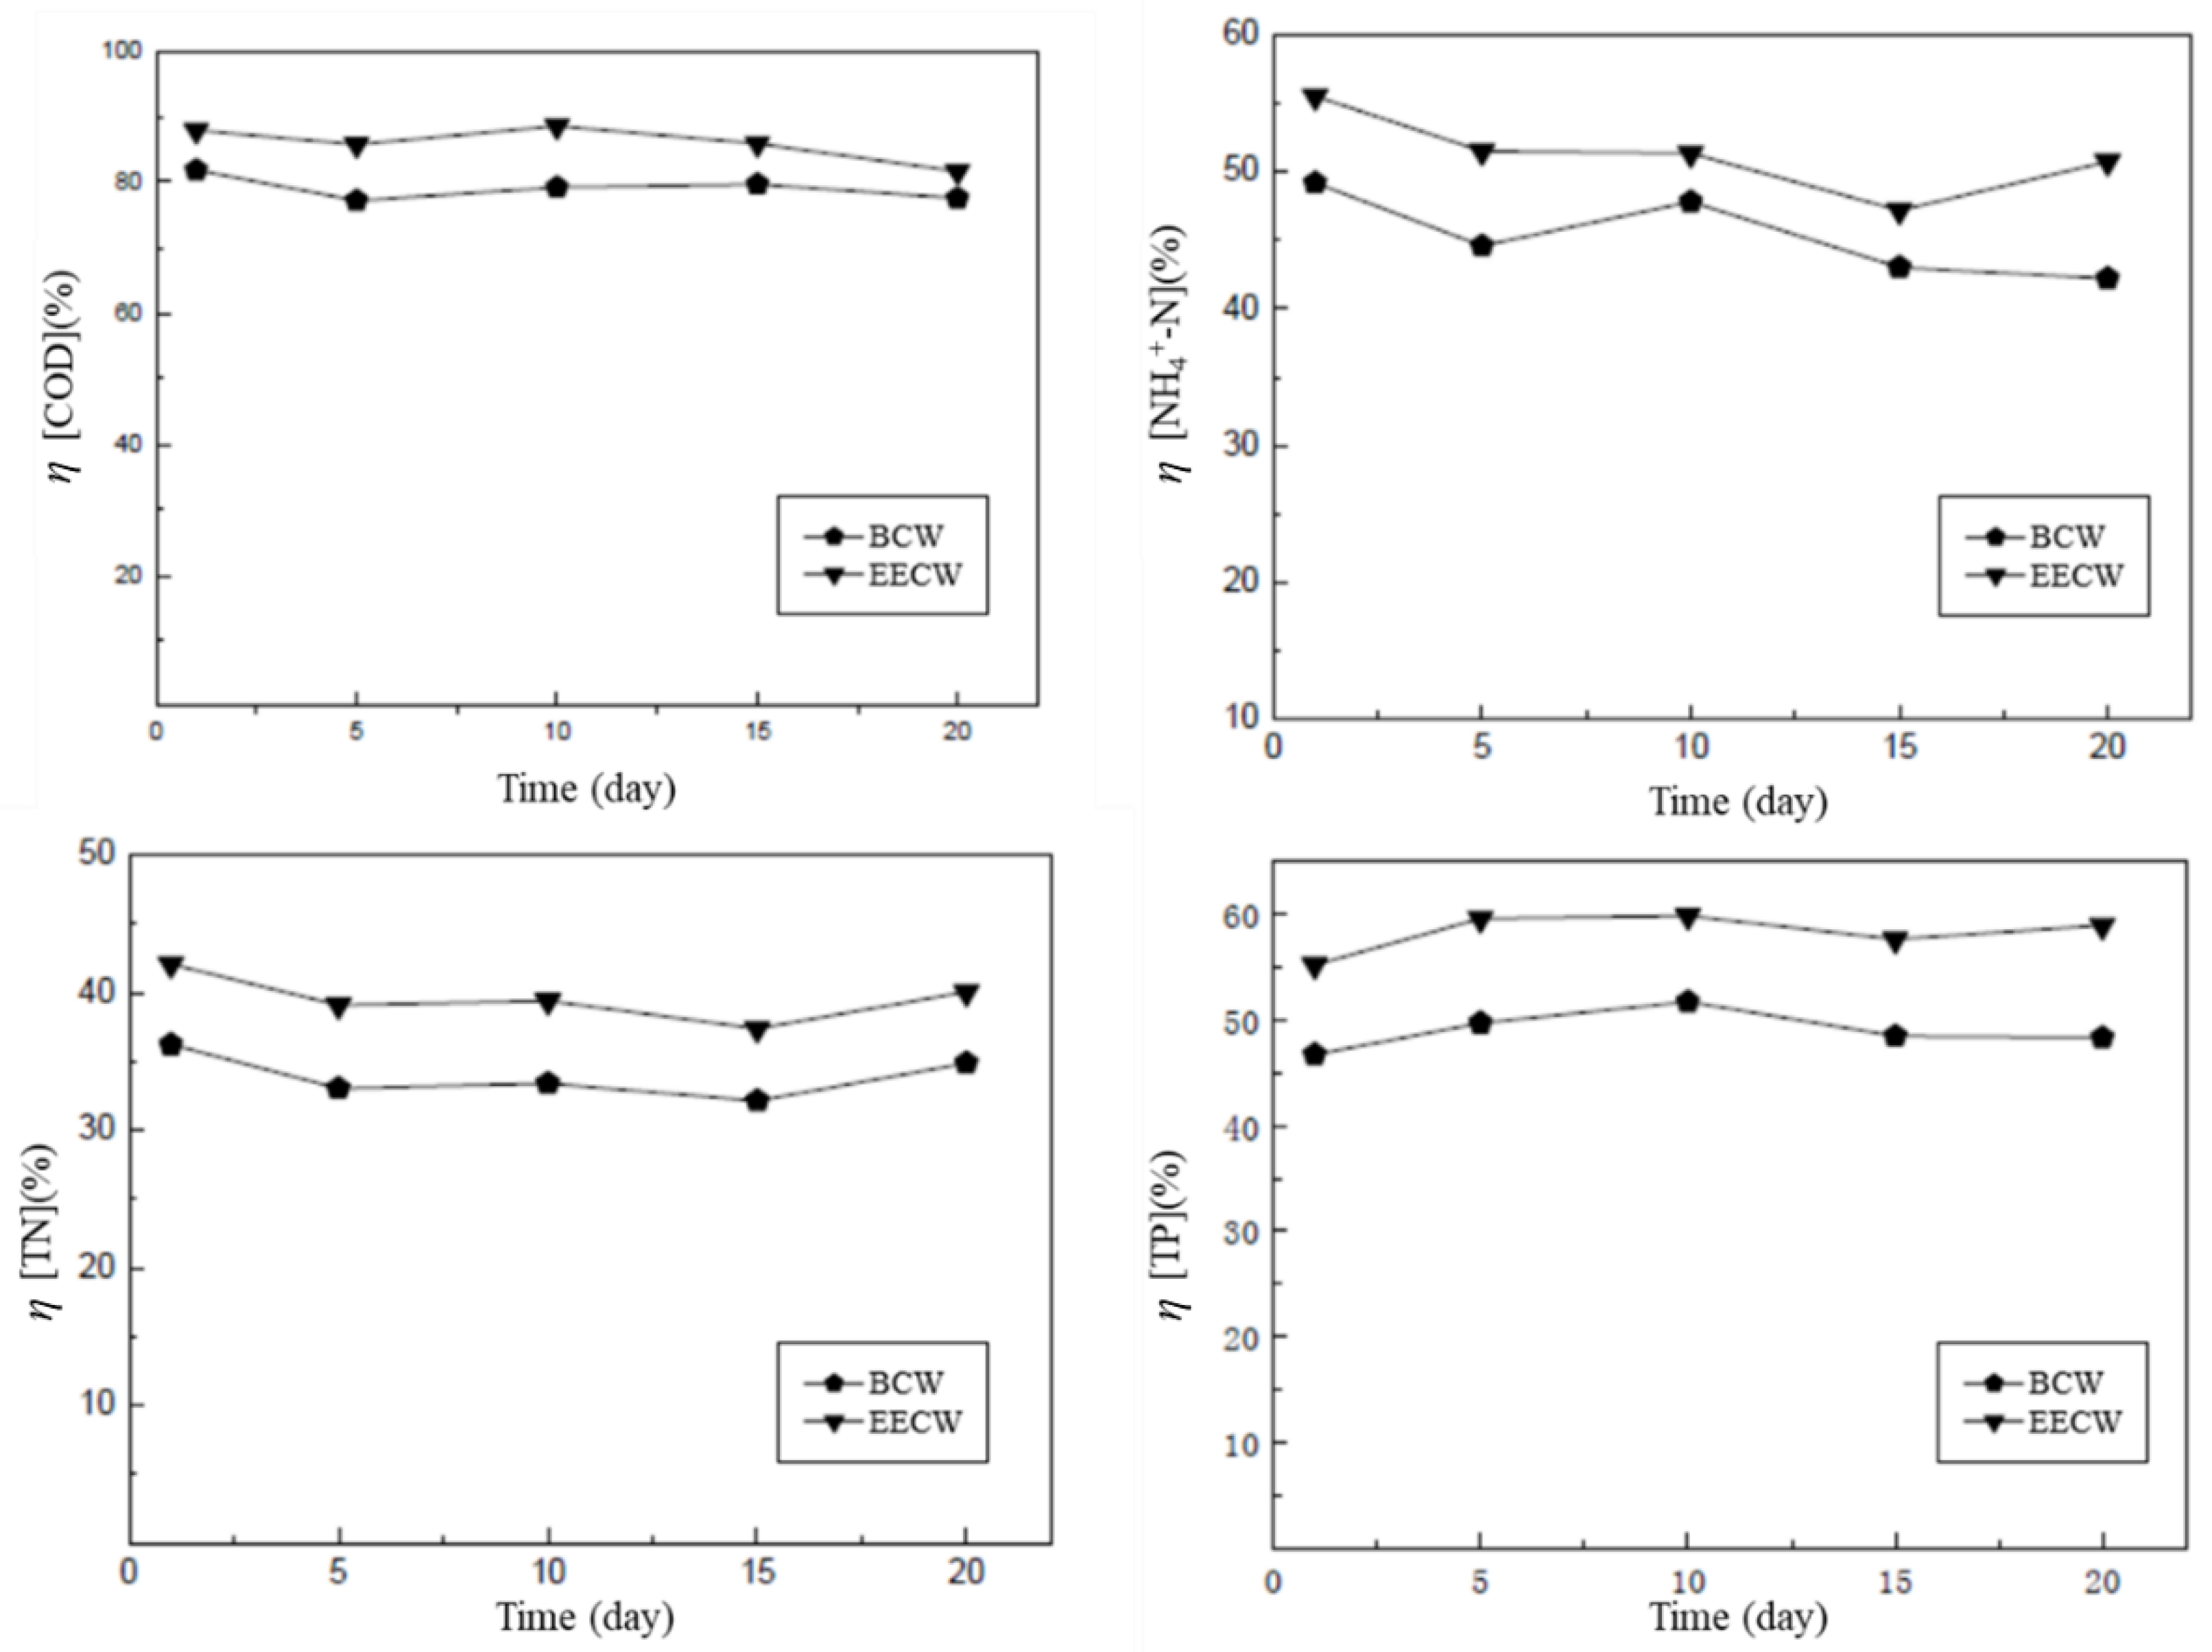
To draw a much more solid conclusion, the performance of 2 planted CWs were also investigated in the current study. These CWs were planted with Lolium perenne Linn for 150 days. Observation started after plants were grown up to 10 cm above the ground and lasted for 20 days. The performance contrast in terms of the pollutant removal between the earthworm-enhanced constructed wetland (EECW) and blank constructed wetland (BCW) is shown in Figure 5. It reflected a similar result as the performance of EECW was better than that of BCW. Compared to the unplanted filters (EEF and BF), the EECW has higher efficiency in the removal of COD and TN. It is worth noting that the CW (planted unit) has more stable removal efficiency than the filters (unplanted units). The results revealed that plants can increase the impact resistance of the device, while more stable influent quality leads to more stable removal efficiency.
3.3. Influence of Water Level on EEF Performance
The pollutant removal efficiency of EEF was studied under three different water levels (25 cm, 30 cm and 35 cm, respectively), before the η box charts for the monitor sample points of four index (COD, NH4+-N, TN and TP) were plotted to observe the influence of water level on EEF performance (Figure 6). For COD, it can be seen obviously that the order of η among three water levels is 30 cm > 25 cm > 35 cm. The η[COD] is more than 50% when the water level is 30 cm. In contrast, it is around 30% and 15% when the water level is 25 cm and 35 cm, respectively. In addition, the order of η among three water levels for the three other water quality indices was the same. Because the soil is rich in organic matter and soluble nitrogen and phosphate, when the water level is above the boundary between the soil and gravel, the dissolution of soil increased, which leads to a decrease in the pollutant removal effect. It is clear from Section 3.1 that earthworms exist around the boundary between the soil and gravel as a result, there are more microorganisms around the boundary. Therefore, the EEF had the best performance when the water level was 30 cm. For COD and NH4+-N, the removal efficiency under an optimized water level (30 cm) is 40% higher than that under adverse conditions (35 cm water level), which demonstrates that it is important to find the best condition for decision making.
3.4. Influence of Temperature on EEF Performance
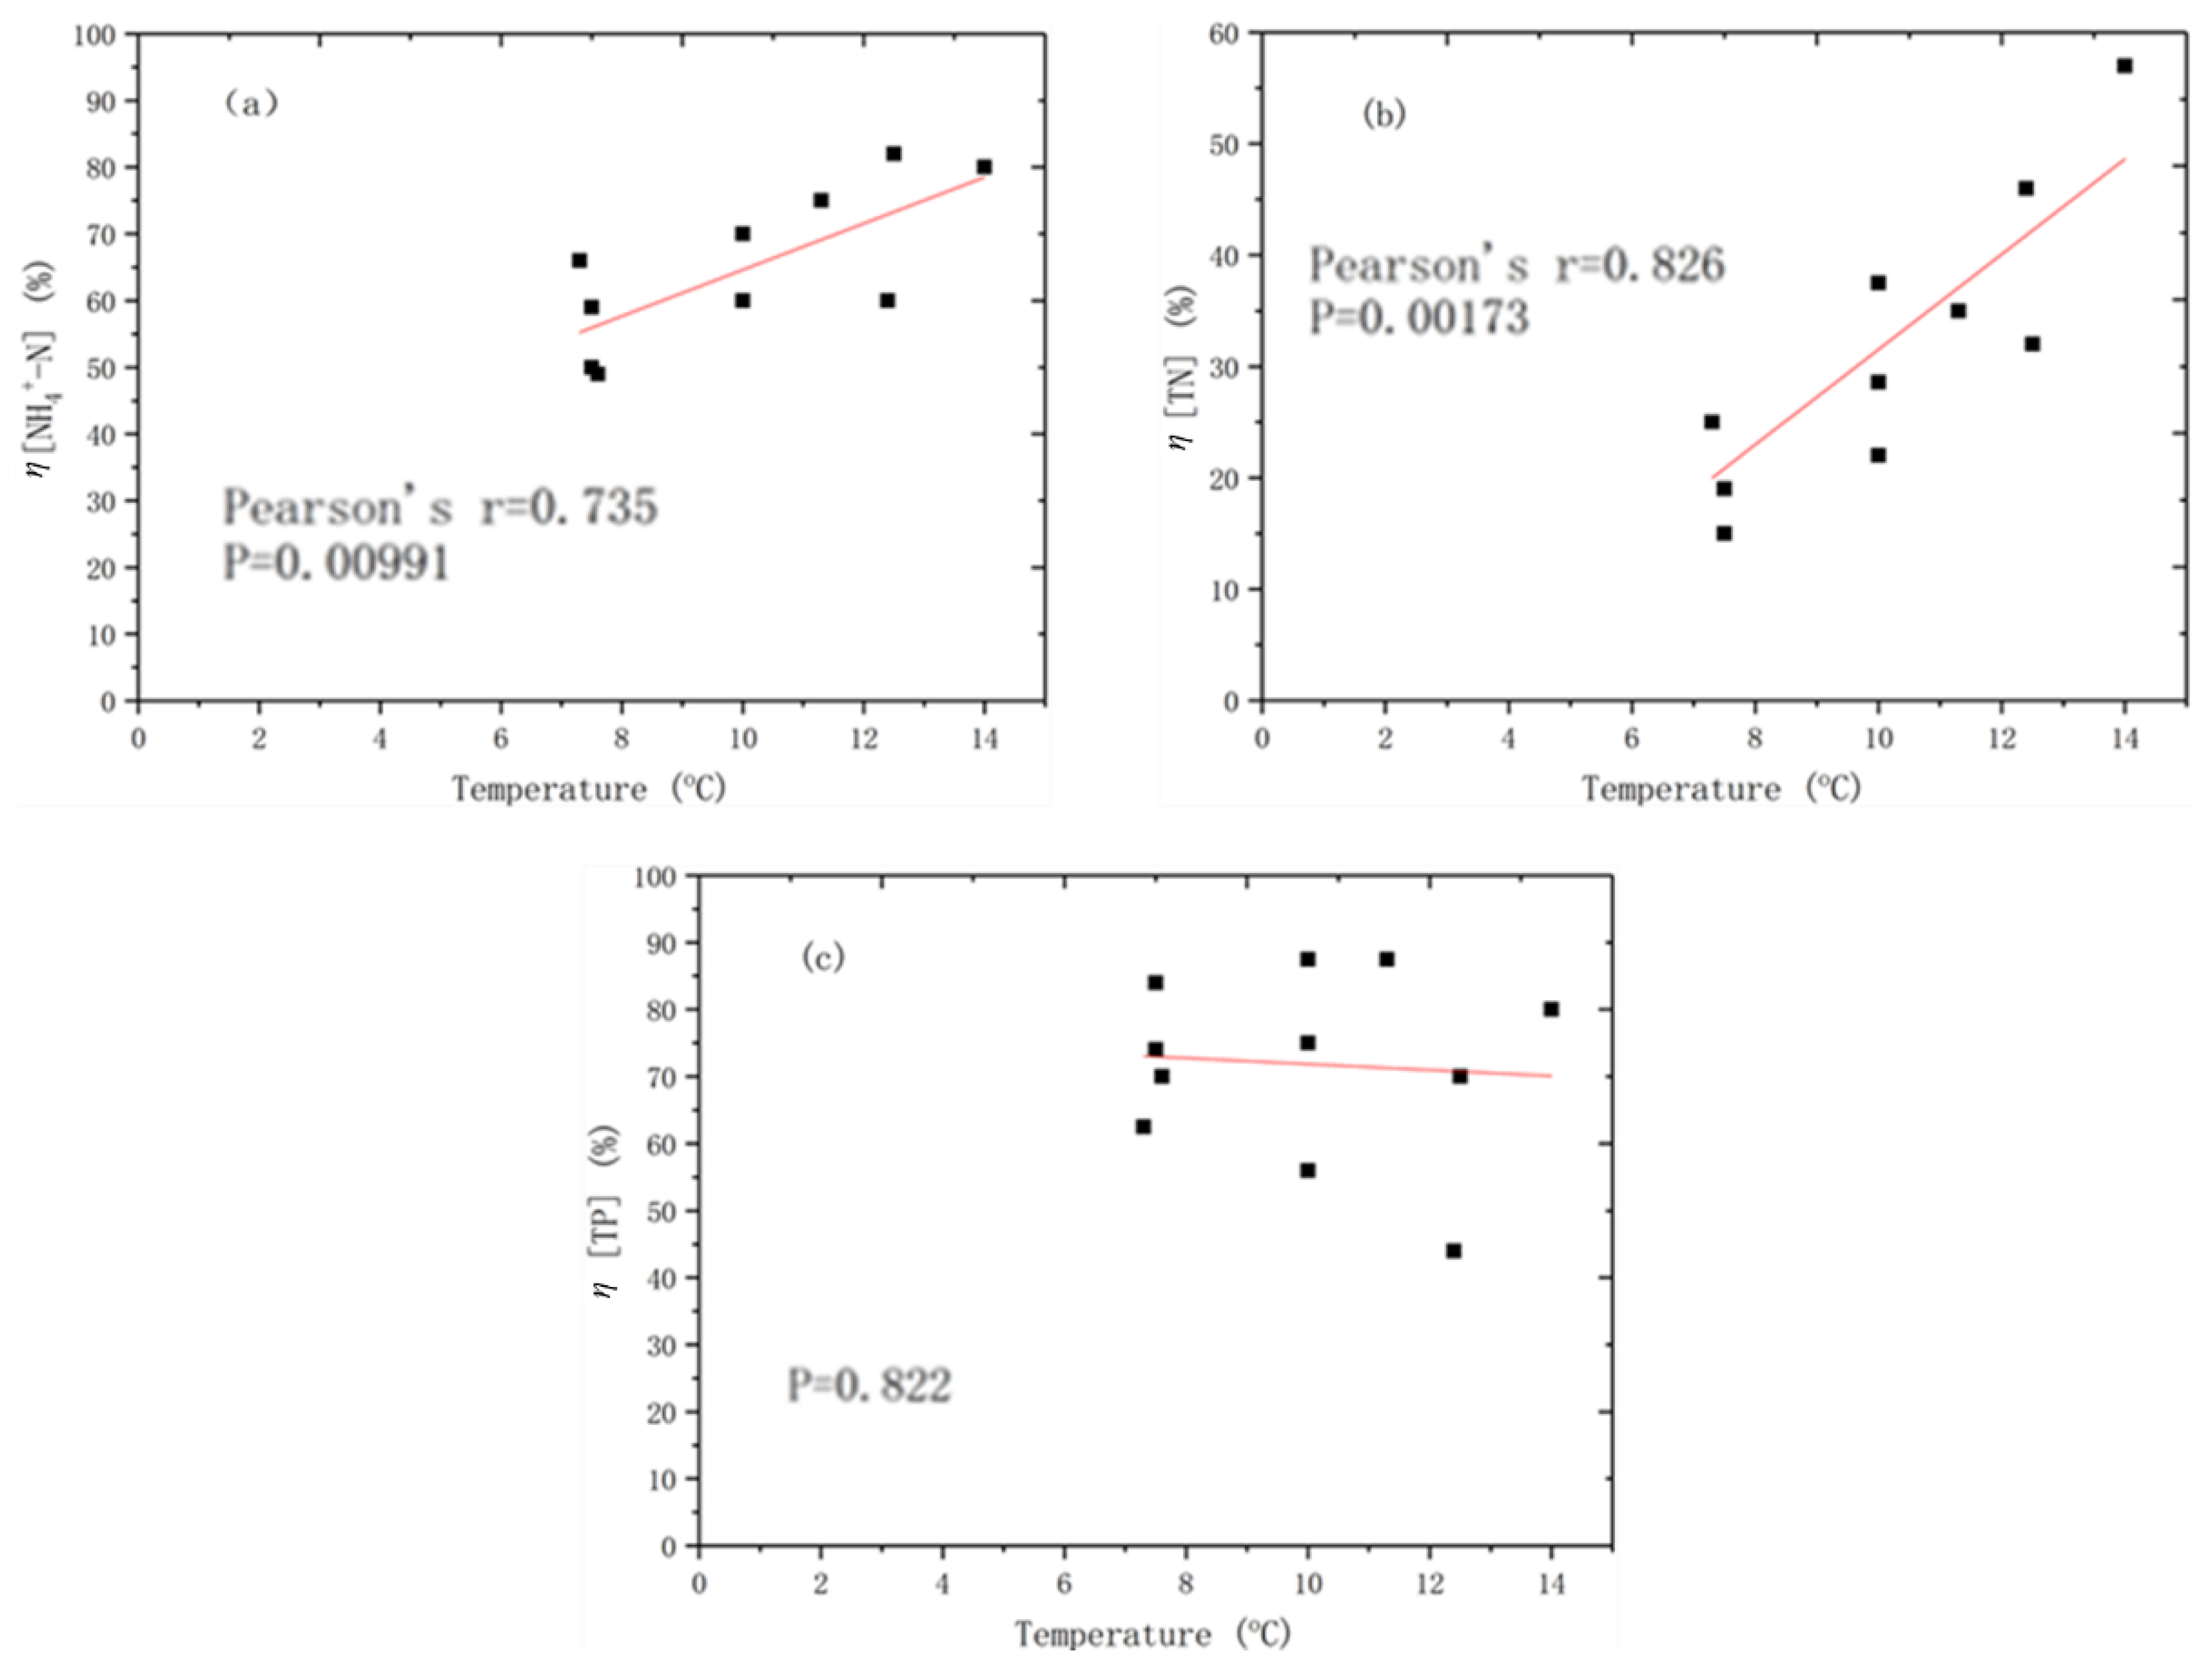
In order to study the influence of temperature, 11 individual temperature data and the corresponding η of NH4+-N, TN and TP were monitored. The results of correlation analysis are listed in Figure 7. The influent temperature in filter units ranged between 5 to 15 °C. An earlier study reported that low temperatures can have a considerable effect on water quality as a result of a decrease in biological decomposition [32]. Figure 7a,b show that NH4+-N and TN removal rate and temperature have the same trend in the EEF. Nitrogen removal is mainly dependent on the microorganisms, which play an important role in nitrification and denitrification process, while microbial activity is greatly affected by temperature [29]. In Figure 7a,b, the p values of the curves were both lower than 0.01, which reflect that temperature has a significant effect on the removal efficiency of NH4+-N and TN. Increased temperature leads to increased activity of earthworms and microorganisms, which increases aeration and availability of DO to micro-organisms. Being different from NH4+-N and TN, the removal efficiency of TP was less affected by temperature. It can be seen clearly in Figure 7c that the p value was far more than 0.05, which shows that temperature is not significantly related to TP removal rate. The possible reason could be that the removal of phosphorus in the device mainly depends on the contribution of the matrix [30]. Previous studies have also suggested that the actual effect of temperature on removal efficiency for various pollutants could be effectively analyzed by longer operations [33,34].
4. Conclusions
The results indicated that the performance of the filter unit with Eisenia foetida earthworms was comparatively better than the filter unit without earthworms. Earthworms grew better if they were closer to the gravel and the water level. The results also revealed that removal efficiencies for COD, NH4+-N, TN, TP were generally higher when the water level is around the level of the boundary between the soil and gravel. The removal efficiencies for NH4+-N and TN were positively correlated with temperature, while the removal efficiency of TP and temperature were not significantly related. The results revealed that compared to the unplanted units (EEF and BF), the EECW has higher efficiency in the removal of COD and TN. It is also worth noting that the CWs (planted units) have more stable removal efficiency than the filters (unplanted units). The results also showed that plants can increase the impact resistance of the device, while more stable influent quality leads to more stable removal efficiency. Overall, the results revealed that performance of filters differs with different hydraulic conditions and presence of Eisenia foetida. The findings of the current study could be very useful for the implementation of small-scale HSSFF treatment facilities for the treatment of different types of wastewater in the place where sewage collection and treatment is a big challenge. The evaluation of the performance of filters in treating various types of wastewaters will help us to select the appropriate parameters for better performance of filters under local conditions.
Author Contributions
D.F. and R.P.S. conceived and designed the experiments; J.J. and R.P.S. performed the experiments; J.W. contributed analysis tools and analyzed the data; and R.P.S. wrote the paper.
Funding
This research was supported by the National Natural Science foundation of China NSFC Grants No. 51550110231, 51650410657.
Conflicts of Interest
The authors declare no conflict of interest.
References
- Durgananda, S.C.; Saravanamuthu, V.; Huu-Hao, N.; Wang, G.S.; Hee, M. Biofilter in water and wastewater treatment. Korean J. Chem. Eng. 2003, 20, 1054–1065. [Google Scholar]
- Wang, C.; Hu, J.; Wang, Y.C.; Ma, Y.F.; Zeng, M.; Li, L. Study on denitrification effect of non-reflux biofilter. J. Agro-Environ. Sci. 2018, 37, 316–322. (In Chinese) [Google Scholar]
- Zhang, H.G. Study on the Effect of Bio-Filter and Constructed Wetlands Purifying Mariculture Effluent. Master’s Thesis, Shanghai Ocean University, Shanghai, China, 2011. [Google Scholar]
- Starla, G.T.; Kumar, M. Biological filters and their use in potable water filtration systems in spaceflight conditions. Life Sci. Space Res. 2018, 17, 40–43. [Google Scholar]
- Kong, L.W.; Zhang, Y.; Wang, L.; Mei, R.W.; Zhang, Y.; Li, Y. Study on Enhanced treatment of domestic sewage by a novel biological filter-constructed wetland coupling system. Technol. Water Treat. 2018, 44, 110–114. (In Chinese) [Google Scholar]
- Terry, L.G.; Summers, R.S. Biodegradable organic matter and rapid-rate biofilter performance: A review. Water Res. 2018, 128, 234–245. [Google Scholar] [CrossRef] [PubMed]
- Bagherpour, M.B.; Nikazar, M.; Welander, U.; Bonakdarpour, B.; Sanati, M. Effects of irrigation and water content of packings on alpha-pinene vapours biofiltration performance. Biochem. Eng. J. 2005, 24, 185–193. [Google Scholar] [CrossRef]
- Wang, S.; Xu, Z.X.; Li, H.Z. The strengthening method of subsurface constructed wetland treating domestic sewage. Environ Sci. 2006, 27, 2432–2438. (In Chinese) [Google Scholar]
- Ozawa, T.; Risal, C.P.; Yanagimoto, R. Increase in the nitrogen content of soil by the introduction of earthworms into soil. Soil Sci. Plant Nutr. 2005, 51, 917–920. [Google Scholar] [CrossRef]
- Vymazal, J. Constructed wetlands for wastewater treatment: Five decades of experience. Environ. Sci. Technol. 2011, 45, 61–69. [Google Scholar] [CrossRef] [PubMed]
- Kenatu, A.; Seyoum, L.; Worku, M.; Helmut, K.; Erik, M. Organic matter and nutrient removal performance of horizontal subsurface flow constructed wetlands planted with Phragmites karka and Vetiveria zizanioide for treating municipal wastewater. Environ. Process. 2018, 5, 115–130. [Google Scholar]
- Hu, S.S.; Chen, Z.B. Earthworm effects on biosolids characteristics in sludge treatment wetlands. Ecol. Engi. 2018, 118, 12–18. [Google Scholar] [CrossRef]
- Chen, Z.B.; Hu, S.S.; Hu, C.X.; Huang, L.L.; Liu, H.B.; Vymazal, J. Preliminary investigation on the effect of earthworm and vegetation for sludge treatment in sludge treatment reed beds system. Environ. Sci. Pollut. Res. 2016, 23, 11957–11963. [Google Scholar] [CrossRef] [PubMed]
- Xu, D.; Li, Y.; Fan, X.; Guan, Y.; Fang, H.; Zhao, X. Influence of earthworm Eisenia fetida on Iris pseudacorus’s photosynthetic characteristics, evapotranspiration losses and purifying capacity in constructed wetland systems. Water Sci. Technol. 2013, 68, 335–341. [Google Scholar] [CrossRef] [PubMed]
- Davison, L.; Headley, T.; Pratt, K. Aspects of design, structure, performance and operation of reed beds—Eight years’ experience in Northeastern New South Wales, Australia. Water Sci. Technol. 2005, 51, 129–138. [Google Scholar] [CrossRef] [PubMed]
- Schaefer, M.; Juliane, F. The influence of earthworms and organic additives on the biodegradation of oil contaminated soil. Appl. Soil Ecol. 2007, 36, 53–62. [Google Scholar] [CrossRef]
- Zirbes, L.; Thonart, P.; Haubruge, E. Microscale interactions between earthworms and microorganisms: A review. Biotechnol. Agron. Soc. 2012, 16, 125–131. [Google Scholar]
- Taylor, M.; Clarke, W.P.; Greenfield, P.F. The treatment of domestic wastewater using small-scale vermicompost filter beds. Ecol. Eng. 2003, 21, 197–203. [Google Scholar] [CrossRef]
- Arancon, N.Q.; Edwards, C.A.; Babenko, A.; Cannon, J.; Galvis, P.; Metzger, J.D. Influences of vermi-composts, produced by earthworms and microorganisms from cattle manure, food waste and paper waste, on the germination, growth and flowering of petunias in the greenhouse. Appl. Soil Ecol. 2008, 39, 91–94. [Google Scholar] [CrossRef]
- Chapuis-Lardy, L.; Brossard, M.; Lavelle, P.; Schouller, E. Phosphorus transformations in a ferralsol through ingestion by Pantoscolex corethrurus, a geophagous earthworm. Eur. J. Soil Biol. 1998, 34, 61–67. [Google Scholar] [CrossRef]
- Singh, J.; Kaur, A. Vermicompost as a strong buffer and natural adsorbent for reducing transition metals, BOD, COD from industrial effluent. Ecol. Eng. 2015, 74, 9–13. [Google Scholar] [CrossRef]
- Technical Specification of Constructed Wetlands for Wastewater Treatment Engineering; Ministry of Environmental Protection of China: Beijing, China, 2011.
- American Public Health Association (APHA). Standard Methods for the Examination of Water and Wastewater, 20th ed.; American Public Health Association, American Water Works Association: Washington, DC, USA, 1998. [Google Scholar]
- Xie, Y.M. The Use and Cultivation of Earthworms; Wuzhou Press: Taipei, Taiwan, 1989; pp. 25–41. [Google Scholar]
- Reza, B.; Nadali, A.; Monireh, M.; Pooya, P. Compost leachate treatment by a pilot-scale subsurface horizontal flow constructed wetland. Ecol. Eng. 2017, 105, 7–14. [Google Scholar]
- Sohair, I.A.; Mohamed, A.E.; Magdy, T.K.; Mohamed, S.H. Factors affecting the performance of horizontal flow constructed treatment wetland vegetated with Cyperus papyrus for municipal wastewater treatment. Int. J. Phytoremediat. 2017, 19, 1023–1028. [Google Scholar]
- Yang, J.; Ye, Z. Metal accumulation and tolerance in wetland plant. Front. Biol. 2009, 4, 282–288. [Google Scholar] [CrossRef]
- Tognetti, C.; Mazzarino, M.J.; Laos, F. Improving the quality of municipal organic waste compost. Bioresour. Technol. 2007, 98, 1067–1076. [Google Scholar] [CrossRef] [PubMed]
- Ji, F.Y.; Luo, G.Y.; Zhou, J. Experimental study on earthworm and wastewater treatment. Chongqing Environ. Sci. 1998, 20, 12–15. (In Chinese) [Google Scholar]
- Li, H.Z.; Wang, S.; Ye, J.F.; Xu, Z.X.; Jin, W. A practical method for the restoration of clogged rural vertical subsurface flow constructed wetlands for domestic wastewater treatment using earthworm. Water Sci. Technol. 2011, 63, 283. [Google Scholar] [CrossRef] [PubMed]
- Wu, L.; Li, X.N.; Song, H.L.; Wang, G.F.; Jin, Q.; Xu, X.L.; Gao, Y.C. Enhanced removal of organic matter and nitrogen in a vertical-flow constructed wetland with Eisenia foetida. Desalin. Water Treat. 2013, 51, 7460–7468. [Google Scholar] [CrossRef]
- Bulc, T.; Slak, A.S. Performance of constructed wetland for highway runoff treatment. Water Sci. Technol. 2003, 48, 315–322. [Google Scholar] [CrossRef] [PubMed]
- Poe, A.C.; Piehler, M.F.; Thompson, S.P.; Paerl, H.W. Denitrification in a constructed wetland receiving agricultural runoff. Wetlands 2003, 23, 817–826. [Google Scholar] [CrossRef]
- Aldheimer, G.; Bennerstedt, K. Facilities for treatment of stormwater runoff from highways. Water Sci. Technol. 2003, 48, 113–121. [Google Scholar] [CrossRef] [PubMed]
Figure 1.
Experimental setup of experimental units: (a) Sectional view; and (b) Schematic view of experimental setup of the CW and Filters systems (Earthworm-enhanced filter (EEF); Blank-filter (BF); Earthworm-enhanced constructed wetland (EECW); Blank constructed wetland (BCW)).
Figure 1.
Experimental setup of experimental units: (a) Sectional view; and (b) Schematic view of experimental setup of the CW and Filters systems (Earthworm-enhanced filter (EEF); Blank-filter (BF); Earthworm-enhanced constructed wetland (EECW); Blank constructed wetland (BCW)).

Figure 2.
Presence of Eisenia foetida earthworms in experimental filter units.

Figure 3.
The earthworm color in different depths of the soil layer ((a) earthworm in 0~10 cm soil layer; and (b) earthworm in 10~20 cm soil layer).
Figure 3.
The earthworm color in different depths of the soil layer ((a) earthworm in 0~10 cm soil layer; and (b) earthworm in 10~20 cm soil layer).

Figure 4.
Performance contrast in terms of pollutant removal between the EEF and BF (HRT ~3 days, water level ~30 cm): (a) removal of COD; (b) removal of NH4+-N; (c) removal of TN; (d) removal of TP.
Figure 4.
Performance contrast in terms of pollutant removal between the EEF and BF (HRT ~3 days, water level ~30 cm): (a) removal of COD; (b) removal of NH4+-N; (c) removal of TN; (d) removal of TP.

Figure 5.
Performance contrast in terms of pollutant removal between the EECW and BCW (HRT ~3 days, water level ~30 cm).
Figure 5.
Performance contrast in terms of pollutant removal between the EECW and BCW (HRT ~3 days, water level ~30 cm).

Figure 6.
The influence of water level on EEF performance of pollutant removal (6 sample points for per box).
Figure 6.
The influence of water level on EEF performance of pollutant removal (6 sample points for per box).

Figure 7.
Correlation analysis between pollutant removal efficiency and temperature (result considered significant when p < 0.05): (a) correlation analysis between NH4+-N removal efficiency and temperature; (b) correlation analysis between TN removal efficiency and temperature; (c) correlation analysis between TP removal efficiency and temperature.


Table 1.
Composition of synthetic water used in current study.
| Composition | Mean Concentration (mg/L) | Composition | Mean Concentration (mg/L) |
|---|---|---|---|
| Glucose | 278 | NaHCO3 | 111 |
| Starch | 278 | CaCl2 | 6 |
| Peptone | 28 | FeSO4·7H2O | 0.549 |
| Carbamide | 167 | KH2PO4 | 26.4 |
| MgSO4·7H2O | 66 | MnSO4·7H2O | 6 |
Table 2.
Concentration of various pollutants in synthetic water used in current study.
| Index | COD (mg/L) | NH4+-N (mg/L) | TN (mg/L) | TP (mg/L) | pH |
|---|---|---|---|---|---|
| Range | 360~516 | 40.2~57.9 | 56.3~79.2 | 2.27~4.13 | 7~8 |
Table 3.
Parameters in different experimental conditions.
| Technological Parameter | Experimental Condition 1 | Experimental Condition 2 | Experimental Condition 3 |
|---|---|---|---|
| Water level (cm) | 35 | 30 | 25 |
| HRT (day) | 3 | 3 | 3 |
| Hydraulic load (cm/day) | 4.65 | 4.05 | 3.30 |
| Inflow discharge (L/h) | 0.31 | 0.27 | 0.22 |
Table 4.
Weight and distribution of earthworms in the filter.
| Depth | Earthworm Number | Initial Mean Weight (g) | Final Mean Weight (g) | Growth Rate (%) | Earthworm Color | |
|---|---|---|---|---|---|---|
| Soil | 0~5 cm | 2 | 0.48 | 1.14 | 137.5 | Dark |
| 5~10 cm | 5 | 0.48 | 1.28 | 166.7 | Dark | |
| 10~15 cm | 6 | 0.48 | 1.62 | 237.5 | Light | |
| 15~20 cm | 7 | 0.48 | 2.07 | 331.3 | Light | |
| Gravel | 20~50 cm | 0 | —— | —— | —— | —— |
© 2018 by the authors. Licensee MDPI, Basel, Switzerland. This article is an open access article distributed under the terms and conditions of the Creative Commons Attribution (CC BY) license (http://creativecommons.org/licenses/by/4.0/).
Share and Cite
MDPI and ACS Style
Singh, R.P.; Fu, D.; Jia, J.; Wu, J. Performance of Earthworm-Enhanced Horizontal Sub-Surface Flow Filter and Constructed Wetland. Water 2018, 10, 1309. https://doi.org/10.3390/w10101309
AMA Style
Singh RP, Fu D, Jia J, Wu J. Performance of Earthworm-Enhanced Horizontal Sub-Surface Flow Filter and Constructed Wetland. Water. 2018; 10(10):1309. https://doi.org/10.3390/w10101309
Chicago/Turabian StyleSingh, Rajendra Prasad, Dafang Fu, Jing Jia, and Jiaguo Wu. 2018. "Performance of Earthworm-Enhanced Horizontal Sub-Surface Flow Filter and Constructed Wetland" Water 10, no. 10: 1309. https://doi.org/10.3390/w10101309
Note that from the first issue of 2016, this journal uses article numbers instead of page numbers. See further details here.