Assessing the Impact of Site-Specific BMPs Using a Spatially Explicit, Field-Scale SWAT Model with Edge-of-Field and Tile Hydrology and Water-Quality Data in the Eagle Creek Watershed, Ohio

 ,
,  , and
, and
Abstract
:1. Introduction
2. Materials and Methods
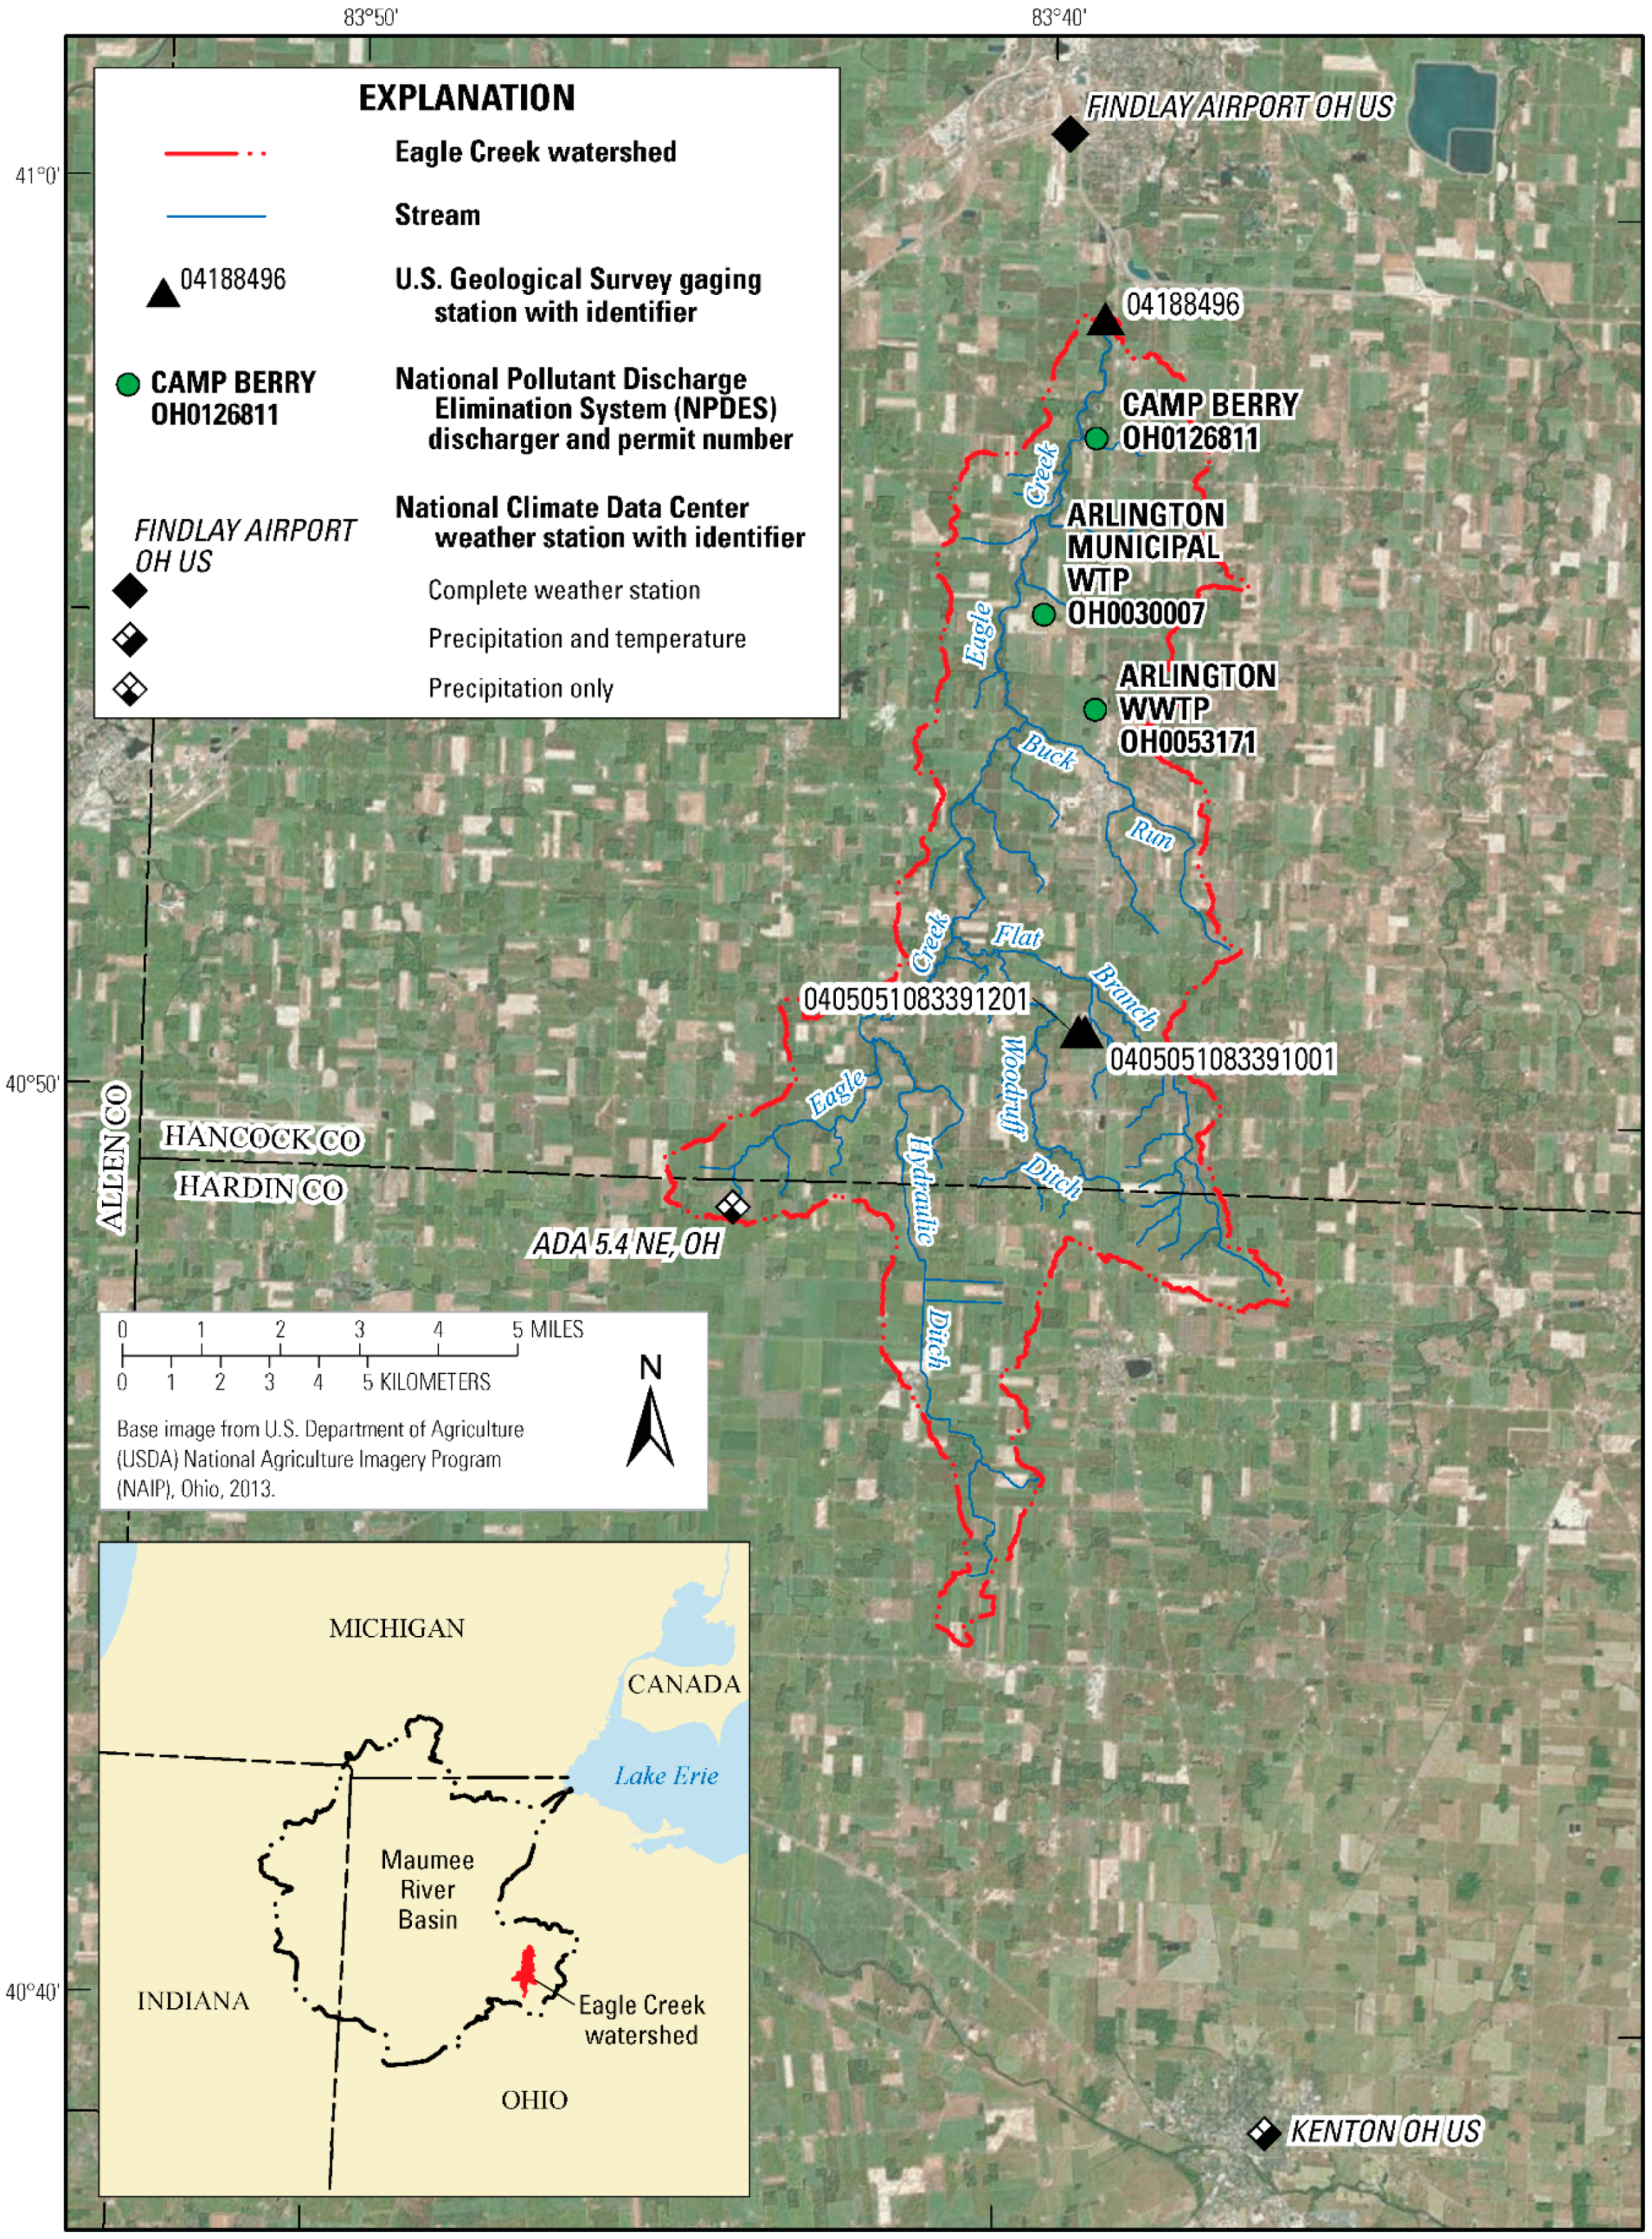
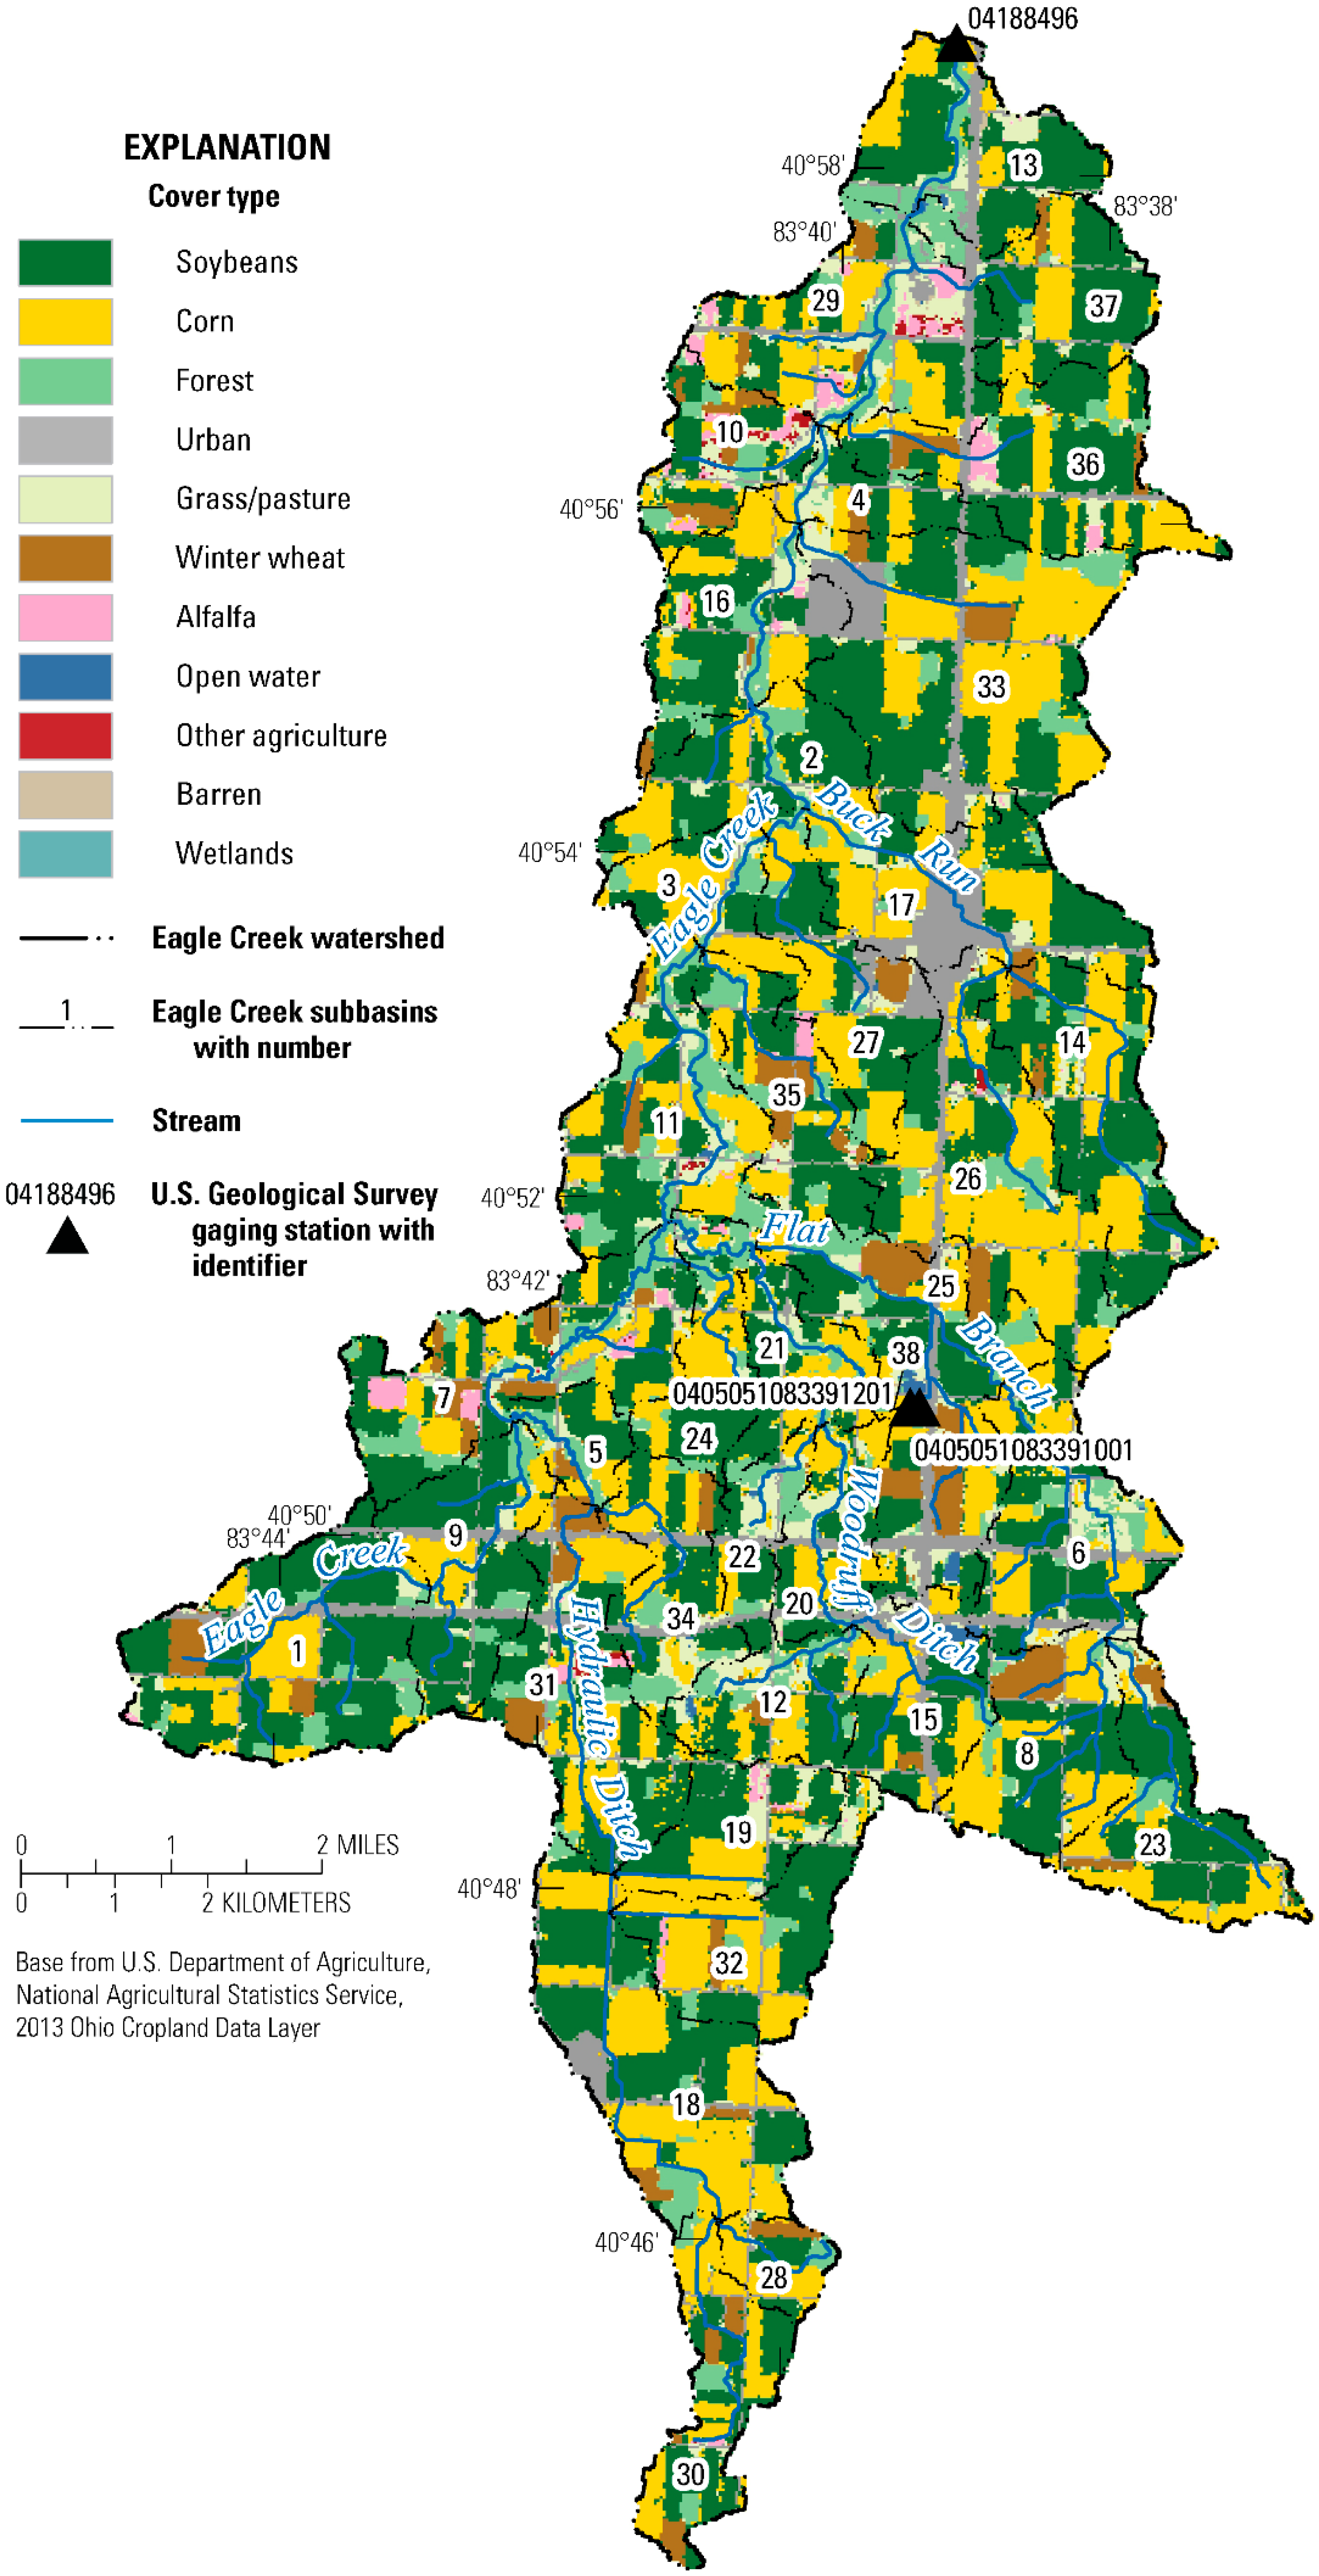
2.1. Study Watershed
2.2. Model Development
2.3. Best Management Practice Implementation
2.4. Scenarios
2.5. Calibration and Validation Procedure
2.6. Calibration and Validation Procedure
3. Results
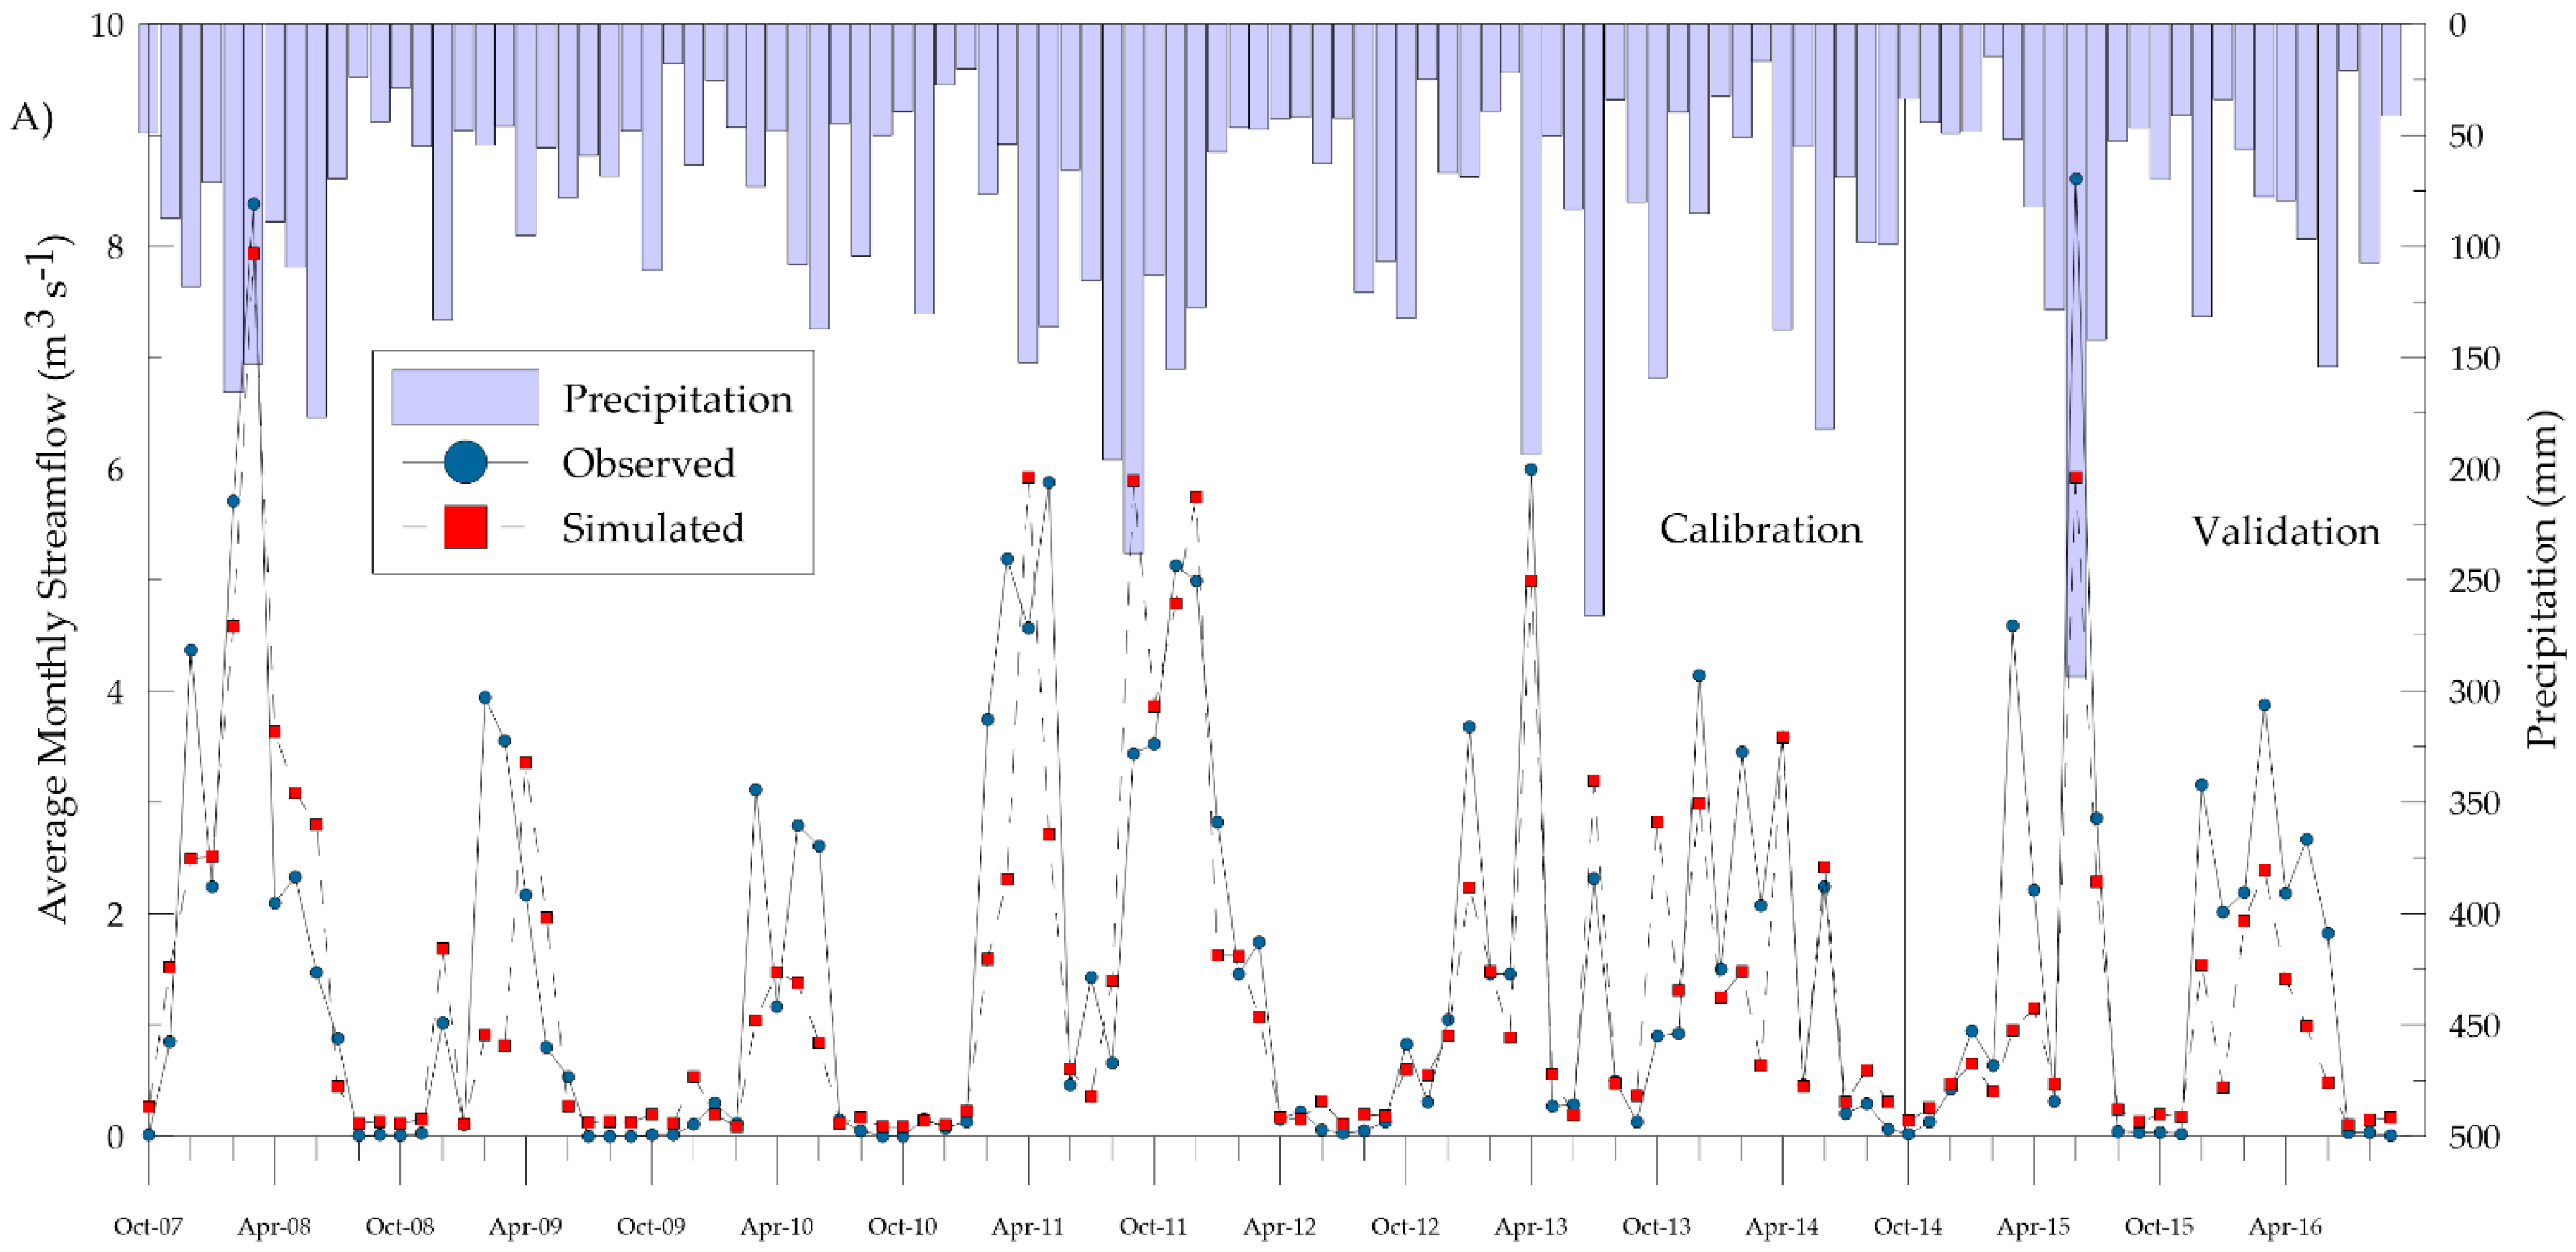
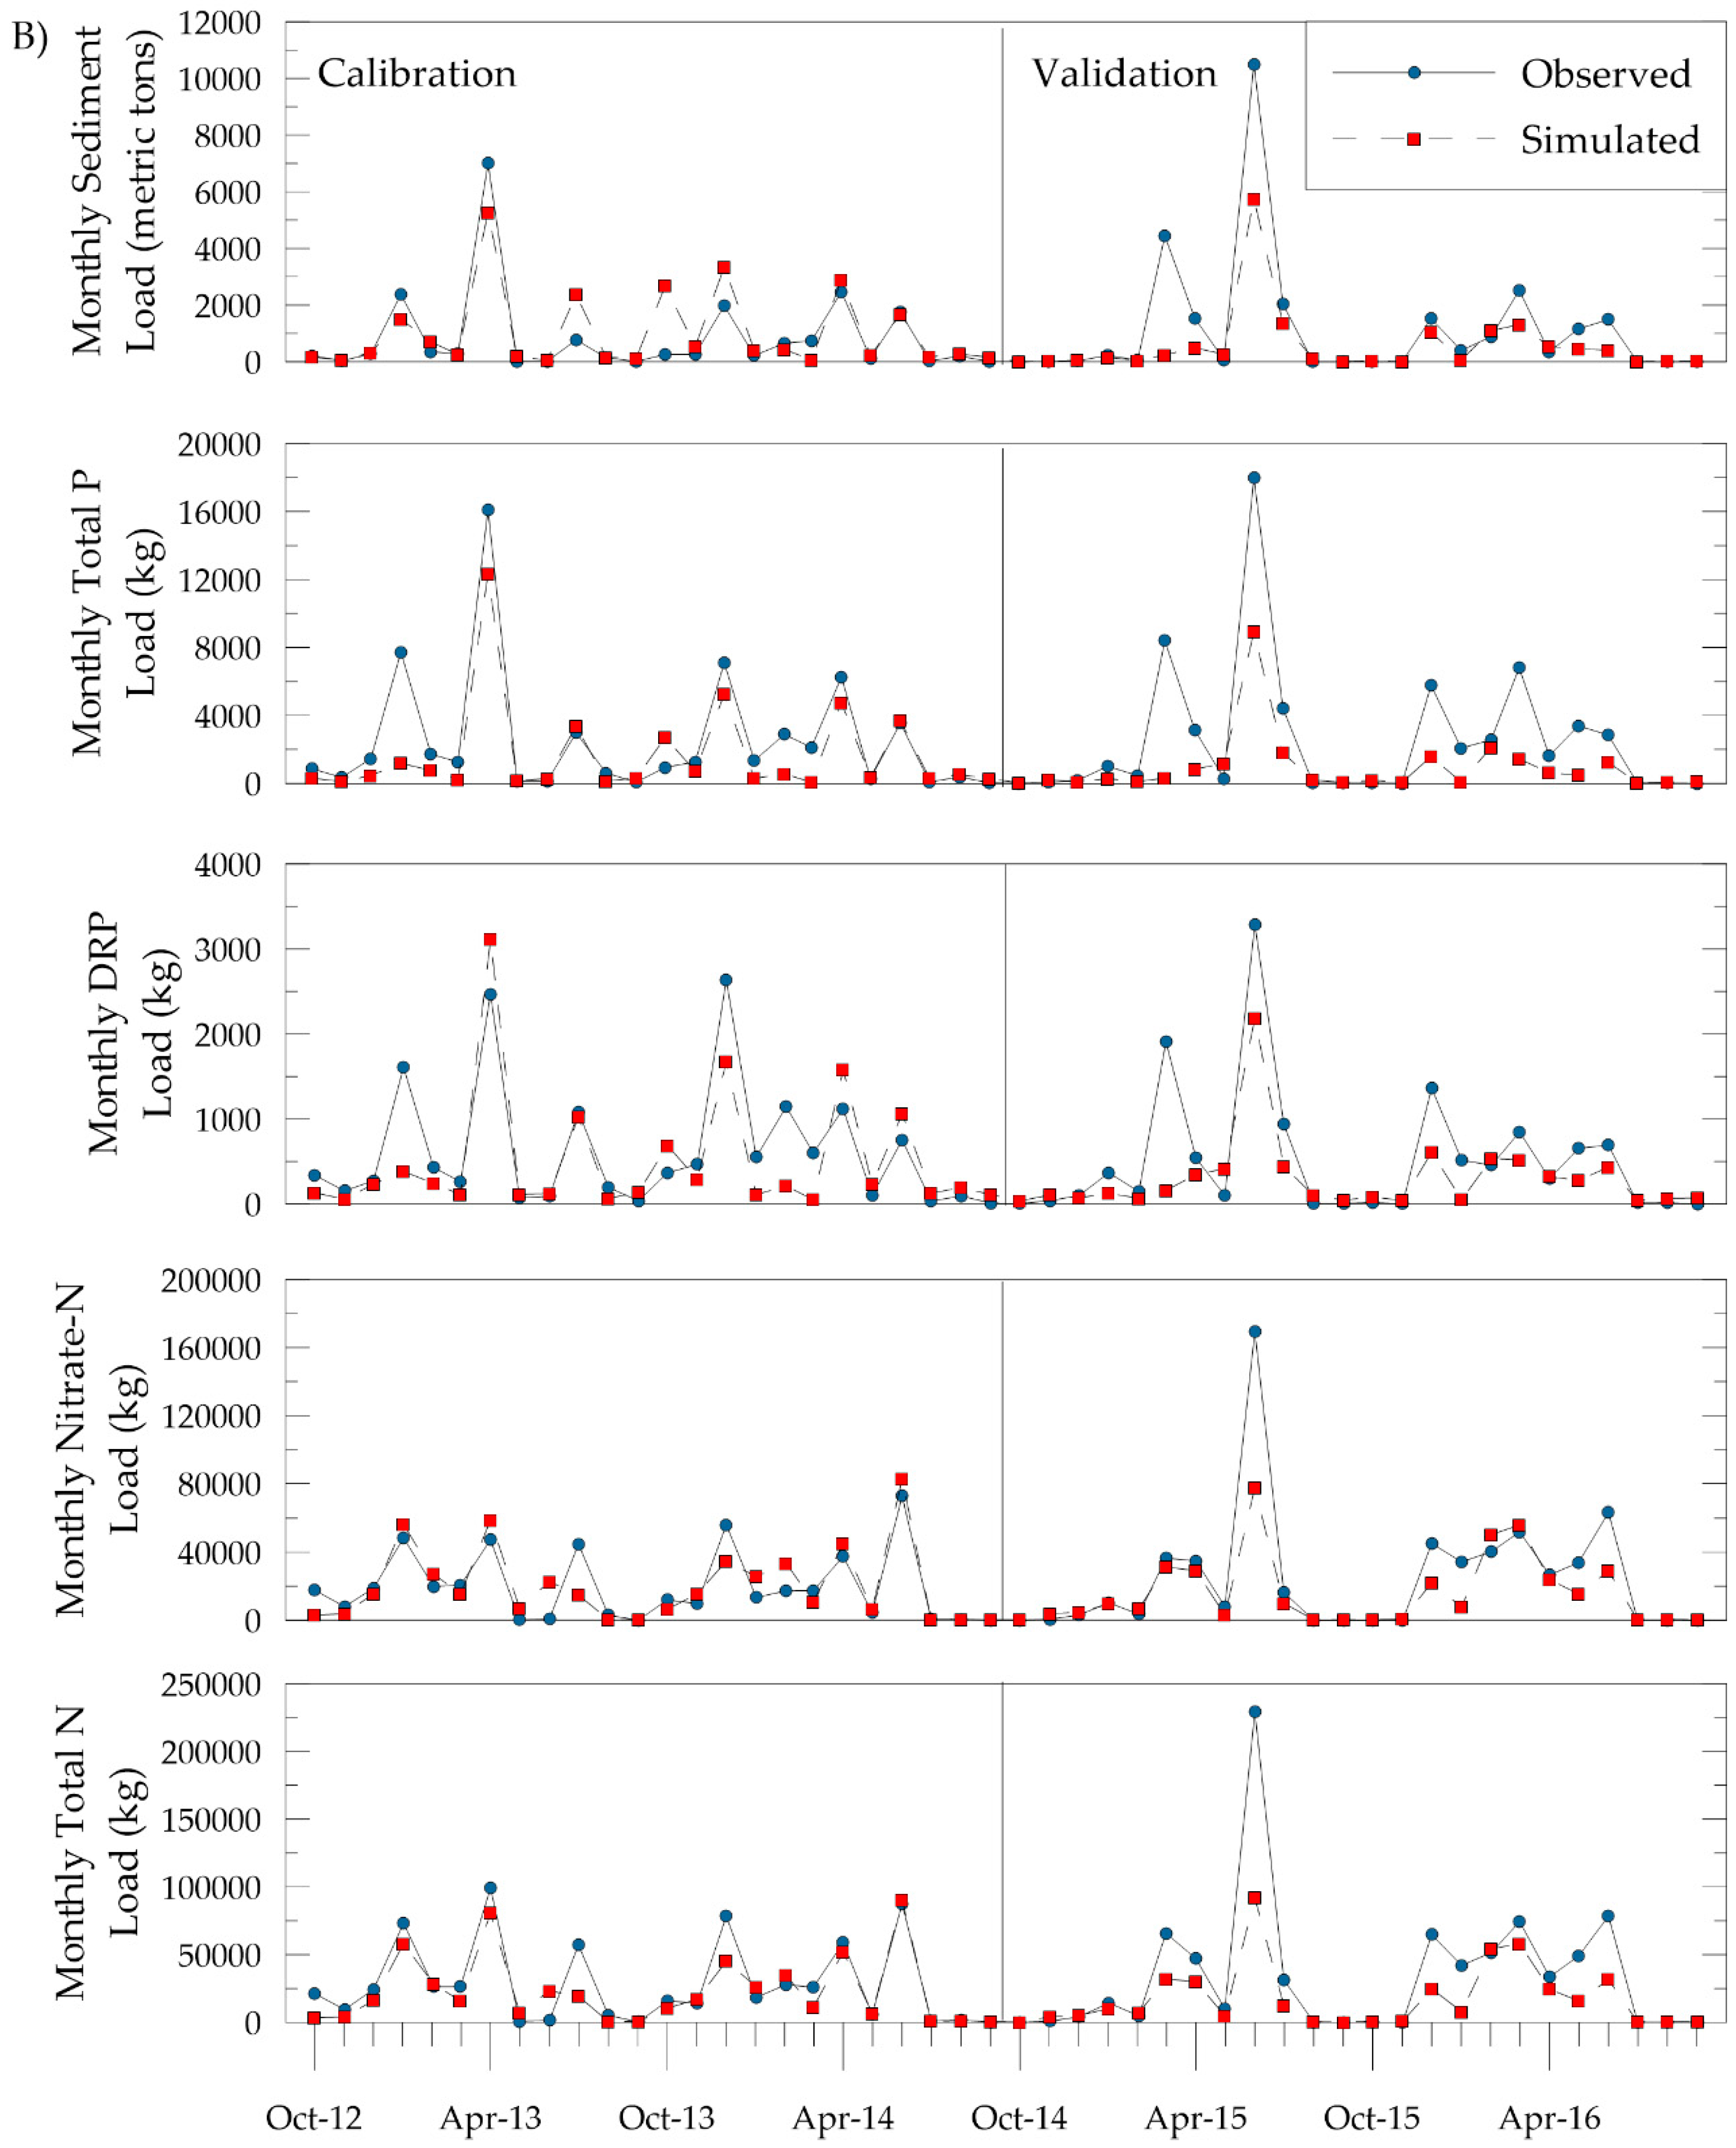
3.1. Calibration and Validation
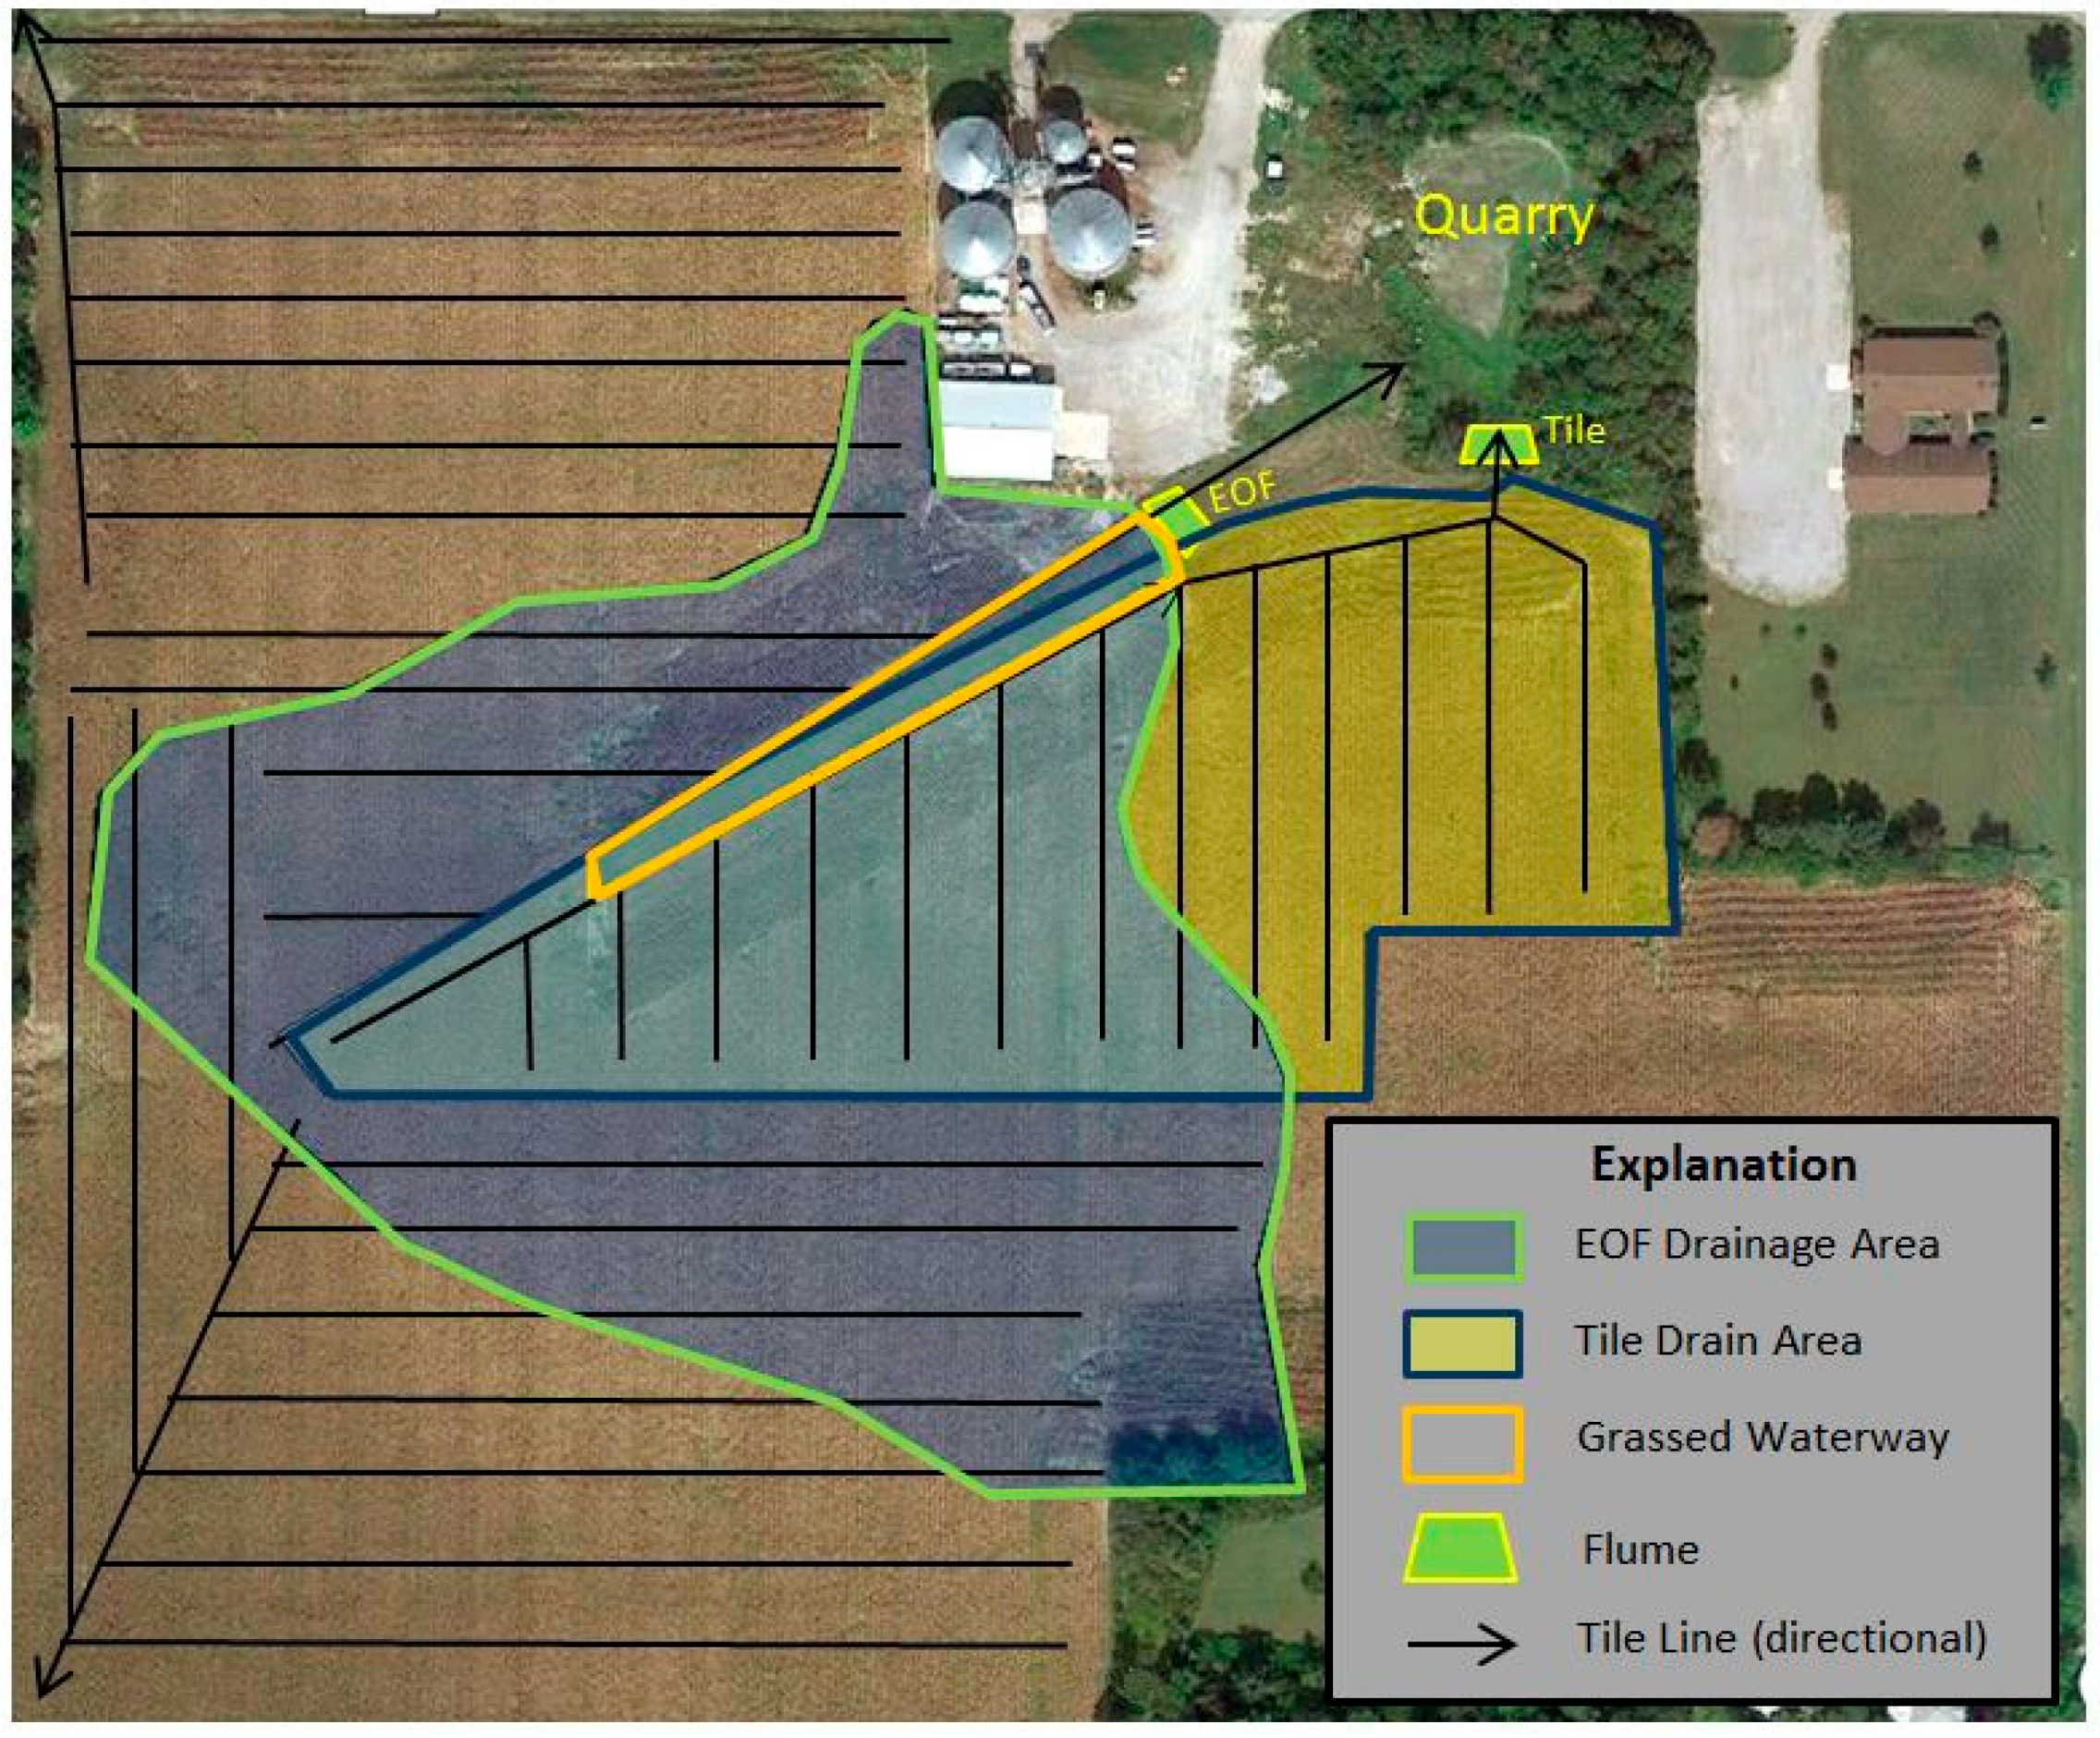
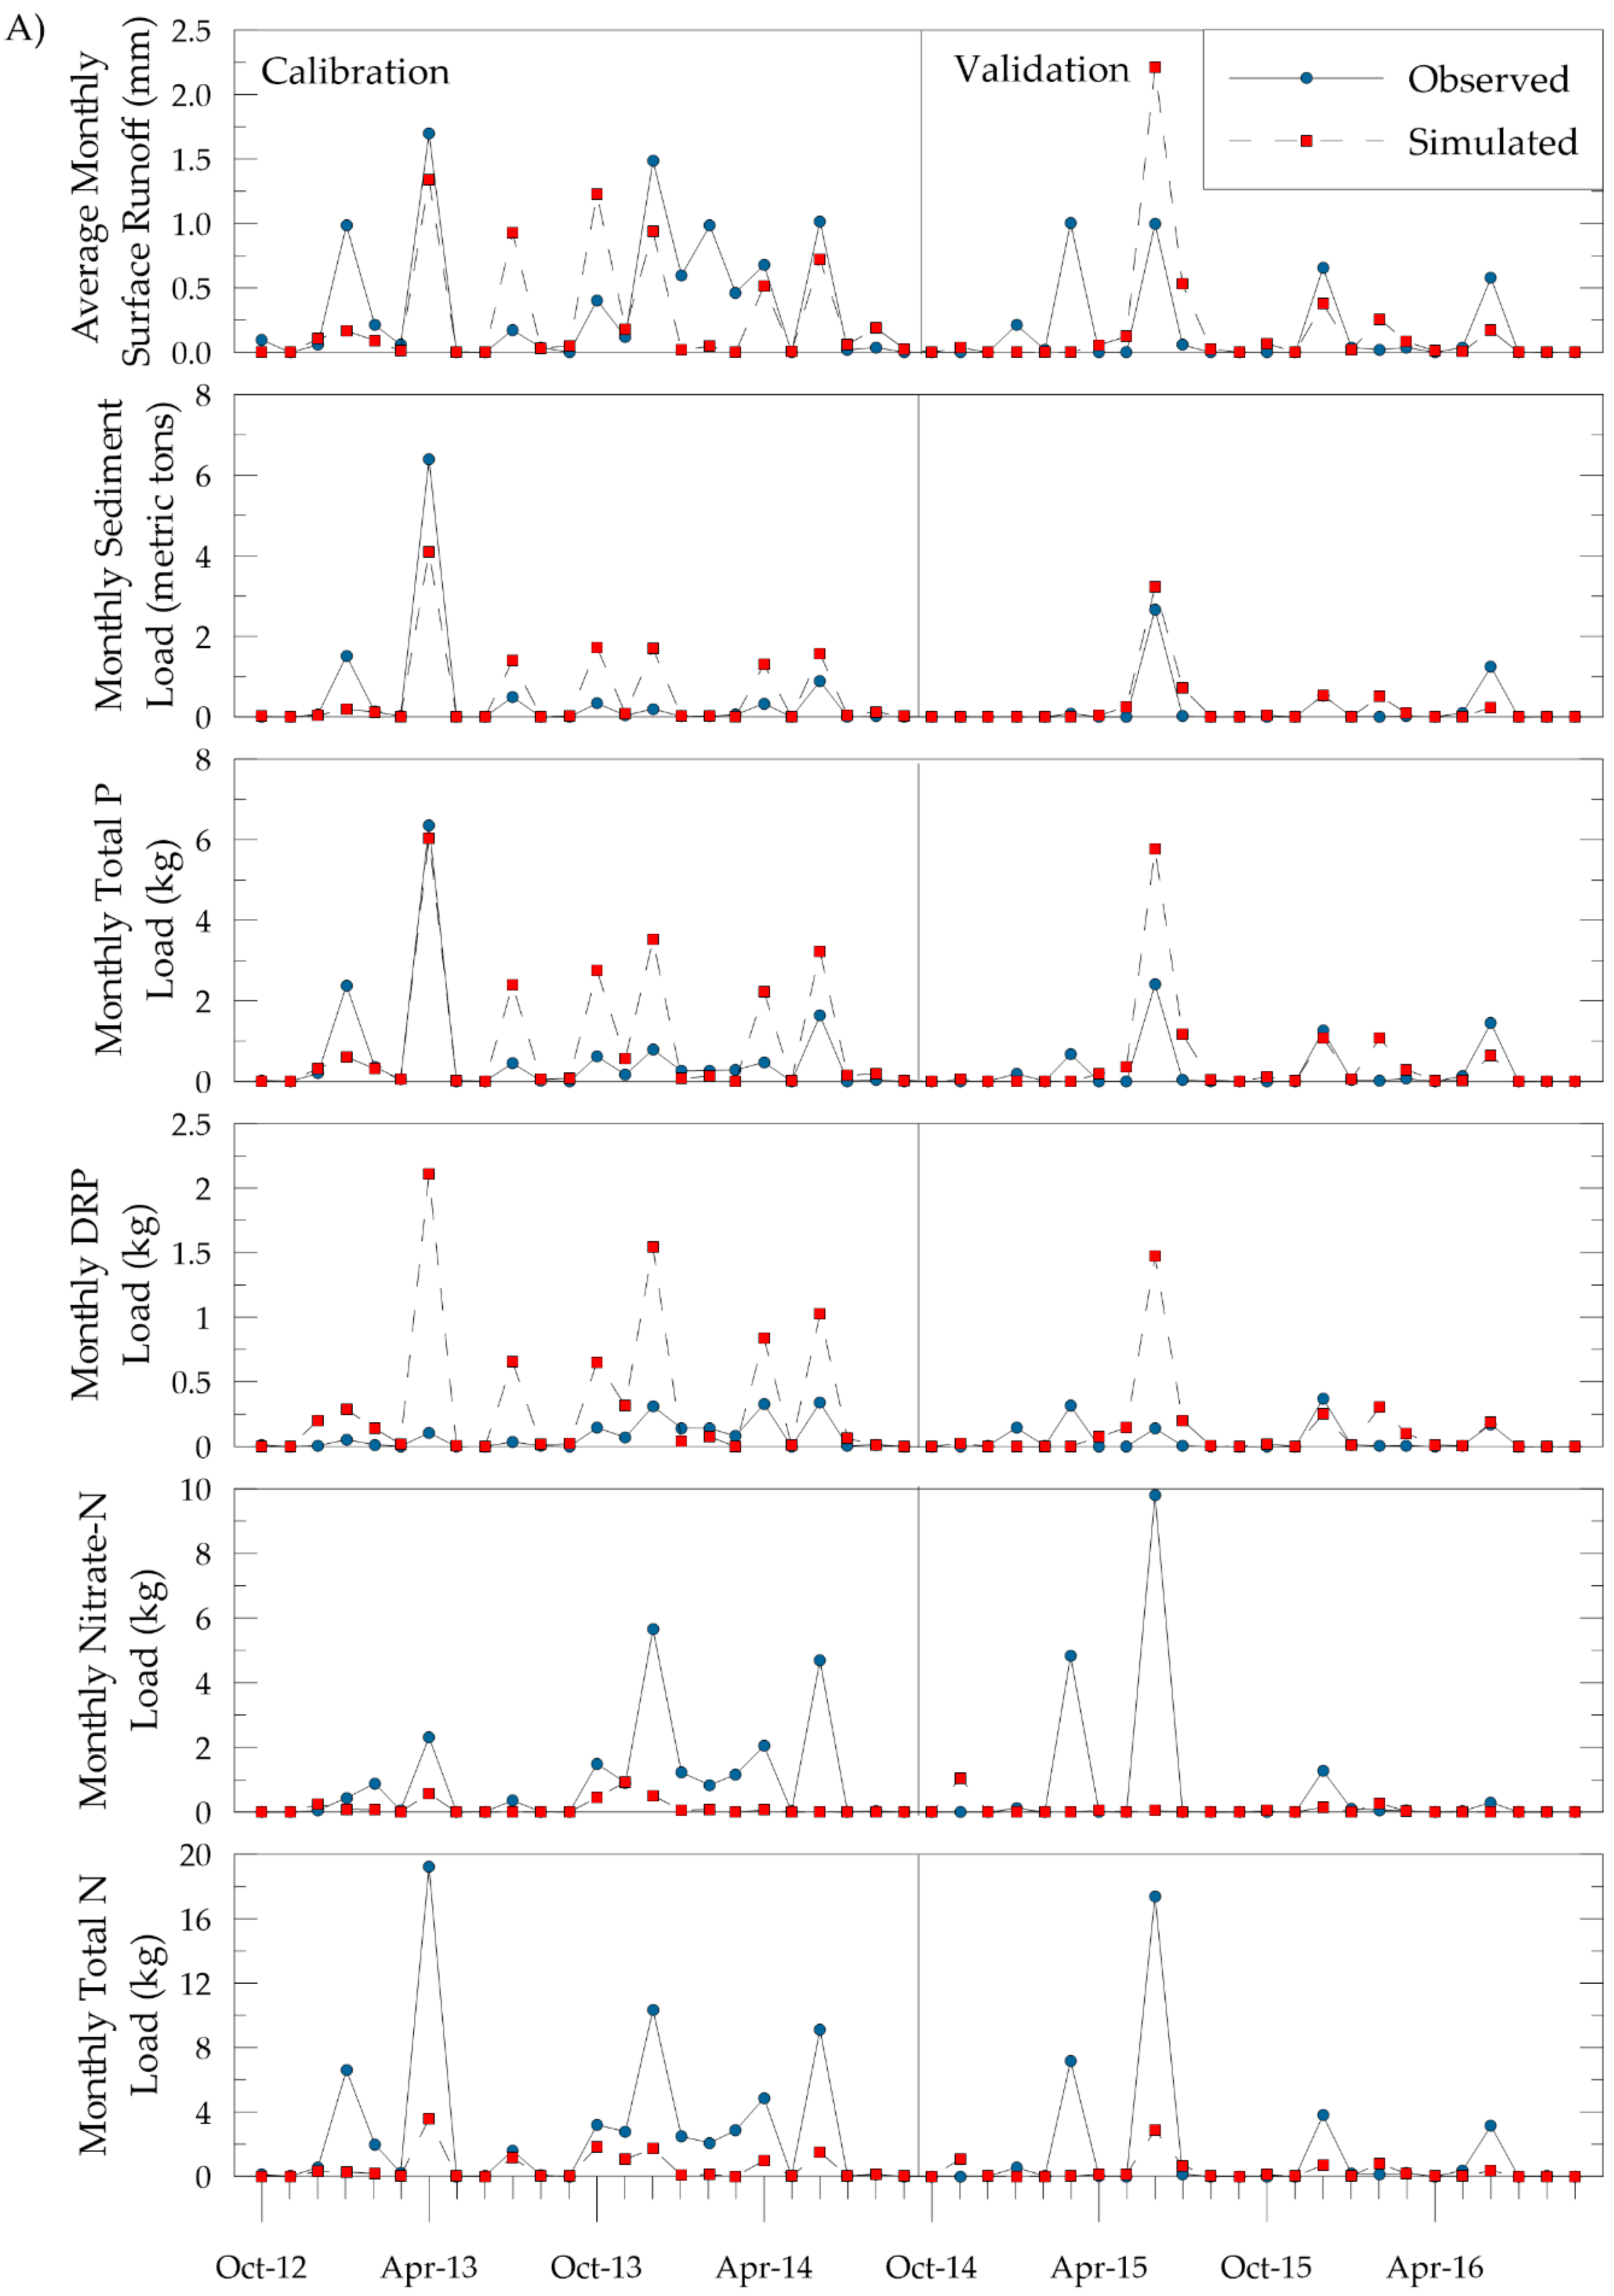
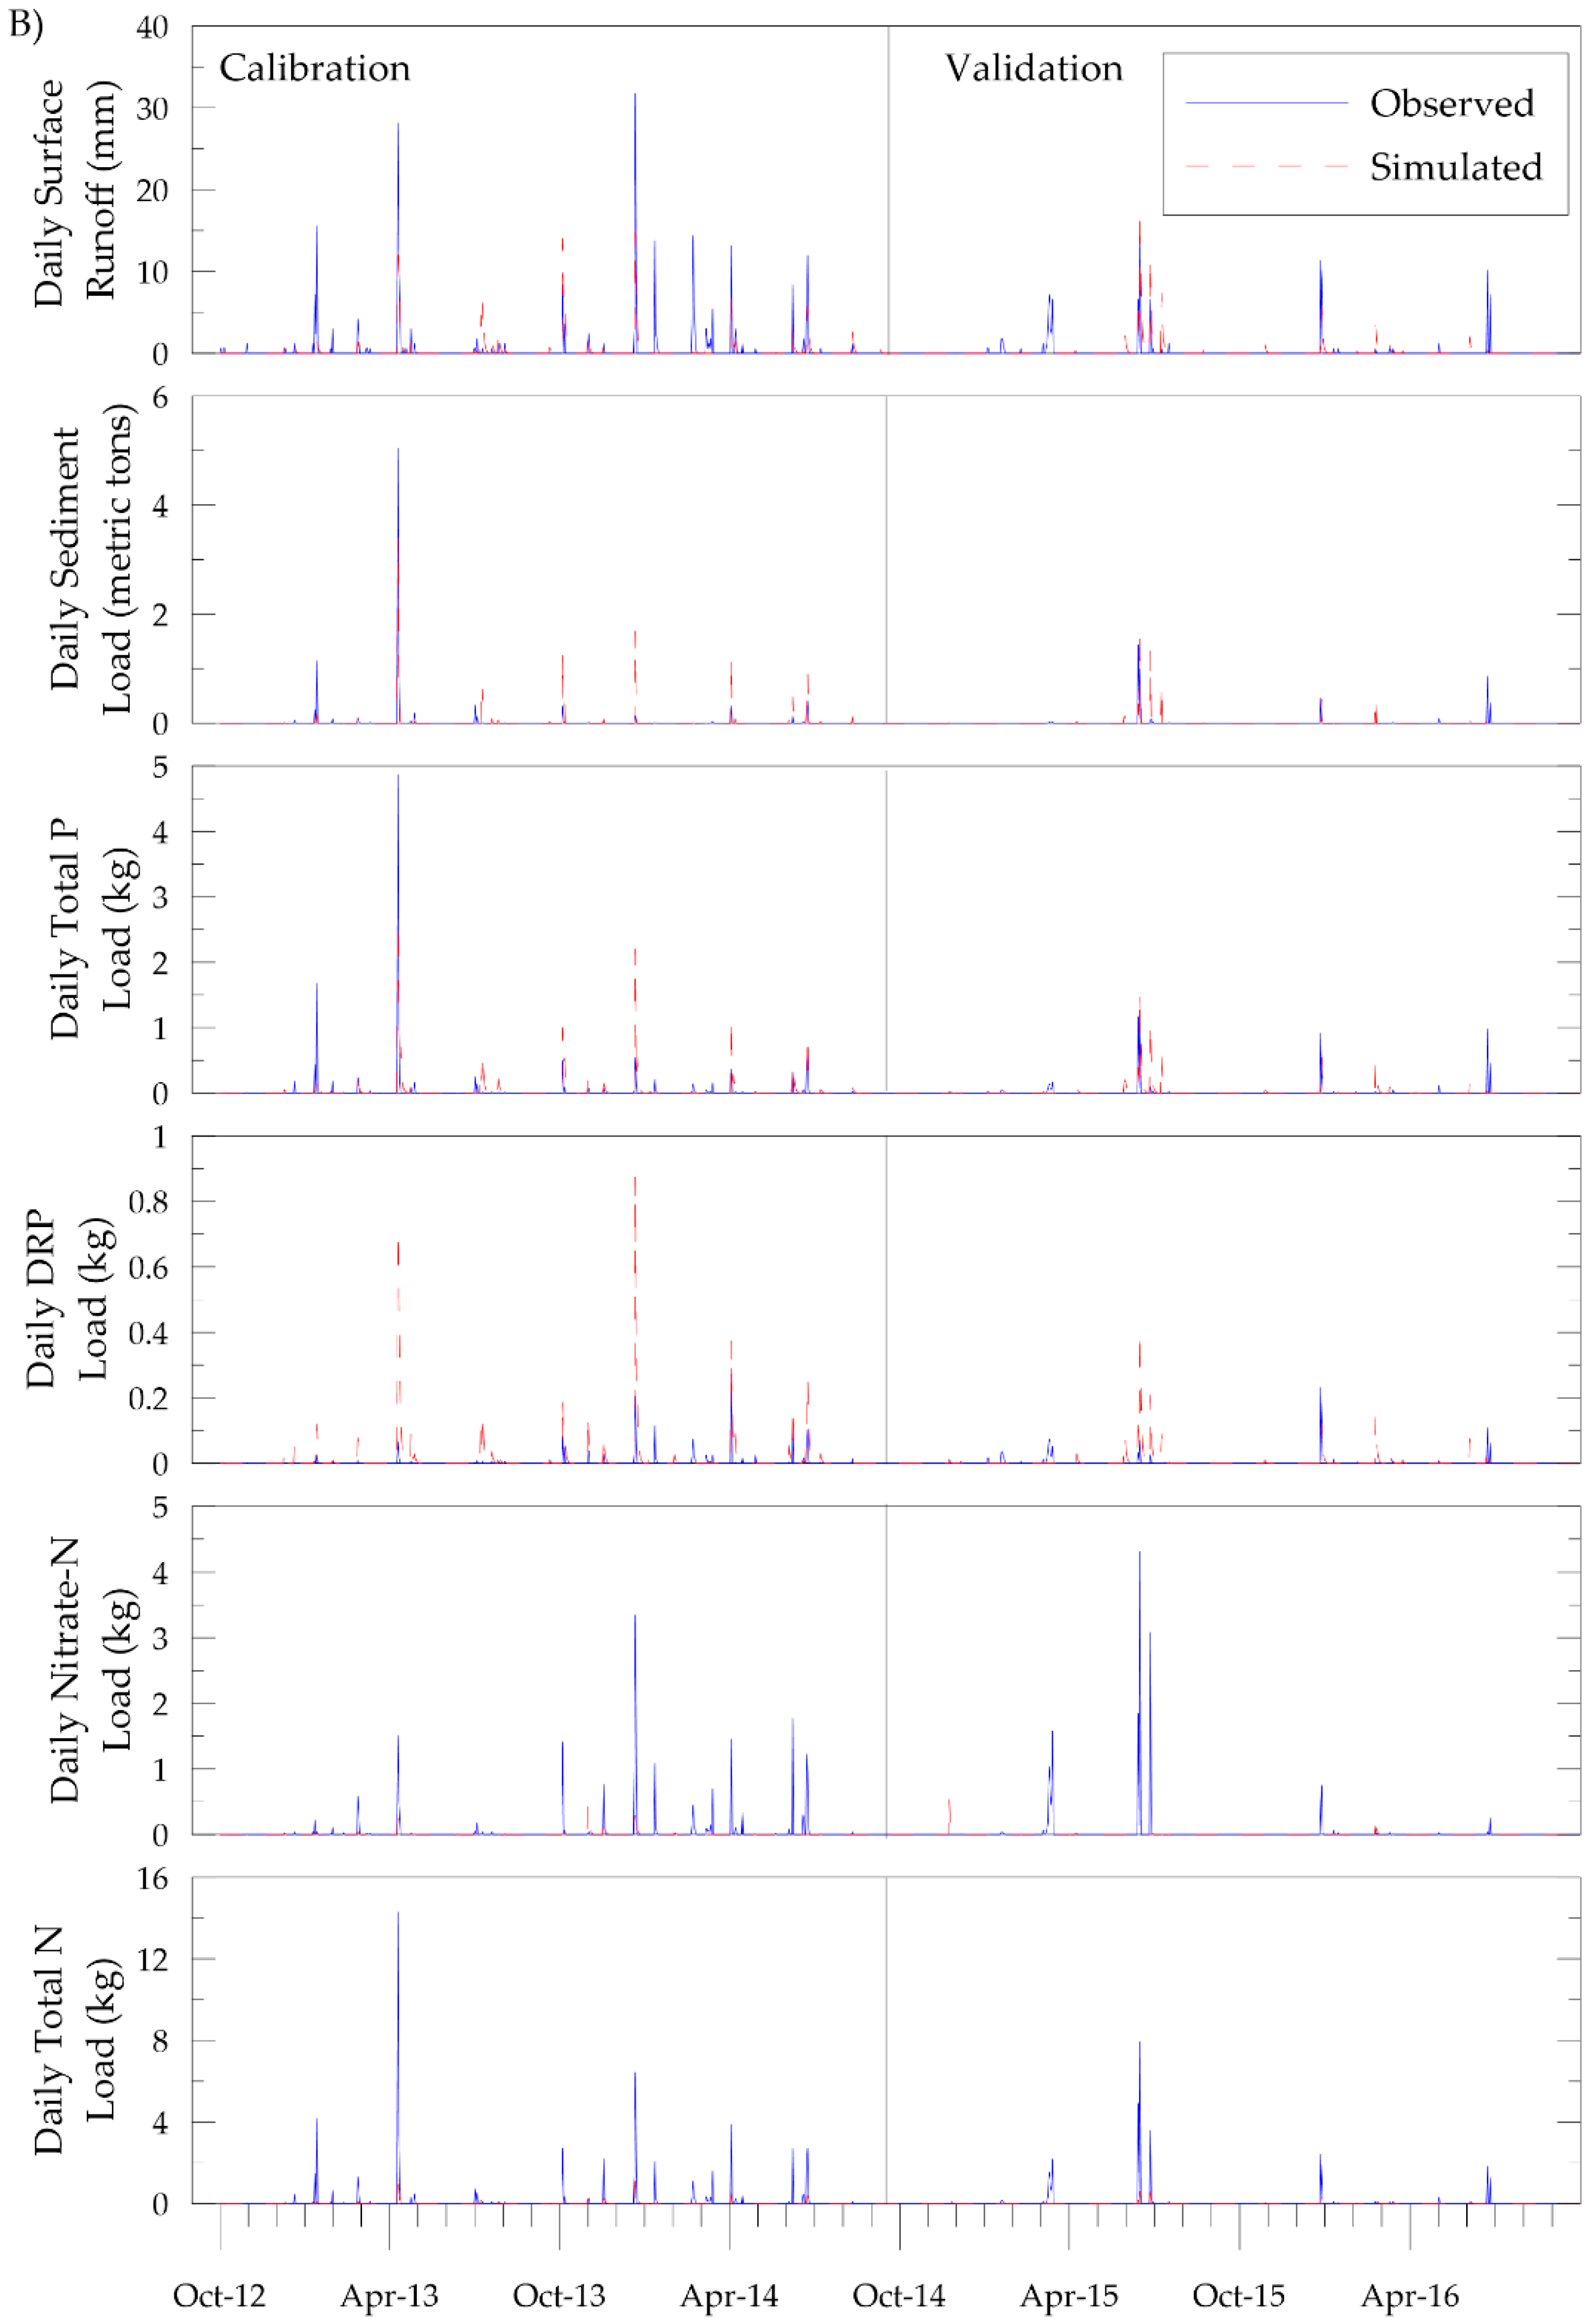
3.1.1. EOF Calibration and Validation
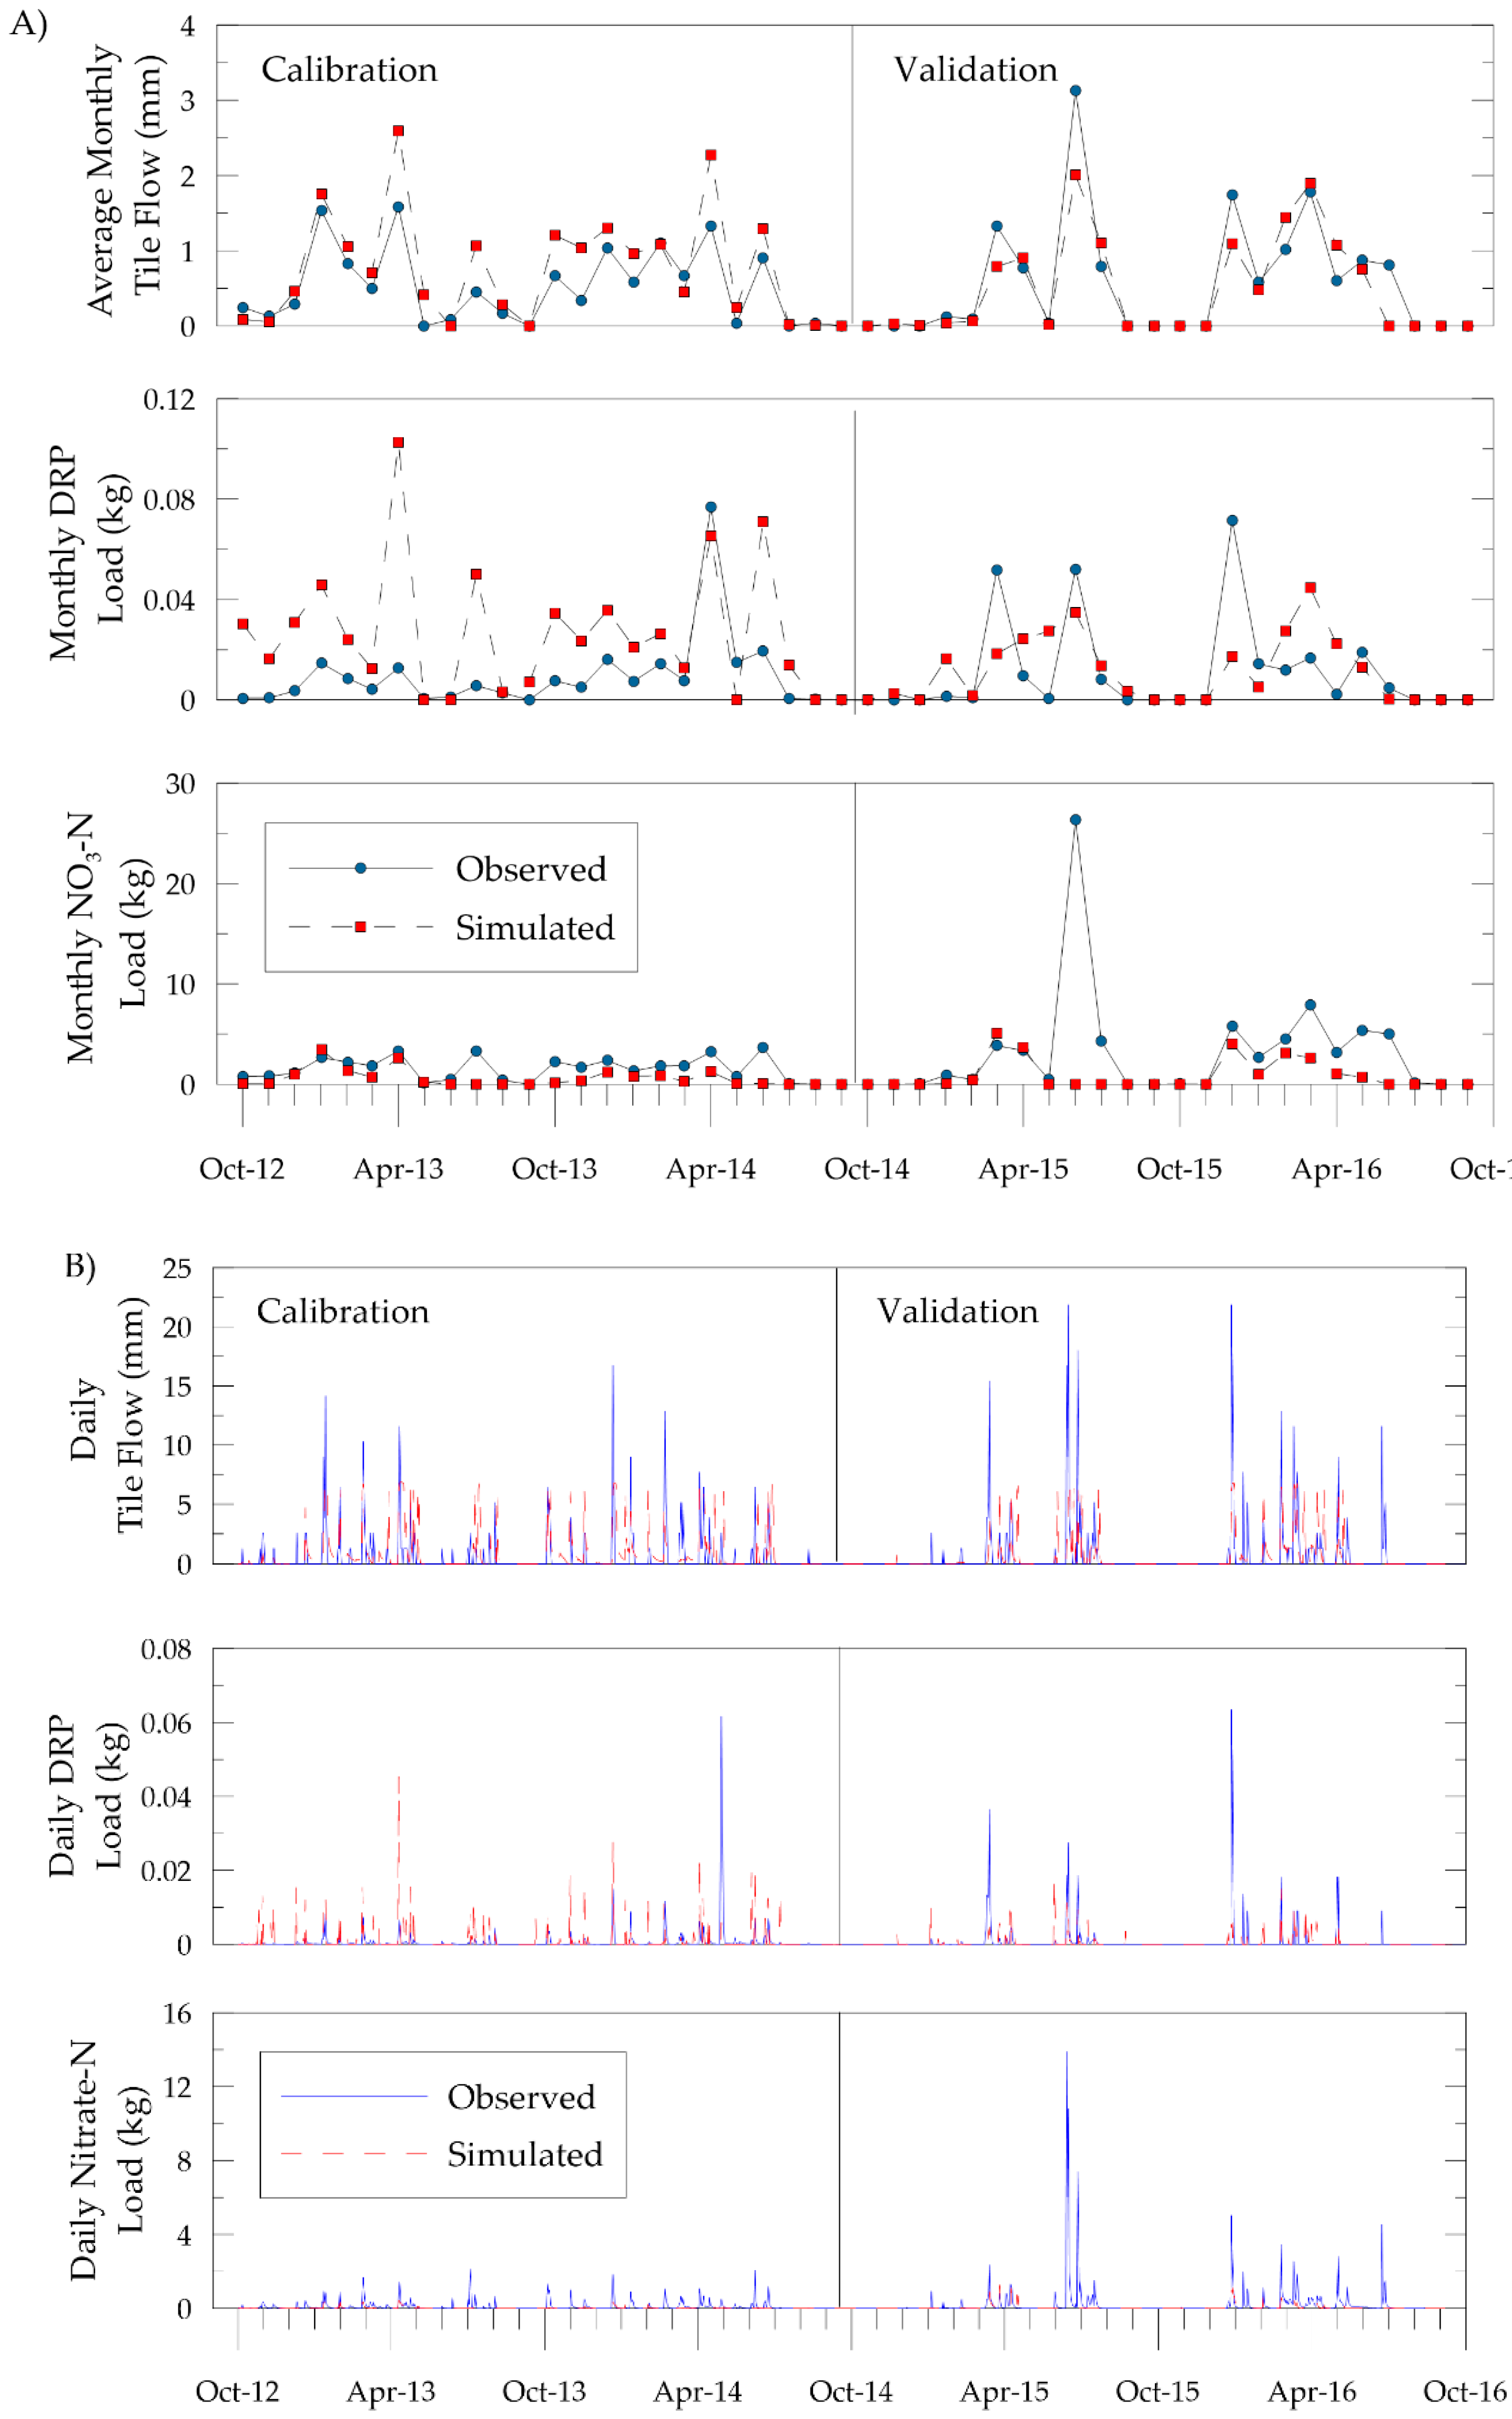
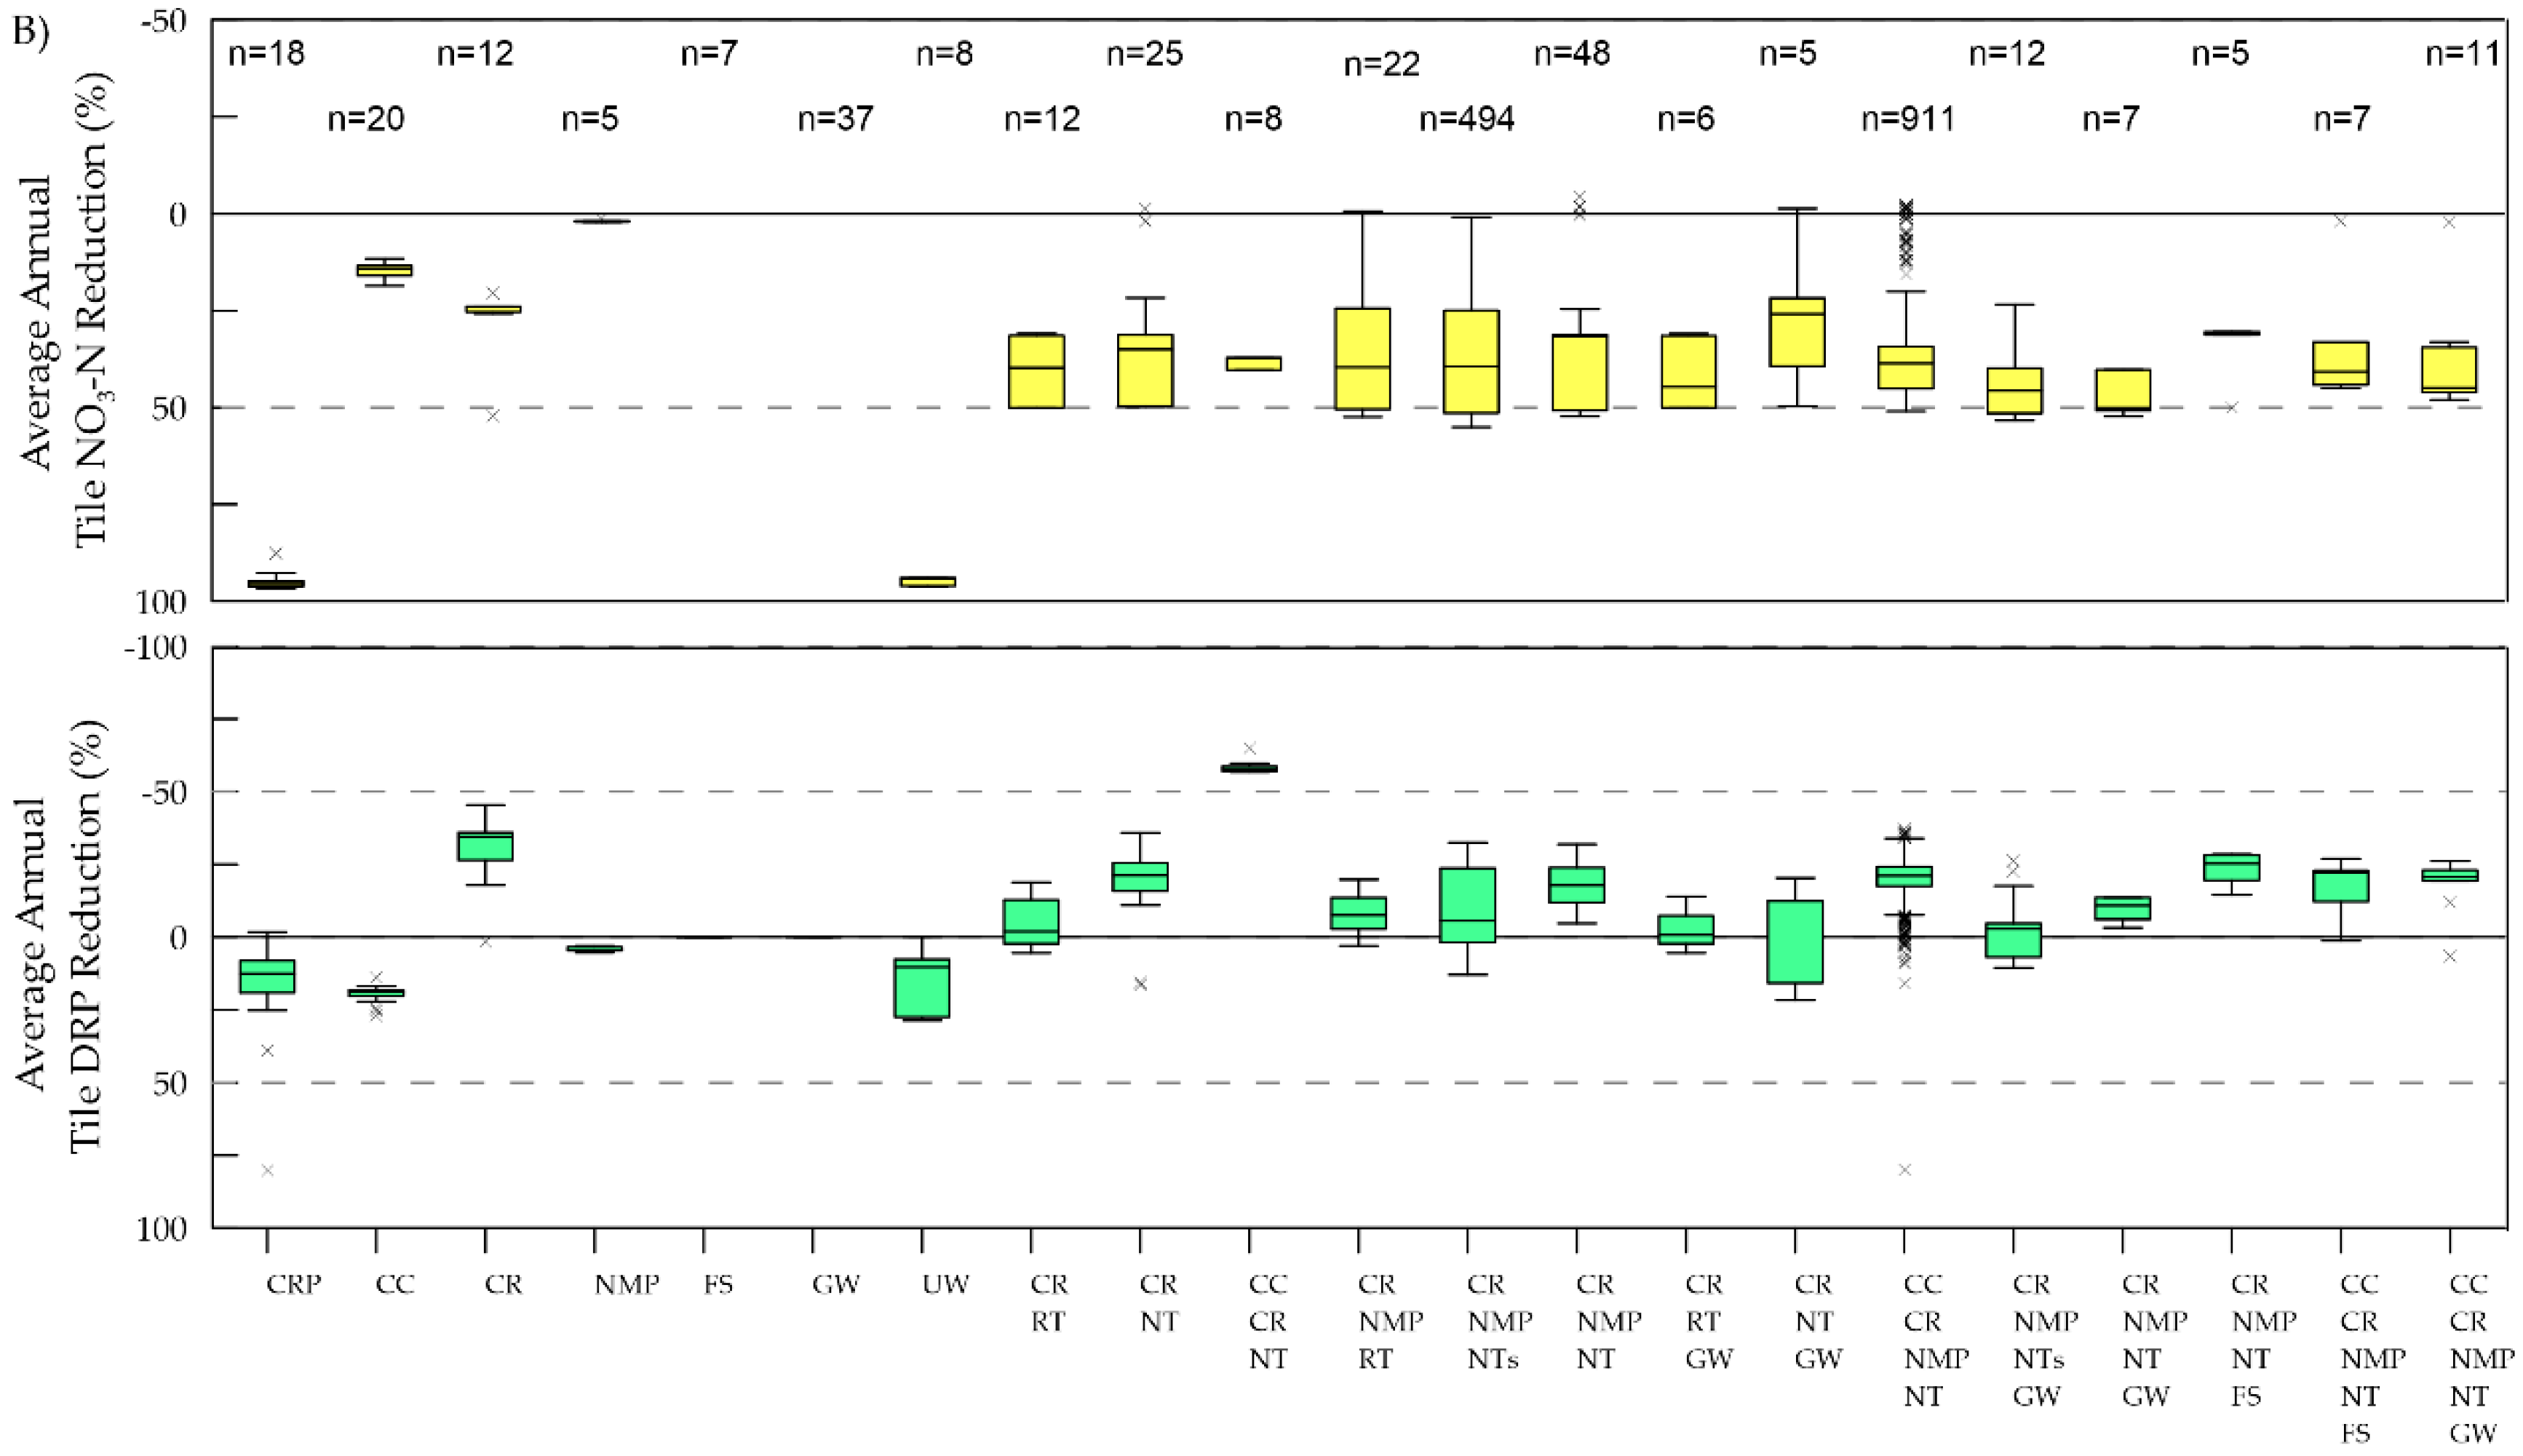
3.1.2. Tile Calibration and Validation
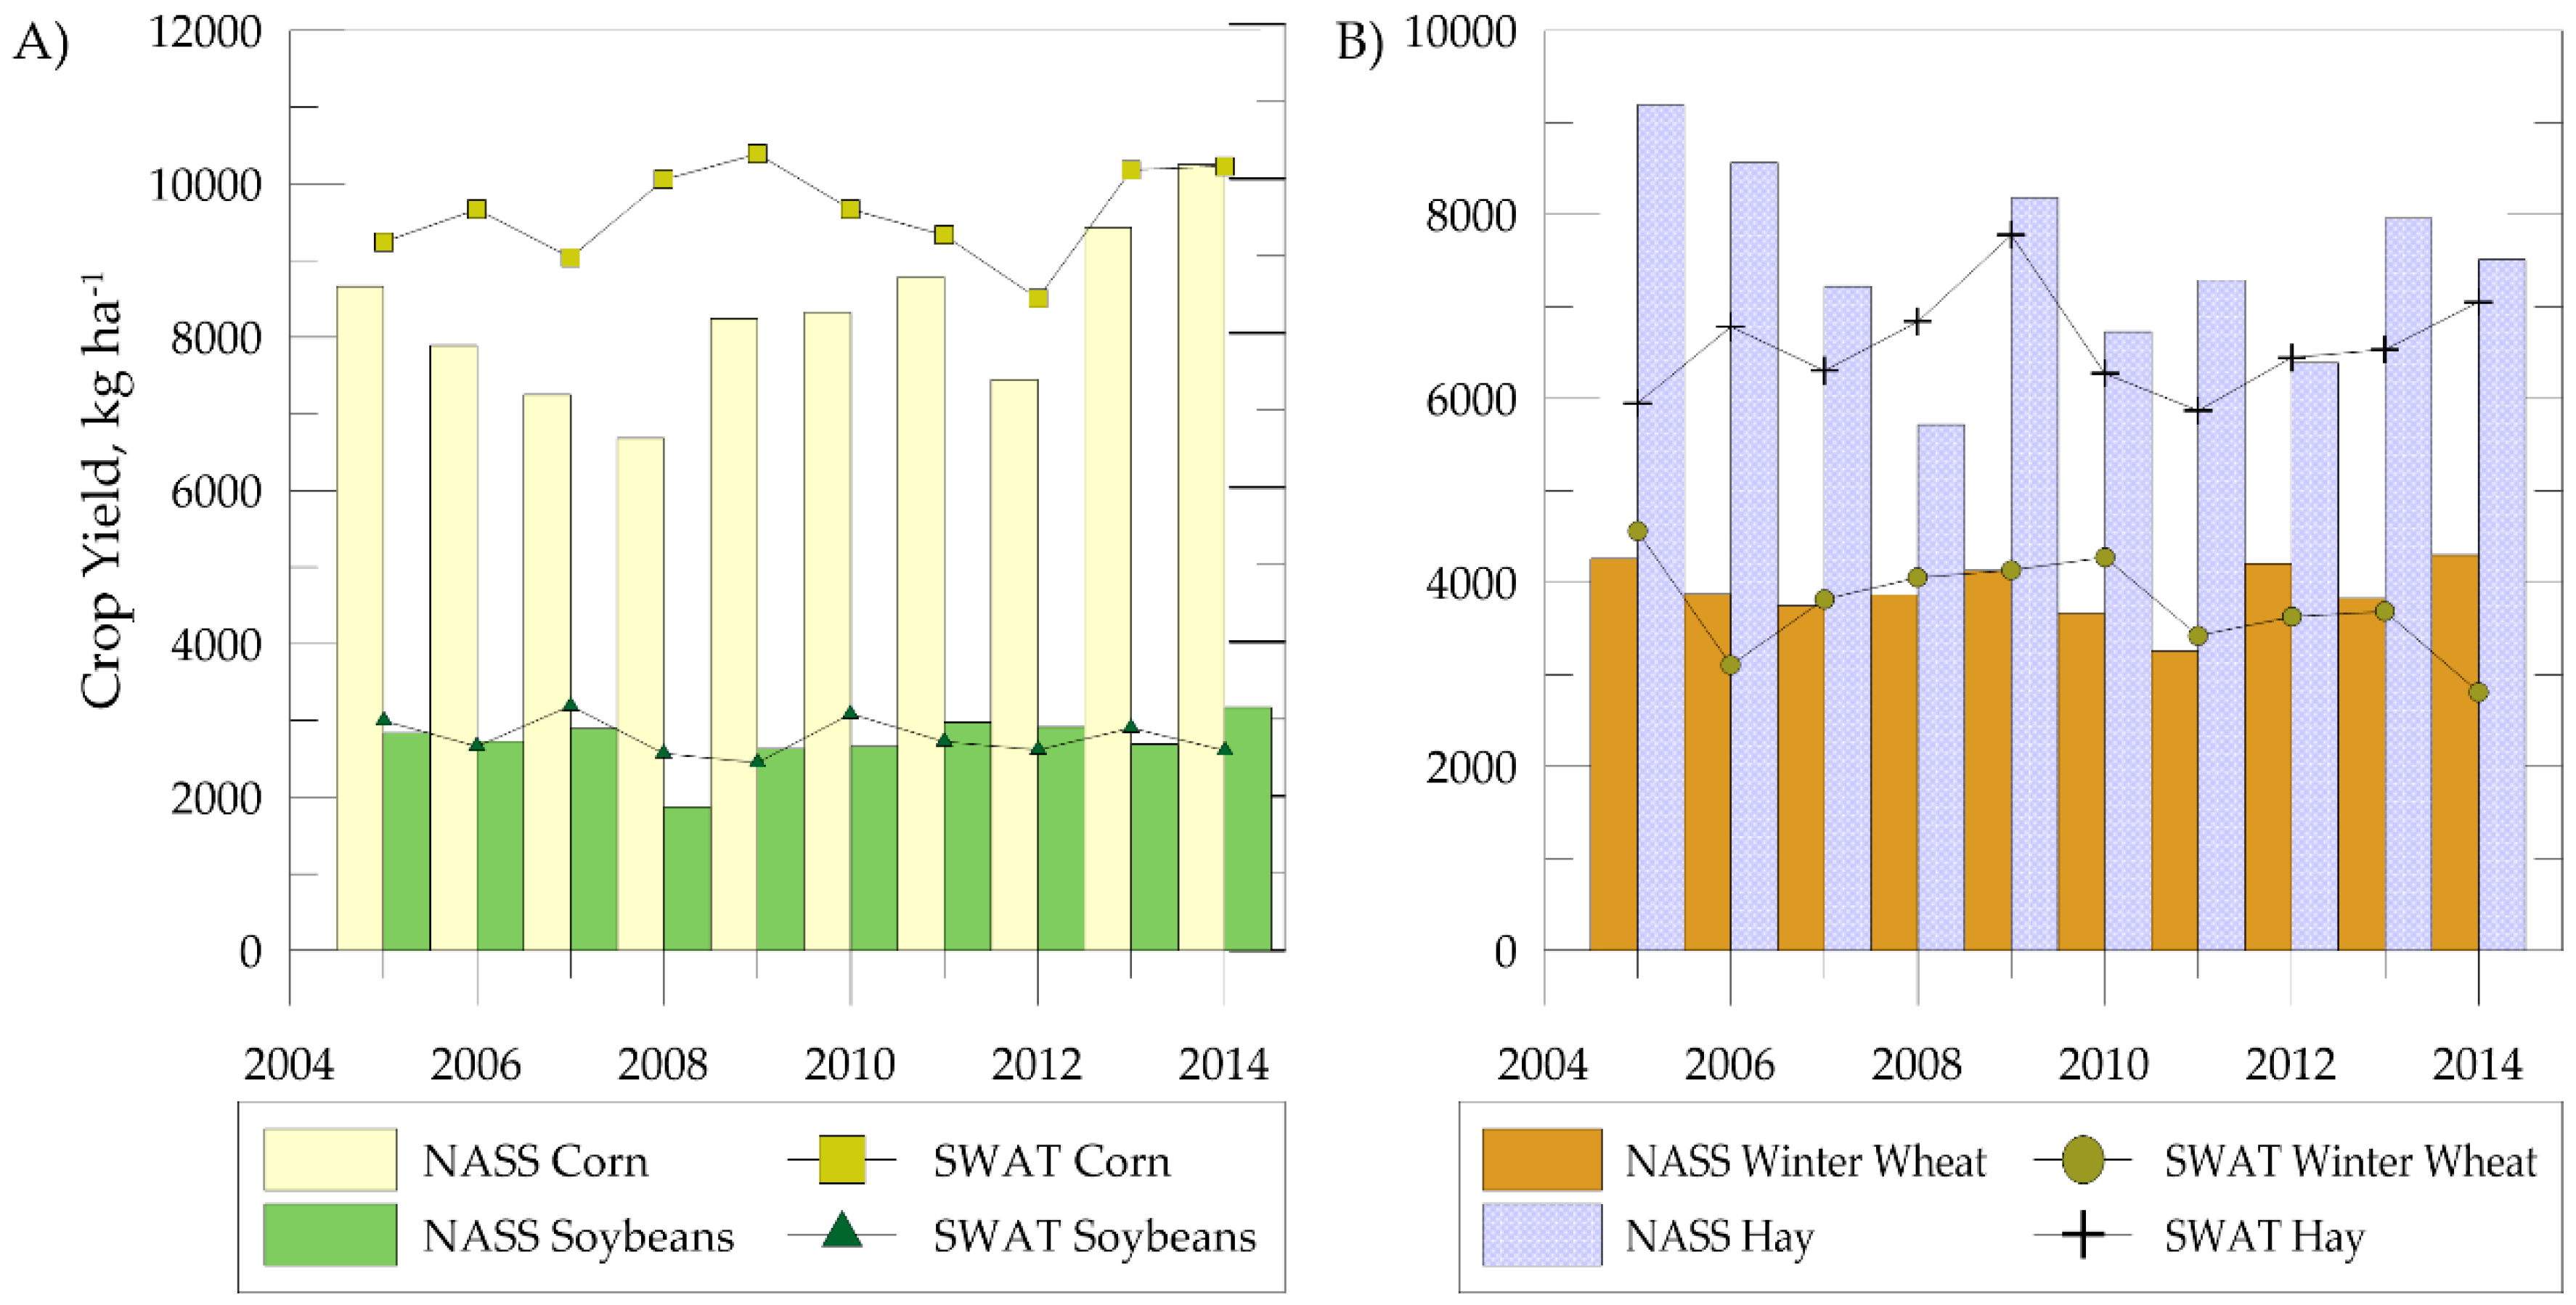
3.1.3. Crop Yield Calibration
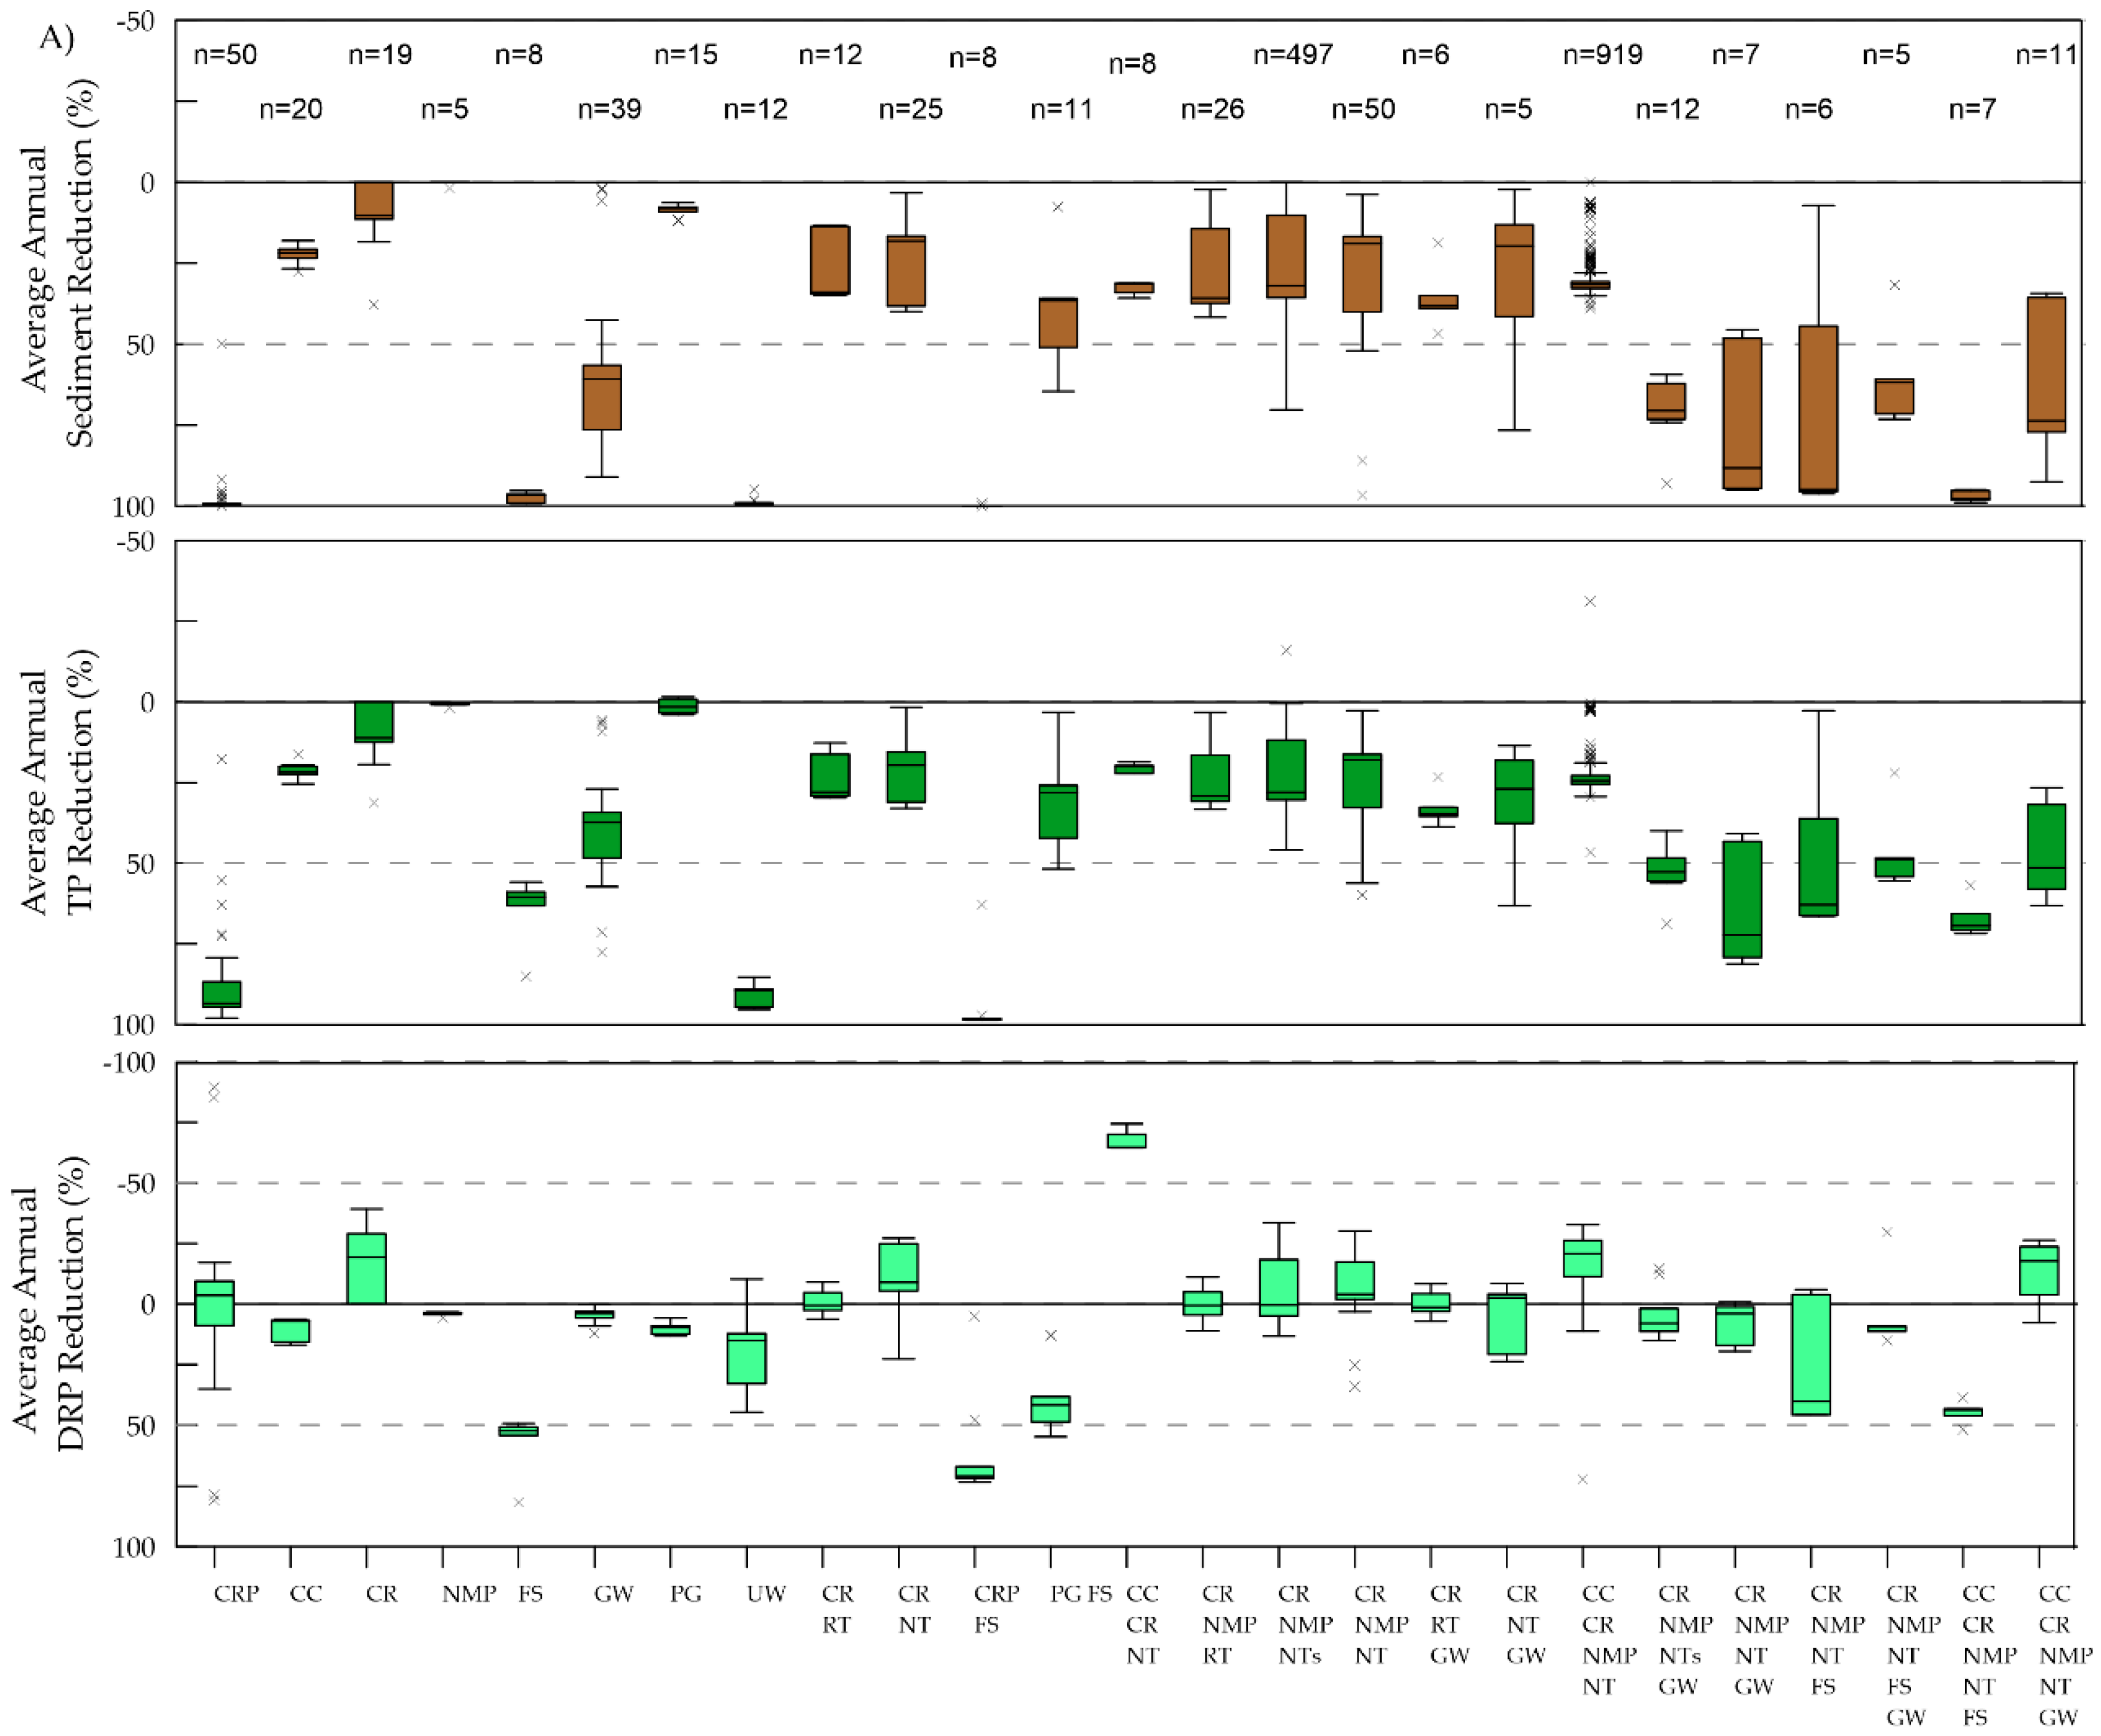
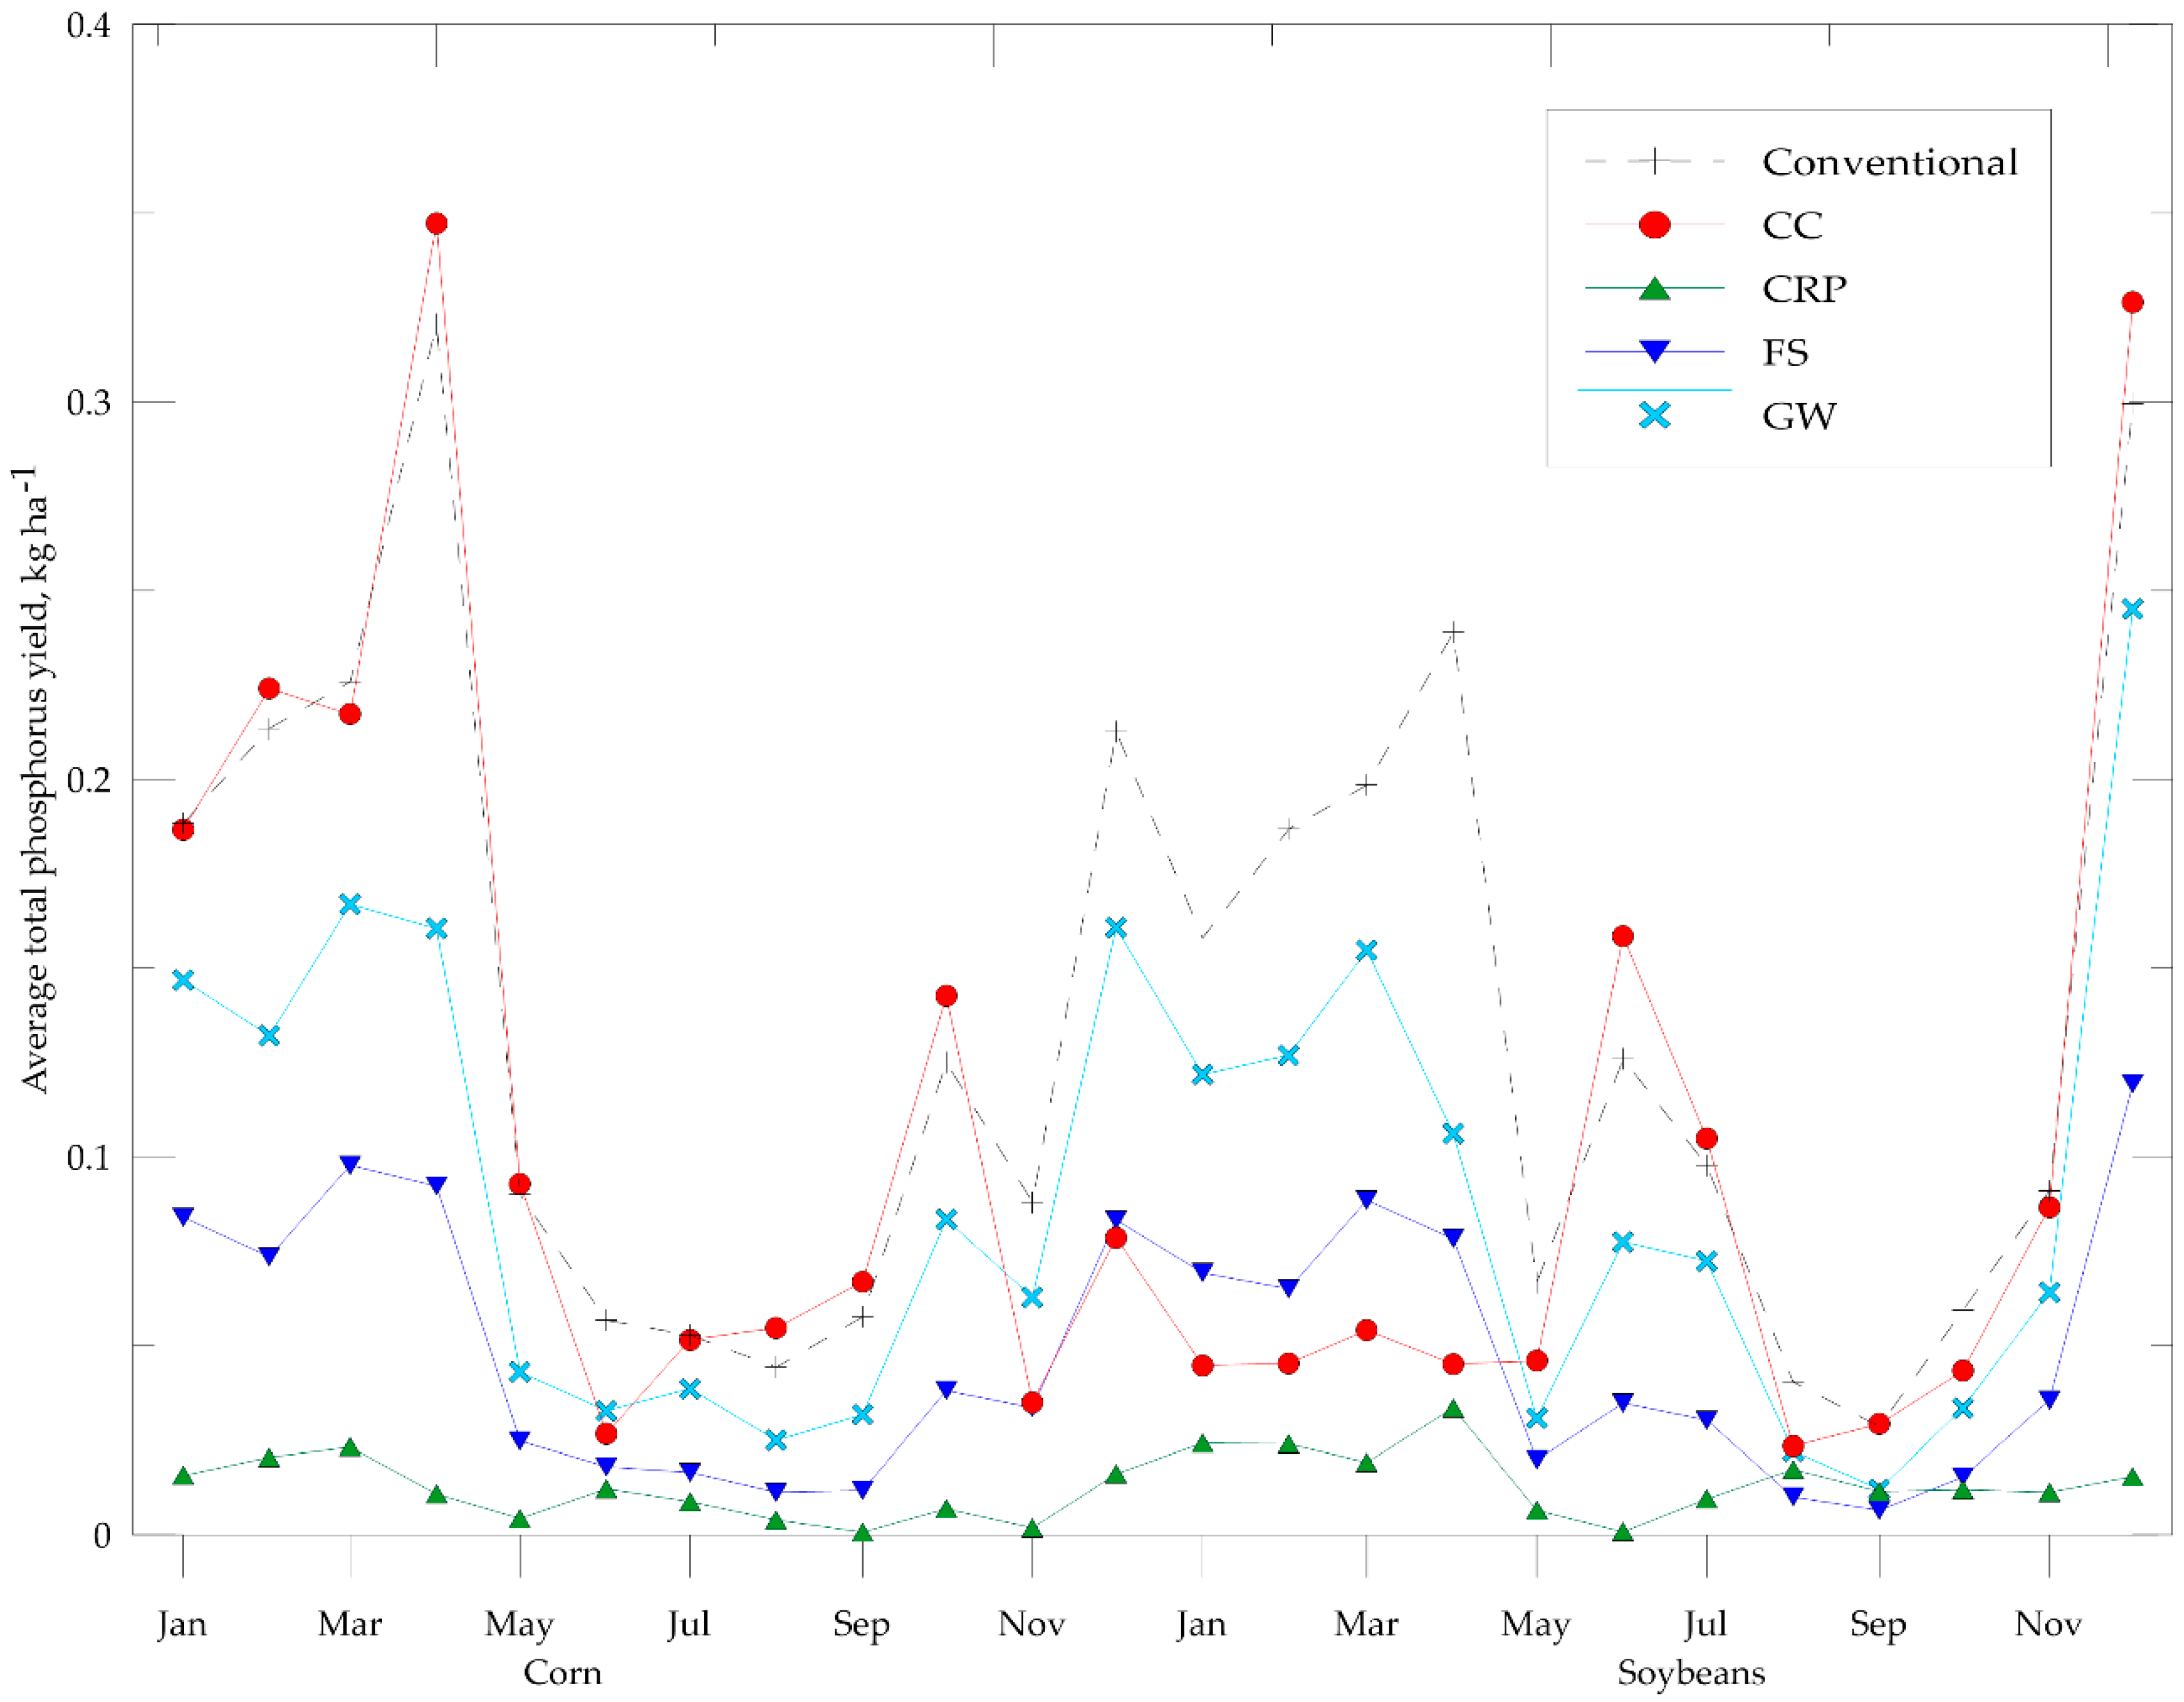
3.2. Effect of Best Management Practices at the Field-Scale
3.3. Effect of Best Management Practices at the Watershed-Scale
4. Discussion
4.1. Model Calibration
4.2. Model Limitations
4.3. Field-Scale and Watershed Scale Model Results
5. Conclusions
Supplementary Materials
Author Contributions
Funding
Acknowledgments
Conflicts of Interest
References
- Jetoo, S.; Grover, V.; Krantzberg, G. The Toledo Drinking Water Advisory: Suggested Application of the Water Safety Planning Approach. Sustainability 2015, 7, 9787–9808. [Google Scholar] [CrossRef] [Green Version]
- Michalak, A.M.; Anderson, E.J.; Beletsky, D.; Boland, S.; Bosch, N.S.; Bridgeman, T.B.; Chaffin, J.D.; Cho, K.; Confesor, R.; Daloglu, I.; et al. Record-setting algal bloom in Lake Erie caused by agricultural and meteorological trends consistent with expected future conditions. Proc. Natl. Acad. Sci. USA 2013, 110, 6448–6452. [Google Scholar] [CrossRef] [PubMed] [Green Version]
- Scavia, D.; David-Allan, J.; Arend, K.K.; Bartell, S.; Beletsky, D.; Bosch, N.S.; Brandt, S.B.; Briland, R.D.; Daloǧlu, I.; DePinto, J.V.; et al. Assessing and addressing the re-eutrophication of Lake Erie: Central basin hypoxia. J. Great Lakes Res. 2014, 40, 226–246. [Google Scholar] [CrossRef]
- Smith, D.R.; King, K.W.; Williams, M.R. What is causing the harmful algal blooms in Lake Erie? J. Soil Water Conserv. 2015, 70, 27A–29A. [Google Scholar] [CrossRef] [Green Version]
- Duncan, E.W.; King, K.W.; Williams, M.R.; LaBarge, G.; Pease, L.A.; Smith, D.R.; Fausey, N.R. Linking Soil Phosphorus to Dissolved Phosphorus Losses in the Midwest. Agric. Environ. Lett. 2017, 2. [Google Scholar] [CrossRef] [Green Version]
- De Pinto, J.V.; Young, T.C.; Meilroy, L.M. Great Lakes water quality improvement. Environ. Sci. Technol. 1986, 20, 752–759. [Google Scholar] [CrossRef] [PubMed]
- International Joint Commission (IJC). Great Lakes Water Quality Agreement 2012: Annex 4—Nutrients. Available online: http://www.ijc.org/en_/Great_Lakes_Water_Quality (accessed on 11 November 2017).
- Dolan, D.M.; Chapra, S.C. Great Lakes total phosphorus revisited: 1. Loading analysis and update (1994–2008). J. Great Lakes Res. 2012, 38, 730–740. [Google Scholar] [CrossRef]
- U.S. Environmental Protection Agency (EPA). Great Lakes Restoration Initiative (GLRI) Action Plan II. Available online: https://www.glri.us/actionplan/pdfs/glri-action-plan-2.pdf (accessed on 19 September 2017).
- Komiskey, M.J.; Bruce, J.L.; Velkoverh, J.L.; Merriman-Hoehne, K.R. Great Lakes Restoration Initiative: Edge-of-Field Monitoring. Available online: http://wim.usgs.gov/geonarrative/glri-eof/ (accessed on 20 December 2016).
- Her, Y.; Frankenberger, J.; Chaubey, I.; Srinivasan, R. Threshold Effects in HRU Definition of the Soil and Water Assessment Tool. Trans. ASABE 2015, 58, 367–378. [Google Scholar]
- Merriman, K.R.; Gitau, M.W.; Chaubey, I. A Tool for Estimating Best Management Practice Effectiveness in Arkansas. Appl. Eng. Agric. 2009, 25, 199–213. [Google Scholar] [CrossRef]
- Effects of Conservation Practice Adoption on Cultivated Cropland Acres in Western Lake Erie Basin, 2003-06 and 2012; U.S. Department of Agriculture, Natural Conservation Service: Washington, DC, USA, 2016.
- Runkel, R.L.; Crawford, C.G.; Cohn, T.A. Load Estimator (LOADEST): A FORTRAN Program for Estimating Constituent Loads in Streams and Rivers. In U.S. Geological Survey Techniques and Methods Book 4; USGS: Reston, VA, USA, 2004; Chapter A5; p. 69. [Google Scholar]
- Komiskey, M.J.; Stuntebeck, T.D.; Frame, D.R.; Madison, F.W. Nutrients and sediment in frozen-ground runoff from no-till field receiving liquid-dairy and solid-beef manures. J. Soil Water Conserv. 2011, 66, 303–312. [Google Scholar] [CrossRef]
- Gassman, P.W.; Reyes, M.R.; Green, C.H.; Arnold, J.G. The Soil and Water Assessment Tool: Historical Development, Applications, and Future Research Directions. Trans. ASABE 2007, 50, 1211–1250. [Google Scholar] [CrossRef] [Green Version]
- Arnold, J.G.; Srinivasan, R.; Muttiah, R.S.; Williams, J.R. Large area hydrologic modeling and assessment part I: model development. J. Am. Water Resour. Assoc. 1998, 34, 73–89. [Google Scholar] [CrossRef]
- Douglas-Mankin, K.R.; Srinivasan, R.; Arnold, J.G. Soil and Water Assessment Tool (SWAT) Model: Current Developments and Applications. Trans. ASABE 2010, 53, 1423–1431. [Google Scholar] [CrossRef]
- Neitsch, S.; Arnold, J.; Kiniry, J.; Williams, J. Soil Water Assessment Tool Theoretical Documentation Version 2009; Technical Report No. 406; Texas Water Resources Institute: College Station, TX, USA, 2011. [Google Scholar]
- Daggupati, P.; Douglas-Mankin, K.R.; Sheshukov, A.Y.; Barnes, P.L.; Devlin, D.L. Field-Level Targeting Using SWAT: Mapping Output from HRUs to Fields and Assessing Limitations of GIS Input Data. Trans. ASABE 2011, 54, 501–514. [Google Scholar] [CrossRef]
- Kalcic, M.M.; Chaubey, I.; Frankenberger, J.R. Defining Soil and Water Assessment Tool (SWAT) hydrologic response units (HRUs) by field boundaries. Int. J. Agric. Biol. Eng. 2015, 8, 69–80. [Google Scholar]
- Sommerlot, A.R.; Nejadhashemi, A.P.; Woznicki, S.A.; Giri, S.; Prohaska, M.D. Evaluating the capabilities of watershed-scale models in estimating sediment yield at field-scale. J. Environ. Manag. 2013, 127, 228–236. [Google Scholar] [CrossRef] [PubMed]
- Zhang, X.; Srinivasan, R.; van Liew, M. Multi-site calibration of the SWAT model for hydrologic modeling. Trans. ASABE 2008, 51, 2039–2049. [Google Scholar] [CrossRef]
- The American Society of Agricultural and Biological Engineers (ASABE) Standards. Guidelines for Calibrating, Validating, and Evaluating Hydrologic and Water Quality (H/WQ) Models; ASABE 621; ASABE: St. Joseph, MI, USA, 2017. [Google Scholar]
- Gitau, M.W.; Gburek, W.J.; Bishop, P.L. Use of the SWAT model to quantify water quality effects of agricultural BMPs at the farm-scale level. Trans. ASABE 2008, 51, 1925–1936. [Google Scholar] [CrossRef]
- Sommerlot, A.R.; Nejadhashemi, A.P.; Woznicki, S.A.; Prohaska, M.D. Evaluating the impact of field-scale management strategies on sediment transport to the watershed outlet. J. Environ. Manag. 2013, 128, 735–748. [Google Scholar] [CrossRef] [PubMed]
- Guo, T.; Gitau, M.; Merwade, V.; Arnold, J.; Srinivasan, R.; Hirschi, M.; Engel, B. Comparison of performance of tile drainage routines in SWAT 2009 and 2012 in an extensively tile-drained watershed in the Midwest. Hydrol. Earth Syst. Sci. 2018, 22, 89–110. [Google Scholar] [CrossRef] [Green Version]
- Pai, N.; Saraswat, D.; Srinivasan, R. Field SWAT: A tool for mapping SWAT output to field boundaries. Comput. Geosci. 2012, 40, 175–184. [Google Scholar] [CrossRef]
- U.S. Census Bureau. Arlington Census 2010 Total Population. Available online: https://www.census.gov/ (accessed on 12 May 2014).
- USDA National Agricultural Statistics Service (NASS). Cropland Data Layer (2013). Available online: https://nassgeodata.gmu.edu/CropScape/ (accessed on 30 May 2014).
- Soil Survey Staff, Natural Resources Conservation Service. Soil Survey Geographic (SSURGO) Database. Available online: https://sdmdataaccess.sc.egov.usda.gov (accessed on 17 January 2014).
- U.S. Geological Survey. National Elevation Dataset (NED) 1/3 Arc-Second. Available online: https://nationalmap.gov/elevation.html (accessed on 16 January 2014).
- Ohio 2016 Integrated Water Quality Monitoring and Assessment Report; Ohio Environmental Protection Agency (Ohio EPA): Columbus, OH, USA, 2016.
- Drainage Management in Priority Watersheds Screening Analysis of Two-Stage Ditch Potential for Phosphorus Load Reduction; Montgomery Associates: Cottage Grove, WI, USA, 2014.
- Schiefer, M.C. Basin Descriptions and Flow Characteristics of Ohio Streams; Bulletin 47; Ohio Department of Natural Resources, Division of Water: Columbus, OH, USA, 2002.
- Total Maximum Daily Loads for the Blanchard River Watershed; Final Report; Ohio Environmental Protection Agency (Ohio EPA): Columbus, OH, USA, 2009.
- Whitehead, M.T.; Ostheimer, C.J. Development of a Flood-Warning System and Flood-Inundation Mapping for the Blanchard River in Findlay, Ohio; Scientific Investigations Report 2008-5234; U.S. Geological Survey: Reston, VA, USA, 2008.
- U.S. Climate Data Findlay, Ohio. 2018. Available online: https://www.usclimatedata.com/climate/findlay/ohio/united-states/usoh0311 (accessed on 3 February 2018).
- Winchell, M.; Srinivasan, R.; Di Luzio, M.; Arnold, J.G. Arcswat Interface for SWAT2012: User’s Guide; Texas A&M Agrilife Research & Extension Center: Amarillo, TX, USA, 2013; p. 464. [Google Scholar]
- Merriman, K.R. Development of an Assessment Tool for Agricultural Best Management Practice Implementation in the Great Lkes Restoration Initiative Priority Watersheds—Eagle Creek, Tributary to Maumee River, Ohio; Fact Sheet 2015-3066; U.S. Geological Survey: Reston, VA, USA, 2015.
- Merriman, K.R.; Russell, A.M.; Rachol, C.M.; Daggupati, P.; Srinivasan, R.; Hayhurst, B.A.; Stuntebeck, T.D. Calibration of a Field-Scale Soil and Water Assessment Tool (SWAT) Model with Field Placement of Best Management Practices in Alger Creek, Michigan. Sustainability 2018, 10, 851. [Google Scholar] [CrossRef]
- National Hydrography Dataset Plus v2 (NHDPlusv2). Available online: http://www.horizon-systems.com/nhdplus/ (accessed on 21 July 2014).
- Daggupati, P.; Yen, H.; White, M.J.; Srinivasan, R.J.; Arnold, G.; Keitzer, C.S.; Sowa, S.P. Impact of model development, calibration and validation decisions on hydrological simulations in West Lake Erie Basin. Hydrol. Process. 2015, 29, 5307–5320. [Google Scholar] [CrossRef]
- Brady, T. Common Land Unit (CLU) Acreage Reporting Plan. Crop Insur. Today 2013, 46, 4–9. [Google Scholar]
- U.S. Fish and Wildlife Service. National Wetlands Inventory. Available online: http://www.fws.gov/wetlands/ (accessed on 5 March 2015).
- Gitau, M.W.; Veith, T.L.; Gburek, W.J.; Jarrett, A.R. Watershed level best management practice selection and placement in the Town Brook Watershed, New York. J. Am. Water Resour. Assoc. 2006, 42, 1565–1581. [Google Scholar] [CrossRef]
- Vitosh, M.L.; Johnson, J.W.; Mengel, D.B. (Eds.) Tri-State Fertilizer Recommendations for Corn, Soybeans, Wheat and Alfalfa Extension Bulletin E-2567; Ohio State Extension: Columbus, OH, USA, 1995. [Google Scholar]
- Arabi, M.; Frankenberger, J.R.; Engel, B.A.; Arnold, J.G. Representation of agricultural conservation practices with SWAT. Hydrol. Process. 2008, 22, 3042–3055. [Google Scholar] [CrossRef]
- White, M.J.; Arnold, J.G. Development of a simplistic vegetative filter strip model for sediment and nutrient retention at the field scale. Hydrol. Process. 2009, 23, 1602–1616. [Google Scholar] [CrossRef]
- Natural Resources Conservation Service (NRCS). National Conservation Practice Standards. Available online: https://www.nrcs.usda.gov/wps/portal/nrcs/detailfull/national/technical/cp/ncps/?cid=nrcs143_026849 (accessed on 20 March 2014).
- Moriasi, D.N.; Arnold, J.G.; van Liew, M.W.; Binger, R.L.; Harmel, R.D.; Veith, T.L. Model evaluation guidelines for systematic quantification of accuracy in watershed simulations. Trans. ASABE 2007, 50, 885–900. [Google Scholar] [CrossRef]
- Mankin, K.R.; DeAusen, R.D.; Barnes, P.L. Assessment of a GIS-AGNPS interface model. Trans. ASAE 2002, 45, 1375–1383. [Google Scholar] [CrossRef]
- Daggupati, P.; Pai, N.; Ale, S.; Douglas-Mankin, K.R.; Zeckoski, R.W.; Jeong, J.; Parajuli, P.B.; Saraswat, D.; Youssef, M.A. A Recommended Calibration and Validation Strategy for Hydrologic and Water Quality Models. Trans. ASABE 2015, 58, 1705–1719. [Google Scholar]
- Gupta, H.V.; Sorooshian, S.; Yapo, P.O. Status of Automatic Calibration for Hydrologic Models: Comparison with Multilevel Expert Calibration. J. Hydrol. Eng. 1999, 4, 135–143. [Google Scholar] [CrossRef]
- Yen, H.; White, M.J.; Arnold, J.G.; Keitzer, S.C.; Johnson, M.V.V.; Atwood, J.D.; Daggupati, P.; Herbert, M.E.; Sowa, S.P.; Ludsin, S.A.; et al. Western Lake Erie Basin: Soft-data-constrained, NHDPlus resolution watershed modeling and exploration of applicable conservation scenarios. Sci. Total Environ. 2016, 569, 1265–1281. [Google Scholar] [CrossRef] [PubMed]
- Abbaspour, K.C. SWAT-CUP 2012: SWAT Calibration and Uncertainty Programs—A User Manual; Swiss Federal Institute of Aquatic Science and Technology: Dübendorf, Switzerland, 2014. [Google Scholar]
- Gilliam, J.W.; Skaggs, R.W.; Weed, S.B. Drainage Control to Diminish Nitrate Loss from Agricultural Fields. J. Environ. Qual. 1979, 8, 137–142. [Google Scholar] [CrossRef]
- Busman, L.; Sands, G. Agricultural Drainage Publication Series: Issues and Answers; University of Minnesota Extension Service: St. Paul, MI, USA, 2002. [Google Scholar]
- Moriasi, D.N.; Gowda, P.H.; Arnold, J.G.; Mulla, D.J.; Ale, S.; Steiner, J.L.; Tomer, M.D. Evaluation of the Hooghoudt and Kirkham Tile Drain Equations in the Soil and Water Assessment Tool to Simulate Tile Flow and Nitrate-Nitrogen. J. Environ. Qual. 2013, 42, 1699–1710. [Google Scholar] [CrossRef] [PubMed]
- Boles, C.M.W.; Frankenberger, J.R.; Moriasi, D.N. Tile Drainage Simulation in SWAT2012: Parameterization and Evaluation in an Indiana Watershed. Trans. ASABE 2015, 58, 1201–1213. [Google Scholar]
- Sui, Y.; Frankenberger, J.R. Nitrate Loss from Subsurface Drains in an Agricultural Watershed Using SWAT2005. Trans. ASABE 2008, 51, 1263–1272. [Google Scholar] [CrossRef]
- Bélanger, J.A. Modelling Soil Temperature on the Boreal Plain with an Emphasis on the Rapid Cooling Period. Master’s Thesis, Lakehead University, Thunder Bay, ON, Canada, 15 September 2009. [Google Scholar]
- Arnold, J.G.; Youssef, M.A.; Yen, H.; White, M.J.; Sheshukov, A.Y.; Sadeghi, A.M.; Moriasi, D.N.; Steiner, J.L.; Amatya, D.M. Hydrological Processes and Model Representation: Impact of Soft Data on Calibration. Trans. ASABE 2015, 58, 1637–1660. [Google Scholar]
- Schilling, K.E. Chemical transport from paired agricultural and restored prairie watersheds. J. Environ. Qual. 2002, 31, 1184–1193. [Google Scholar] [CrossRef] [PubMed]
- David, M.B.; Del Grosso, S.J.; Hu, X.; Marshall, E.P.; McIsaac, G.F.; Parton, W.J.; Tonitto, C.; Youssef, M.A. Modeling denitrification in a tile-drained, corn and soybean agroecosystem of Illinois, USA. Biogeochemistry 2009, 93, 7–30. [Google Scholar] [CrossRef]
- Hancock Historical Museum. Findlay Floods. Available online: http://hancockhistoricalmuseum.org/findlayfloods/ (accessed on 13 August 2017).
- National Weather Service (NWS). Heavy Rain and Lakeshore Flooding. 26–27 June 2015. Available online: https://www.weather.gov/cle/event_20150627_flooding (accessed on 4 June 2017).
- USDA National Agricultural Statistics Service (NASS). County Yield Estimates (2000–2016). Available online: https://quickstats.nass.usda.gov/ (accessed on 1 January 2017).
- Srinivasan, R.; Zhang, X.; Arnold, J.G. Swat Ungauged: Hydrological Budget and Crop Yield Predictions in the Upper Mississippi River Basin. Am. Soc. Agric. Biol. Eng. 2010, 53, 1533–1546. [Google Scholar] [CrossRef]
- Hu, X.; McIsaac, G.F.; David, M.B.; Louwers, C.A.L. Modeling riverine nitrate export from an East-Central Illinois watershed using SWAT. J. Environ. Qual. 2007, 36, 996–1005. [Google Scholar] [CrossRef] [PubMed]
- Russelle, M.P.; Birr, A.S. Large-Scale Assessment of Symbiotic Dinitrogen Fixation by Crops. Agron. J. 2004, 96, 1754–1760. [Google Scholar] [CrossRef]
- Nair, S.S.; King, K.W.; Witter, J.D.; Sohngen, B.L.; Fausey, N.R. Importance of Crop Yield in Calibrating Watershed Water Quality Simulation Tools. J. Am. Water Resour. Assoc. 2011, 47, 1285–1297. [Google Scholar] [CrossRef]
- Her, Y.; Chaubey, I.; Frankenberger, J.; Smith, D. Effect of conservation practices implemented by USDA programs at field and watershed scales. J. Soil Water Conserv. 2016, 71, 249–266. [Google Scholar] [CrossRef]
- Tasdighi, A.; Arabi, M.; Harmel, D. A probabilistic appraisal of rainfall-runoff modeling approaches within SWAT in mixed land use watersheds. J. Hydrol. 2018, 564, 476–489. [Google Scholar] [CrossRef]
- Moriasi, D.N.; Gitau, M.W.; Pai, N.; Daggupati, P. Hydrologic and Water Quality Models: Performance Measures and Evaluation Criteria. Trans. ASABE 2015, 58, 1763–1785. [Google Scholar]
- Moriasi, D.N.; Gowda, P.H.; Arnold, J.G.; Mulla, D.J.; Ale, S.; Steiner, J.L. Modeling the impact of nitrogen fertilizer application and tile drain configuration on nitrate leaching using SWAT. Agric. Water Manag. 2013, 130, 36–43. [Google Scholar] [CrossRef]
- Golmohammadi, G.; Prasher, S.O.; Madani, A.; Rudra, R.P.; Youssef, M.A. SWATDRAIN, a new model to simulate the hydrology of agricultural Lands, model development and evaluation. Biosyst. Eng. 2016, 141, 31–47. [Google Scholar] [CrossRef]
- Vidon, P.; Cuadra, P.E. Phosphorus dynamics in tile-drain flow during storms in the US Midwest. Agric. Water Manag. 2011, 98, 532–540. [Google Scholar] [CrossRef]
- Geohring, L.D.; McHugh, O.V.; Walter, M.T.; Steenhuis, T.S.; Akhtar, M.S.; Walter, M.F. Phosphorus transport into drains by macropores after manure applications: Implication for best manure management practices. Soil Sci. 2001, 166, 896–909. [Google Scholar] [CrossRef]
- Christianson, L.E.; Harmel, R.D.; Smith, D.; Williams, M.R.; King, K. Assessment and Synthesis of 50 Years of Published Drainage Phosphorus Losses. J. Environ. Qual. 2016, 45, 1467–1477. [Google Scholar] [CrossRef] [PubMed] [Green Version]
- Muenich, R.L.; Kalcic, M.M.; Winsten, J.; Fisher, K.; Day, M.; O’Neil, G.; Wang, Y.C.; Scavia, D. Pay-for-Performance Conservation Using SWAT Highlights Need for Field-Level. Agric. Conserv. Trans. ASABE 2017, 60, 1925–1937. [Google Scholar] [CrossRef]
- Liu, Y.; Engel, B.A.; Flanagan, D.C.; Gitau, M.W.; Mcmillan, S.K.; Chaubey, I. A review on effectiveness of best management practices in improving hydrology and water quality: Needs and opportunities. Sci. Total Environ. 2017, 601, 580–593. [Google Scholar] [CrossRef] [PubMed]
- Sawyer, J.E. Concepts of variable rate technology with considerations for fertilizer application. J. Prod. Agric. 1994, 7, 195–201. [Google Scholar] [CrossRef]
- Sharpley, A.; Jarvie, H.P.; Buda, A.; May, L.; Spears, B.; Kleinman, P. Phosphorus Legacy: Overcoming the Effects of Past Management Practices to Mitigate Future Water Quality Impairment. J. Environ. Qual. 2014, 42, 1308–1326. [Google Scholar] [CrossRef] [PubMed]
- Muenich, R.L.; Kalcic, M.; Scavia, D. Evaluating the Impact of Legacy P and Agricultural Conservation Practices on Nutrient Loads from the Maumee River Watershed. Environ. Sci. Technol. 2016, 50, 8146–8154. [Google Scholar] [CrossRef] [PubMed]
- Makarewicz, J.C.; Lewis, T.W.; Bosch, I.; Noll, M.R.; Herendeen, N.; Simon, R.D.; Zollweg, J.; Vodacek, A. The impact of agricultural best management practices on downstream systems: Soil loss and nutrient chemistry and flux to Conesus Lake, New York, USA. J. Great Lakes Res. 2009, 35, 23–36. [Google Scholar] [CrossRef]
- Bryant, R.B.; Veith, T.L.; Kleinman, P.J.A.; Gburek, W.J. Cannonsville Reservoir and Town Brook watersheds: Documenting conservation efforts to protect New York City’s drinking water. J. Soil Water Conserv. 2008, 63, 339–344. [Google Scholar] [CrossRef]
- Jokela, W.; Casler, M. Transport of phosphorus and nitrogen in surface runoff in a corn silage system: Paired watershed methodology and calibration period results. Can. J. Soil Sci. 2011, 91, 479–491. [Google Scholar] [CrossRef]
- Bosch, N.S.; Allan, J.D.; Selegean, J.P.; Scavia, D. Scenario-testing of agricultural best management practices in Lake Erie watersheds. J. Great Lakes Res. 2013, 39, 429–436. [Google Scholar] [CrossRef]
- Gildow, M.C. Evaluating Fertilizer Application Practices to Reduce Phosphorus Discharge from the Maumee River. Master’s Thesis, The Ohio State University, Columbus, OH, USA, 2015. [Google Scholar]
- Hutchinson, K.; Christiansen, D. Use of the Soil and Water Assessment Tool (SWAT) for Simulating Hydrology and Water Quality in the Cedar River Basin, Iowa, 2000–2010: Scientific Investigations Report 2013-5002; U.S. Geological Survey: Reston, VA, USA, 2013.
- King, K.W.; Williams, M.R.; Macrae, M.L.; Fausey, N.R.; Frankenberger, J.; Smith, D.R.; Kleinman, P.J.A.; Brown, L.C. Phosphorus Transport in Agricultural Subsurface Drainage: A Review. J. Environ. Qual. 2015, 44, 467–485. [Google Scholar] [CrossRef] [PubMed]
- Williams, M.R.; King, K.W.; Ford, W.; Buda, A.R.; Kennedy, C.D. Effect of tillage on macropore flow and phosphorus transport to tile drains. Water Resour. Res. 2016, 52, 2868–2882. [Google Scholar] [CrossRef]


| Rotation | Conventional | Cover Crop | Fertilizer | ||
|---|---|---|---|---|---|
| Year | Date | Operation | Date | Operation | Application Rate |
| 1 | 24 April | Field Cultivator | 20 April | Field Cultivator | - |
| 1 | 1 May | Plant corn | 29 April | Plant corn | - |
| 1 | 3 June | Fertilizer application | 1 June | Fertilizer application | 220 kg ha−1 Ammonia |
| 1 | 18 October | Harvest and Kill | 18 October | Harvest and Kill | - |
| 1 | 24 October | No-tillage | 25 October | No-Tillage | - |
| 1 | - | - | 30 October | Plant cereal rye | - |
| 2 | - | - | 22 April | Kill cereal rye | - |
| 2 | - | - | 28 April | Field Cultivator | - |
| 2 | 15 May | Plant soybeans | 15 May | Plant soybeans | - |
| 2 | 10 October | Harvest and Kill | 18 October | Harvest and Kill | - |
| 2 | 29 October | Fertilizer application | 29 October | Fertilizer application | 168 kg ha−1 11-52-0 * |
| 2 | 30 October | Deep Ripper | 2 November | Deep Ripper | - |
| Rotation | CR | CC + CR | Fertilizer | ||
|---|---|---|---|---|---|
| Year | Date | Operation | Date | Operation | Application Rate |
| 1 | - | - | 15 April | Kill cereal rye | - |
| 1 | 24 April | Field Cultivator | 24 April | Field Cultivator | - |
| 1 | 1 May | Plant corn | 28 April | Plant corn | - |
| 1 | 1 June | Fertilizer application | 1 June | Fertilizer application | 220 kg ha−1 Ammonia |
| 1 | 18 October | Harvest and Kill | 18 October | Harvest and Kill | - |
| 1 | 24 October | Generic No-Tillage | 24 October | Generic No-Tillage | - |
| 2 | 15 May | Plant soybeans | 1 May | Plant soybeans | - |
| 2 | 10 October | Harvest and Kill | 10 October | Harvest and Kill | - |
| 2 | 29 October | Fertilizer application | 22 October | Fertilizer application | 168 kg ha−1 11-52-0 * |
| 2 | 30 October | Deep Ripper | 24 October | Deep Ripper | - |
| 3 | 24 April | Field Cultivator | 24 April | Field Cultivator | - |
| 3 | 1 May | Plant corn | 28 April | Plant corn | - |
| 3 | 3 June | Fertilizer application | 3 June | Fertilizer application | 220 kg ha−1 Ammonia |
| 3 | 18 October | Harvest and Kill | 18 October | Harvest and Kill | - |
| 3 | 24 October | Generic No-Tillage | 24 October | Generic No-Tillage | - |
| 4 | 15 May | Plant soybeans | 1 May | Plant soybeans | - |
| 4 | 1 October | Harvest and Kill | 1 October | Harvest and Kill | - |
| 4 | 2 October | Fertilizer application | 2 October | Fertilizer application | 50.5 kg ha−1 Elem P 11.3 kg ha−1 Elem N |
| 4 | 3 October | Generic No-Tillage | 3 October | Generic No-Tillage | - |
| 4 | 5 October | Plant winter wheat | 5 October | Plant winter wheat | - |
| 5 | 15 July | Harvest and Kill | 15 July | Harvest and Kill | - |
| 5 | 25 October | Chisel Plow Gt 15 ft | 24 August | Generic No-Tillage | - |
| 5 | - | - | 22 October | Plant cereal rye | - |
| Short ID | USDA-NRCS Code * | NRCS Practice | Representation in SWAT |
|---|---|---|---|
| CRP | 327 | Conservation Cover | Established switch grass permanently |
| CR | 328 | Conservation Crop Rotation | Added winter wheat on 5th year of rotation |
| CC | 340 | Cover Crop | Cover crop of cereal rye planted after tillage following corn harvest |
| UW | 647 645 | Early Successional Habitat Development/Management Upland Wildlife Habitat Management | Established rangeland permanently |
| FS | 393 | Filter Strip | Used SWAT filter strip option (ops file) Area derived from GIS |
| GW | 412 | Grassed Waterway | Used SWAT grassed waterway option (ops file) Length and width derived with GIS. Slope and depth assumed as defaults |
| NMP | 590 | Nutrient Management Plan | Reduced P containing fertilizer applications by 10% |
| PG | 528 | Prescribed Grazing | Method for beef cattle described in text |
| RT | 345 | Residue Management, Reduced Till | Moldboard replaced with conservation tillage in corn years. no-till in soybean year CN2.mgt-2; BIOMIX.mgt = 0.4; OV_N.hru = 0.2 |
| NT | 329 329A 329B | Residue Management, No-Till/OR Strip TillOR Mulch Till | Moldboard replaced with no-tillage operation in corn years. no-till in soybean year CN2.mgt-5; BIOMIX.mgt = 0.5; OV_N.hru = 0.3 |
| Modeled Scenarios | Practices per Scenario | Fields with NCP BMPs (BMP Count) | Area of NCP BMPs (ha) | Percent of Watershed with BMPs (%) | |
|---|---|---|---|---|---|
| Baseline | - | 0 fields (0 BMPs) | 0 | 0 | |
| Applied GLRI BMPs | CC on 26 fields | NT on two fields | 42 fields (50 BMPs) | 363.1 | 2.8 |
| CR on 10 fields | one GW | ||||
| NMP on nine fields | |||||
| All Applied BMPs (GLRI + nonGLRI BMPs) | CC on 41 fields | NT on 109 fields | 275 fields (560 BMPs) | 1679.6 | 12.9 |
| CR on 162 fields | RT on 38 fields | ||||
| CRP on 51 fields | 19 GW | ||||
| NMP on 100 fields | 25 FS | ||||
| PG on 15 fields | 14 UW | ||||
| All Applied + Planned GLRI BMPs | CC on 41 fields | NT on 109 fields | 277 fields (564 BMPs) | 1699.8 | 13.0 |
| CRP on 51 fields | RT on 38 fields | ||||
| CR on 164 fields | 19 GW | ||||
| NMP on 102 fields | 25 FS | ||||
| PG on 15 fields | 14 UW | ||||
| All Contracted BMPs (All Applied and Planned: GLRI + nonGLRI BMPs) | CC on 41 fields | NT on 114 fields | 298 fields (623 BMPs) | 1827.7 | 14.0 |
| CRP on 61 fields | RT on 41 fields | ||||
| CR on 171 fields | 45 GW | ||||
| NMP on 108 fields | 27 FS | ||||
| PG on 15 fields | 14 UW | ||||
| Low | CC on 41 fields | NT on 294 fields | 477 fields (1163 BMPs) | 3038.2 | 23.3 |
| CRP on 61 fields | RT on 41 fields | ||||
| CR on 351 fields | 45 GW | ||||
| NMP on 288 fields | 27 FS | ||||
| PG on 15 fields | 14 UW | ||||
| Medium | CC on 41 fields | NT on 619 fields | 825 fields (2173 BMPs) | 5961.4 | 45.8 |
| CRP on 61 fields | RT on 40 fields | ||||
| CR on 675 fields | 82 GW | ||||
| NMP on 613 fields | 27 FS | ||||
| PG on 15 fields | 14 UW | ||||
| High | CC on 961 fields | NT on 1538 fields | 1,729 fields (5855 BMPs) | 9946.5 | 76.3 |
| CRP on 61 fields | RT on 40 fields | ||||
| CR on 1594 fields | 84 GW | ||||
| NMP on 1532 fields | 40 FS | ||||
| PG on 15 fields | 14 UW | ||||
| Scenario | Applied GLRI | All Applied | All Applied and Planned GLRI | All Contracted BMPs | Low Scenario | Medium Scenario | High Scenario |
|---|---|---|---|---|---|---|---|
| BMP or BMP Combination | (Hectares) | ||||||
| CC | 175.1 | 103.0 | 103.0 | 72.3 | 72.3 | 72.3 | 72.3 |
| CC + CR + NMP + NT | - | 126.6 | 126.6 | 114.5 | 114.5 | 114.5 | 4100.7 |
| CC + CR + NMP + NT + FS | - | 14.7 | 14.7 | 14.7 | 14.7 | 14.7 | 59.7 |
| CC + CR + NMP + NT + FS + GW | - | - | - | - | - | - | 17.9 |
| CC + CR + NMP + NT + GW | - | 39.9 | 39.9 | 52.0 | 52.0 | 52.0 | 191.0 |
| CC + CR + NMP + RT | - | 14.5 | 39.9 | 39.9 | 39.9 | 39.9 | 39.9 |
| CC + CR + NT | - | 56.7 | 56.7 | 31.2 | 31.2 | 31.2 | 31.2 |
| CC + CR + NT + GW | - | - | - | 25.6 | 25.6 | 25.6 | 25.6 |
| CC + CR + RT | - | 25.4 | - | - | - | - | - |
| CC + GW | - | - | - | 30.7 | 30.7 | 30.7 | 30.7 |
| CC + NMP | 53.3 | - | - | - | - | - | - |
| CC + RT | 25.4 | - | - | - | - | - | - |
| CR | 61.5 | 92.2 | 112.4 | 66.1 | 66.1 | 66.1 | 66.1 |
| CR + GW | - | - | - | 39.3 | 39.3 | 39.3 | 39.3 |
| CR + NMP | - | 0.6 | 0.6 | 0.6 | 0.6 | 0.6 | 0.6 |
| CR + NMP + NT | - | 253.9 | 253.9 | 261.5 | 261.5 | 252.5 | 252.5 |
| CR + NMP + NT + FS | - | 47.0 | 47.0 | 49.4 | 49.4 | 49.4 | 49.4 |
| CR + NMP + NT + FS + GW | - | - | - | 2.8 | 2.8 | 2.8 | 2.8 |
| CR + NMP + NT + GW | - | 22.4 | 22.4 | 35.0 | 35.0 | 44.1 | 44.1 |
| CR + NMP + NTs | - | - | - | - | 1210.5 | 3384.1 | 3382.9 |
| CR + NMP + NTs + GW | - | - | - | - | 13.3 | 276.1 | 276.1 |
| CR + NMP + RT | - | 240.4 | 240.4 | 240.2 | 240.2 | 208.8 | 208.8 |
| CR + NMP + RT + GW | - | - | - | 29.7 | 29.7 | 61.0 | 61.0 |
| CR + NT | - | 161.4 | 161.4 | 137.6 | 137.6 | 137.6 | 137.6 |
| CR + NT + GW | - | 12.7 | 12.7 | 36.6 | 36.6 | 36.6 | 36.6 |
| CR + RT | - | 71.7 | 71.7 | 16.2 | 16.2 | 15.0 | 15.0 |
| CR + RT + GW | - | - | - | 55.4 | 55.4 | 55.4 | 55.4 |
| CRP | - | 86.6 | 86.6 | 96.9 | 96.9 | 96.9 | 95.2 |
| CRP + FS | - | 43.9 | 43.9 | 43.9 | 43.9 | 43.9 | 45.6 |
| FS | - | 54.0 | 54.0 | 54.0 | 54.0 | 54.0 | 8.9 |
| FS + GW | - | 17.9 | 17.9 | 17.9 | 17.9 | 17.9 | - |
| GW | 3.0 | 96.1 | 96.1 | 181.0 | 167.7 | 655.8 | 516.8 |
| NMP | 34.7 | 15.3 | 15.3 | - | - | - | - |
| NMP + NT | 10.1 | - | - | - | - | - | - |
| PG | - | 66.6 | 66.6 | 66.6 | 66.6 | 66.6 | 10.6 |
| PG + FS | - | - | - | - | - | - | 2.7 |
| PG + GW | - | - | - | - | - | - | 53.2 |
| UW | - | 14.6 | 14.6 | 14.6 | 14.6 | 14.6 | 13.3 |
| UW + FS | - | 1.4 | 1.4 | 1.4 | 1.4 | 1.4 | 2.7 |
| Total | 363.1 | 1679.6 | 1699.8 | 1827.7 | 3038.2 | 5961.4 | 9946.5 |
| Constituent | NSE | PBIAS | R2 | NSE | PBIAS | R2 |
|---|---|---|---|---|---|---|
| Calibration WY2013–WY2014 | Validation WY2015–WY2016 | |||||
| Eagle Creek Outlet (USGS 04188496) | ||||||
| Flow * | 0.69 | −4.59 | 0.70 | 0.64 | 40.79 | 0.83 |
| Sediment | 0.72 | −19.17 | 0.73 | 0.62 | 50.30 | 0.84 |
| DRP | 0.61 | 18.96 | 0.67 | 0.57 | 41.88 | 0.72 |
| TP | 0.74 | 34.30 | 0.82 | 0.41 | 63.68 | 0.76 |
| NO3-N | 0.68 | −3.50 | 0.73 | 0.63 | 33.72 | 0.79 |
| TN | 0.63 | −14.22 | 0.76 | 0.53 | 47.77 | 0.84 |
| EOF (USGS 0405051083391201) | ||||||
| surface runoff | 0.33 | 26.97 | 0.41 | −0.36 | −8.81 | 0.36 |
| Sediment | 0.66 | −18.94 | 0.67 | 0.73 | −22.47 | 0.79 |
| DRP | −24.91 | −338.83 | 0.42 | −7.31 | −134.83 | 0.07 |
| TP | 0.41 | −58.13 | 0.62 | −0.80 | −72.58 | 0.66 |
| NO3-N | −0.20 | 86.11 | 0.16 | −0.10 | 89.88 | 0.00 |
| TN | 0.04 | 80.93 | 0.78 | 0.15 | 78.60 | 0.64 |
| Tile Drain (USGS 0405051083391001) | ||||||
| tile flow | 0.34 | −46.53 | 0.86 | 0.78 | 14.53 | 0.79 |
| DRP | 0.05 | −45.92 | 0.28 | 0.14 | 45.97 | 0.23 |
| NO3-N | −0.78 | 78.84 | 0.28 | −0.21 | 84.63 | 0.03 |
| Crop | Average Annual Crop Yield (kg ha−1) | PBIAS | R2 | |
|---|---|---|---|---|
| Observed | Simulated | (%) | ||
| Corn | 8126 | 9631 | −11.25 | 0.51 |
| Soybean | 2744 | 2781 | −1.12 | 0.24 |
| Winter Wheat | 3997 | 3752 | 2.68 | 0.01 |
| Hay | 7192 | 6581 | 7.85 | 0.12 |
| BMP or BMP Combination | Average Annual Reductions (%) | |||||
|---|---|---|---|---|---|---|
| n | Sediment | DRP | TP | NO3-N | TN | |
| CC | 20 | 22% | 9% | 21% | 10% | 12% |
| CC + CR + NMP + NT | 919 | 31% | −18% | 23% | 37% | 39% |
| CC + CR + NMP + NT + FS | 7 | 97% | 45% | 67% | 39% | 43% |
| CC + CR + NMP + NT + FS + GW | 1 | 99% | 42% | 73% | 46% | 49% |
| CC + CR + NMP + NT + GW | 11 | 62% | −14% | 45% | 37% | 43% |
| CC + CR + NMP + RT | 3 | 41% | 16% | 35% | 54% | 56% |
| CC + CR + NT | 8 | 33% | −67% | 20% | 36% | 0% |
| CC + CR + NT + GW | 3 | 39% | −69% | 28% | 37% | 42% |
| CC + CR + RT | 1 | 41% | 12% | 34% | 53% | 56% |
| CC + GW | 1 | 23% | 7% | 27% | 10% | 13% |
| CC + NMP | 4 | 23% | 15% | 23% | 14% | 15% |
| CC + RT | 2 | 23% | 10% | 21% | 8% | 14% |
| CR | 19 | 9% | −17% | 9% | 19% | 21% |
| CR + GW | 3 | 21% | −28% | 22% | 25% | 30% |
| CR + NMP | 1 | 39% | 0% | 33% | 50% | 51% |
| CR + NMP + NT | 50 | 28% | −7% | 23% | 34% | 36% |
| CR + NMP + NT + FS | 6 | 72% | 27% | 50% | 31% | 36% |
| CR + NMP + NT + FS + GW | 5 | 60% | 3% | 46% | 47% | 48% |
| CR + NMP + NT + GW | 7 | 77% | 7% | 66% | 46% | 52% |
| CR + NMP + NTs | 497 | 23% | −5% | 20% | 35% | 0% |
| CR + NMP + NTs + GW | 12 | 70% | 3% | 52% | 41% | 45% |
| CR + NMP + RT | 26 | 26% | 0% | 23% | 34% | 37% |
| CR + NMP + RT + GW | 2 | 54% | 3% | 42% | 46% | 52% |
| CR + NT | 25 | 25% | −11% | 22% | 34% | 36% |
| CR + NT + GW | 5 | 31% | 6% | 32% | 28% | 31% |
| CR + RT | 12 | 26% | −1% | 23% | 40% | 42% |
| CR + RT + GW | 6 | 36% | 0% | 33% | 41% | 44% |
| CRP | 50 | 98% | 2% | 88% | 95% | 97% |
| CRP + FS | 8 | 100% | 60% | 94% | 96% | 98% |
| FS | 8 | 97% | 56% | 63% | 6% | 13% |
| FS + GW | 1 | 99% | 51% | 64% | 3% | 9% |
| GW | 39 | 60% | 4% | 39% | 1% | 9% |
| NMP | 5 | 0% | 4% | 1% | 2% | 2% |
| NMP + NT | 2 | 8% | −3% | 3% | −3% | 0% |
| PG | 15 | 9% | 10% | 2% | 0% | 0% |
| PG + FS | 11 | 40% | 40% | 31% | 35% | 25% |
| PG + GW | 2 | 53% | 49% | 43% | 53% | 40% |
| UW | 12 | 99% | 18% | 90% | 83% | 0% |
| UW + FS | 3 | 100% | 48% | 92% | 72% | 0% |
| Land Use | Hectares | Sediment Yield (t ha−1) | TP Yield (kg ha−1) | DRP Yield (kg ha−1) | NO3-N Yield (kg ha−1) | TN Yield (kg ha−1) |
|---|---|---|---|---|---|---|
| Row crops * | 9726 | 1.56 | 1.44 | 0.18 | 1.81 | 4.27 |
| Pasture | 666 | 43.48 | 5.05 | 0.21 | 0.11 | 4.16 |
| Grazing ** | 67 | 71.02 | 8.18 | 0.44 | 5.08 | 13.48 |
| Urban | 1075 | 0.40 | 1.37 | 1.11 | 44.24 | 44.58 |
| Forest | 1404 | 0.01 | 0.03 | 0.02 | 0.01 | 0.01 |
| Water/Wetlands | 89 | 0.00 | 0.01 | 0.01 | 0.00 | 0.00 |
| Barren | 3 | 11.66 | 3.36 | 0.19 | 0.00 | 1.04 |
| Site | Tile (USGS 0405051083391001) | EOF (USGS 0405051083391201) | Eagle Creek HUC12 (USGS 04188496) | ||||||
|---|---|---|---|---|---|---|---|---|---|
| WY | DRP | PP | TP | DRP | PP | TP | DRP | PP | TP |
| kg | kg | kg | kg | kg | kg | kg | kg | kg | |
| 2013 | 0.11 | 1.76 | 1.86 | 0.29 | 10.96 | 11.25 | 7024.79 | 26,423.15 | 33,447.94 |
| 2014 | 0.33 | 0.84 | 1.17 | 1.72 | 3.08 | 4.81 | 7880.72 | 18,414.51 | 26,295.23 |
| 2015 | 0.24 | 0.74 | 0.97 | 0.63 | 2.70 | 3.33 | 7454.80 | 28,545.96 | 36,000.76 |
| 2016 | 0.27 | 1.03 | 1.30 | 0.58 | 2.39 | 2.98 | 4882.29 | 20,311.42 | 25,193.71 |
| average | 0.24 | 1.09 | 1.33 | 0.81 | 4.79 | 5.59 | 6810.65 | 23,423.76 | 30,234.41 |
© 2018 by the authors. Licensee MDPI, Basel, Switzerland. This article is an open access article distributed under the terms and conditions of the Creative Commons Attribution (CC BY) license (http://creativecommons.org/licenses/by/4.0/).
Share and Cite
Merriman, K.R.; Daggupati, P.; Srinivasan, R.; Toussant, C.; Russell, A.M.; Hayhurst, B. Assessing the Impact of Site-Specific BMPs Using a Spatially Explicit, Field-Scale SWAT Model with Edge-of-Field and Tile Hydrology and Water-Quality Data in the Eagle Creek Watershed, Ohio. Water 2018, 10, 1299. https://doi.org/10.3390/w10101299
Merriman KR, Daggupati P, Srinivasan R, Toussant C, Russell AM, Hayhurst B. Assessing the Impact of Site-Specific BMPs Using a Spatially Explicit, Field-Scale SWAT Model with Edge-of-Field and Tile Hydrology and Water-Quality Data in the Eagle Creek Watershed, Ohio. Water. 2018; 10(10):1299. https://doi.org/10.3390/w10101299
Chicago/Turabian StyleMerriman, Katherine R., Prasad Daggupati, Raghavan Srinivasan, Chad Toussant, Amy M. Russell, and Brett Hayhurst. 2018. "Assessing the Impact of Site-Specific BMPs Using a Spatially Explicit, Field-Scale SWAT Model with Edge-of-Field and Tile Hydrology and Water-Quality Data in the Eagle Creek Watershed, Ohio" Water 10, no. 10: 1299. https://doi.org/10.3390/w10101299