Impacts of Different Onset Time El Niño Events on Winter Precipitation over South China

1
South China Sea Institute of Marine Meteorology, Guangdong Ocean University, Zhanjiang 524088, China
2
National Centre for Groundwater Research and Training, Flinders University, Bedford Park, South Australia 5042, Australia
*
Author to whom correspondence should be addressed.
Atmosphere 2018, 9(10), 366; https://doi.org/10.3390/atmos9100366
Submission received: 5 August 2018
/
Revised: 1 September 2018
/
Accepted: 7 September 2018
/
Published: 20 September 2018
(This article belongs to the Section Meteorology)
Abstract
:Winter precipitation over South China tended to be much higher than normal for the spring El Niño events during 1979–2016. For the spring El Niño events, the meridional and zonal circulations served as a bridge, linking the warmer sea surface temperature (SST) in the eastern equatorial Pacific (EEP) and South China winter precipitation. This possible physical process can be described as follows: During boreal winter, a positive SST anomaly in the EEP was concurrent with strong anomalous convection activity over South China via anomalous Walker circulation, an anomalous Hadley Cell along 110°–130° E, and a zonal westward teleconnection wave train pattern at 700 hPa in the Northern Hemisphere. In addition, an anomalous pumping effect at 200 hPa contributed to the convective activity. Meanwhile, the western Pacific subtropical high moved southwards and strengthened at 500 hPa, and abnormal southwesterly winds brought plentiful water vapor to South China at 850 hPa. All these factors favored an increase in precipitation over South China. For the summer El Niño events, the aforementioned anomalies were weaker, which resulted in a precipitation close to normal over South China.
1. Introduction
The monsoon is one of the most active atmospheric circulation systems in the Northern Hemisphere, and is the main factor affecting the weather and climate in China. Most previous studies have focused on summer precipitation in China because of its large impacts in terms of flooding and drought. In contrast, winter rainfall attracts less attention, despite extreme winter rainfall being capable of causing severe disasters [1]. For example, in winter 2015, the average precipitation over South China (Guangdong, Guangxi and Hainan provinces) created a new historical maximum and caused floods, which was more than 1.6 times that of a normal year [2]. Drought in South China is frequent in winter. For example, more than 98.9 million ha of crops were destroyed, and people as well as livestock suffered shortages of drinking water, because of the persistent severe drought in the region peaking in winter 2011 [3]. South China is a densely populated region of the country, which means that anomalous precipitation in winter has a substantial and tangible socioeconomic impact from a variety of perspectives. Thus, understanding the causes, and improving the forecasting capabilities of South China winter precipitation will be highly beneficial in these respects.
The high variability of South China winter-precipitation is attributed to multiple factors. First, the sea surface temperature (SST) anomalies over the tropical and mid-latitude oceans have been documented to have close linkages with South China winter precipitation. For example, El Niño–Southern Oscillation (ENSO) has strong impacts [1,2,4,5,6,7,8,9]; the Indian Ocean Dipole [10] plays an important role; the SST anomalies in the South China Sea (SCS) is also likely to influence South China winter precipitation [11].
In addition, the large-scale circulations of the Northern Hemisphere also have strong impacts on South China winter precipitation. The East Asian winter monsoon systems [4,5,9,12,13,14,15,16] are particularly important; but the low-latitude circulation systems, including the western Pacific subtropical high [4,6,7,17] and the trough over the Bay of Bengal [18,19,20], could also have an effect. Specifically, these circulation systems may adjust the transport of moisture to South China, thus regulating precipitation. The Arctic Oscillation or North Atlantic Oscillation might also affect South China winter precipitation, through modulating the East Asian winter monsoon [21,22,23,24,25].
ENSO has large impacts on the monsoon systems of East Asia [26,27,28]. Previous studies have mostly been focused on the relationship between different episodes (El Niño and La Niña) of the ENSO cycle and the precipitation over China. A complication in the relationship between winter precipitation and El Niño is the irregularity of El Niño events; ENSO has an asymmetric impact on winter precipitation over South China [29,30].
The basic evolution of El Niño may take many forms [31,32,33,34,35,36,37,38]. The diversity in patterns, amplitude and temporal evolution of ENSO had been referred to as its complexity [39]. Yuan and He [40] showed that two zonal tripolar distribution patterns of El Niño have different impacts on winter precipitation over South China. Classified by the spatial pattern of SST anomalies, El Niño can be distinguished by the onset time into spring or summer [36], and the onset time is before the winter precipitation. Thus, it remains unclear whether or how South China winter precipitation variability manifests itself, and how it is linked to different onset times of El Niño events. Specifically, what factors are involved in South China winter precipitation variability under different El Niño types based on onset time? And what are the circulation features associated with South China winter precipitation under spring and summer El Niño, respectively? These are the questions we sought to answer in this study.
The main purpose of the present study was to investigate and understand the different impacts of the spring and summer El Niño events on winter precipitation over South China. Following this introduction, the data and methods used, the classification of El Niño events are described in Section 2. The climatic characteristics of winter precipitation over South China are documented in Section 3. The tropical ocean SST, atmospheric circulation, and water vapor transport—the possible causes for change in the relationship between South China winter precipitation and El Niño events—are discussed in Section 3. Section 4 presents a summary of our findings.
2. Data and Methods
2.1. Data
The data sets used in this research are:
- Daily precipitation data on a 0.5° × 0.5° mesh over China were obtained from the National Meteorological Information Center of the China Meteorological Administration. In the present study, South China refers to the region (22°–30° N, 108°–120° E), which covers the areas of Guangdong, Guangxi, Fujian, southern parts of Hunan, and Jiangxi. Winter (December–January–February, DJF) precipitation is defined as the average precipitation in this region.
- COBE-SST2 data, provided by NOAA/OAR/ESRL PSD, Boulder, Colorado, USA, available on a 1.0° grid [41] and obtained from https://www.esrl.noaa.gov/psd/, were used.
- The monthly mean winds, specific humidity, and geopotential height were provided by the NCEP–NCAR reanalysis dataset [42], available on a 2.5° grid and obtained from http://www.esrl.noaa.gov/psd/data/gridded/data.ncep.reanalysis.html.
- The monthly outgoing longwave radiation (OLR) data, at a resolution of 2.5°, was provided by NOAA’s National Climatic Data Center [43] and obtained from http://www.ncdc.noaa.gov.
2.2. Methods
All datasets used in this study covered the period 1979–2016. The daily and monthly data obtained from different sources (described above) were summed (for precipitation) or averaged (for SST, wind and OLR) into seasonal time series. These seasonal time series were then used to calculate seasonal anomaly time series for correlation and composite analysis.
The relationships between pairs of variables were examined by correlation or composite analysis, and the statistical significance of these analyses were assessed using the two-sided Student’s t-test.
2.3. El Niño Event Classification
The SST anomaly averaged over the Niño3 region of (150° W–90° W, 5° S–5° N) was taken as an ENSO index (because it is better than other indexes in the present study). An El Niño episode was defined to be the period when monthly means of SST anomalies in the Niño3 region exceeded 0.5 °C for five months or more.
The onset time of El Niño was defined as the month just before the month when the SST anomaly first exceeded 0.5 °C. Spring (summer) El Niño events initiated in a month between February and May (June and September), and the treatment of the breakpoints was as follows: If the index (≥0.5 °C) had a break of two months or more, the two events were considered discontinuous. If the index (≥0.5 °C) was interrupted for only one month, and the three-month running average of them exceeded 0.5 °C, the event was continuous; otherwise, it was considered discontinuous.
Based on the above definition, there were five spring El Niño events (1982/83, 1991/92, 1997/98, 2009/10, 2015/16) and three summer El Niño events (1986/87, 2002/03, 2006/07) during 1979–2016 (Table 1). Figure 1 shows that the spring (summer) El Niño events, with an average duration of 12 (6) months and an average amplitude of 1.33 °C (0.77 °C), were strong (weak) warm events of long (short) duration. Also, the maximum anomaly for both types occurred in November–January, which implies that the mature phase of El Niño events is highly phase-locked with the seasonal cycle, irrespective of the onset time [36,37].
3. Results
3.1. Climatic Characteristics of Winter Precipitation over South China
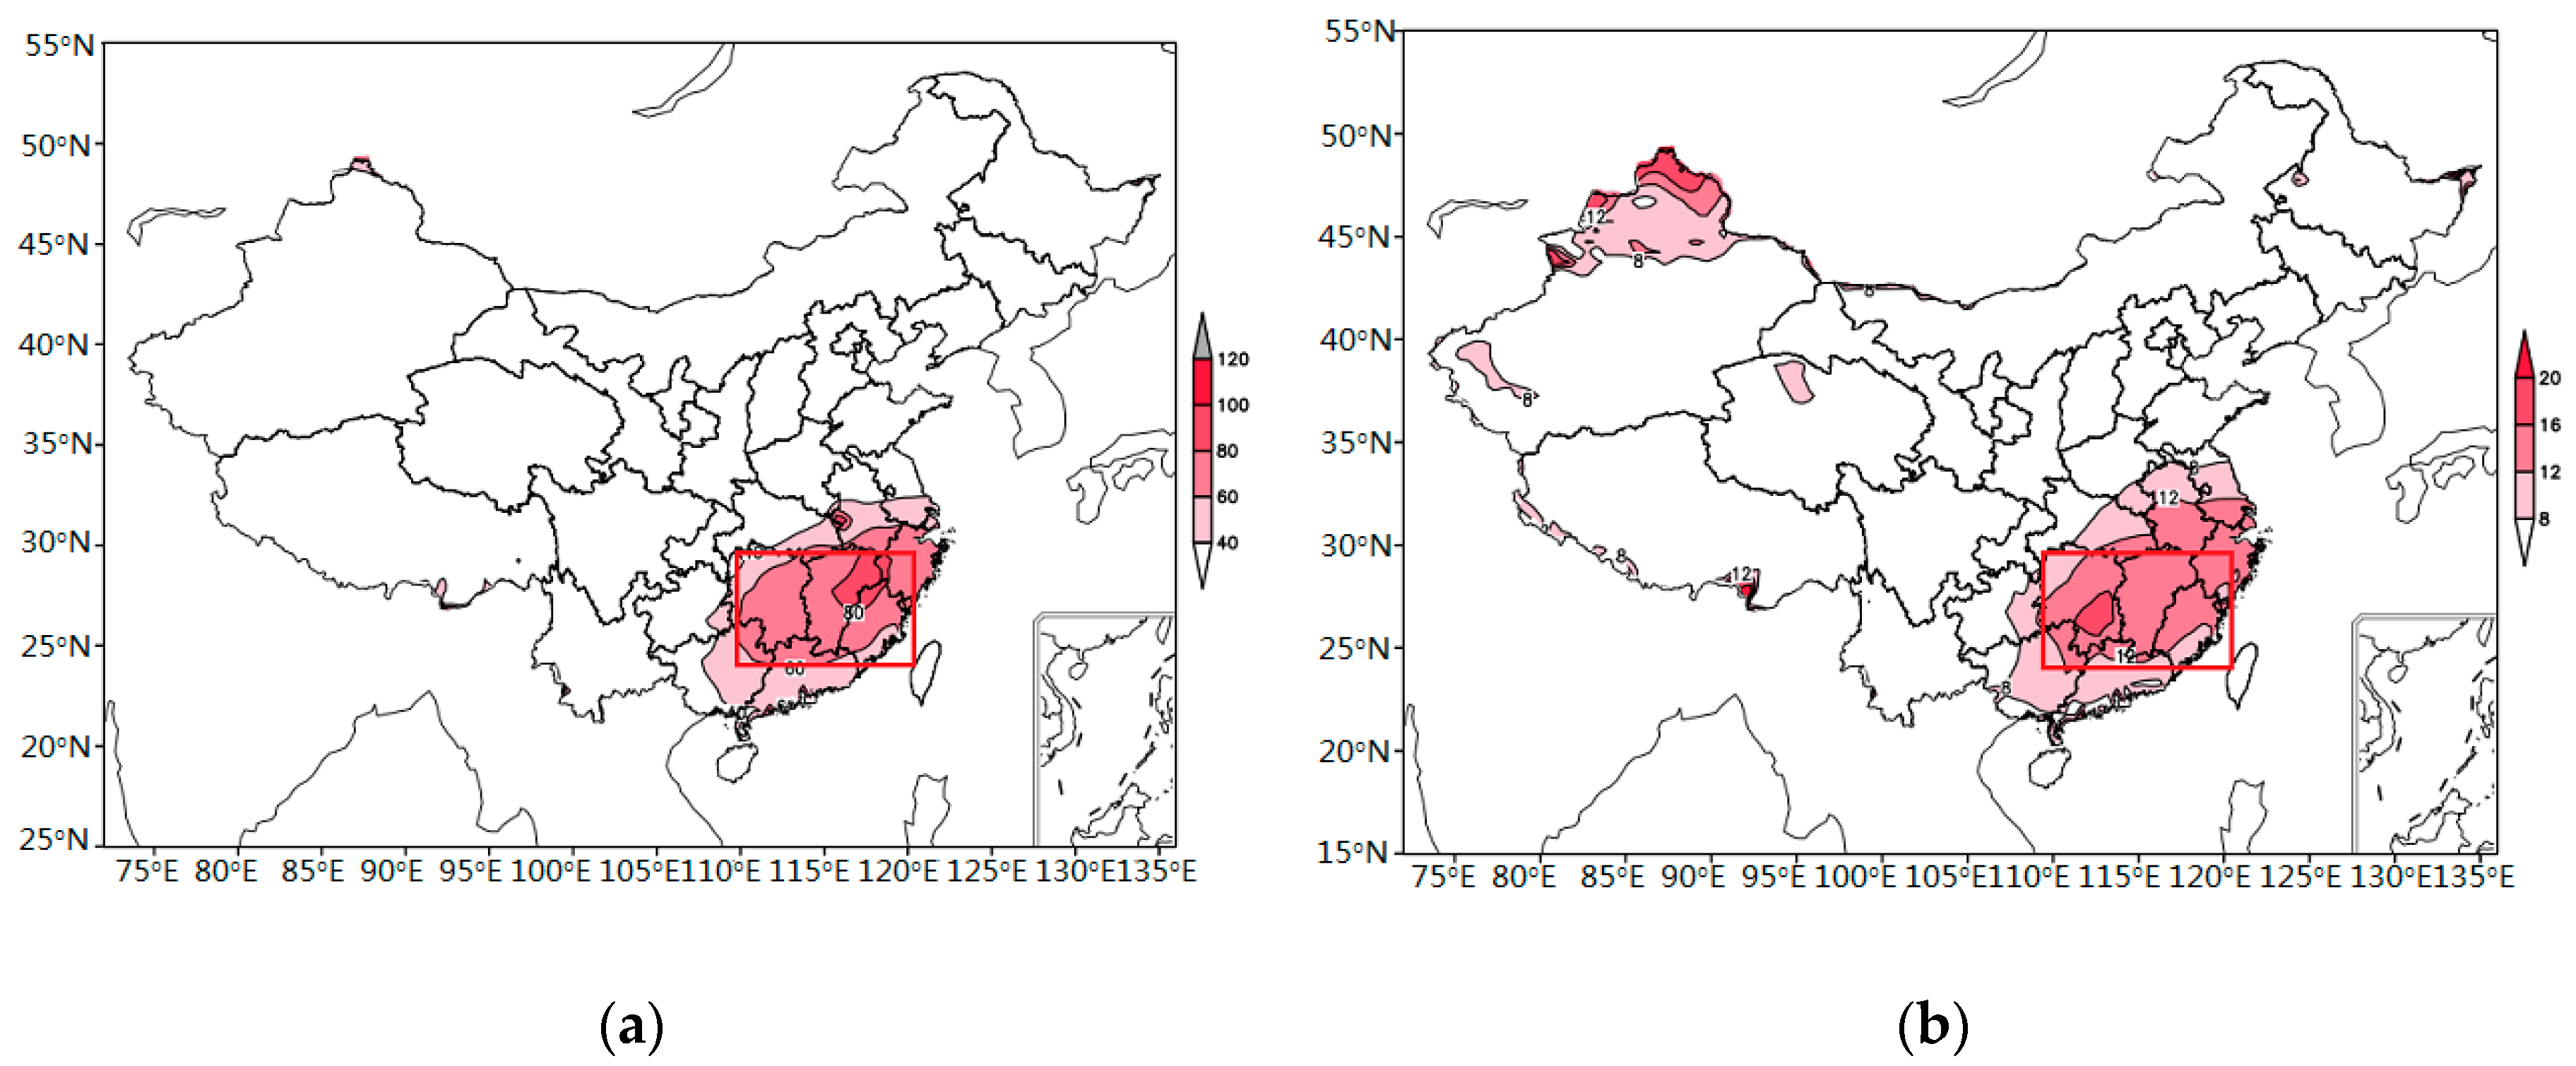
The winter precipitation amounts were larger than 40 mm·month−1 over South China and less than 40 mm/month over other parts of China (Figure 2a). In the present study, we focused on South China, where the winter precipitation amount was greater than 40 mm·month−1 and accounted for more than 8% of the annual total precipitation (Figure 2b). Anomalous winter precipitation in this region brings disastrous impacts, affecting the growth of crops and people’s daily lives. The temporal evolution of the Niño3 SST anomaly and relative deviations of winter precipitation over South China during DJF 1979–2016 is shown in Figure 3. The correlation coefficient between them was 0.60, which was significant at the 99% confidence level. It can be seen from Figure 3 that the winter precipitation in the spring El Niño events over South China was much higher than normal. Positive relative deviations of precipitation over South China occurred in periods of stronger spring El Niño events, such as 1982/83, 1991/92, 1997/98, 2009/10 and 2015/16. However, for the summer El Niño events, two cases (2002/03 and 2006/07) had small positive relative deviations, and another event (1986/87) had small negative relative deviations. It is worth noting that the number of events (5 spring and 3 summer El Nino) is very limited, and the statistical significance will be verified in the future.
3.2. Possible Mechanism of the Precipitation Differences between the Spring El Niño Events and the Summer El Niño Events
To understand the difference in the relationship between South China winter precipitation and the two types of El Niño events, the tropical ocean SST, atmospheric circulation and water vapor transport differences between the spring El Niño events and the summer El Niño events were explored.
3.2.1. Composite Analysis for the Influence of Tropical Ocean SST
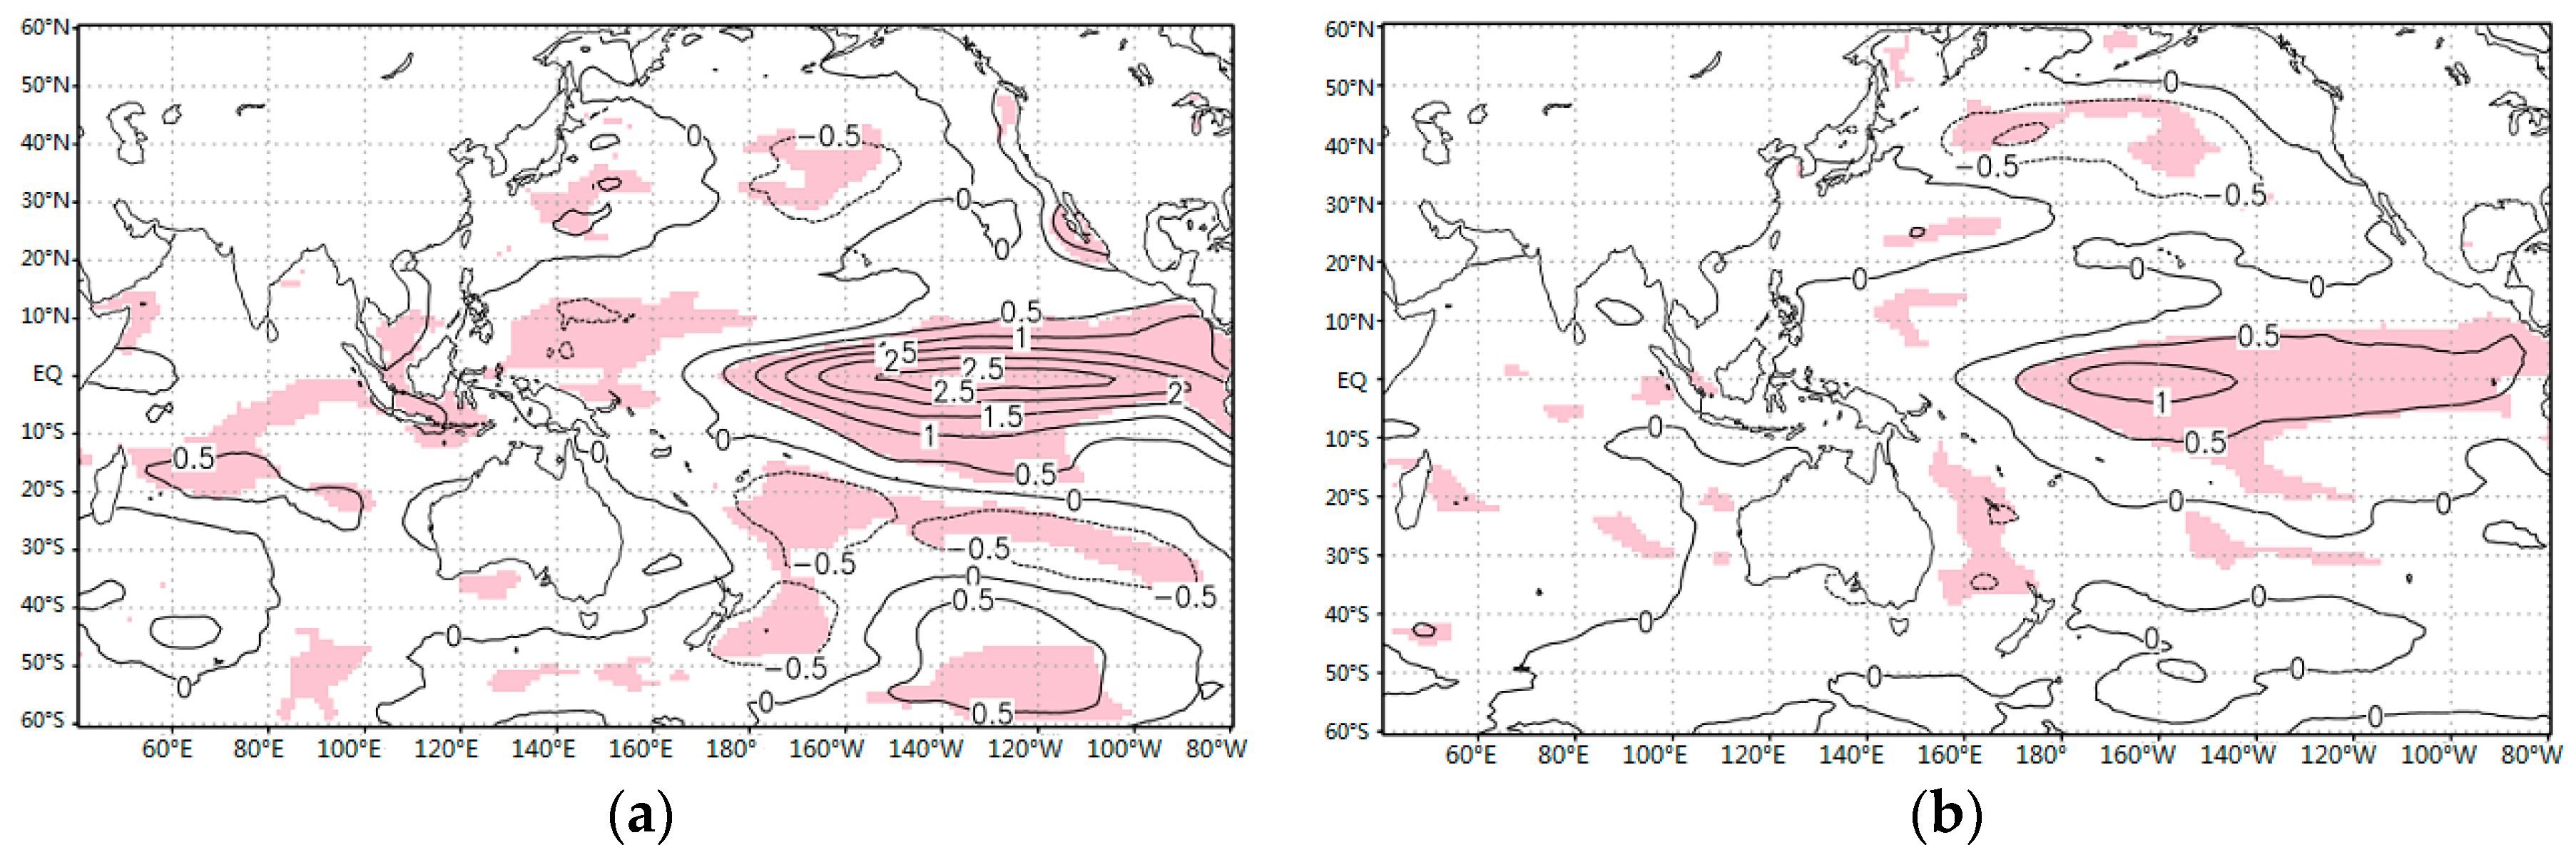
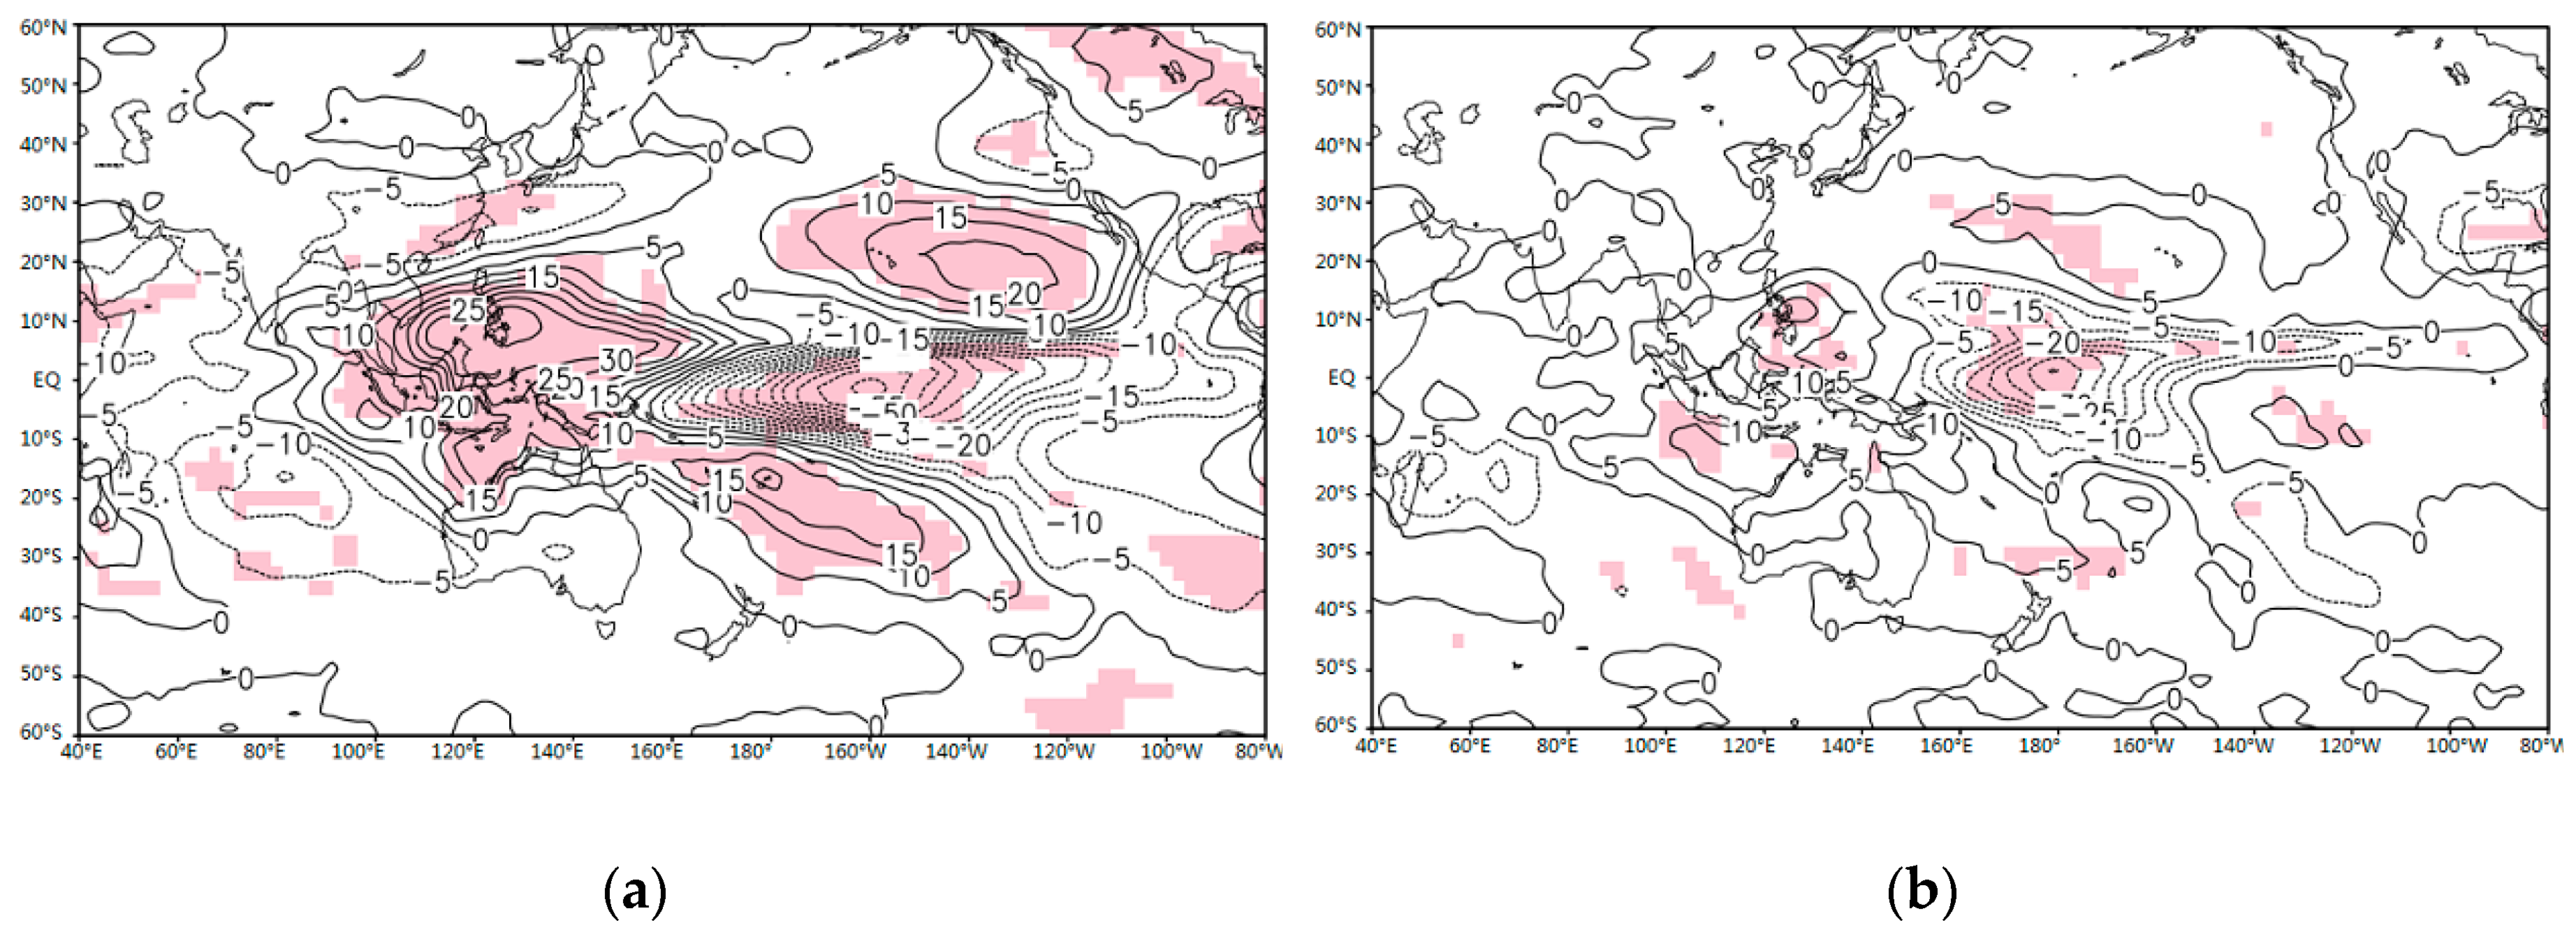
Figure 4 shows the SST anomalies in DJF (mature phase of El Niño) for spring and summer El Niño events separately, from which we can see some differences:
- In the spring El Niño events, significant positive SST anomalies in the eastern equatorial Pacific (EEP) were larger, with the maximum anomaly located within 120°–140° W. In the summer El Niño events, the maximum anomaly was smaller and in the central equatorial Pacific (CEP), near the date line.
- In the spring El Niño events, significant negative SST anomalies were in the western equatorial Pacific (WEP), with a maximum value of −0.5 °C. In the summer El Niño events, the negative SST anomalies covered a bigger area.
- The east–west SST gradient of the Pacific was weaker in the summer El Niño events than in the spring El Niño events.
3.2.2. Composite Analysis for the Atmospheric Circulation
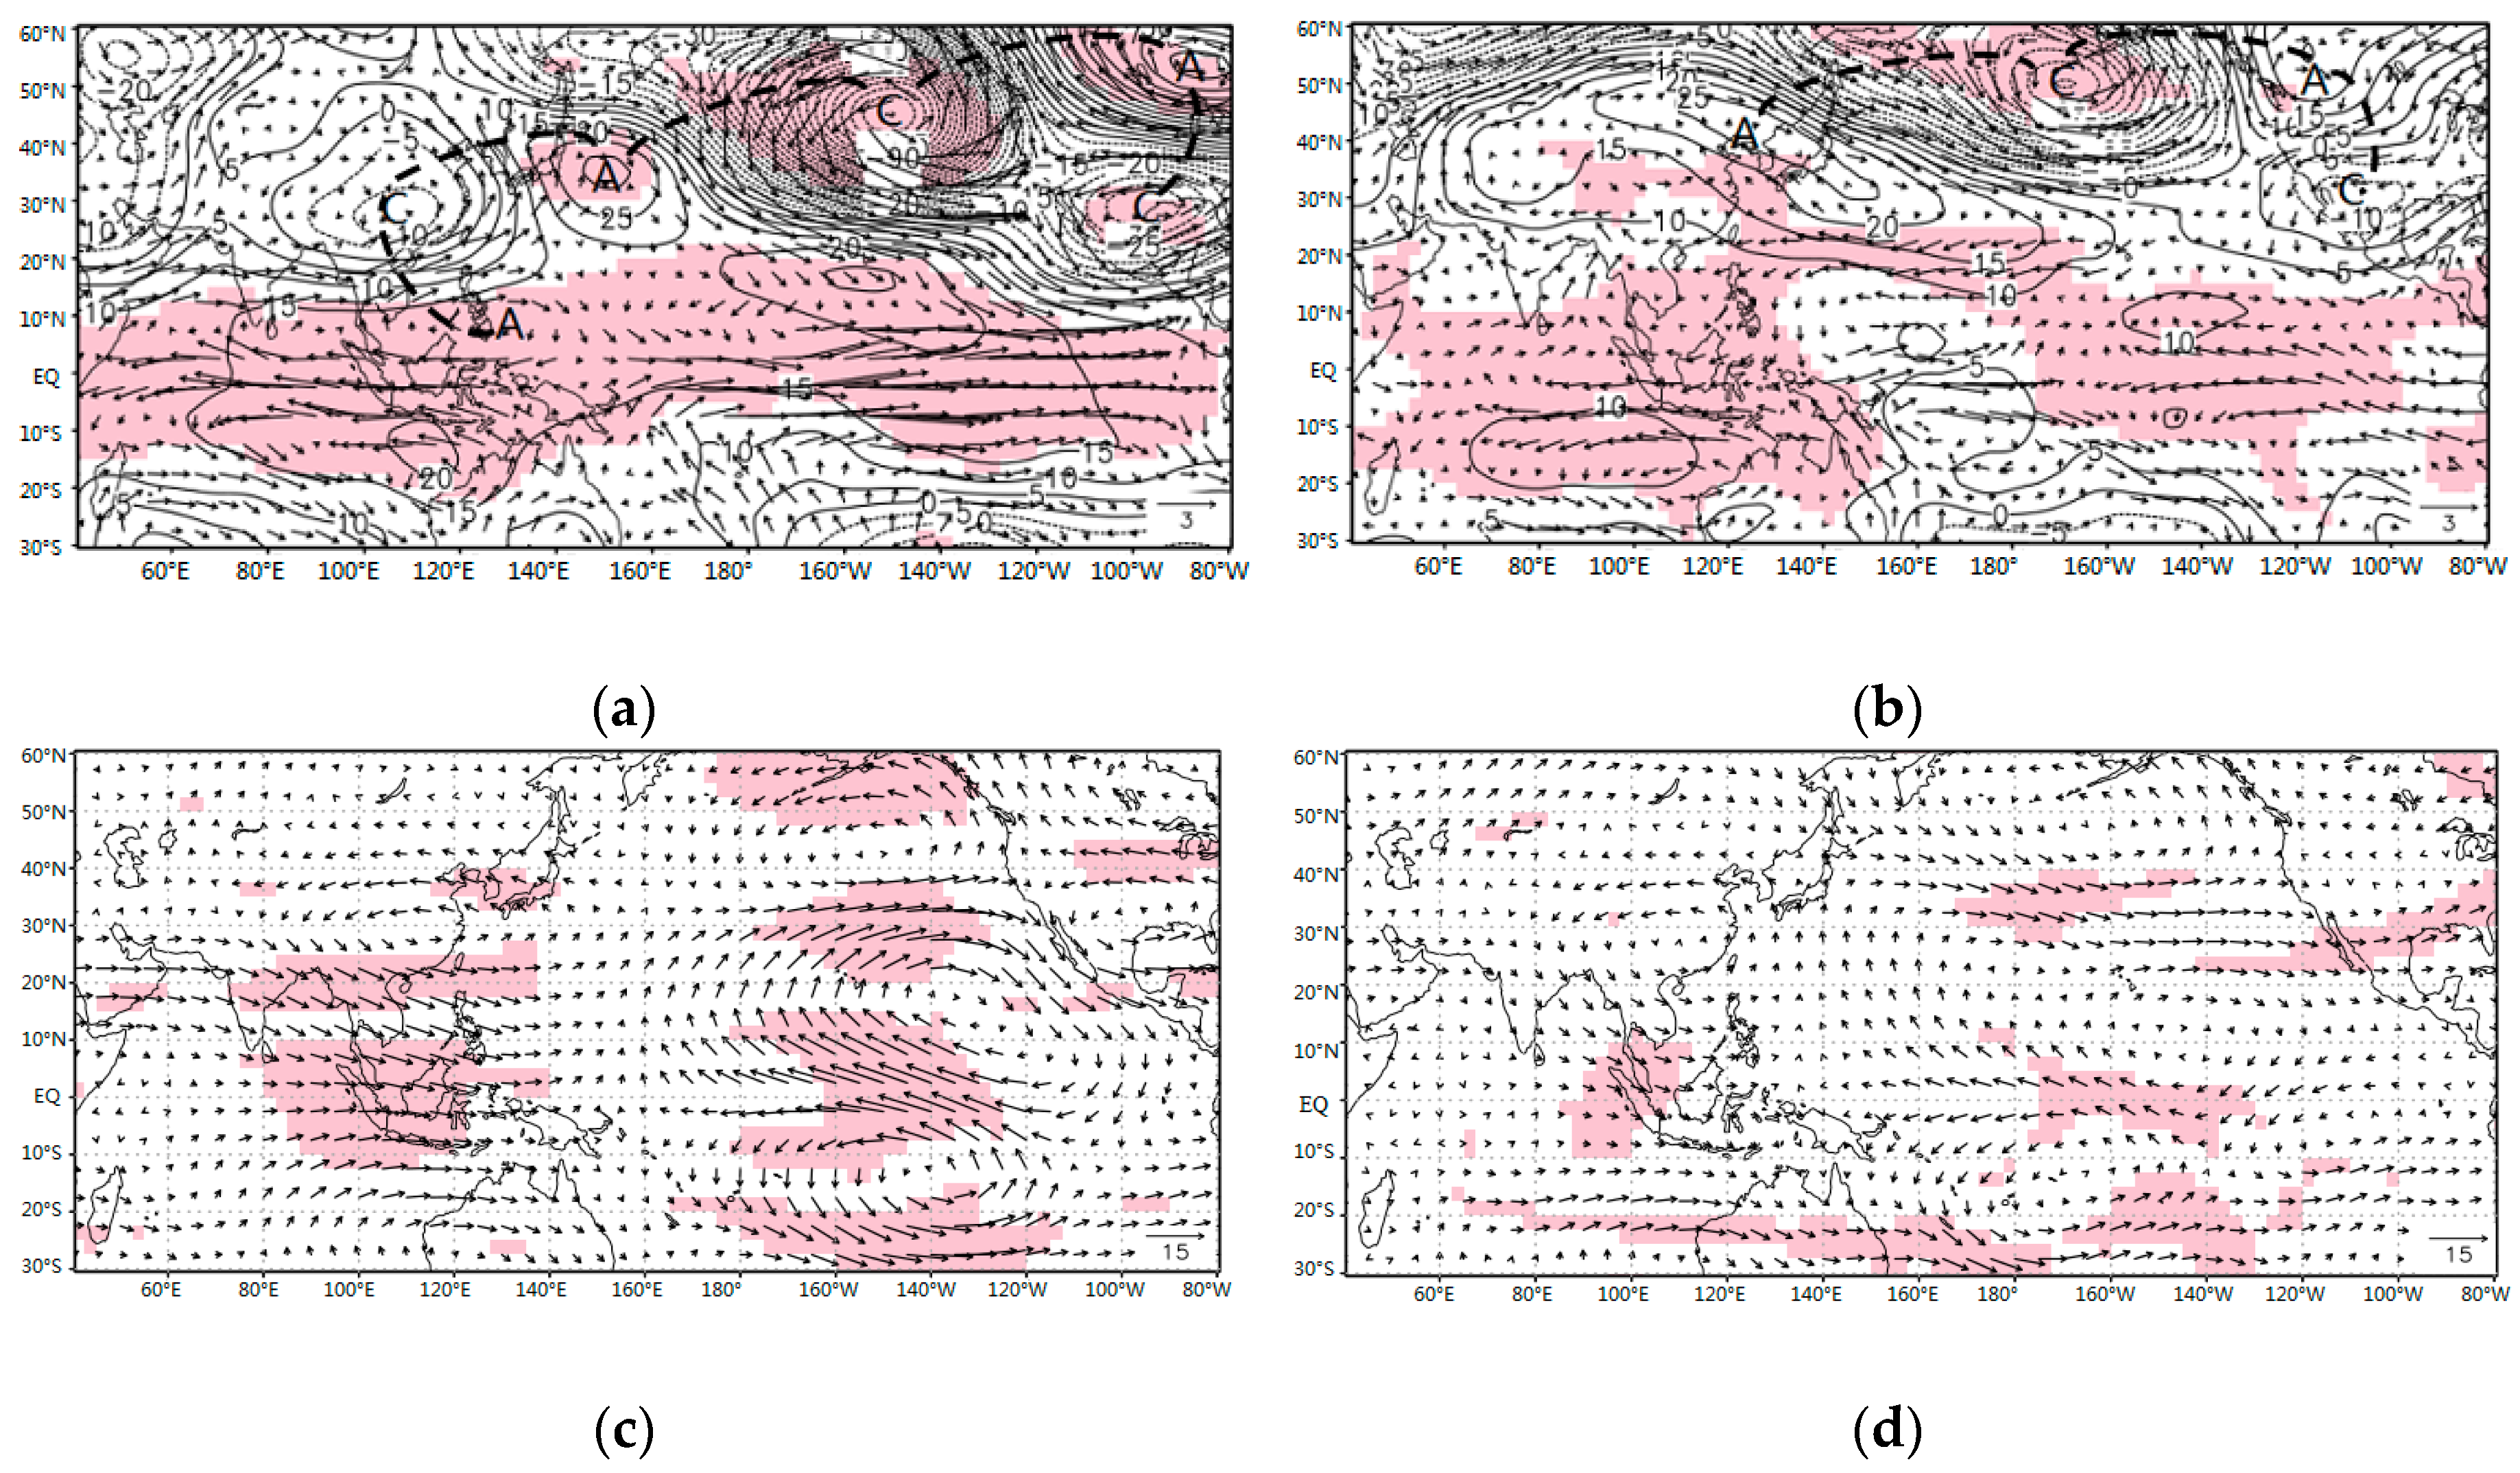
Here, we examined how the El Niño events, which occurred in the central to eastern equatorial Pacific, covaried with the winter precipitation over South China. It was speculated that some tropical climate systems may serve as an atmospheric “bridge”. We began by analyzing the tropical atmospheric variations associated with the SST anomalies. Figure 5a,b show the anomalous horizontal winds at 700 hPa (cyclone and anticyclone indicated by ‘C’ and ‘A’, respectively) and geopotential height at 500 hPa, while Figure 5c,d show the anomalous horizontal winds at 150 hPa. In the spring El Niño mature phase of ENSO (DJF), at 700 hPa (Figure 5a), there were three anomalous anticyclones: One over the Philippine Sea and SCS [6,7], another from the southeastern side of Lake Baikal to the Japan Sea, and the third over North America. Meanwhile, there were three anomalous cyclones: One from the east of the Tibetan Plateau to the eastern coast of China, another over the North Pacific, and the third over the EEP. South China was affected by anomalous southwesterly winds along the eastern flank of the anomalous cyclone, together with the western flank of the anomalous anticyclone, and then the abnormal southwesterly wind was strengthened. The southwesterly wind was conducive to the transport of water vapor from the Bay of Bengal and SCS to South China, thus supplying increased moisture to South China [4,6]. In addition, there was a significant teleconnection wave train pattern, emanating from the EEP cyclone northwards to North America with another anticyclonic center. Then, the signal was transmitted westwards, followed by the cyclone over the North Pacific, the anticyclone over the Japan Sea, the cyclone over the middle and low latitudes of East Asia, and the anticyclone over SCS and the Philippine Sea. This teleconnection pattern linked the tropical ocean SST anomaly to the Northern Hemisphere climate at the lower level. Also, this resulted in a significant anomalous westerly, which blew from the equatorial central to eastern Pacific. At 150 hPa, an anomalous cyclone was over a region from the Philippine Sea, to the SCS and to South China, and significant anomalous easterlies were observed over the CEP with two anomalous anticyclones lying to the south and north of the equator (Figure 5c). In the summer El Niño episodes, the anomalous cyclones and anticyclones at 700 hPa were weaker, the teleconnection wave train ended at the anticyclone over the Japan Sea, and the anomalous southwesterly wind over South China weakened (Figure 5b), which was not favorable to the transportation of water vapor. The anomalous cyclones and anomalous easterlies at 150 hPa were weaker too (Figure 5d).
In the spring El Niño events (Figure 5a), at 500 hPa, south of 20° N was covered by significant positive anomalies, indicating that the subtropical high over the western Pacific was stronger and southwards. There were negative anomalies from the Okhotsk Sea to the North Pacific. In East Asia, a positive anomaly extended from Lake Baikal to the Japan Sea, indicating that the East Asian trough was weakened. In the middle and low latitudes of East Asia, there was a zonal extension of negative anomalies near 25° N, indicating that the trough over there was strengthened. This circulation favored precipitation in South China. In the summer El Niño events (Figure 5b), at 500 hPa, north of 50° N was covered by negative anomalies, while positive anomalies covered the middle and low latitudes of East Asia and the subtropical high over the western Pacific was stronger and northwards. In the eastern part of China, there was a zonal extension of positive anomalies and South China was controlled by a ridge of high pressure. This circulation was not conducive to precipitation in South China.
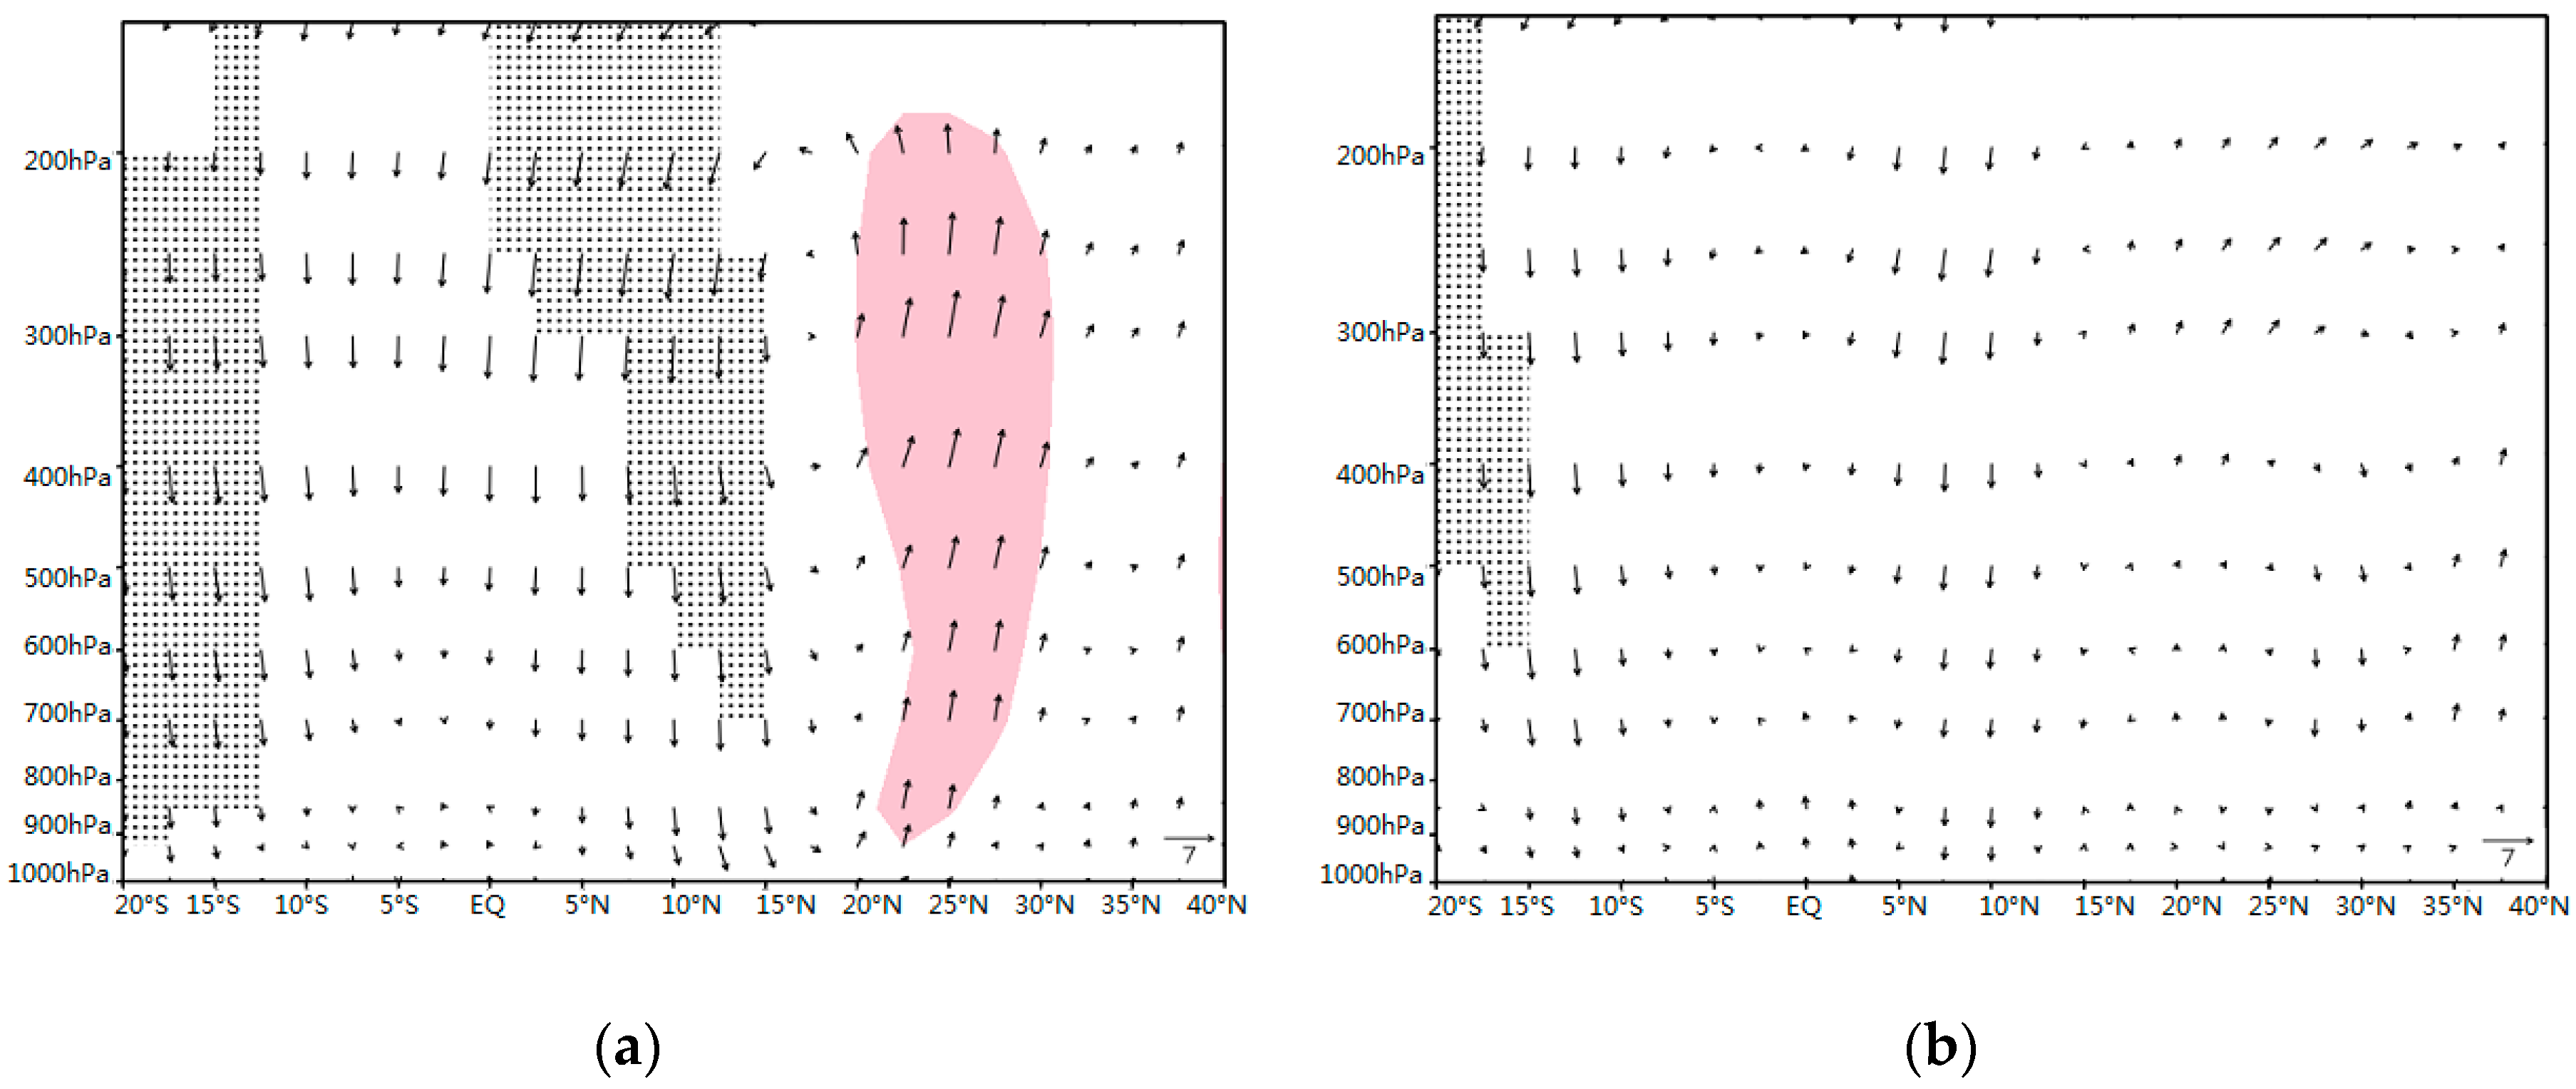
The lower-level and upper-level anomalous winds indicated a close connection between the atmospheric circulation over South China and that over the equatorial oceans. From another perspective, the regional meridional and zonal circulation changes were also important factors contributing to the lower-to-upper level connection. As shown in Figure 6a, the anomalous upward motion located at about 22° N–30° N tended to weaken the local Hadley cell in the spring El Niño events, which was not the case in the summer El Niño events (Figure 6b). It is well-known that over the tropical Pacific, the dominant zonal circulation is the Walker circulation. The above pronounced positive SST anomalies in the EEP produced a strong anomalous downward motion over the WEP, as depicted in Figure 7a. This anomalous downward air, combined with the lower-level anomalous westerly (Figure 5a) and upper-level anomalous easterly (Figure 5c) over the WEP, weakened the Walker circulation and in turn induced a significant ascending anomaly over South China (Figure 6a). In the summer El Niño events (Figure 7b), the positive SST anomalies in the CEP produced strong anomalous upward motion near the date line and downward motion over the WEP, which was weaker than that of the spring El Niño events.
Thus, through the anomalous wave train pattern and meridional and zonal circulations, the signal of the EEP SST anomaly was transported to South China and stimulated a strong upward anomaly over that region. Consequently, the convective activity there was likely to have been stronger.
The anomalies of OLR were examined to demonstrate the hypothesis. OLR is a good proxy for the convective activity in the tropics. In the spring El Niño events (Figure 8a), significant positive OLR anomalies appeared over the WEP to the SCS, while significant negative anomalies occurred over the CEP and South China. For the summer El Niño events (Figure 8b), however, the distribution of OLR anomalies was very different from that of the spring El Niño events. The negative OLR anomalies covered the WEP to the SCS, while the positive OLR anomalies over the CEP were weaker and with a smaller coverage area. The distribution of OLR anomalies over South China in the spring El Niño events showed that there was a significant anomalous upward motion over the region, and the convective activity was more active than that of the summer El Niño events. This feature was consistent with the anomalous SST anomalies (Figure 4a) in these regions. Whereas, for the summer El Niño events, the aforementioned anomalies became weaker.
3.3. Composite Analysis for Water Vapor Transport
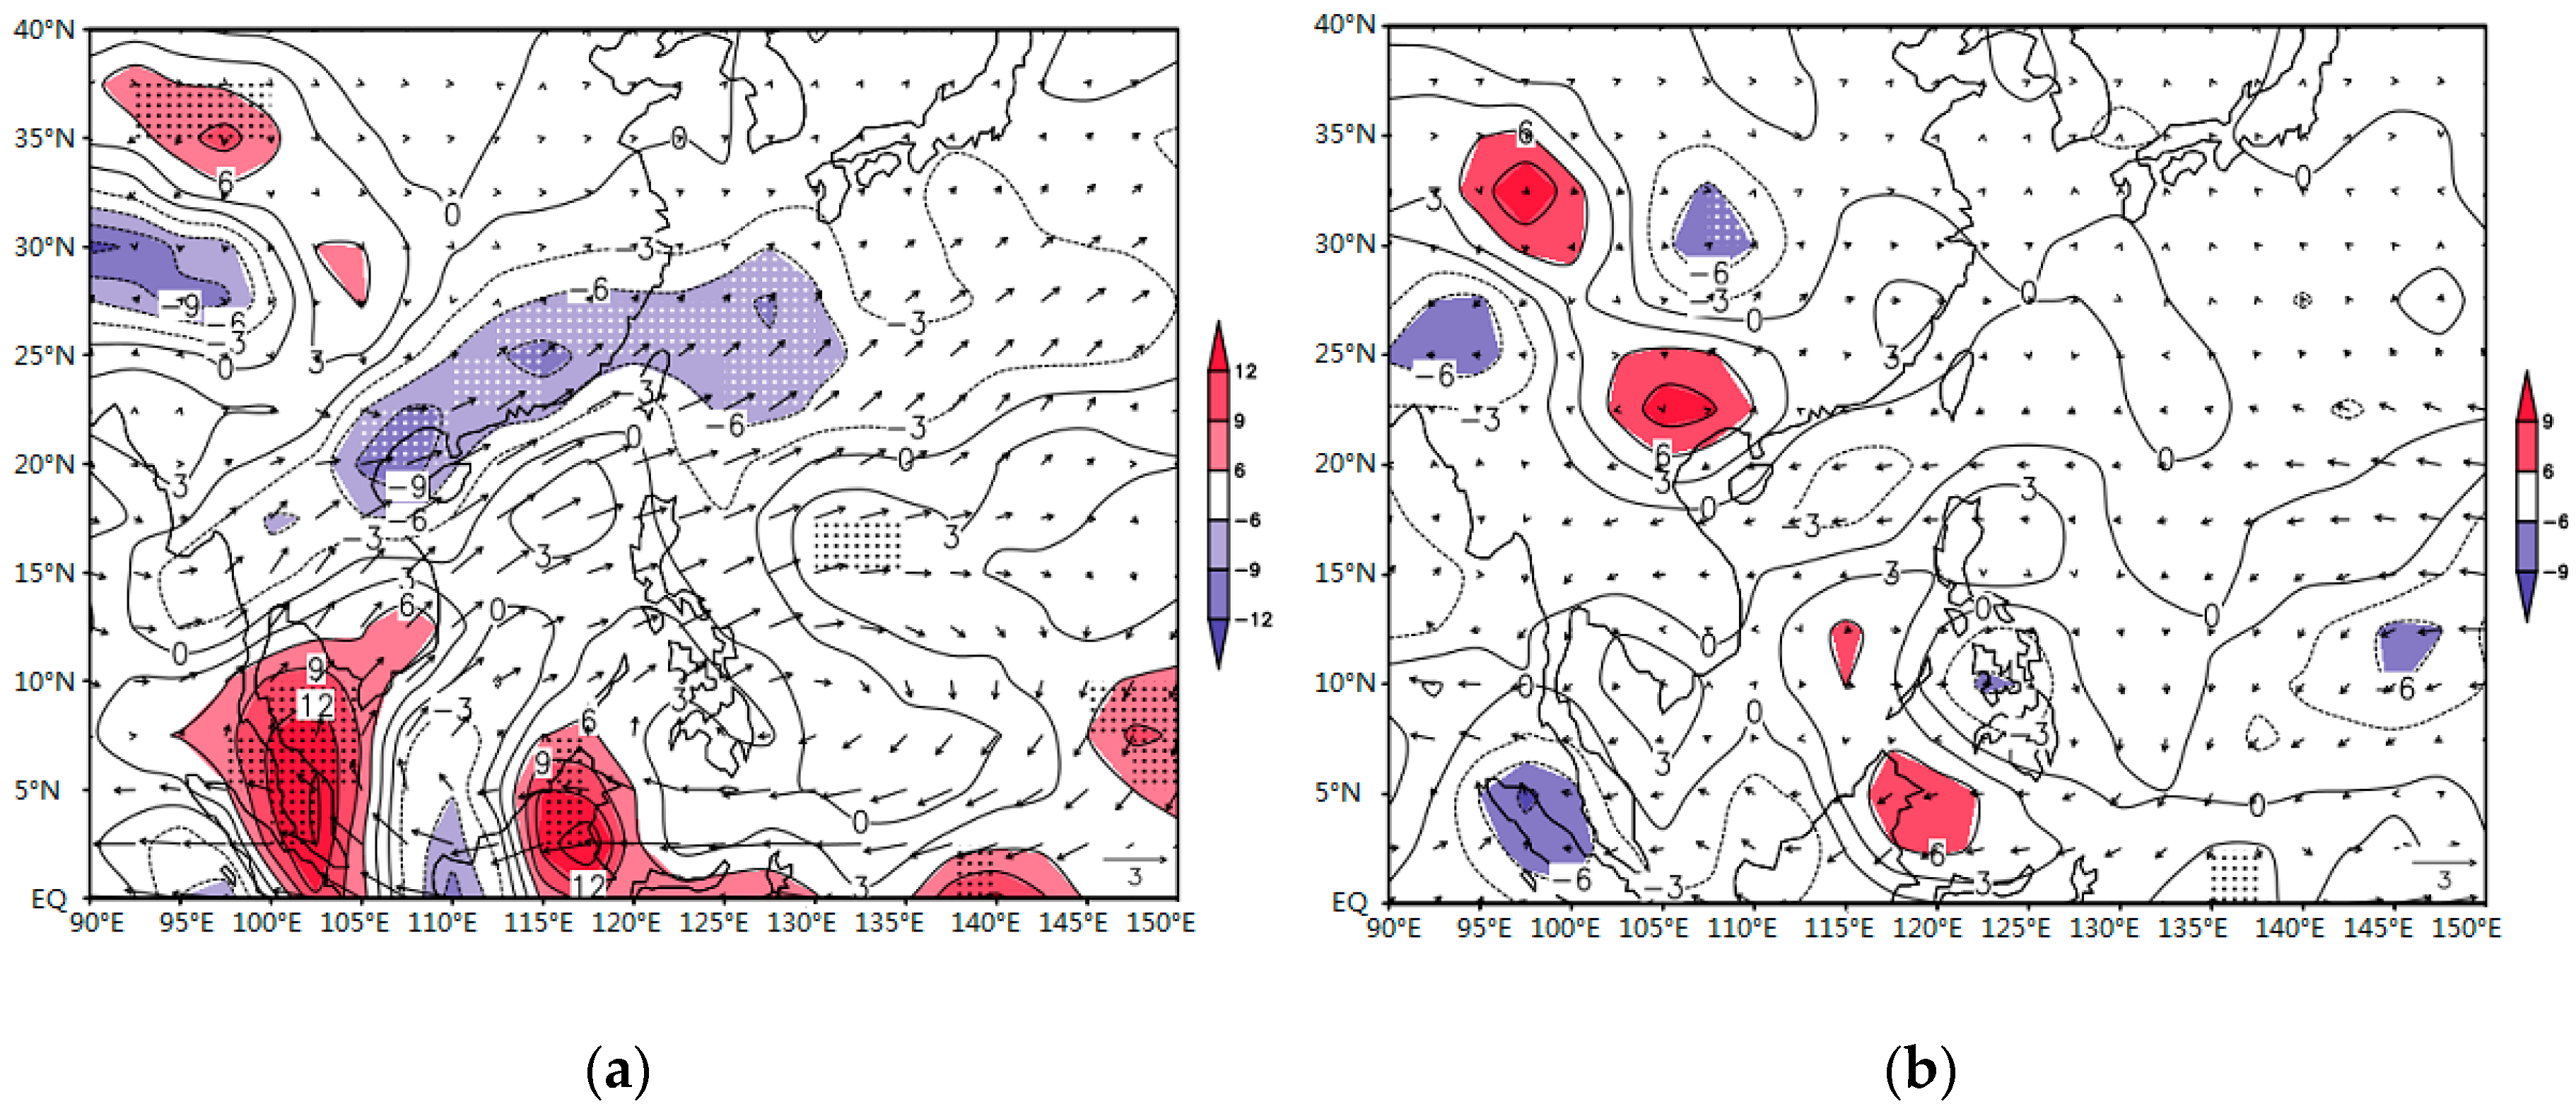
Figure 9 shows the water vapor flux at 850 hPa and its divergence in the composites of the spring and summer El Niño events during DJF 1979–2016, separately. There was a prominent anomalous anticyclone of water vapor flux that formed over the WEP, to the SCS and to South China, and a significant water vapor sink anomaly over South China, during the spring El Niño events (Figure 9a), implying strong convergence of water vapor over South China. For the summer El Niño events, however, the anomalous anticyclone of water vapor flux was weaker than that of the spring El Niño events, and there was a divergence of water vapor over South China (non-significant), which did not favor the formation of precipitation over the region.
4. Summary and Discussion
The objective of the present study was to investigate and understand the different impacts of spring and summer El Niño events on winter precipitation over South China. Their relationships featured clear differences according to the onset time of El Niño events. Our specific findings can be summarized as follows:
Winter precipitation over South China tended to be much higher than normal for the spring El Niño events during DJF 1979–2016.
For the spring El Niño events, the Hadley cell and Walker circulation served as a bridge, linking the warmer SST in the EEP and South China winter precipitation. This physical process can be described as follows: During DJF, a positive SST anomaly in the EEP was concurrent with strong convective activity over South China via anomalous meridional circulation along the equatorial Pacific, anomalous Hadley cell along 110°–130° E, and a zonal westward teleconnection wave train pattern from the EEP, to North America, to the North Pacific, to the Japan Sea, to the middle and low latitudes of East Asia, and to SCS and the Philippine Sea at 700 hPa. In addition, an increase in the pumping effect at 200 hPa contributed to the convective activity. Meanwhile, the western Pacific subtropical high moved southwards and strengthened at 500 hPa, and abnormal southwesterly winds brought plentiful water vapor to South China at 850 hPa. The development of convective activity and the plentiful water vapor supply favored more precipitation over South China. For the summer El Niño events, a positive SST anomaly in the CEP, the change in the Hadley cell and Walker circulation were weaker, the teleconnection wave train ended in the Japan Sea, South China was controlled by a ridge of high pressure, and there was a divergence of water vapor over South China (non-significant), which resulted in a precipitation close to normal over the region.
However, it is still not clear why or how different onsets of El Niño lead to the different atmosphere circulations, thus affecting the winter precipitation in South China differently. Further physiological mechanism remains to be studied.
Author Contributions
Conceptualization, L.F. and J.X.; Methodology, L.F.; Software, L.F.; Validation, L.F., J.X. and H.G.; Formal Analysis, L.F.; Investigation, L.F.; Resources, L.F.; Data Curation, L.F.; Writing-Original Draft Preparation, L.F.; Writing-Review & Editing, L.F.; Visualization, L.F.; Supervision, J.X.; Project Administration, L.F.; Funding Acquisition, J.X.
Funding
This study was funded by National Key Technologies R&D Program of China with No. 2017YFC1501802 and project of Enhancing School with Innovation of Guangdong Ocean University with No. 2016KTSCX052.
Conflicts of Interest
The authors declare no conflict of interest.
References
- Wang, L.; Feng, J. Two major modes of the wintertime precipitation over China. Chin. J. Atmos. Sci. 2011, 35, 1105–1116. [Google Scholar]
- Yuan, Y.; Gao, H.; Jia, X.; Wan, J. The climate impact of the super El Niño event in 2014–2016. Meteorol. Mon. 2016, 42, 532–539. (In Chinese) [Google Scholar]
- Sun, C.; Yang, S. Persistent severe drought in southern china during winter–spring 2011: Large-scale circulation patterns and possible impacting factors. J. Geophys. Res.-Atmos. 2012, 117, D10112. [Google Scholar] [CrossRef]
- Zhang, R.H.; Sumi, A.; Kimoto, M. Impact of El Niño on the East Asian monsoon: A diagnostic study of the 86/87 and 91/92 events. J. Meteorol. Soc. Jpn. 1996, 74, 49–62. [Google Scholar] [CrossRef]
- Zhang, R.H.; Sumi, A.; Kimoto, M. A diagnostic study of the impact of El Niño. Adv. Atmos. Sci. 1999, 16, 229–241. [Google Scholar] [CrossRef]
- Wang, B.; Wu, R.; Fu, X. Pacific–East Asia teleconnection: How does ENSO affect East Asian climate? J. Clim. 2000, 13, 1517–1536. [Google Scholar] [CrossRef]
- Wu, R.; Hu, Z.Z.; Kirtman, B.P. Evolution of ENSO-related rainfall Anomalies in East Asia. J. Clim. 2003, 16, 3742–3758. [Google Scholar] [CrossRef]
- Zhang, R.; Sumi, A. Moisture circulation over East Asia during El Niño episode. J. Meteorol. Soc. Jpn. 2002, 80, 213–227. [Google Scholar] [CrossRef]
- Zhou, L.; Wu, R. Respective impacts of East Asia winter monsoon and ENSO on winter rainfall in China. J. Geophys. Res.-Atmos. 2010, 115, D02107. [Google Scholar] [CrossRef]
- Yang, Q. Impact of the Indian Ocean subtropical dipole on the precipitation of east China during winter monsoons. J. Geophys. Res.-Atmos. 2009, 114, D14110. [Google Scholar] [CrossRef]
- Zhou, L.T.; Chiyung, T.; Zhou, W.; Chan, J.C.L. Influence of South China Sea SST and the ENSO on winter rainfall over South China. Adv. Atmos. Sci. 2010, 27, 832–844. [Google Scholar] [CrossRef]
- Li, C.Y. Interaction between anomalous winter monsoon in East Asia and El Niño events. Adv. Atmos. Sci. 1990, 7, 36–46. [Google Scholar]
- Tao, S.Y.; Zhang, Q.Y. Response of the Asian winter and summer monsoon to ENSO events. Chin. J. Atmos. Sci. 1998, 22, 399–407. [Google Scholar]
- Chen, W. Impacts of El Niño and La Niña on the cycle of the East Asian winter and summer monsoon. Chin. J. Atmos. Sci. 2002, 26, 595–610. [Google Scholar]
- Jin, Z.H.; Tao, S.Y. A Study on the Relationships between ENSO Cycle and rainfalls during summer and winter in eastern China. Chin. J. Atmos. Sci. 1999, 23, 663–672. [Google Scholar]
- Ni, Y.Q.; Zhou, L.; Liu, Y.; Wu, A.M.; Wang, G.M.; Yang, X.Q.; Zhang, X.D. Study for ENSO and its influences on Asian monsoon and climate change of China. Chin. J. Atmos. Sci. 1995, 15, 30–45. [Google Scholar]
- Huang, R.H.; Chen, J.L.; Wang, L.; Lin, Z.D. Characteristics, processes, and causes of the spatio-temporal variabilities of the East Asian monsoon system. Adv. Atmos. Sci. 2012, 29, 910–942. [Google Scholar] [CrossRef]
- Li, X.Z.; Liang, W.; Wen, Z.P. Characteristics of the atmosphere water vapor and its relationship with rainfall in south China in northern autumn, winter and spring. J. Trop. Meteorol. 2010, 26, 626–632. (In Chinese) [Google Scholar]
- Wang, T.; Yang, S.; Wen, Z.; Wu, R.; Zhao, P. Variations of the winter India-Burma trough and their links to climate anomalies over southern and eastern Asia. J. Geophys. Res.-Atmos. 2011, 116, D23118. [Google Scholar] [CrossRef]
- Zong, H.F.; Bueh, C.; Wei, J.; Chen, L.T. Intensity of the trough over the Bay of Bengal and its impact on the Southern China precipitation in winter. Atmos. Ocean. Sci. Lett. 2012, 5, 246–251. [Google Scholar]
- Wu, B.Y.; Huang, R.H. Effects of the extremes in the North Atlantic oscillation on East Asia winter monsoon. Chin. J. Atmos. Sci. 1999, 23, 641–651. [Google Scholar]
- Gong, D.Y.; Wang, S.W.; Zhu, J.H. East Asian winter monsoon and arctic oscillation. Geophys. Res. Lett. 2001, 28, 2073–2076. [Google Scholar] [CrossRef]
- Wu, B.Y.; Wang, J. Possible impacts of winter Arctic oscillation on Siberian High, the East Asian winter monsoon and sea-ice extent. Adv. Atmos. Sci. 2002, 19, 297–320. [Google Scholar]
- Wu, B.Y.; Wang, J. Winter Arctic oscillation, Siberian High and East Asian winter monsoon. Geophys. Res. Lett. 2002, 29, 1897. [Google Scholar] [CrossRef]
- Sung, M.K.; Lim, G.H.; Kug, J.S. Phase asymmetric downstream development of the North Atlantic oscillation and its impact on the East Asian winter monsoon. J. Geophys. Res. 2010, 115, D09105. [Google Scholar] [CrossRef]
- Fu, C.B. A review of study on El Niño/Southern Oscillation associated with the interannual climate variability. Chin. J. Atmos. Sci. 1987, 11, 209–220. [Google Scholar]
- Huang, R.H.; Wu, Y.F. The influence of ENSO on the summer climate change in China and its mechanisms. Adv. Atmos. Sci. 1989, 6, 21–32. [Google Scholar]
- Wu, R.; Wang, B. A Contrast of the East Asian Summer Monsoon-ENSO Relationship between 1962-77 and 1978-93. J. Clim. 2002, 15, 3266–3279. [Google Scholar] [CrossRef]
- Chen, J.; Wen, Z.; Wu, R.; Chen, Z.; Zhao, P. Interdecadal changes in the relationship between southern China winter-spring precipitation and ENSO. Clim. Dyn. 2014, 43, 1327–1338. [Google Scholar] [CrossRef]
- Yuan, Y.; Li, C.Y.; Yang, S. Characteristics of winter precipitation over southern China and asymmetric impact of ENSO. Acta Meteorol. Sin. 2014, 72, 237–255. [Google Scholar]
- Yasunari, T. Zonally propagating modes of the global east-west circulation associated with the Southern Oscillation. J. Meteorol. Soc. Jpn. 1985, 63, 1013–1029. [Google Scholar] [CrossRef]
- Fu, C.B.; Diaz, H.F.; Fletcher, J.O. Characteristics of the response of sea surface temperature in the central Pacific associated with warm episodes of the Southern Oscillation. Mon. Weather Rev. 1986, 114, 1716–1738. [Google Scholar] [CrossRef]
- Quinn, W.H.; Neal, V.T. El Niño occurrences over the past four and a half centuries. J. Geophys. Res. 1987, 92, 14449–14461. [Google Scholar] [CrossRef]
- Enfield, D.B.; Cid, L.S. Low-frequency changes in El Niño–Southern Oscillation. J. Clim. 1991, 4, 1137–1146. [Google Scholar] [CrossRef]
- Wang, S. Reconstruction of El Niño event chronology for the last 600-year period. Acta Meteorol. Sin. 1992, 6, 47–57. (In Chinese) [Google Scholar]
- Xu, J.J.; Chan, J.C.L. The role of the Asian-Australian monsoon system in the onset time of El Niño events. J. Clim. 2001, 14, 418–433. [Google Scholar] [CrossRef]
- Horii, T.; Hanawa, K. A relationship between timing of El Nino onset and subsequent evolution. Geophys. Res. Lett. 2004, 31, L06304. [Google Scholar] [CrossRef]
- Fan, J.F.; Meng, J.; Ashkenazy, Y.; Havlin, S.; Schellnhuber, H.J. Network analysis reveals strongly localized impacts of El Nino. Proc. Natl. Acad. Sci. USA 2017, 114, 7543–7548. [Google Scholar] [CrossRef] [PubMed]
- Timmermann, A.; An, S.I.; Kug, J.S.; Jin, F.F.; Cai, W.J.; Capotondi, A.; Cobb, K.; Lengaigne, M.; McPhaden, M.J.; Stuecker, M.F.; et al. El Niño–Southern Oscillation complexity. Nature 2018, 559, 535–545. [Google Scholar] [CrossRef] [PubMed]
- Yuan, L.; He, J.H. Different Impacts of Two Types of ENSO on Winter Rainfall over South China. Arid Meteorol. 2013, 31, 24–31. [Google Scholar]
- Hirahara, S.; Ishii, M.; Fukuda, Y. Centennial-scale sea surface temperature analysis and its uncertainty. J. Clim. 2014, 27, 57–75. [Google Scholar] [CrossRef]
- Kalnay, E.; Kanamitsu, M.; Kistler, R.; Collins, W.; Deaven, D.; Gandin, L.; Iredell, M.; Saha, S.; White, G.; Woollen, J.; et al. The NCEP/NCAR 40-year reanalysis project. Bull. Am. Meteorol. Soc 1996, 77, 437–470. [Google Scholar] [CrossRef]
- Lee, H.T.; Gruber, A.; Ellingson, R.G.; Laszlo, I. Development of the HIRS Outgoing Longwave Radiation climate data set. J. Atmos. Ocean. Technol. 2007, 24, 2029–2047. [Google Scholar] [CrossRef]
Figure 1.
Composite time series of SST anomaly (unit: °C) for spring (open circles) and summer (solid circles) El Niño events during 1979–2016.
Figure 1.
Composite time series of SST anomaly (unit: °C) for spring (open circles) and summer (solid circles) El Niño events during 1979–2016.

Figure 2.
Averaged (a) monthly precipitation (units: mm·month−1; contour interval: 20 mm·month−1; shaded areas indicate precipitation above 40 mm·month−1) and (b) winter precipitation percentage (units: %; contour interval: 4%; shaded areas indicate precipitation percentages above 8%) during DJF 1979–2016. The red rectangle denotes the location of South China (22° N–30° N, 108° E–120° E).

Figure 3.
Temporal evolution of the Niño3 SST anomaly (blue; units: °C) and relative deviation of winter precipitation (orange) over South China during DJF 1979–2016. The relative deviation of winter precipitation equals the absolute deviation divided by the arithmetic mean of winter precipitation (during 1961–2016). Positive values indicate greater than mean precipitation, and negative values indicate less than mean precipitation.

Figure 4.
Composites SST anomalies (units: °C) during DJF 1979–2016 for (a) spring and (b) summer El Niño events. The contour interval is 0.5 °C. Shaded areas are statistically significant at the 95% confidence level, based on the Student’s t-test.
Figure 4.
Composites SST anomalies (units: °C) during DJF 1979–2016 for (a) spring and (b) summer El Niño events. The contour interval is 0.5 °C. Shaded areas are statistically significant at the 95% confidence level, based on the Student’s t-test.

Figure 5.
Composites of anomalies of (a) 700-hPa horizontal winds (units: m·s−1) and 500-hPa geopotential height (contours; units: gpm) and (c) 150-hPa horizontal winds (units: m·s−1) during DJF 1979–2016 for the spring El Niño events. Panels (b,d) show the same but for the summer El Niño events. The wind scale is shown at the bottom of the respective panels. The contour interval is 10 gpm. Shaded areas indicate statistical significance at the 95% confidence level, based on the Student’s t-test.

Figure 6.
Composite anomalies of latitude–pressure cross-sections of meridional circulations (vectors) averaged along 110° E–130° E during DJF 1979–2016 for the (a) spring and (b) summer El Niño events. The units for meridional wind and vertical motion are m·s−1 and hPa·s−1, respectively. The values of vertical velocity are multiplied by −300. Shaded areas have an upward vertical velocity of ≥0.01 hPa·s−1. Dotted areas indicate statistically significant vertical velocity at the 95% confidence level, based on the Student’s t-test.

Figure 7.
Composite anomalies of longitude–pressure cross-sections of vertical velocity (units: hPa·s−1) averaged along 15° S–15° N during DJF 1979–2016 for the (a) spring and (b) summer El Niño events. Dotted areas indicate statistically significant vertical velocity at the 95% confidence level, based on the Student’s t-test.

Figure 8.
Composite OLR (units: W·m−2) anomalies during DJF 1979–2016 for the (a) spring and (b) summer El Niño events. The contour interval is 5 W·m−2. Shaded areas are statistically significant at the 95% confidence level, based on the Student’s t-test.
Figure 8.
Composite OLR (units: W·m−2) anomalies during DJF 1979–2016 for the (a) spring and (b) summer El Niño events. The contour interval is 5 W·m−2. Shaded areas are statistically significant at the 95% confidence level, based on the Student’s t-test.

Figure 9.
Composite water vapor flux anomaly during DJF 1979–2016 at 850 hPa (vectors; units: g·cm−1·hPa−1·s−1) and its divergence (contours; units: 10−7g·cm−2·hPa−1·s−1) for the (a) spring and (b) summer El Niño events. Dotted areas indicate statistical significance at the 95% confidence level, based on the Student’s t-test.


Table 1.
Classification of El Niño events during 1979–2016.
| Sequence | Duration | Last | Onset_Time | Type |
|---|---|---|---|---|
| 1 | June 1982–August 1983 | 15 | May | SP |
| 2 | October 1986–January 1988 | 16 | September | SU |
| 3 | June 1991–June 1992 | 13 | May | SP |
| 4 | May 1997–May 1998 | 13 | April | SP |
| 5 | September 2002–February 2003 | 6 | August | SU |
| 6 | September 2006–January 2007 | 5 | August | SU |
| 7 | June 2009–March 2010 | 10 | May | SP |
| 8 | April 2015–April 2016 | 13 | March | SP |
© 2018 by the authors. Licensee MDPI, Basel, Switzerland. This article is an open access article distributed under the terms and conditions of the Creative Commons Attribution (CC BY) license (http://creativecommons.org/licenses/by/4.0/).
Share and Cite
MDPI and ACS Style
Fan, L.; Xu, J.; Guan, H. Impacts of Different Onset Time El Niño Events on Winter Precipitation over South China. Atmosphere 2018, 9, 366. https://doi.org/10.3390/atmos9100366
AMA Style
Fan L, Xu J, Guan H. Impacts of Different Onset Time El Niño Events on Winter Precipitation over South China. Atmosphere. 2018; 9(10):366. https://doi.org/10.3390/atmos9100366
Chicago/Turabian StyleFan, Lingli, Jianjun Xu, and Huade Guan. 2018. "Impacts of Different Onset Time El Niño Events on Winter Precipitation over South China" Atmosphere 9, no. 10: 366. https://doi.org/10.3390/atmos9100366
Note that from the first issue of 2016, this journal uses article numbers instead of page numbers. See further details here.