

Abstract
Agricultural production across eastern Australia and New Zealand is highly vulnerable to drought, but there is a dearth of observational drought information prior to CE 1850. Using a comprehensive network of 176 drought-sensitive tree-ring chronologies and one coral series, we report the first Southern Hemisphere gridded drought atlas extending back to CE 1500. The austral summer (December–February) Palmer drought sensitivity index reconstruction accurately reproduces historically documented drought events associated with the first European settlement of Australia in CE 1788, and the leading principal component explains over 50% of the underlying variance. This leading mode of variability is strongly related to the Interdecadal Pacific Oscillation tripole index (IPO), with a strong and robust antiphase correlation between (1) eastern Australia and the New Zealand North Island and (2) the South Island. Reported positive, negative, and neutral phases of the IPO are consistently reconstructed by the drought atlas although the relationship since CE 1976 appears to have weakened.
Export citation and abstract BibTeX RIS

Content from this work may be used under the terms of the Creative Commons Attribution 3.0 licence. Any further distribution of this work must maintain attribution to the author(s) and the title of the work, journal citation and DOI.
1. Introduction
Knowledge of natural long-term hydroclimatic variability is essential for water-resource and land-use management and to manage risks associated with extreme events such as drought (Bell et al 2013). However, there is a dearth of reliable high-resolution (temporal and spatial) records of past rainfall patterns prior to the late 19th century in Australia and New Zealand and for much of the Southern Hemisphere (SH), which limits our ability to estimate long-term hydroclimatic variability. This lack of long-term hydroclimate data poses great challenges for managing water resources, which have been largely focused on short-term response rather than proactive planning and mitigation strategies (Ding et al 2011). Droughts in Australia and New Zealand can have significant ecological, social and economic impacts. For example, the 2002 to 2003 Australian drought caused an overall reduction of gross domestic production (GDP) by 1.6% (Horridge et al 2005) and was associated with severe bushfires across New South Wales and the Australian Capital Territory. The 2013 drought in New Zealand was estimated to have caused GDP to fall by 0.6% (McDonald 2013). There is thus an urgent need to quantify and improve understanding of past natural climatic variations, through accurate, quantified, and absolutely-dated reconstructions that capture variation over annual, decadal and multi-decadal timescales, which in turn can be used to test and refine global climate models.
Here we report the development of an eastern Australia and New Zealand Drought Atlas (ANZDA), a seasonally resolved gridded spatial reconstruction of drought and wet periods over the past 500 years, derived from a network of 176 tree-ring chronologies from both countries and Indonesia as well as a coral record from Queensland (177 records in total). The region in general was chosen due to common climate influences linked to droughts—predominantly the interdecadal Pacific oscillation (IPO, Power et al 1998) and El Niño-Southern oscillation (ENSO) events (Kiem et al 2003). The ANZDA aims to provide spatiotemporal details of known historical Australian and New Zealand drought events and to reveal the occurrence, severity, and fingerprint of previously unknown droughts, with their close linkages to large-scale patterns of tropical Pacific sea surface temperatures (SST). The ANZDA will thus provide a long-term context for recent drought variability that informs climate modelling, prediction and attribution.
2. Data and methods
Australia and New Zealand are fortunate to have a range of long-lived tree species with clear annual rings (Enright and Ogden 1995). This has enabled annual growth patterns to be matched (crossdated) between different trees to produce a year-by-year account of past environmental conditions (i.e. dendroclimatology). Since the pioneering regional tree-ring studies of LaMarche et al (1979) more than 150 tree-ring chronologies have been developed from over a dozen different tree species in Australia and New Zealand with most of the data archived at the International Tree-ring Data Bank (ITRDB; www.ncdc.noaa.gov/data-access/paleoclimatology-data/datasets/tree-ring). For Australia there has traditionally been a strong bias towards Tasmanian conifers but this situation has changed recently with successful crossdating of other species on the mainland (e.g. Cullen and Grierson 2009, McDougall et al 2012, Heinrich and Allen 2013, O'Donnell et al 2015). In this study, 176 tree-ring chronologies were drawn from the ITRDB repository or other unpublished tree-ring data archives from current research programs of the authors plus a hydroclimatically sensitive coral luminescence record from the Great Barrier Reef (table S1; figure 1). We used 94 tree-ring series from New Zealand, 68 from Tasmania, three from the Northern Territory, nine from Indonesia and two from Western Australia; a network broadly encircling the eastern Australian region.
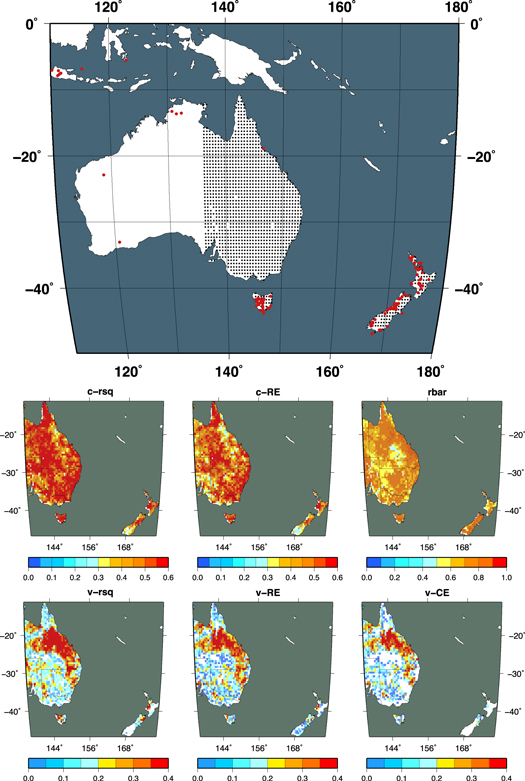
Figure 1. Location of the tree-ring and coral-proxy network and scPDSI grid-points (upper) along with the associated ensemble calibration/verification statistics (lower) for the 177 tree-ring and coral-proxy point-by-point regression to 1375 scPDSI indices for 0.5° grid-points covering Eastern Australia and New Zealand.
Download figure:
Standard image High-resolution imageThe tree-ring measurement series used in the chronologies were screened for dating problems prior to chronology development using the software program COFECHA (Holmes 1983, Grissino-Mayer 2001). This meant some individual series were truncated, or more rarely deleted, because of obvious statistical signs of poor crossdating. Most of the detected problems arose because the series had been collected before recent advances in quality control (e.g. COFECHA, Holmes 1983, Grissino-Mayer 2001) had become available and widely adopted. For the remaining series, the quality of the data had been checked by contributing authors using now standard quality-control procedures (see supporting information for further details). After the data were screened for quality and correct dating, the tree-ring chronologies were developed using the 'signal free' method of tree-ring standardization (Melvin and Briffa 2008), which minimizes trend distortion artefacts and preserves common medium-to-low frequency variability at centennial and longer time scales.
We used a global 0.5° by 0.5° gridded network of the self-calibrating Palmer drought severity index (scPDSI, van der Schrier et al 2013) available on application from the British Atmospheric Data Centre (http://badc.nerc.ac.uk). The monthly scPDSI records from 1901 to 2012 were calculated using the Penman-Monteith method for potential evapotranspiration (PET) calculations rather than the traditional Thornthwaite method that can over-emphasize the effects of temperature on estimated PET, a concern raised by Sheffield et al (2012). For the ANZDA, a subset of 1375 scPDSI grid points was extracted from the global data set for our geographic area of interest (figure 1).
A nested point-by-point regression (PPR) method (Cook et al 2007, Cook et al 2010a, 2010b, Touchan et al 2011) was used to reconstruct austral summer (December, January, February; DJF) scPDSI over the ANZDA domain for the network of 177 tree-ring and coral sites. The focus on the summer window was chosen in order to highlight drought periods most likely to adversely affect plant growth and to be consistent with previous drought atlas studies (e.g. Cook et al 2010b). As pointed out by St George et al (2010) the monthly Palmer drought sensitivity index data is highly autocorrelated so a longer seasonal window is likely to be represented and requires further investigation in future work. A limited search radius is typically defined as part of the PPR approach to reconstruction (Cook et al 1999). However, Cook et al (1999, 2010b) have previously found evidence of long-range verification skill using tree-ring chronologies as far away as 2500 km from individual grid points (their figure B1). This longer-range teleconnection between tree-rings and climate typically occurred over North America in regions with relatively little topographic relief such as the Great Plains where coherent climate patterns tend to be larger than those in more mountainous regions. This expands the distance over which meaningful correlations between tree rings and climate can occur. The same should be expected in the Australian mainland that contains broad areas with relatively low topographic complexity, such as the Great Artesian Basin (1.7 million km2, equivalent to 22% of Australia's total area) and the Murray–Darling Basin (1.1 million km2, equivalent to 14% of Australia). In addition, much of these basin areas lack tree species suitable for dendroclimatology (i.e. lack distinct annual growth rings, or short-lived or frequently killed by fire). So to reconstruct scPDSI uniformly across the grid, it is necessary to 'bridge' these regions with estimates from tree-rings in neighbouring areas that usefully correlate with grid point scPDSI over these basin regions. Such bridging is always going to be necessary in some regions of Australia although future proxy record developments may enable the radius to be reduced. Due to the large area involved and the lack of local chronologies for mainland Australia, we relaxed the search radius in this study to 4000 km. This relaxation of the search radius also enabled tree-ring chronologies from New Zealand to be screened for inclusion in the scPDSI reconstruction over Eastern Australia. The use of remote proxies to reconstruct local climate is a recognized concern because of potential instabilities in the teleconnections between the proxies and the climate being reconstructed (Neukom and Gergis 2012, Gallant et al 2013). Consequently we have limited our interpretations to large-scale features and related climate forcing.
Following standard statistical calibration and verification procedures used in dendroclimatology (Fritts 1976, Cook and Kairiukstis 1990), a split calibration/verification procedure was used to reconstruct the ANZDA and test it for validity. The last year of the calibration period was restricted to 1975 because several New Zealand chronologies were collected at that time and have not since been updated. The decision was therefore made to use the1930–1975 period for calibration and the 1902–1930 period for verification. This was done with and without autoregressive (AR) modelling of the tree-ring and climate variables and for eight different correlation weightings of the proxies (see Cook et al 2010b) resulting in 16 different model outputs.
As noted out in Cook et al (2010b) there is no a priori reason to select any particular weighting. Here we use the default of a zero weight and then seven additional values that span the range from 0.1 to 2.0 (i.e. 0.1, 0.25, 0.5, 0.67, 1.0, 1.5, 2.0). AR modelling is often used because many tree-ring series are positively autocorrelated in excess of the climate variable being reconstructed. This can introduce spectral bias in the reconstruction (Franke et al 2013) but, as described by Meko (1981) and Cook et al (1999), this problem can be ameliorated using appropriate time series modelling techniques such as AR modelling or by including lagged variables in regression. The 16 ANZDA ensemble members produced here were then averaged together, calibrated and verified again, and rescaled to recover lost variance due to the regression. The methods used are consistent with Cook et al (2010a, 2010b) so this means instrumental data has been appended to the reconstruction for the years after the 1930–1975 calibration period. The rescaling of the reconstructions, point by point over the calibration and verification periods, enables them to be directly blended with the instrumental data after 1975.
In addition to verification over the 1902–1930 instrumental period, we also examined the reliability of our reconstructed scPDSI by comparing the gridded reconstruction to historical records (Russell 1877) of summer climate conditions experienced by the first European settlers in New South Wales after landing in January 1788 (the 'first fleet'). Further comparisons were restricted to instrumental and other proxy records as local orographic influences and the observational quality of some records are thought to have resulted in the under-representation of wet phases in the documentary record (Gergis and Ashcroft 2012, Ashcroft et al 2015).
To characterize the main patterns of drought variability in the ANZDA since CE 1500, empirical orthogonal function analysis (EOF) was used. A range of comparisons using the ANZDA leading EOF mode (ANZDA-EOF1) were undertaken starting with a chi-square test (X2) of normalized hydroclimate anomalies from a 45-station rainfall network located over the southeast Australian region (SEA, Gergis and Ashcroft 2012, table 1(a)). This included calculating a series of cross-correlations (1902–1975) between the ANZDA-EOF1 and climate indices (El Niño Southern Oscillation as the Niño 3.4 index, the interdecadal Pacific oscillation or IPO index and a tripole IPO index developed by Henley et al 2015), as well as other published proxies (Vance et al 2013, 2015, table 1(b)). Two tripole IPO indices developed by Henley et al (2015), the first based on the Hadley SST (HadlSST, Kennedy et al 2015) and the second on the extended and reconstructed SST (ERSST, Smith et al 2008 data, table 1(c)) were also used. Of the two tripole indices, the HadISST-based tripole index was more strongly correlated with instrumental and reconstructed scPDSI, so only these results are shown (DJF, figures 3(a) and (b)).
Table 1. Eastern Australia and New Zealand Drought Atlas (ANZDA) reconstructed scPDSI comparisons to instrumental and proxy-climate records.
| (a) Chi-square test (X2) of normalized hydroclimate anomalies from the 45-station network over the Southeast Australian region (SEA, Gergis and Ashcroft 2012) to the ANZDA-EOF1 for 1860–2008. Each year, the SEA and ANZDA-EOF1 were ascribed an index value of 1 (wet), 0 (neutral) or −1 (dry) with the totals below indicating each of three possible outcomes (categories): zero when both index values have the same value (positive, negative or neutral), One when one value was neutral and the other was wet/dry, and finally, Two when the index values were opposite. Note, expected values have been rounded-up. | |||||||||
| Zero | One | Two | Total | ||||||
| Observed | 77 | 61 | 11 | 149 | |||||
| Expected | 50 | 66 | 33 | 149 | |||||
| X2(df = 2, N = 149) = 31.7, p ≪ 0.001 (p = 1.268e-07) | |||||||||
| (b) Pearson RSQ cross-correlations (1902–1975) between climate indices (Nino34, IPO, TPI), published proxies (LDsss, PLF, DT, Vance et al 2013, 2015) and the leading EOF of the ANZDA. | |||||||||
| Nino34 (dJF) | IPO (dJF) | TPI (dJF) | LDsss | PLF | DT | ANZDA EOF1 | |||
| Nino34(dJF) | 0.728 | 0.846 | 0.131 | 0.011 | 0.015 | 0.215 | |||
| IPO(dJF) | 0.897 | 0.081 | 0.149 | 0.179 | 0.370 | ||||
| TPI(dJF) | 0.106 | 0.063 | 0.084 | 0.383 | |||||
| LDsss | 0.129 | 0.073 | 0.102 | 0.000 | 0.000 | 0.031 | |||
| PLF | 0.011 | 0.191 | 0.096 | 0.946 | 0.059 | ||||
| DT-median | 0.016 | 0.225 | 0.124 | 0.092 | |||||
| ANZDA EOF1 | 0.213 | 0.384 | 0.393 | ||||||
| Nino34 (dJFM) | IPO (Annual) | TPI (Annual) | |||||||
| (c) Demonstration tests of the December–February tripole IPO signal in the leading EOF of the Australia-New Zealand Drought Atlas (ANZDA) using the HadISST and ERSST estimates of the tripole IPO index (Henley et al 2015) for split calibration and validation testing. All models successfully calibrated and validated, with the HadISST tripole IPO index producing the stronger results. | |||||||||
| HadISST | Calibration Period | Validation Period Tests | |||||||
| Model | FY | LY | RSQ | FY | LY | RSQ | RE | CE | |
| Early | 1871 | 1923 | 0.366 | 1924 | 1975 | 0.250 | 0.194 | 0.171 | |
| Late | 1924 | 1975 | 0.250 | 1871 | 1923 | 0.366 | 0.315 | 0.298 | |
| ERSST | Calibration Period | Validation Period Tests | |||||||
| Model | FY | LY | RSQ | FY | LY | RSQ | RE | CE | |
| Early | 1871 | 1923 | 0.280 | 1924 | 1975 | 0.144 | 0.090 | 0.090 | |
| Late | 1924 | 1975 | 0.144 | 1871 | 1923 | 0.280 | 0.237 | 0.237 | |
Key:HadlSST—Hadley centre sea ice and sea surface temperature data set available from KNMI climate explorer (http://climexp.knmi.nl/).ERSST—Extended reconstructed sea surface temperature (ERSST) data set available from KNMI climate explorer (http://climexp.knmi.nl/).FY—First or initial year of calibration/verification.LY—Last or final year of calibration/verification.RSQ—Calibration or verification squared Pearson correlation.RE—Reduction of error statistic.CE—Coefficient of efficiency test.Nino34—Nino 3.4 sea-surface temperatures produced by Kaplan et al (1998) and available from KNMI climate explorer (http://climexp.knmi.nl/).IPO—Interdecadal Pacific oscillation; Power et al (1999), available from KNMI climate explorer (http://climexp.knmi.nl/).TPI—Tripole index of the IPO, Henley et al (2015).LDsss—Law Dome summer sea salt, Vance et al (2013).PLF—Piecewise linear fit IPO reconstruction, Vance et al (2015).DT—Decision tree IPO reconstruction, Vance et al (2015).dJF—Austral summer months of December, January and February.dJFMExtended austral summer of dJF and March.Annual—An austral year starting in winter (June) and ending in autumn (May).
3. Results and discussion
3.1. Calibration and verification
The widely used statistical checks on the split-period calibration and verification regression results (Cook and Kairiukstis 1990) show that our climate field reconstruction is robust (figure 1). The Pearson squared-correlation values for verification (v-RSQ panel in figure 1) indicate a broad scale and highly positive association between instrumental and reconstructed scPDSI across eastern Australia and especially for Queensland. In New Zealand the pattern appears more restricted to the western North Island and northern South Island. These patterns persist with the reduction of error (RE, Fritts 1976) tests for calibration and verification (c-RE, v-RE; figure 1) and the more stringent coefficient of efficiency (CE) tests (Cook and Kairiukstis 1990).
An extensive area of grid-points across continental Australia, Tasmania and New Zealand were calibrated and verified. A large number of grid-points, particularly centred in Queensland, also passed the CE test. These results clearly demonstrate that the network of 177 proxy records successfully reconstructs scPDSI variability over eastern Australia and New Zealand despite the relative sparseness of proxy records over the region. The extensive geographic spread of the positive CE test results (figure 1) also demonstrates that the relationships over the calibration and verification periods were stable.
One example of the reliability of the ANZDA scPDSI reconstruction is the clear detection of the 1791 to 1792 drought (the so-called 'settlement drought'; figure 2). Heavy rains in February 1790 are described in Russell (1877, p55) but then no rain fell at Sydney from June to November and the wheat harvest was a partial failure (Russell 1877, p56). During the following January and February of 1791 there were several weeks of excessive heat during which 'birds dropped dead from the trees, and almost every green thing was burnt up' (Russell 1877, p56). In November 1791 high temperatures and the dried-up water supply for Sydney resulted in some ships being sent out to collect water. By April 1793, Russell (1877, p58) reported that 'the rain of April came too late to save the Indian corn of the season, which now wore a most unpromising appearance'. More recent work by Gergis et al (2010) considers the drought conditions of 1791–93 to be associated with an El Niño event that is thought to have threatened the success of the First Fleet settlement and agricultural development in the nascent colony. The compilation of documentary sources by Fenby and Gergis (2012) and Gergis and Ashcroft (2012) lists 1790 and 1791 as dry years, and 1792 only as normal. This apparent anomaly can be explained by the fact that an 'annual' (i.e. January to December calendar year) record is reported by Fenby and Gergis (2012), whereas our reconstructed records describe the austral summer (December–February) that spans two calendar years. So, as noted by Russell (1877), the dry conditions in 1790 started after the summer, and in the case of 1792, we provide evidence of a summer drought prior to the arrival of the autumn rains that lead Fenby and Gergis (2012) to consider the 1792 calendar year as normal. Importantly, our results demonstrate this event was experienced across all of eastern Australia and was not restricted to the immediate Sydney region.
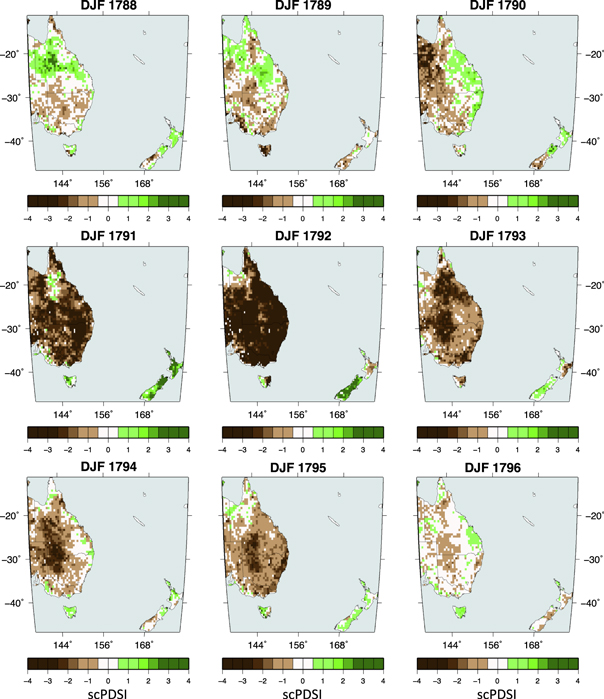
Figure 2. Reconstructed austral summer (December–February) scPDSI 0.5° grid-cells for the successive years of CE 1788–1796 during which the first European settlers landed in New South Wales in January 1788 and then recorded their experience of a drought starting in 1791–2 (Russell 1877).
Download figure:
Standard image High-resolution image3.2. Regional driver(s) of hydroclimate
Recent efforts to compile and screen early instrumental and historical records have resulted in several papers exploring Southeast Australia's (SEA) hydroclimate and climate teleconnections (e.g. Ashcroft et al 2013, 2014, 2015). These studies all present caveats about interpretations based on the early historical data due to their geographical bias and reliability issues. As a result, subsequent investigations have primarily focused on the instrumental and proxy records. Here we address this apparent knowledge gap.
The leading EOF of the ANZDA scPDSI reconstruction since 1500 (ANZDA-EOF1) captures over 50% of the total variance in our gridded reconstructions and this was used for comparisons with other records (figures 3(c) and (d)), with a quasi-periodicity of ∼50 years. Comparison of ANZDA-EOF1 with the normalized hydroclimate anomalies from the 45-station Southeast Australian region (SEA, Gergis and Ashcroft 2012) for the period 1860–2008 showed a significant match (X2 test, p < 0.001; table 1(a)). The very low level (7% or 11/149) of clear mismatches—where one variable was strongly positive and the other was strongly negative or vice-versa—indicates the fidelity of the ANZDA to the regional hydroclimatic record.
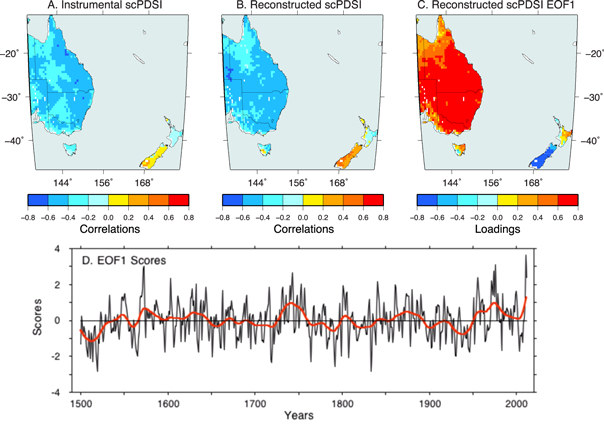
Figure 3. Comparisons of the IPO-tripole index (Henley et al 2015) for December–February calculated using HadlSST with instrumental scPDSI(a) and ANZDA reconstructed scPDSI(b) over the period 1902–1975. The first unrotated principal component (EOF1) from the full reconstructed period (i.e. 1500–1975) is shown in (c) with the fully extended scores plotted in (d) along with a 20-year spline (red line).
Download figure:
Standard image High-resolution imageThe ANZDA-EOF1 reconstruction (figure 3(d)) also clearly shows that the summer drought conditions during the Australian millennium drought (~1997–2008) were not as severe as either the Federation drought (∼1895–1902) or the World War II drought (∼1937–1945). These three droughts had very different spatial signatures and magnitudes of impact (Verdon-Kidd and Kiem 2009) and this helps to explain why our results differ from the more localized interpretation of Gergis and Ashcroft (2013). The apparent capture of low frequency (multi-decadal) variations in our ANZDA-EOF1 reconstruction is important for comparisons of events and placing recent experiences in a historical context. For example, the wetter period during the 1950s to the 1970s seems to have only one other similar extended window from 1730 to 1760 (figure 3(d)) with important implications for the allocation of water resources, including meeting sustainable agricultural needs.
Using a cross-correlation matrix for the period 1902–1975 we also compared ANZDA-EOF1 to a range of different climate indices and proxy records (table 1(b)). The three climate indices were the Nino 3.4 SST (Nino34, Kaplan et al 1998), the interdecadal Pacific oscillation (IPO, Power et al 1999) and the tripole index of the IPO (TPI, Henley et al 2015). The first proxy series was the summer sea-salt record from the summit of Law Dome (LDsss), east Antarctica (Vance et al 2013, 2015), which is significantly linked to ENSO and also with annual rainfall in eastern mainland Australia. The second and third proxy series were the IPO reconstructions produced by two independent nonlinear multivariate regression techniques (piecewise linear fit and decision tree, Vance et al 2015). The results (table 1(b)) show that the ANZDA-EOF1 is significantly correlated with all of the instrumental climate indices (the strongest correlation being with the TPI) but not to any of the proxies. One potential contributing factor for the low correlation values might be the difference in seasonality recorded in the various indices and proxies. To further investigate this, the lower portion of table 1(b) includes the extended four-month summer used by Vance et al (2013) or the annual measures in Vance et al (2015). In both cases the strongest results were still obtained from the ANZDA-EOF1. Despite the largest correlation coefficient being between the annual TPI and the ANZDA-EOF1, we focused our reconstruction on the austral summer for consistency and potential comparisons with Northern Hemisphere drought atlases (e.g. Cook et al 2007, 2010b). The selection of summer is also important as this is typically the high season for plant growth making the atlas particularly relevant to agriculture.
Given the strength of the correlations between the ANZDA-EOF1 and instrumental climate indices (table 1(b)) we compared the spatial pattern of the relationship between the TPI and both the instrumental and reconstructed scPDSI series over the period 1902–1975 (figures 3(a) and (b)). The correlation patterns were very similar for the instrumental and reconstructed series with eastern Australia and the North Island of New Zealand being entirely negative (i.e. a dry (wet) summer correlates with a positive (negative) TPI and vice-versa). In contrast, the South Island and southwestern Tasmania had a positive correlation (i.e. a dry (wet) summer correlates with a negative (positive) TPI). To check the reliability of the response, conventional split calibration and validation testing of the summer TPI signal in the ANZDA-EOF1 using the HadISST and ERSST estimates of the TPI index was undertaken (table 1(c), Henley et al 2015). All models were successfully calibrated and validated, with the HadISST TPI producing the stronger results. Thus, there is an excellent basis for future reconstruction of the TPI and wider comparisons to proxy climate reconstructions.
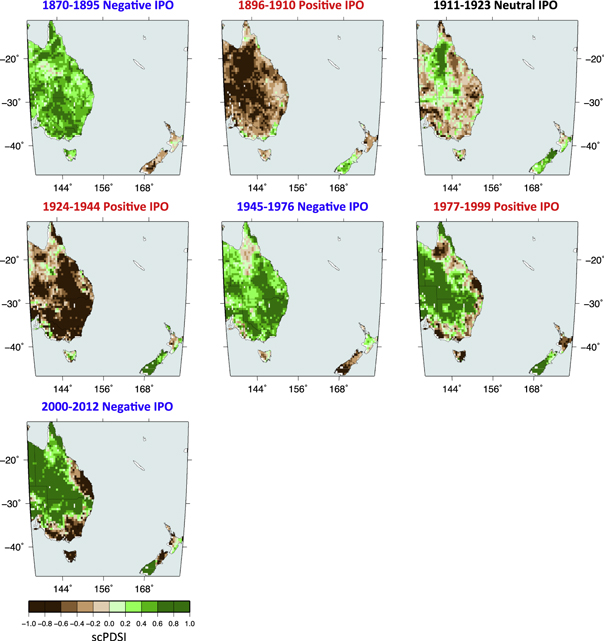
We find a remarkable consistency between reconstructed scPDSI and the IPO phases identified by Henley et al (2015) between 1870 and 1976 (figure 4). Reconstructed scPDSI in eastern Australia was strongly and predominantly negative (drought) during the two positive IPO phases and positive (wet) during the two negative IPO phases (figure 4). During the most recent period (1977–2012) however, the relationship between the IPO and east Australian scPDSI is not as clear—negative and positive phases of the IPO show similar values of scPDSI. The reconstruction of scPDSI during this period (since 1975) was based entirely on instrumental scPDSI. Further investigation concerning this lack of distinction between positive and negative TPI phases for the most recent period is required. However, the more distinct earlier phases indicate the potential for screening for similar past positive and negative periods especially during the transition from the Little Ice Age (e.g. Cox and Jones 2008, Lorrey et al 2014).
Figure 4. Maps of DJF ANZDA drought and wetness averaged over the IPO phases defined in figure 5 of Henley et al (2015). Maps up to 1976 are, except for the 1976 datum, based solely on tree-ring estimates of scPDSI. Those after 1976 are based on instrumental scPDSI.
Download figure:
Standard image High-resolution image
Our analyses demonstrate a significant connection between ANZDA-EOF1 and the IPO (table 1(c), figure 4). Asymmetric modulation of ENSO events by the IPO has important impacts on east Australian precipitation (Verdon et al 2004), and McGowan et al (2009) have also shown that the low frequency oscillation of the IPO modulates annual flows into the headwaters of the Murray River. Furthermore, Gallant et al (2013) have noted non-stationary relationships between the southern annular mode, Niño 3.4 and precipitation over Australia on the 31–71 year time-scale. A preliminary analysis of the spectral characteristics of the ANZDA-EOF1 using the multi-taper method with three 2-pi tapers for the identification of narrowband signals and a red noise significance test (Thomson 1982) revealed spectral peaks at ∼21 and 102 years, confirming the presence of multidecadal variability in the drought atlas (also seen in figure 2). Low frequency modulation of eastern Australia's hydroclimate presents particular challenges to the detection of an anthropogenically-driven trend in the occurrence of east Australian drought above background variability. By providing a multicentennial record of drought in eastern Australia that is linked to the IPO, the ANZDA offers a vital and unique long-term perspective on low-frequency drought variability. The ANZDA is therefore an essential tool for assessing anthropogenically-driven changes in drought frequency, length and severity.
4. Conclusions
Our network of tree-ring and coral records has successfully reconstructed a 0.5˚ gridded drought atlas for eastern Australia and New Zealand since CE 1500—the first such drought atlas for the SH. The ANZDA not only reproduced the oldest known extreme drought in the historical record that directly impacted on the first European settlers in New South Wales in CE 1791–2, but provides a broader spatial context for the scale and intensity of that drought across eastern Australia. The comparison with a compilation of 45 instrumental rainfall records from southeast Australia extending from CE 1860 was highly significant. Principal components analysis highlighted the large amount of common variance accounted for by the ANZDA. Confidence in the robustness of the ANZDA was further enhanced by the strong positive relationships with climate indices known to modulate the regional climate. The strongest correlations were with the tripole index of the IPO and modelling calibration/verification tests showed the scope for reconstruction of this index back to CE 1500. Overall the results also demonstrate the potential of the ANZDA to overcome a common limitation in hydroclimatic risk assessment by providing a long record with which to assess decadal to multidecadal variability. Finally, the production of the ANZDA highlights the need for extending existing records (both further back in time and forward to the present day) as well as increasing the spatial coverage of the proxy network.
Acknowledgments
Support was provided by the Australian Research Council through grants: FL100100195, LP120100310 and DP130104156 for CSMT and DP0878744, DP120104320, LP120200811, FT120100715 for PJB, Lamont-Doherty Earth Observatory Contribution No. 7948.