Label-Free Quantitative Proteomic Analysis Provides Insight Into the Differences Between Slow-Twitch Muscle and Fast-Twitch Muscle of Pseudocaranx dentex
 Huan Wang
 Busu Li
 Jiefeng Li3
  Chen Jiang
- 1Yellow Sea Fisheries Research Institute, Chinese Academy of Fishery Sciences, Qingdao, China
- 2Laboratory for Marine Fisheries Science and Food Production Processes, Pilot National Laboratory for Marine Science and Technology (Qingdao), Qingdao, China
- 3College of Fisheries and Life Science, Shanghai Ocean University, Shanghai, China
- 4College of Fisheries and Life Science, Dalian Ocean University, Dalian, China
Fish skeletal muscles are mainly composed of two distinct types, fast-twitch and slow-twitch muscles, and they play important roles in maintaining movement and energy metabolism. The fast-twitch muscle contracts quickly and is mainly responsible for burst swimming, while the slow-twitch muscle possesses fatigue resistance and supports endurance swimming. To assess the differences in molecular composition and investigate the potential regulatory mechanisms, we performed an integrative study at both proteomic and transcriptomic levels of the fast-twitch and slow-twitch muscles in Pseudocaranx dentex, a pelagic migratory fish with distinctly differentiated skeletal muscle. Label-free proteomics revealed 471 differentially expressed proteins (DEPs), 422 upregulated and 49 downregulated in slow-twitch muscle when compared to fast-twitch muscle. These DEPs were mainly involved in myofibrillary structure and energy metabolism. Integrative analysis of proteomic and transcriptomic data showed that 757 RNA-protein pairs were positively correlated, and 191 RNA-protein pairs were negatively correlated in abundance. Meanwhile, 311 RNA-protein pairs were consistent in fold changes, and 594 RNA-protein pairs exhibited striking differences, which provided an insight into the complex regulation at both transcriptional and post-transcriptional levels that contribute to shaping the different muscle types. The specific expression of multiple myofibrillar proteins, such as myosin, actin, troponin, and tropomyosin, suggested that the distinction in contraction characterizations between slow-twitch and fast-twitch muscles is related to different protein isoforms. Muscle-type specific expression of gene-encoding key enzymes in fatty acid metabolism, glycolysis, tricarboxylic acid (TCA) cycle, and oxidative phosphorylation pathways, such as carnitine palmitoyltransferase (CPT2), phosphofructokinase (Pfkm), pyruvate kinase (Pkmb), citrate synthase (CS), isocitrate dehydrogenase (IDH), and 2-oxoglutarate dehydrogenase complex (Ogdh), may be the molecular basis responsible for the differences in energy metabolism. Overall, this global view of protein and RNA expression levels in P. dentex fast-twitch and slow-twitch muscles reveals the essential roles of transcriptional and post-transcriptional regulation in maintaining muscle structure and function. The identified potential genes that may cause the differences in physiological characteristics will greatly improve our understanding on the molecular basis of skeletal muscle contraction, metabolism, and regulation in teleost.
Introduction
Skeletal muscle plays a central role in supporting the movement and maintaining metabolism homeostasis in vertebrates (Jackson and Ingham, 2013; Tanaka et al., 2017). The skeletal muscles are mainly composed of two highly differentiated fiber types, fast-twitch and slow-twitch, distinguished by myofibrillar ATPase staining and myosin heavy chain (MYH) isoform expression profiles (Silva et al., 2008; Jiao et al., 2019). The fast-twitch and slow-twitch fibers are originated from the intrinsically different myogenic precursors (Hinits et al., 2009) or satellite cells (Kalhovde et al., 2005) and are highlighted by the highly specialized structural and functional properties (Schiaffino and Reggiani, 2011). Unlike mammals that feature heterogeneous muscle fibers, the skeletal muscle of teleost shows an anatomically separated distribution pattern of muscle fiber types, that is, superficial slow-twitch muscle and deep fast-twitch muscle (Johnston et al., 1977; Silva et al., 2008). This simplifier spatial feature makes teleost an ideal animal model for studying the structure and function of skeletal muscle. Furthermore, a rare characteristic of teleost is indeterminate muscle growth, both hyperplasia (fiber number increase) and hypertrophy (fiber size increase) coexist in the skeletal muscle of the adult stage until death (Johnston et al., 2011). This means that the adults can fully represent the characteristics of skeletal muscle. To date, the differences between slow-twitch muscle and fast-twitch muscle in phenotype and physiology of teleost have been well documented (Wu et al., 2018; Jiao et al., 2019; Grunow et al., 2021), but the molecular regulation mechanisms to control and maintain the divergence in adult fish remain unclear yet.
The striped jack or white trevally, Pseudocaranx dentex (Bloch and Schneider, 1801), belongs to the Perciform family Carangidae, is widely distributed in anti-tropical reef areas throughout the Indo-Pacific, Mediterranean, and Atlantic (Smith-Vaniz, 1999). Owing to its high value in the sashimi industry, P. dentex has already received extensive attention in global aquaculture production (Watanabe and Vassallo-Agius, 2003; Nogueira et al., 2018). Although there is a long history of P. dentex off-shore cage cultivation and sea-ranching in Japan (Harada, 1970), indoor industrialized intensive culture is still in the embryonic status and a major constraint is the space that is not enough to fulfill the swimming needs, which limits the growth performance and even partly leads to the high mortality (Ibarz et al., 2011; Palstra et al., 2014), thereby restricting the development of the aquaculture industry. Slow-twitch muscle contraction is the main driving force for fish continuous directional swimming (Videler, 1993), whereas fast-twitch muscle is used during forceful activities and power cruising at high speeds (Videler, 1993). There is precisely a higher proportion of slow-twitch muscle in P. dentex than most other teleosts to support its lifestyle (Aji, 2011). Therefore, understanding the characteristics and maintenance mechanisms of skeletal muscle is the theoretical basis for artificial culture. Compared to fast-twitch muscle, slow-twitch muscle consists of narrower muscle fibers, higher amounts of mitochondria, capillaries, and fat and adapts for aerobic metabolism (George, 1962; Ciciliot et al., 2013), but little information is available about the differences in their molecular components and regulatory mechanisms.
Our current knowledge of the difference between slow-twitch and fast-twitch muscles of teleost was established primarily on traditional biochemical and histochemical techniques, which require time-consuming and labor-intensive work but test a limited number of bio-molecules (Kronnie et al., 1983; Silva et al., 2008; Wu et al., 2021). Recent advances in proteomics enable us to identify and quantify thousands of proteins in a single experiment of a certain type of cell, tissue, organism, or biological material (Piovesana et al., 2016; Kwasek et al., 2021). Since protein is the endpoint of the information flow presented by central dogma, the proteome also reflects regulation at genetic, epigenetic, transcriptional, and translational levels (Baer and Millar, 2016). In addition, the transcriptome is a helpful tool to map proteins to specific pathways or regulatory processes (Maier et al., 2009). The integrative analysis of proteomics with transcriptomics data could provide a complete picture of gene expression profile from the global-genome-wide perspective (Yang et al., 2016; Zhao et al., 2019; Li et al., 2020). Although there have been many omics studies on teleost skeletal muscle, they mainly focus on the growth (Addis et al., 2010; Ghaedi et al., 2016; Yu et al., 2017; Kwasek et al., 2021; Li et al., 2021), metabolism (Aedo et al., 2019), inflammatory response (Carrizo et al., 2021), and flesh quality (Carrera et al., 2020; Ahongo et al., 2022) of fast-twitch muscle. The research studies that integrate multiple data to analyze and compare the two different types of skeletal muscle are very limited (Mareco et al., 2015; Chu et al., 2017; Gao et al., 2017), and the molecular regulatory mechanisms are still not well understood. Therefore, integrative studies of proteomics with transcriptomics are required to better understand the entire transcriptional-translational cascade and unravel the mechanisms of adult skeletal muscle specialization and maintenance.
Here, to address the gaps in our understanding of the molecular composition and regulatory mechanisms of skeletal muscle, we conducted proteomics analysis on both slow-twitch and fast-twitch muscles of adult P. dentex, obtained the differentially expressed proteins (DEPs), and performed the integrative comparative analysis with transcriptomic that pictures the regulatory mechanisms at transcriptional and post-transcriptional levels. The present study is aimed to provide a comprehensive representation of molecular differences between the two skeletal muscle types, which will greatly expand our knowledge on the molecular basis of muscle contraction and its regulation in teleost.
Materials and Methods
Biological Sample Preparation
Three 2.5-year-old healthy P. dentex (body weight: 1567.63 ± 147 g, body length: 36.83 ± 0.67 cm) specimens, which were from the same genetic family and held under the same conditions, were obtained from Dalian Tianzheng Industrial Co., Ltd. (Dalian, Liaoning, China) in November 2020. The slow-twitch and fast-twitch muscles were carefully dissected from each sample and immediately placed into liquid nitrogen. Each tissue block was divided into two parts for transcriptomic and proteomic analysis.
Transcriptomic Data Acquisition
Total RNA from each sample was extracted using RNAiso Plus Kit (Takara, Beijing, China) following the protocol of the manufacturer for transcriptome analysis. Sequencing libraries were generated using NEBNext® Ultra™ RNA Library Prep Kit for Illumina® (NEB, Ipswich, MA, United States) and sequenced on the Illumina NovaSeq 6000 platform of Novo Gene Biological InfoTech Ltd. (Beijing, China) to generate 150 bp paired-end reads. After low-quality sequencing read filter, a total of about 253.11 million clean reads were obtained that include 130.26 million for three slow-twitch muscle samples and 122.85 million for three fast-twitch muscle samples. Then, the clean reads were aligned to the P. dentex reference genome using TopHat v2.0.12 (Trapnell et al., 2009) with Bowtie as an internal aligner. The numbers of mapped reads to each gene were counted with HTSeq v0.6.1 (Anders et al., 2015), and the gene expression level was calculated based on fragments per kilobase of transcript per million mapped reads (FPKM). A total of 2,862 differentially expressed genes (DEGs) were obtained using the DESeq with fold change ≥ 2 and p < 0.05 as the thresholds. Among these, 1,419 DEGs were higher expressed in slow-twitch muscle and 1,443 DEGs in fast-twitch muscle (Supplementary Table 1). Detailed transcriptomic information was described in our other manuscript (Wang et al., 2022), and raw data were deposited in the National Center for Biotechnology Information (NCBI) sequence read archive (SRA) database with the accession numbers: SRR14672383-SRR146723881.
Proteomic Data Acquisition
Total Protein Extraction and Digestion
The frozen muscle sample was ground in liquid nitrogen and lysed with lysis buffer containing 0.1 M NH4HCO3, 8 M urea, and 0.2% (w/v) sodium dodecyl sulfate (SDS). After homogenization by ultrasonication and centrifugation at 12,000 g for 15 min at 4°C, the supernatant was incubated with 10 mM dithiothreitol (DTT) at 56°C for 1 h, and subsequently alkylated with 100 mM iodoacetamide for 1 h at room temperature in the dark. Then, the samples were mixed with four times the volume of acetone, incubated at − 20°C over 2 h, and centrifuged to collect the precipitation. After washing twice with acetone, the protein was dissolved with a dissolution buffer, which contained 0.1 M triethylammonium bicarbonate and 6 M urea. The total protein content was measured using the commercial Bradford assay kit (Beyotime Biotechnology, Shanghai, China) and further confirmed by sodium dodecyl sulfate–polyacrylamide gel electrophoresis (SDS-PAGE) gel electrophoresis (data not shown).
A total of 120 μg protein per sample was trypsinized overnight at 37°C. Then, formic acid was added to final the reaction, and the mixture was centrifuged at 12,000 g for 5 min at room temperature. The supernatant was slowly loaded to the C18 desalting column, washed with washing buffer (0.1% formic acid and 3% acetonitrile) three times, and then eluted by elution buffer (0.1% formic acid and 70% acetonitrile). The eluents of each sample were combined and lyophilized.
Liquid Chromatography-Tandem Mass Spectrometry Analysis
The lyophilized powder was dissolved in 10 μl solution A (0.1% formic acid aqueous solution), centrifuged at 14,000 g for 20 min at 4°C, and then separated using an EASY-nLC™ 1,200 nM upgraded ultra-high-performance liquid chromatography (UHPLC) system. One microgram of the supernatant was loaded onto the C18 Nano-Trap column (2 cm × 75 μm, 3 μm) and subsequently separated using a C18 analytical column (15 cm long, 150 μm inner diameter, 1.9 μm resin) in solution A and solution B (0.1% formic acid in 80% acetonitrile) at a flow rate of 600 nl/min for 60 min with linear gradient elution (0–2 min, a linear gradient of solution A from 94 to 90% and solution B from 6 to 10%; 2–49 min, a linear gradient of solution A from 90 to 70% and solution B from 10 to 30%; 49–52 min, a linear gradient of solution A from 70 to 65% and solution B from 30 to 35%; 52–54 min, a linear gradient of solution A from 65 to 50% and solution B from 35 to 50%; 54–55 min, and a linear gradient of solution A from 50 to 0% and solution B from 50 to 100%; 55–60 min, solution B maintain at 100%). The separated peptides were analyzed by a Q Exactive™ HF mass spectrometer (ThermoFisher, United States), with ion source of Nanospray Flex™ (ESI), spray voltage of 2.3 KV, and ion transport capillary temperature of 320°C. Full scan range from m/z 350 to 1,500 with the resolution of 60,000 (at m/z 200), an automatic gain control (AGC) target value was 3 × 10⁶, and the maximum ion injection time was set to 20 ms. The top 40 precursors of the highest abundance in the full scan were selected and fragmented by higher energy collisional dissociation (HCD) and analyzed in MS/MS, where the resolution was 15,000 (at m/z 200), the AGC target value was 1 × 10⁵, the maximum ion injection time was 45 ms, the normalized collision energy was 27%, the intensity threshold was 2.2 × 10⁴, and the dynamic exclusion parameter was 20 s.
Proteomic Data Analysis
Identification and Quantitation of Proteins
All resulting spectra from LC-MS/MS were searched against the reference proteome of P. dentex database (NCBI: txid349646) generated by genome sequencing using Proteome Discoverer 2.2. The searched parameters were set as follows: mass tolerance for precursor ion was 10 ppm, mass tolerance for product ion was 0.02 Da, carbamidomethyl was specified as fixed modifications, oxidation of methionine (M) was specified as dynamic modification, acetylation was specified as N-terminal modification, and a maximum of 2 mis-cleavage sites were allowed. The identified peptide was accepted if the credibility of the peptide spectrum matches > 99%. The identified protein contained at least one unique peptide. The identified peptides and proteins were retained when the FDR ≤ 1.0%. DEPs were determined by the t-test when there was a significant change (p < 0.05) in expression levels (fold change ≥ 1.5) (Yang et al., 2020). Hierarchical clustering analysis was performed using gplots (Warnes et al., 2016) to obtain the overview of DEPs among all experimental groups. The proteomics data were deposited in the ProteomeXchange Consortium: PXD029996.
Functional Analysis of Identified Proteins and Differentially Expressed Proteins
InterProScan program (Jones et al., 2014) was used for both Gene Ontology (GO) and InterPro (IPR) functional analysis. Protein function was annotated using non-redundant protein databases, such as Pfam, PRINTS, ProDom, SMART, ProSite, and PANTHER. A Cluster of Orthologous Groups of proteins (COG) database was performed using an in-house script to predict the subcellular location and orthologous groups by functional category. Kyoto Encyclopedia of Genes and Genomes (KEGG) pathway analysis was also processed by KOBAS2. Pathways with p < 0.05 were recognized as significantly enriched (Huang da et al., 2009).
Integrative Analysis of Proteomic and Transcriptomic Data
Spearman correlation analysis was used to assess the relationship between mRNA and protein from both abundance and fold changes aspects. The log2 transformed fold change data from transcriptome and proteome were calculated and displayed as the scatter plots using the R program, with the screening criteria (for mRNA, fold change ≥ 2; for proteins, fold change ≥ 1.5) (Yang et al., 2016; Liao et al., 2018).
Results
Overall Statistics for Proteome Sequencing
The label-free quantitative proteomics analysis was performed to obtain the protein level differences between slow-twitch and fast-twitch muscles of P. dentex. In total, 33,572 matched spectra were acquired among all 194,637 spectra obtained from the LC-MS/MS, and 10,012 peptides were identified corresponding to 1,130 proteins (Supplementary Table 2). The length of identified peptides was mainly concentrated in the range of 9–21 amino acids (Figure 1A), which means that the selected protease is suitable. In addition, over 50% of the identified proteins contained more than two unique peptides and had a coverage rate of peptides over 10% (Figures 1B,C), indicating the high reliability and overall accuracy of the proteome sequencing. Moreover, our proteomic data identified a wide range of proteins, and most of them have a molecular mass in the range of 10–60 kDa (Figure 1D).
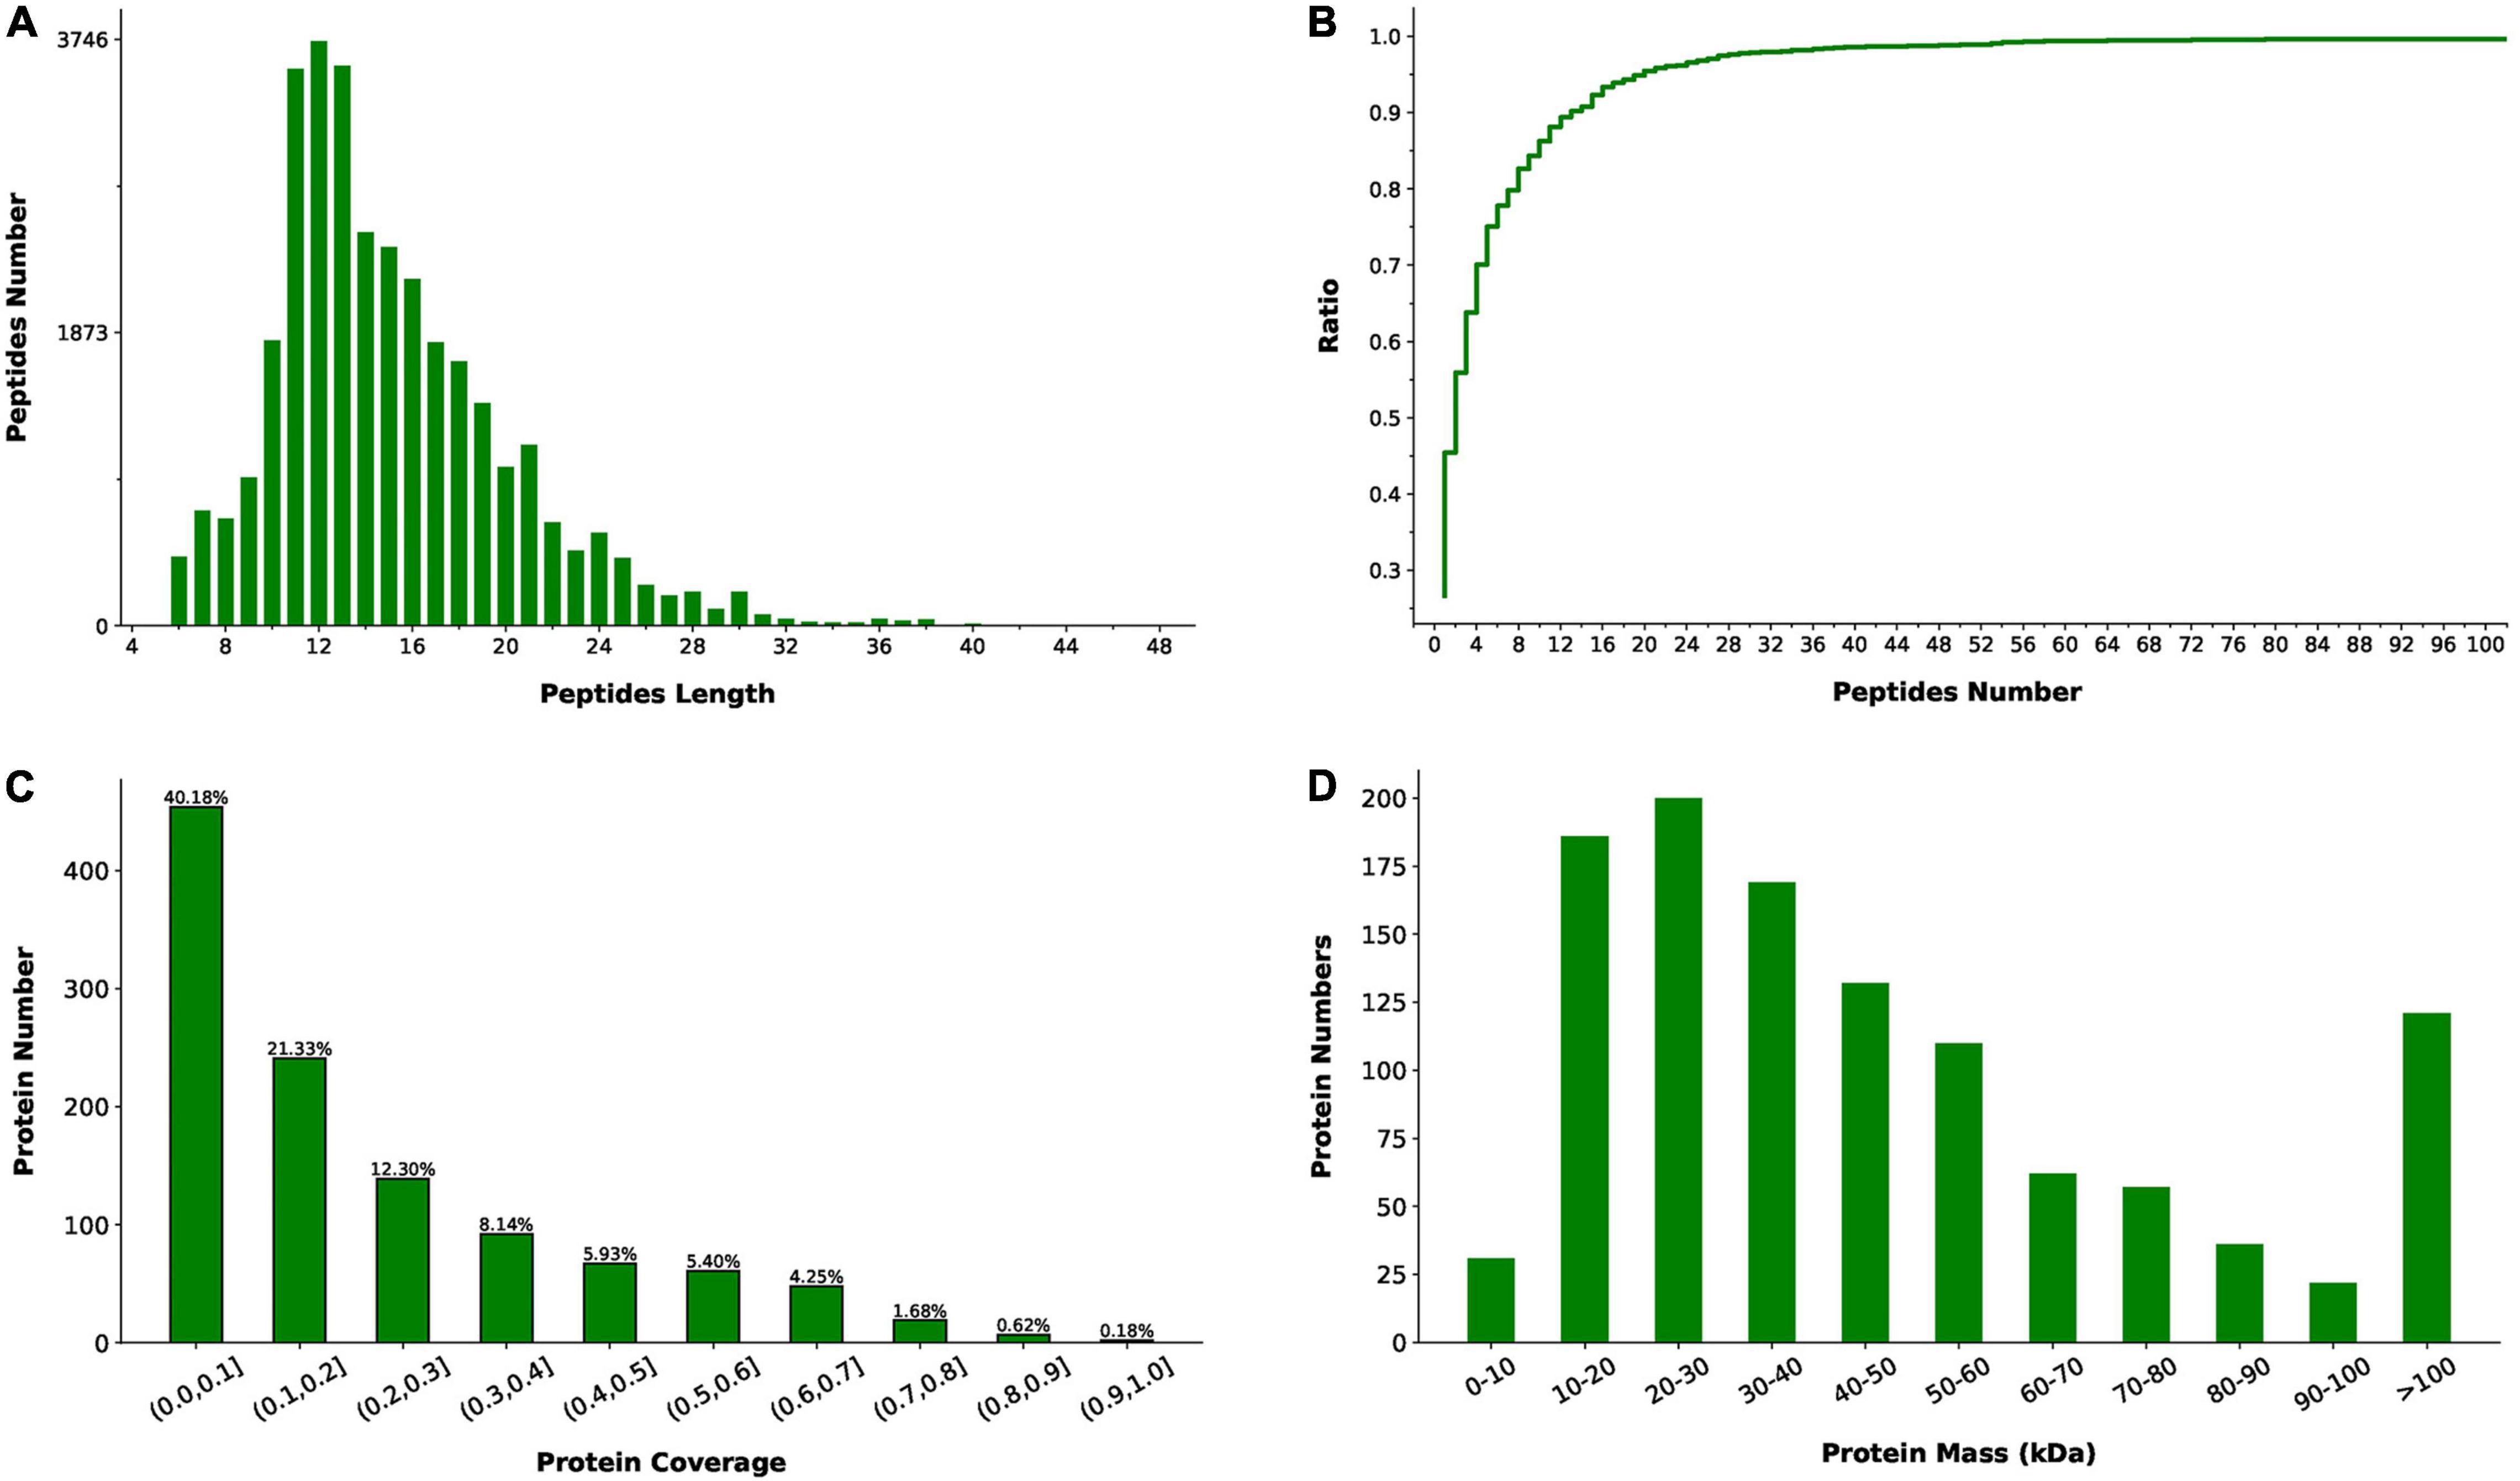
Figure 1. Peptides and proteins identified by liquid chromatography-tandem mass spectrometry (LC-MS/MS) in slow-twitch muscle and fast-twitch muscle of P. dentex. (A) Length distribution of the identified peptides. Peptides length is the number of amino acid residues. (B) Number distribution of unique peptides. The ratio (y-axis) represents the cumulative proportion of proteins containing unique peptides to the total proteins as the number of unique peptides increases. (C) Coverage of identified peptides to the entire protein sequence. The x-axis represents the interval of protein coverage (the length of the protein covered by the detected peptide/the full length of the peptide). The y-axis represents the number of proteins corresponding to the interval. (D) Distribution of identified protein molecular weight.
To predict the potential biological function of skeletal muscle components in P. dentex, we applied annotation of GO functional enrichment, COG function classification, KEGG pathway enrichment, IPR conserved domain, and subcellular localization analysis. A total of 775 proteins were functionally annotated with GO terms (Supplementary Table 3), and the top 10 most representative GO terms were protein binding, oxidation-reduction process, metabolic process, calcium ion binding, oxidoreductase activity, adenosine triphosphate (ATP) binding, structural constituent of ribosome, intracellular, translation, and ribosome (Figure 2A). A total of 620 proteins were divided into 23 COG terms (Supplementary Table 4), with the most representative proteins in O (post-translation modification, protein turnover, and chaperones), C (energy production and conversion), J (translation, ribosomal structure, and biogenesis), R (general function prediction only), I (lipid transport and metabolism), E (amino acid transport and metabolism), and G (carbohydrate transport and metabolism) (Figure 2B). A total of 1,000 proteins were annotated into 32 KEGG pathways (Supplementary Table 5), with a large number of proteins were found to be involved in global and overview maps, signal transduction, carbohydrate metabolism, amino acid metabolism, energy metabolism, translation, and endocrine system (Figure 2C). Totally, 1,125 protein domains were identified (Supplementary Table 6), with EF-hand domain, immunoglobulin domain set, calponin homology domain, fibronectin type III, spectrin/alpha-actin, and AAA + ATPase domain were the most abundant (Figure 2D). The identified proteins were mainly located in the mitochondrion (31.99%), followed by cytoplasm (21.42%), nucleus (14.46%), and extracell (8.21%) (Supplementary Table 7 and Figure 2E).
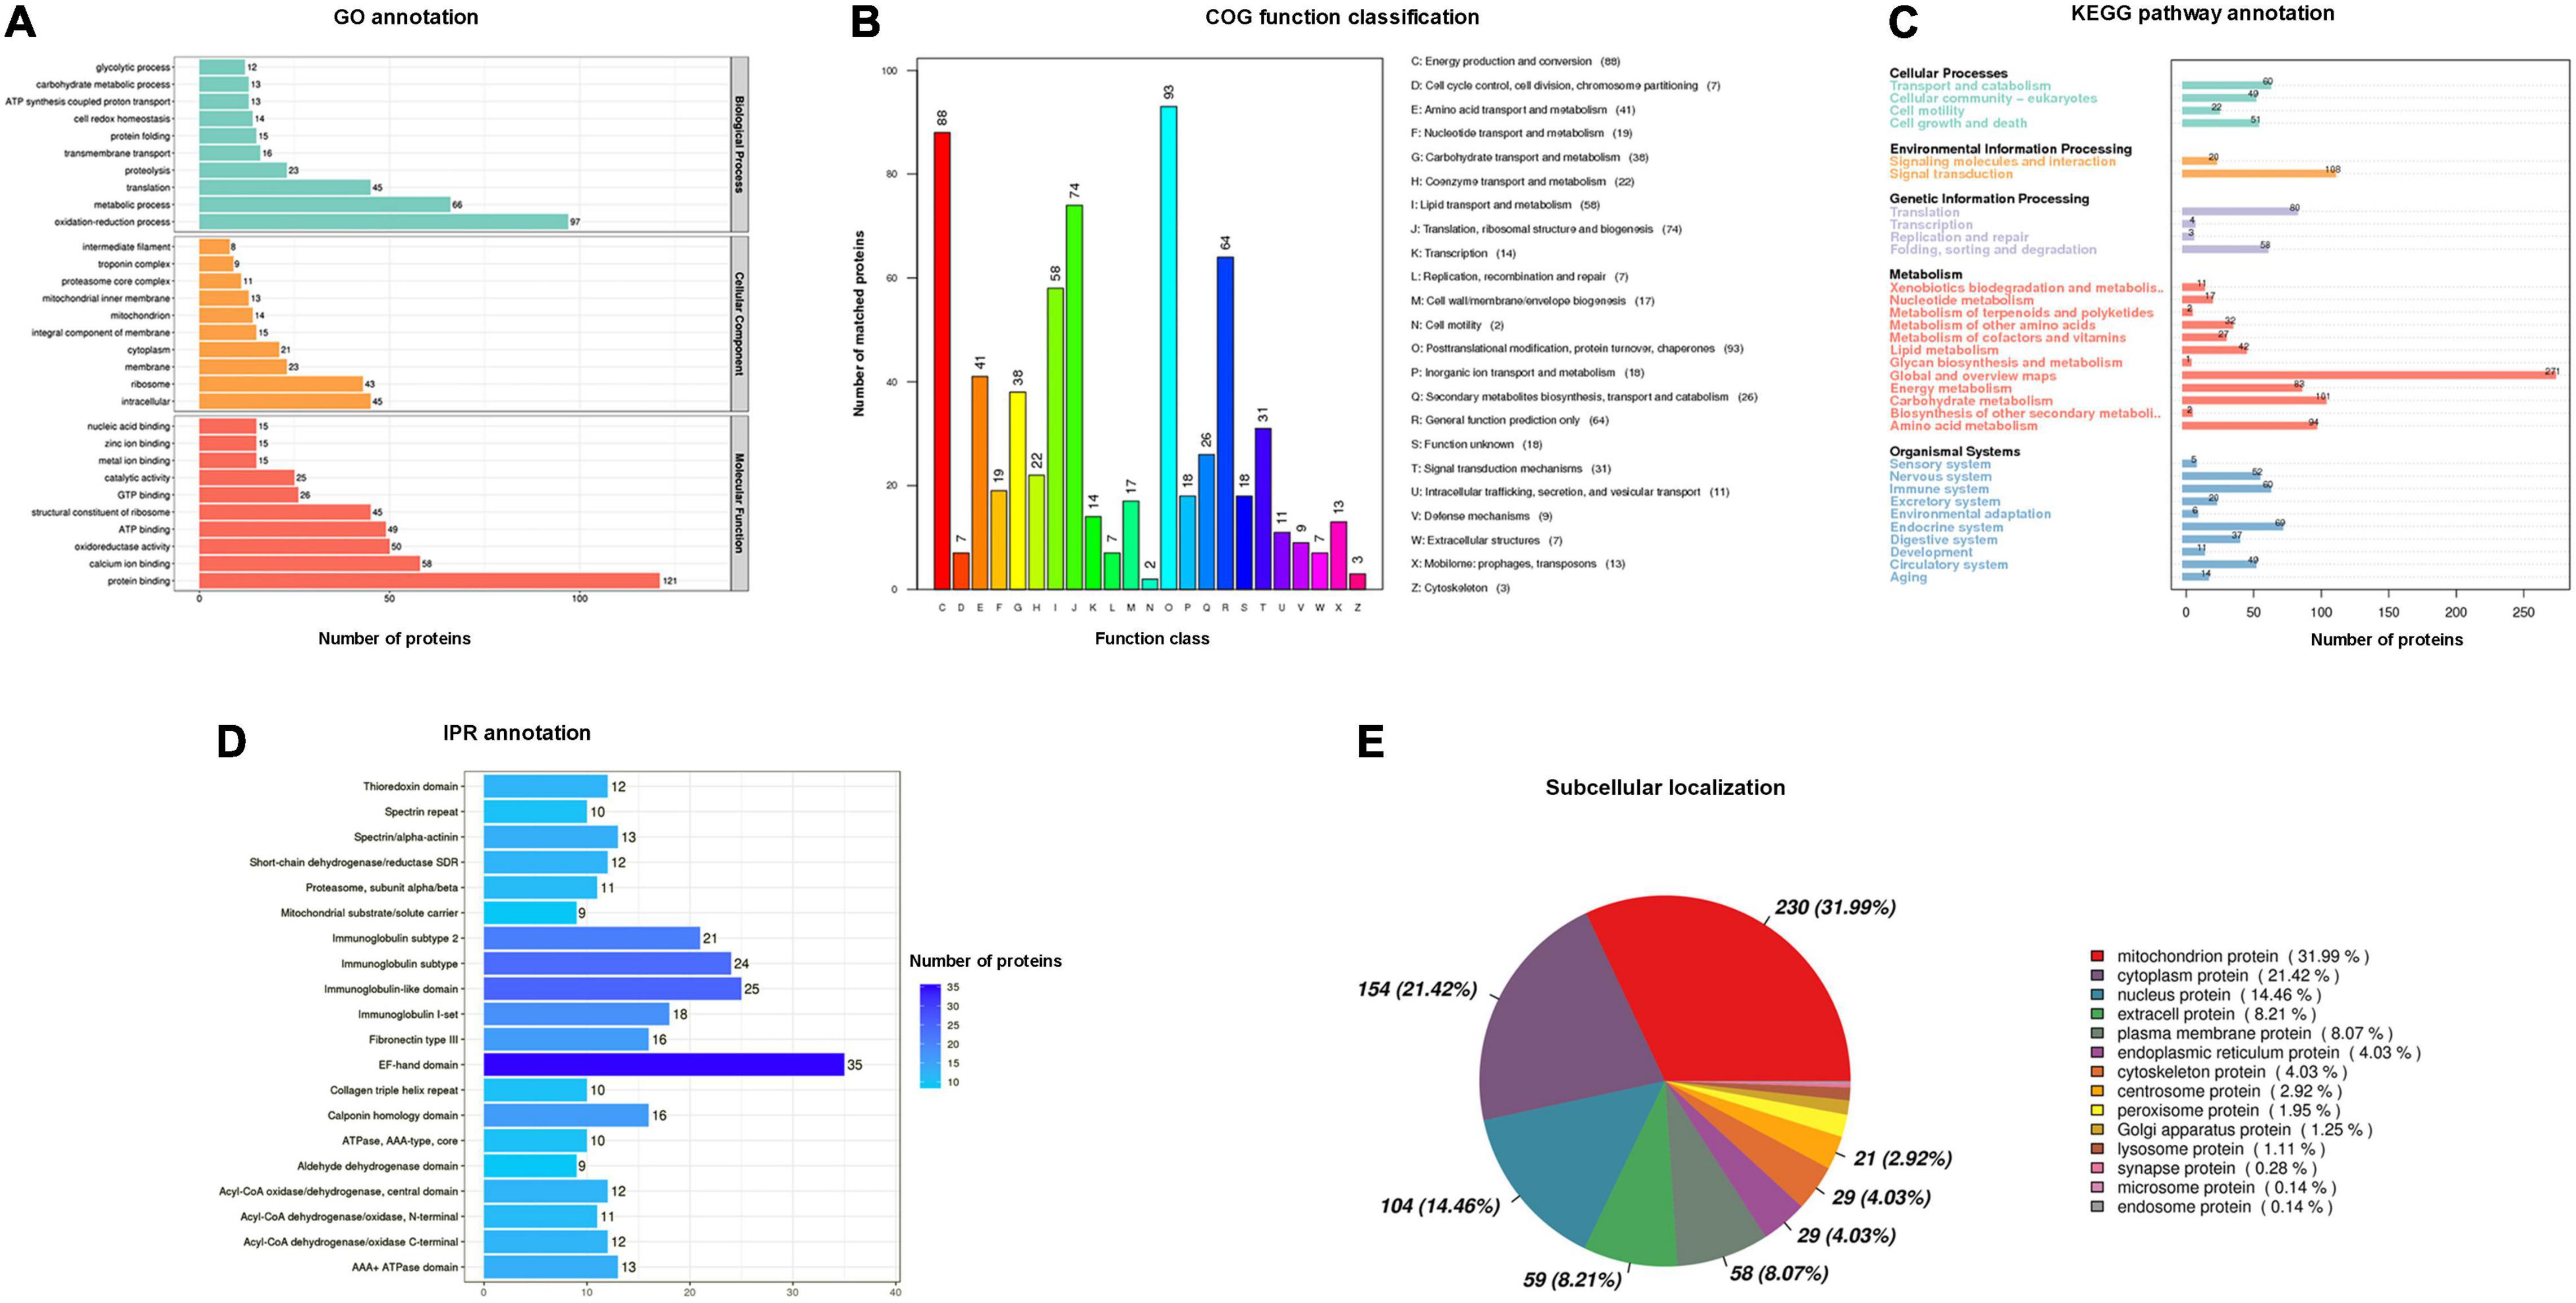
Figure 2. Annotation information of identified proteins in P. dentex skeletal muscle. (A) Gene Oncology (GO) functional enrichment, (B) Cluster of Orthologous Groups of proteins (COG) function classification, (C) Kyoto Encyclopedia of Genes and Genomes (KEGG) pathway enrichment, (D) InterPro (IPR) conserved domain, and (E) subcellular localization analysis.
Identification of Differentially Expressed Proteins Between Slow-Twitch Muscle and Fast-Twitch Muscle
To identify DEPs between slow-twitch and fast-twitch muscles, at least a 1.5-fold change in protein expression level and p < 0.05 were set as criteria. A total of 471 DEPs were identified, with 422 being upregulated and 49 being downregulated when the slow-twitch muscle was compared to fast-twitch muscle (see detailed information in Supplementary Table 8). The volcano plot showed an asymmetric distribution of DEPs (Figure 3A). The protein expression difference was significant intergroup, while relatively small intragroup (Figure 3B).
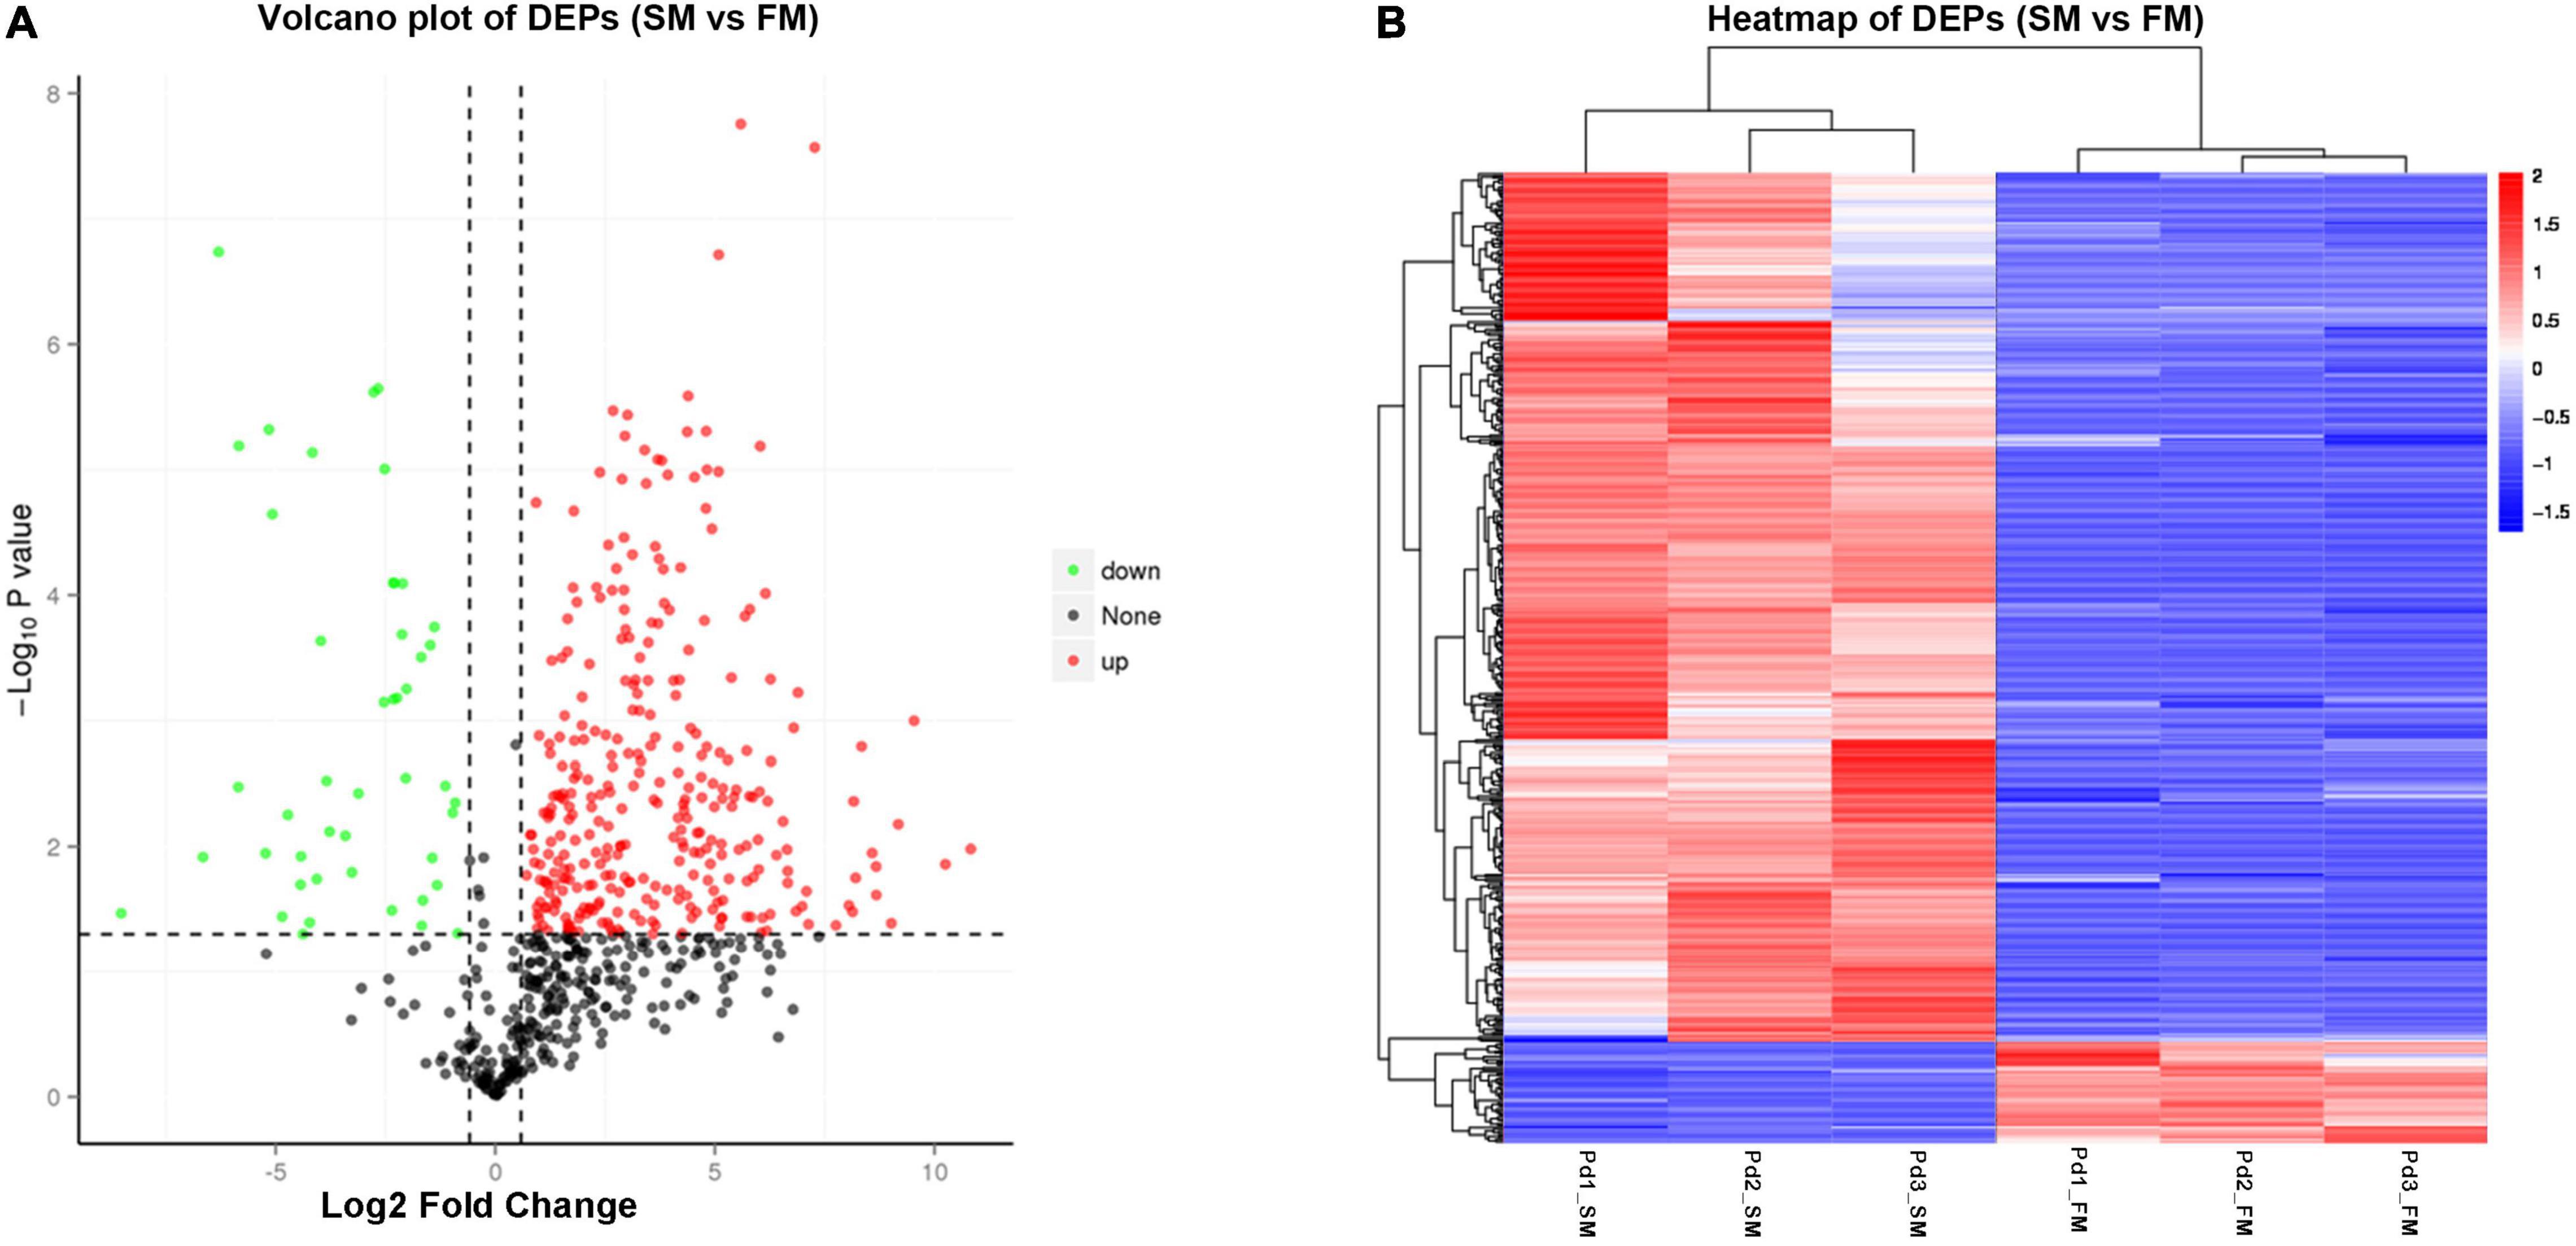
Figure 3. Differentially expressed proteins (DEPs) between slow-twitch muscle and fast-twitch muscle in P. dentex. (A) Volcano plot of DEPs. Red dots represent proteins with significantly higher expression levels in slow-twitch muscle, while green dots represent proteins with significantly higher expression levels in fast-twitch muscle (fold change ≥ 1.5 and p < 0.05). (B) Hierarchical cluster heatmap of DEPs. Red represents upregulated proteins, while blue represents downregulated proteins. The color intensity changes with the protein abundance, as commented in the key bar on the upper right. Pd1, Pd2, and Pd3, the three biological replicates; SM, slow-twitch muscle; FM, fast-twitch muscle.
To elucidate the functions of DEPs, we performed annotation of GO functional enrichment, KEGG pathway enrichment, and subcellular localization analysis. The results of GO enrichment analysis are shown in Figure 4A. Terms enriched in the biological process (BP) category included carboxylic acid metabolic process (GO: 0019572), small molecule metabolic process (GO: 0044281), organic acid metabolic process (GO: 0006082), single-organism metabolic process (GO: 0044710), transmembrane transport (GO: 0055085), purine-containing compound metabolic process (GO: 0072521), single-organism localization (GO: 1902578), purine nucleotide metabolic process (GO: 0006163), purine ribonucleoside metabolic process (GO: 0046128), and muscle contraction (GO: 0006936). Terms enriched in the molecular function (MF) category included oxidoreductase activity, acting on peroxide as acceptor (GO: 0016684), and peroxiredoxin activity (GO: 0051920). The main functional terms related to cell components (CC) included mitochondrion (GO: 0005739), organelle envelope (GO: 0031967), mitochondrial part (GO: 0044429), intracellular membrane-bounded organelle (GO: 0043231), mitochondrial envelope (GO: 0005740), outer membrane (GO: 0019867), mitochondrial membrane (GO: 0031966), organelle membrane (GO: 0031090), and cytosolic part (GO: 0044445).
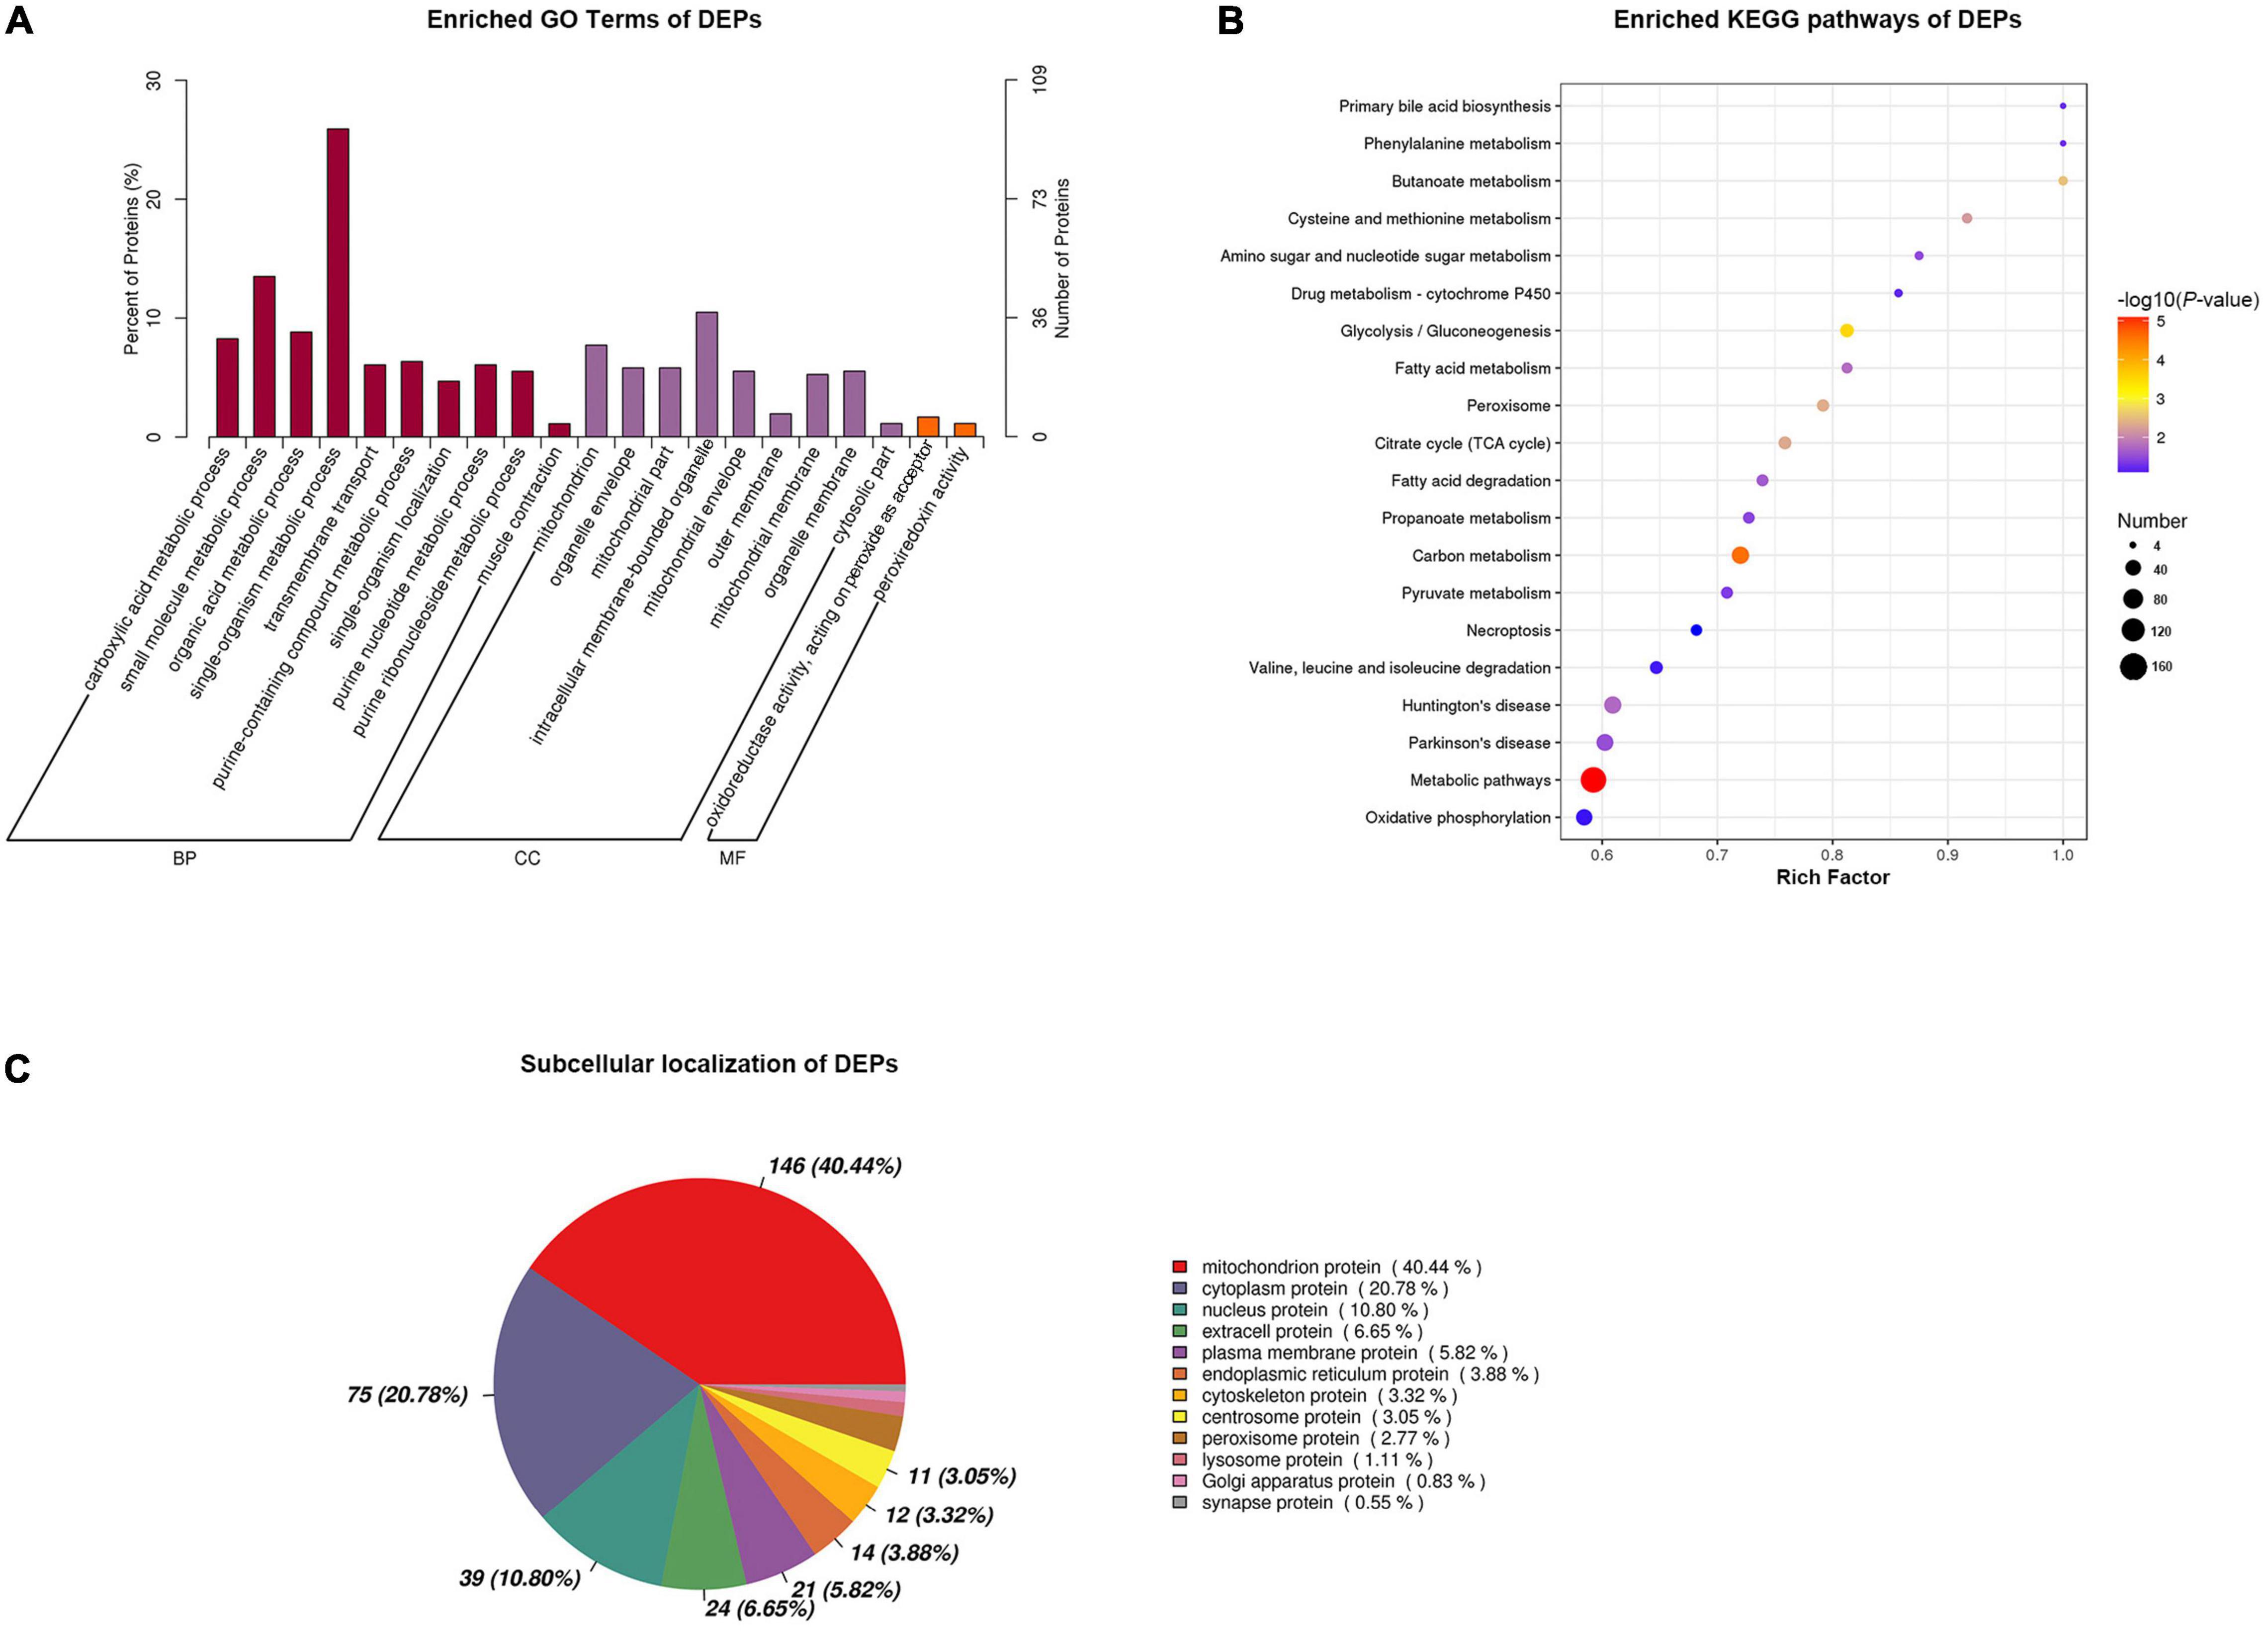
Figure 4. Functional annotation of differentially expressed proteins (DEPs) between slow-twitch and fast-twitch muscles in P. dentex. (A) Gene Oncology (GO) analysis of DEPs. Dark purple bars represent biological process (BP); red bars represent cellular components (CC); orange bars represent molecular function (MF). (B) The top terms of Kyoto Encyclopedia of Genes and Genomes (KEGG) signaling pathway enrichment for DEPs. The rich factor of the x-axis indicates the number of enriched proteins associated with the given KEGG term divided by the total number of input proteins. The specific terms are plotted along the y-axis. The size of the colored dots indicates the number of significant DEPs associated with each corresponding term. The color of each dot indicates the -log10 (p-value) for the corresponding term. (C) Subcellular localization analysis for DEPs. The data in the pie chart present the subcellular positioning ratio of the DEPs.
Kyoto Encyclopedia of Genes and Genomes pathway significant enrichment could reflect the most important biochemical metabolic pathways and signal transduction pathways in which DEPs participate. In this study, the DEPs were mainly enriched in the following pathways: metabolic pathways (map01100), carbon metabolism (map01200), glycolysis/gluconeogenesis (map00010), peroxisome (map04146), citrate cycle [tricarboxylic acid (TCA) cycle] (map00020), fatty acid metabolism (map01212), fatty acid degradation (map00071), amino sugar and nucleotide sugar metabolism (map00520), and oxidative phosphorylation (map00190) (Figure 4B).
Proteins were secreted outside the cell or remained in the cytoplasm once synthesized in the ribosome. Only when proteins are transported to the correct location, they can participate in the physiological activities of cells. Subcellular localization indicated that the DEPs were mainly localized to the mitochondrion, cytoplasm, nucleus, extra-cell, plasma membrane, and endoplasmic reticulum (Figure 4C).
Integrative Analysis of Proteome and Transcriptome Data
To explore the molecular mechanisms that control and maintain teleost skeletal muscle at both transcriptional and post-transcriptional levels, we performed the integrative analysis of proteome with transcriptome in multiple ways. Among the 1,130 proteins we measured, 948 (83.89%) were successfully mapped to RNA transcripts obtained by transcriptome sequencing. It was found that 757 RNA-protein pairs (79.85%) show a positive correlation between RNA and protein abundance, and the median value was 0.6646 (Figure 5A). In particular, 366 RNA-protein pairs (38.61%) displayed a strong positive correlation (Spearman’s correlation > 0.8), which were regulated at the transcriptional level. GO enrichment analysis revealed that these strong positively correlated gene pairs were primarily enriched in the mitochondrial oxidation-reduction process, nucleoside monophosphate biosynthetic process, and ATP synthesis coupled proton transport process (Figure 5B). In contrast, 191 negatively correlated RNA-protein pairs (20.15%) were enriched in catabolic processes of proteins and macromolecules, which were more relevant to post-transcriptional regulation (Figure 5B).
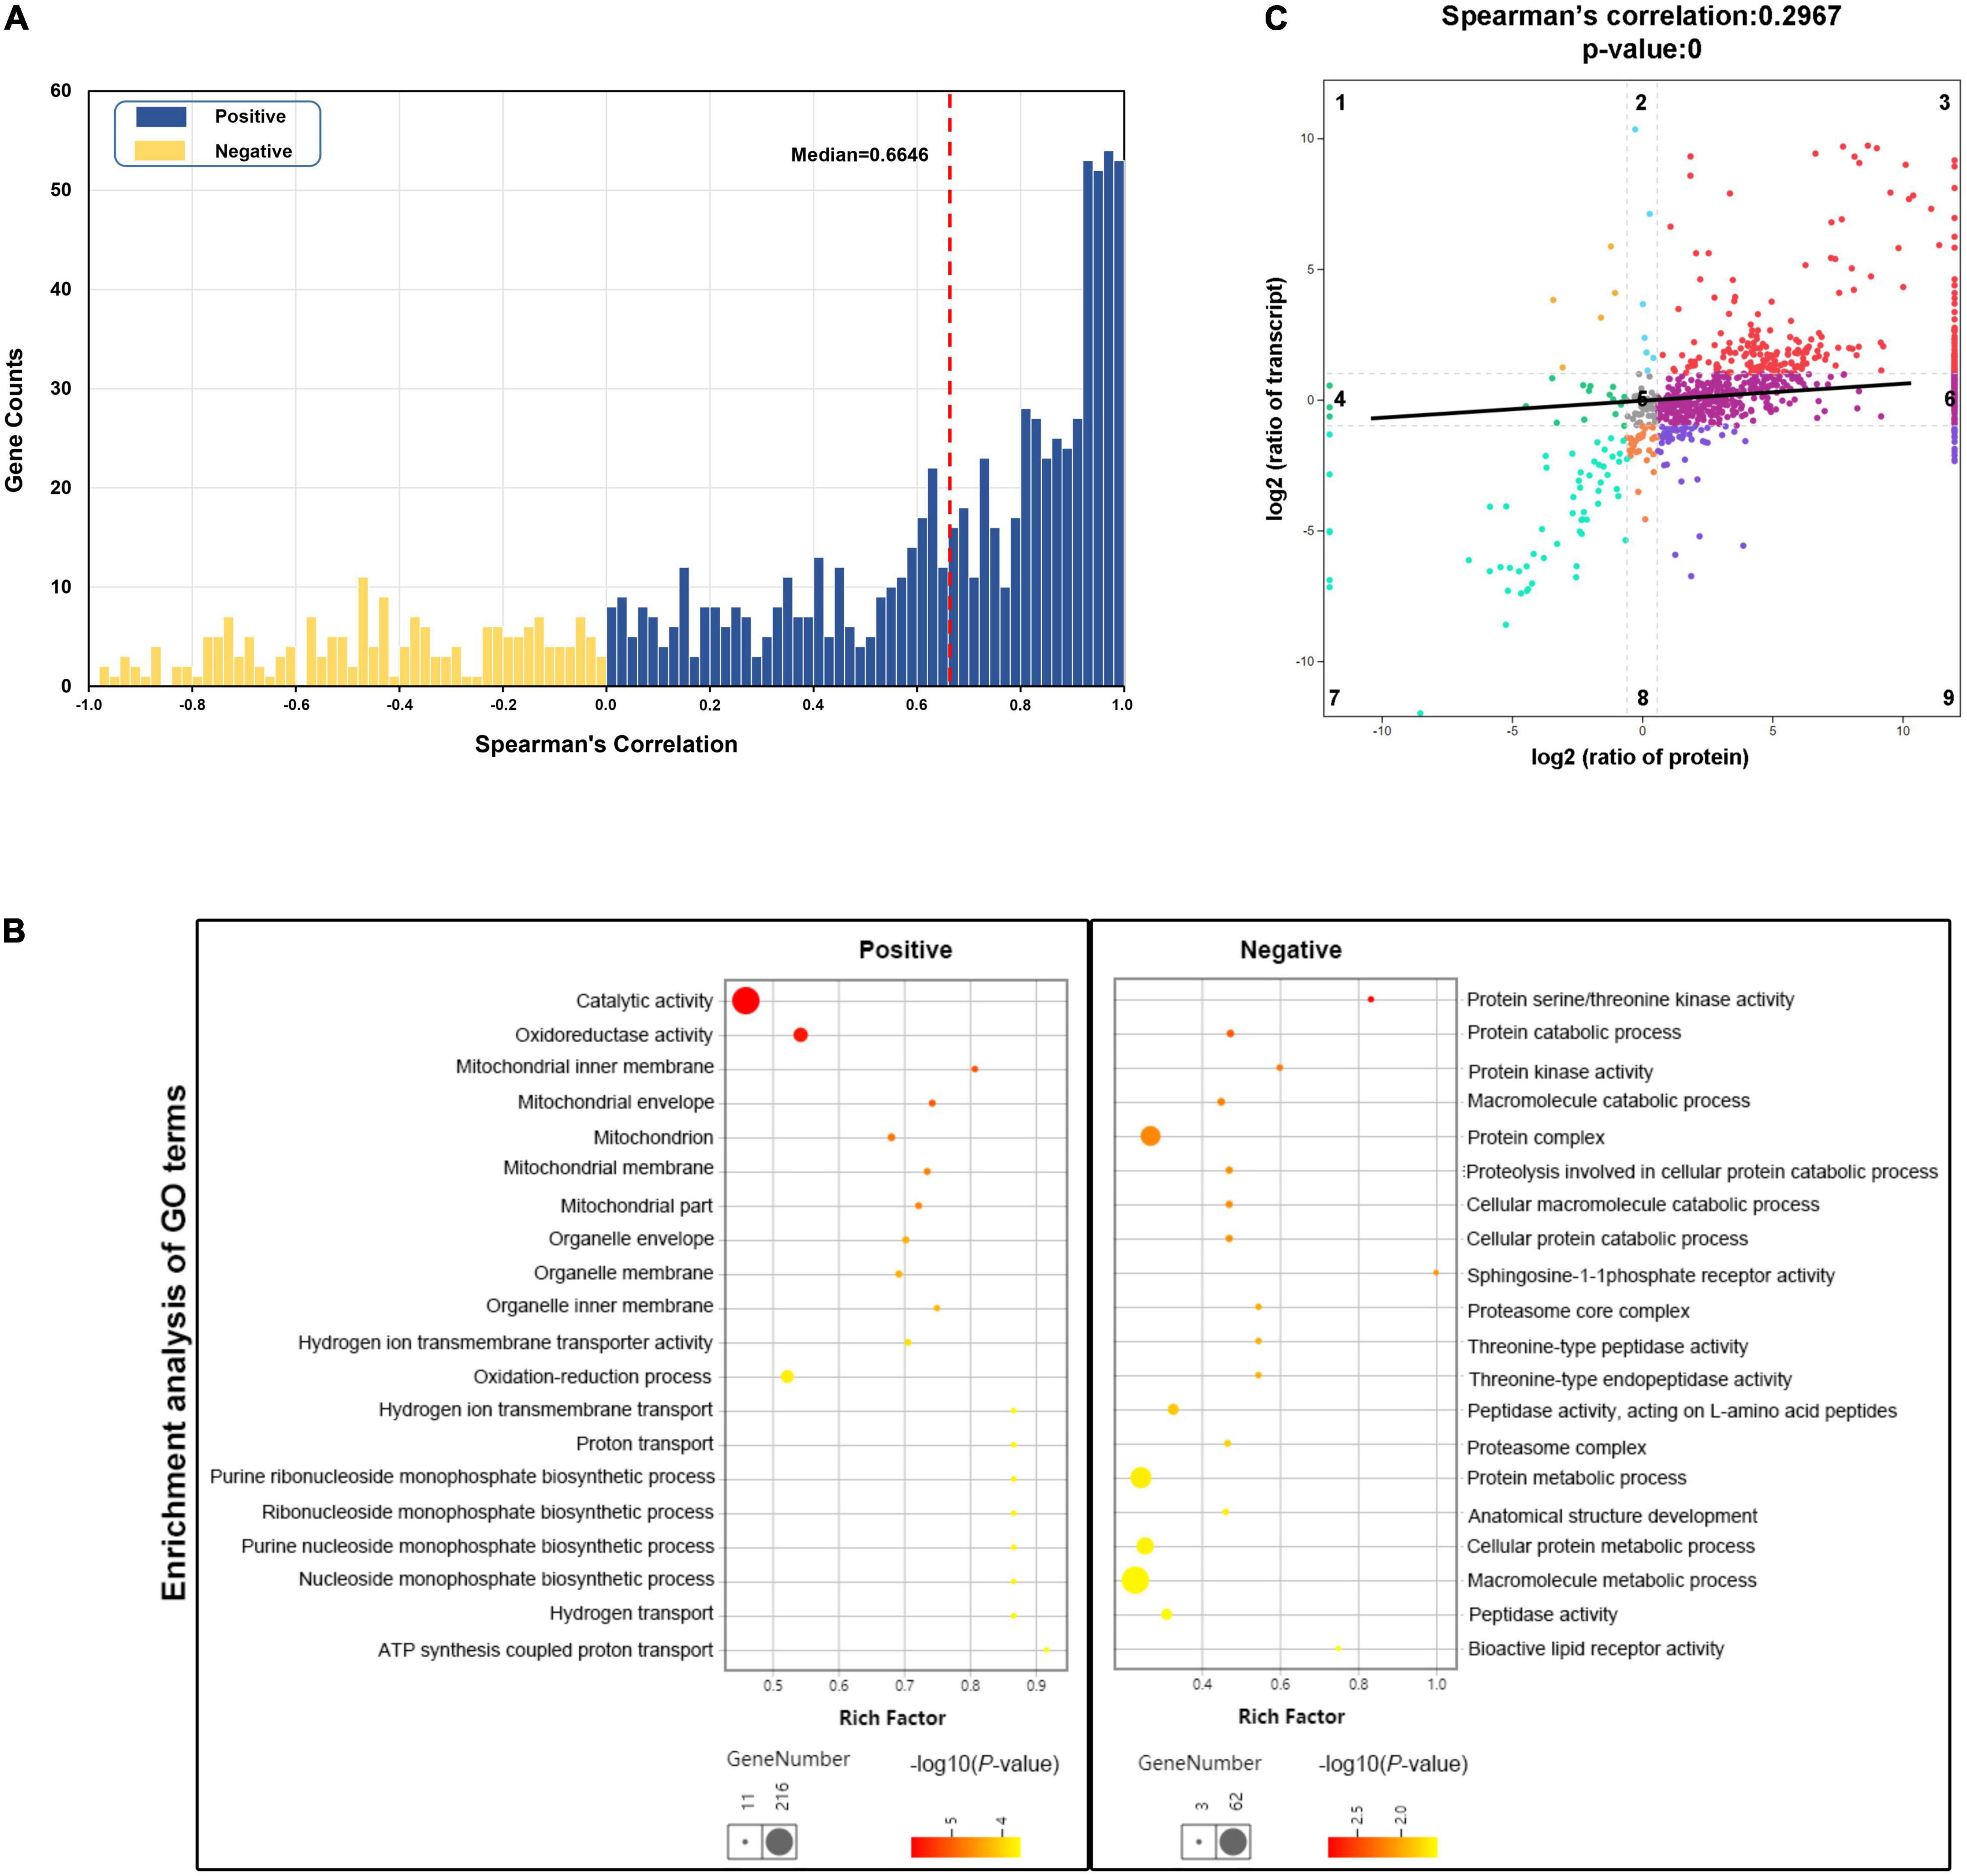
Figure 5. Integrative analysis of transcriptomic and proteomic data. (A) Correlation between RNA and protein abundance for 948 RNA-protein pairs across six samples. Blue bars represent positively correlated RNA-protein pairs (n = 757), while yellow bars represent negatively correlated (n = 191). The red dashed line represents the median value of Spearman’s correlation coefficient. (B) Gene Oncology (GO) enrichment analysis of the strong positively correlated genes (n = 366, Spearman’s correlation coefficient > 0.8) and negatively correlated genes (n = 191). The rich factor of x-axis indicates the number of enriched genes associated with the given GO term divided by the total number of input genes. (C) Correlation of fold change in protein abundance against RNA expression for all RNA-protein pairs. The black line represents linear curve fitting. Dots in the first, third, seventh, and ninth quadrants represent the genes with significant changes in both RNA (fold change ≥ 2) and protein expression (fold change ≥ 1.5). Dots in the second and eighth quadrants denote significant changes in RNA expression levels only. Dots in the fourth and sixth quadrants only show significant changes in protein expression levels. Dots in the fifth quadrant represents no significant changes in either RNA or protein.
The Spearman’s correlation coefficient of fold changes for the 948 RNA-protein pairs was also measured. It was found that the correlation of overall fold changes was 0.2967, which was weaker than abundance, revealing little relevance between mRNA and protein fold change (Figure 5C). The RNA-protein pairs distributed in the third (252, 26.58%) and seventh (59, 6.22%) quadrants were consistent in both mRNA and protein levels changes, which means that the expression of these proteins was regulated at the transcriptional level. In the third quadrant, the identified RNA-protein pairs were mainly enriched in slow-twitch muscle, such as MHC 11, myosin essential light chain (ELC) 1, troponin I (TnI; slow skeletal muscle type 2 and cardiac muscle), Tropomyosin-α1 and α3, carnitine palmitoyltransferase (CPT2), isocitrate dehydrogenase (IDH), and 2-oxoglutarate dehydrogenase complex (Ogdh) (Figures 6, 7). In the seventh quadrant, the identified RNA-protein pairs were mainly enriched in fast-twitch muscle, such as myosin ELC 3, TnI (fast skeletal muscle), Troponin T (TnT; fast skeletal muscle), Titin, phosphoglucose isomerase (Gpi), and pyruvate kinase (Pkmb) (Figures 6, 7). However, more genes (594, 62.66%) were distributed in the first, second, fourth, sixth, eighth, and ninth quadrants, showing striking differences between protein and RNA fold changes (Figure 5C), indicating the expressions of these proteins were mainly regulated by post-transcriptional events. For instance, 67 genes in the first and ninth quadrants had an opposite fold change trend at RNA and protein levels, such as actin (alpha cardiac muscle), TnI (slow skeletal muscle type1), collagen, 20S proteasome, phosphofructokinase (Pfkm), lamin, and gelsolin. Additionally, 485 genes in the fourth and sixth quadrants showed increased protein levels in either the fast-twitch or slow-twitch muscles, but with no difference in mRNA expression. They were mainly associated with ribosomal proteins, TCA cycle, oxidative phosphorylation-related enzymes, amino acid biosynthesis, degradation, and metabolism-related enzymes (Figure 7). Finally, 42 genes in the second and eighth quadrants, such as titin isoform X1, actinin-3, nebulin, creatine kinase (CK) M-type, and tropomodulin-4, showed increased mRNA levels in either the fast-twitch muscle or slow-twitch muscle but had similar protein expression in the two muscle types (Supplementary Table 9).
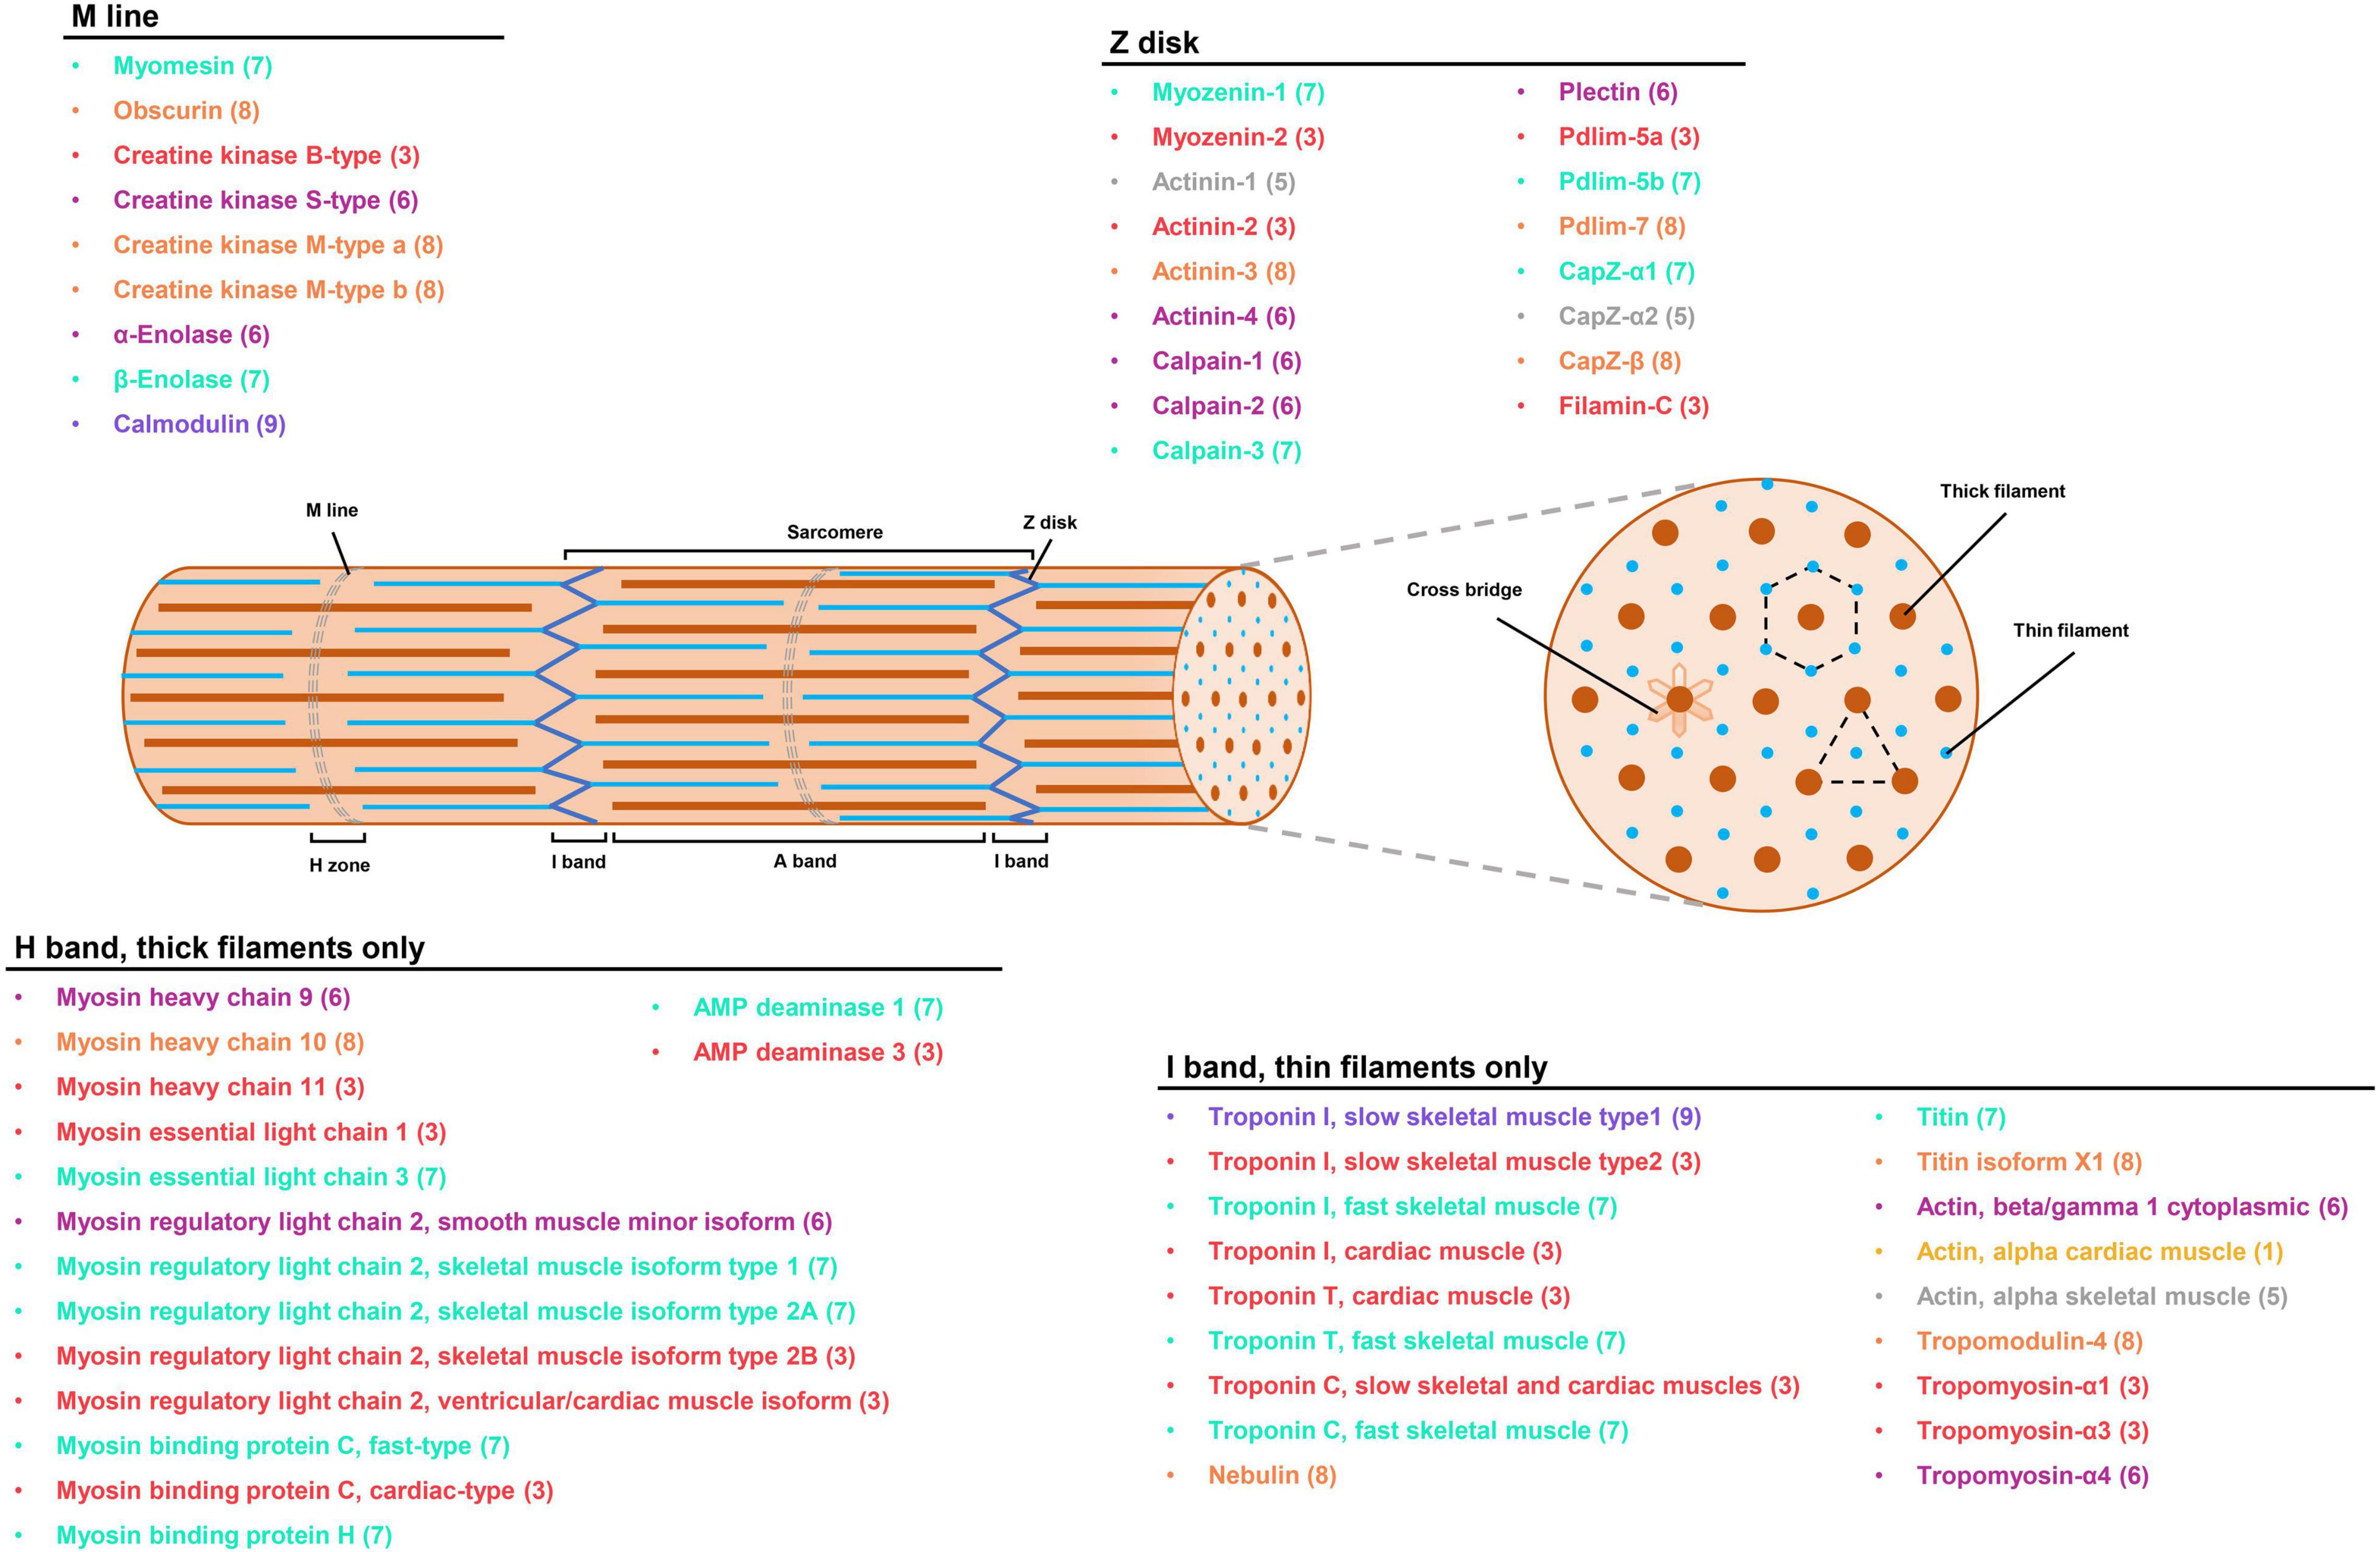
Figure 6. The expression profiles of myofibrillar proteins in P. dentex skeletal muscle by integrative transcriptome and proteome. Localization of myofibrillar proteins mapped onto the schematic of the sarcomere was predicted based on the published vertebrate counterparts (Estévez et al., 2012; Holland and Ohlendieck, 2013; Ochiai and Ozawa, 2020). The colors of fonts and numbers in parentheses represented gene expression information, corresponding to the quadrants distribution in Figure 5C.
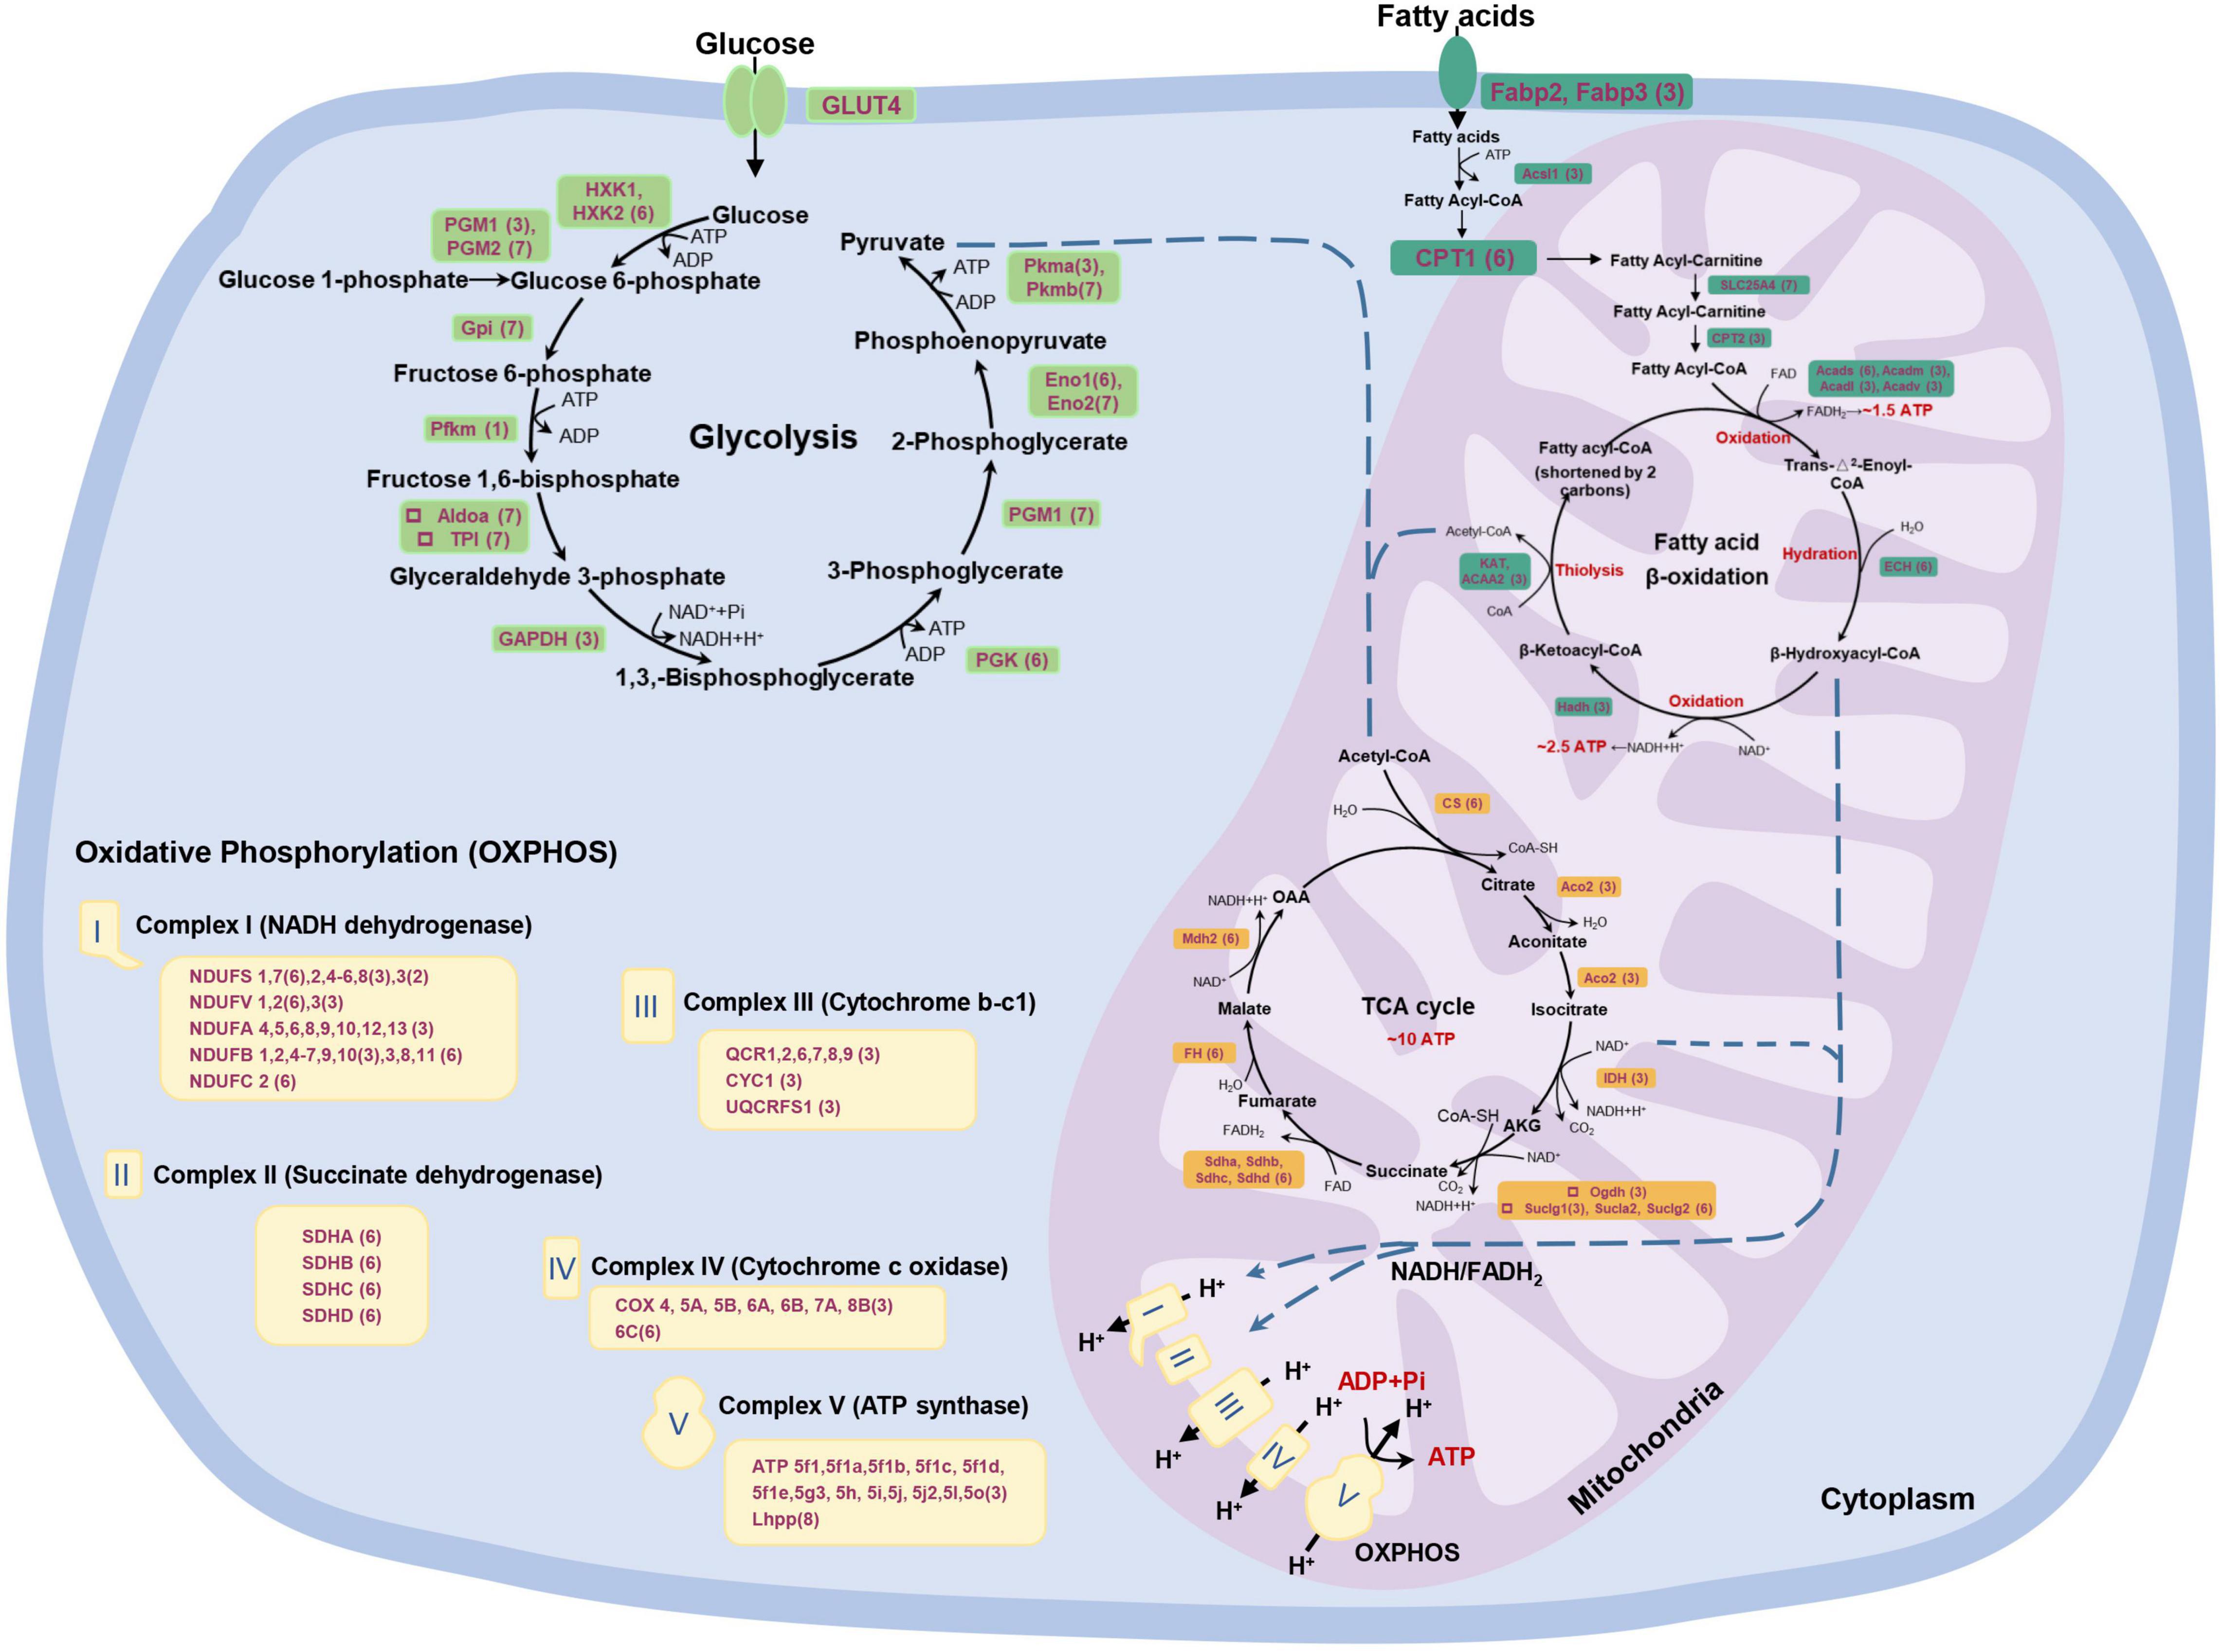
Figure 7. A global view of P. dentex skeletal muscle metabolism from the point of integrative proteome and transcriptome. The metabolic network includes glycolysis, fatty acid β-oxidation, tricarboxylic acid (TCA) cycle, and oxidative phosphorylation, all constructed by the Kyoto Encyclopedia of Genes and Genomes (KEGG) pathway. The expression information of each gene in P. dentex skeletal muscle is shown in parentheses, corresponding to the quadrant distribution in Figure 5C.
Discussion
In this study, we performed a label-free quantitative proteome analysis to plot the global protein expression profiles of skeletal muscle and compare the differences between the slow-twitch and fast-twitch muscles of P. dentex. A total of 1,130 proteins were quantified, which is roughly comparable to that of other fish species, such as Siniperca chuatsi (Chu et al., 2017), Oncorhynchus mykiss (Aedo et al., 2019), and Sparus aurata, L. (Addis et al., 2010), indicating the data we obtained are reliable and sufficient for P. dentex skeletal muscle analysis. The discovery and integrative analysis of 471 DEPs and 2,862 DEGs greatly extend our knowledge of the molecular components and complex regulatory mechanisms in P. dentex skeletal muscle.
Overall Proteomic Characterization of Pseudocaranx dentex Skeletal Muscles
From a global point of view, we identified and cataloged the entire protein components of the P. dentex skeletal muscles in detail. We found that most proteins function in the mitochondrion and participate in the metabolism process of carbohydrates, amino acids, and lipids, confirming that muscle tissue is a critical organ for energy metabolism throughout the body (Syme, 2005). As the cornerstone of maintaining muscle movement, ATP produced by the metabolism process was the energy source of skeletal muscle contraction (Palstra and Planas, 2011). Another major component was sarcomere structural proteins, such as myosins, actins, troponins, tropomyosins, and auxiliary proteins, which constitute the thick filaments and thin filaments in the sarcomere units, that symmetric arrays, interdigitate, and slide past each other to achieve cross-bridges cycle and muscle contraction (Ochiai and Ozawa, 2020). Other proteins responsible for cellular activities, such as binding proteins, ribosome proteins, transport proteins, transcription factors, and signal transduction proteins, make up the minor constituent of the total proteins detected. These characteristics of protein composition in P. dentex skeletal muscles were similar to other teleosts, mammals, and invertebrates, such as Danio rerio (Bosworth et al., 2005), Homo sapiens (Gonzalez-Freire et al., 2017), Sus scrofa (Yang et al., 2016), and Patinopecten yessoensis (Sun et al., 2018), which suggest that they might share metabolism properties and general structural features.
Differences in Myofibrillar Proteins Composition Between Slow-Twitch Muscle and Fast-Twitch Muscle of Pseudocaranx dentex
The contractile function of the skeletal muscle system is based on the dynamic arrangement of skeletal muscle fiber, an unusual cell type that is very large, multi-nucleated, and extremely heterogeneous in its protein isoform composition. Myofibrillar protein accounts for about 50–70% of the total muscle proteins (Hashimoto et al., 1979), and its composition influences various aspects of skeletal muscle, such as fiber size, mass, contractile kinetics, and muscle cell specificity. Through accurately evaluating molecular composition at both mRNA and protein levels, our results showed that the major myofibrillar protein compositions were similar between slow-twitch and fast-twitch muscles, but the expression profiles of muscle fiber-specific isoforms were divergent and regulated by transcriptional or post-transcriptional events.
Myosin
Myosin is the principal molecule of thick filament located the in A-band, and the different isoforms have been considered essential fiber type markers (Jiao et al., 2019). Like other teleosts, the myosin of P. dentex was composed of two globular heads with MYH, a neck domain binding light chains (MLC), and a long single tail (Franzini-Armstrong and Sweeney, 2012). MYH has a folded N-terminus containing the critical biological functions of actin binding and ATPase activity. The higher actin-activated Mg2+-ATPase activity of P. dentex fast-twitch muscle than that of slow-twitch muscle might be due to MYH10, which displays higher mRNA abundance and is regulated by post-transcriptional events (Kronnie et al., 1983; Knight and Molloy, 2000). MLC contains two subunits, ELC and regulatory light chain (RLC), which bind closely to the two subunits of MYH to produce sarcomere shortening and reinforce the physical loading during muscle contraction (Ochiai and Ozawa, 2020). Consistent with the observations in Cyprinus carpio (Hirayama et al., 1997) and S. chuatsi (Chu et al., 2011), MLC1 and MLC3 in P. dentex skeletal muscle were encoded by different genes and not produced from differentially spliced mRNA. Relatively higher expression levels of MLC3 in P. dentex fast-twitch muscle may lead to ascending space between thick and thin filaments and an increase in the muscle fiber diameter, which further corresponds to the faster physiological speed of shortening in the fast-twitch muscle (Ochiai et al., 1989; Lowey et al., 1993).
Actin
Actin is recognized as the main component of thin filament located in the I band, containing the binding sites for ATP and Ca2+, and is responsible for the activation of myosin Mg2+-ATPase (Pollard, 2016). It is a very conservative protein against molecular evolution across teleosts (Morita, 2003). As shown in other fish, three types of actin were obtained in P. dentex skeletal muscle, i.e., alpha skeletal muscle actin, alpha cardiac muscle actin, and beta/gamma 1 cytoplasmic actin. In the present study, there is no difference in both protein and mRNA expression patterns of alpha skeletal muscle actin between slow-twitch and fast-twitch muscles, which implies that the biological muscle movement mediated by alpha skeletal muscle actin is not fiber-type specific.
Troponin
Troponin is another central element in the thin filament, linked with Ca2+ binding and phosphorylation regulatory of vertebrate skeletal muscles. It is a complex composed of three subunits: troponin C (TnC), TnI, and TnT (Marston and Zamora, 2020). As in other teleost skeletal muscle, we detected multiple troponin isoforms in P. dentex skeletal muscle that includes one fast TnCf and one slow TnCs isoform of TnC subunit, one fast TnTf and one slow TnTs isoform of TnT subunit, one fast TnIf, two slow TnIs, and one cardiac TnIc isoform of TnI subunit. Among these, the TnC subunit is critical for trigging muscle contraction via Ca2+ binding, the TnI subunit inhibits the ATPase activity by binding to actin, and the TnT subunit provides the link to tropomyosin (Gordon et al., 2000; Swartz et al., 2006). In the present study, most of the troponin isoforms were regulated transcriptionally, except for TnIs type1, which exhibit a higher mRNA but lower protein expression level in slow-twitch muscle than fast-twitch muscle, suggesting the existence of post-transcriptional regulatory events.
Tropomyosin
Tropomyosin is an actin-associated protein invariably that is found in thin filaments and has an inhibitory role in the regulation of muscle contraction (Perry, 2001). In the present study, three alpha isoforms of tropomyosin mainly enriched in slow-twitch muscle that probably generated by alternative RNA splicing from the same gene, as suggested in Thunnus orientalis (Ochiai et al., 2010) and Takifugu rubripes (Toramoto et al., 2004), were identified, which may correspond to the slower contraction speed. The differential expressions of tropomyosin-α1 and α3 isoforms in P. dentex skeletal muscle were regulated by mRNA transcription, while tropomyosin-α4 isoform may be regulated by post-transcriptional regulatory events.
Other Skeletal Muscle Components
The striking differences between protein abundances and mRNA expression were widely distributed in P. dentex fast-twitch and slow-twitch muscles, which indicate that the post-transcriptional regulation was universal. Actinin is the major structural component of sarcomeric Z-disk, where it functions to anchor the actin-containing thin filaments and stabilize the muscle contractile apparatus (Virel and Backman, 2004). The main skeletal muscle isoforms, actinin-2 and actinin-3, are believed to evolve differences to optimize their function in fast and slow muscle fibers (Gupta et al., 2012), and it was found that the enrichment of actinin-2 in the slow-twitch muscle of P. dentex by transcriptional regulatory may be devoted to cross-link actin filaments from adjacent sarcomeres during Z-disk assembly. Moreover, CK plays a central role in energy flux and functions as a temporary buffer in maintaining high levels of ATP as demand fluctuates (O’Brien et al., 2014). Three CK isoforms were identified in P. dentex: muscle CK (CK M-type a and b), brain CK (CK B-type), and mitochondrial sarcomeric CK (CK S-type). Among these, CK M-type was predominant in P. dentex skeletal muscle and shown to interact with the sarcomeric M-line specifically. The higher expression levels of CK M-type indicated higher energy buffering and regeneration capabilities in fast-twitch muscle (Yamashita and Yoshioka, 1991). Slow-twitch muscles expressed higher levels of CK S-type, thereby, generating an energy shuttle between mitochondria and myofibrils (Yamashita and Yoshioka, 1991). In addition, the present results revealed that the expressions of CK M-type and S-type in both fast-twitch and slow-twitch muscles were mainly controlled by post-transcriptional regulatory events.
Implications for the Differences in Energy Metabolism Between Slow-Twitch Muscle and Fast-Twitch Muscle
Energy metabolism is the cornerstone of maintaining muscle movement. There are three primary energy metabolism substrates, lipids, protein, and carbohydrates, with a series of biochemical processes to produce ATP. In P. dentex, fatty acid metabolism, glycolysis, TCA cycle, and oxidative phosphorylation were the main divergent metabolism pathways between slow-twitch and fast-twitch muscles (Figure 4). We generated a global and systematic map of the genes expression profiles involved in the above signaling pathways from integrative mRNA and protein data (Figure 7). These data covered nearly all the genes that encode critical metabolic enzymes. The results indicated that fatty acid metabolism, TCA cycle, and oxidative phosphorylation were more pronounced, while glycolysis was a less obvious process in slow-twitch muscle in contrast to the fast-twitch muscle. Meanwhile, post-transcriptional regulation events also existed in the energy metabolism pathways of P. dentex skeletal muscles. The above data provided a specific molecular basis that might contribute to the differences in metabolism.
Fatty Acid Metabolism
Fatty acid serves as an important energy source, but the metabolic ability of fatty acid between two types of skeletal muscle in P. dentex was not the same. Notably, nearly all related enzymes involved in fatty acid metabolism were considerably higher in slow-twitch muscle than in fast-twitch muscle at the protein level. This suggested the importance of fatty acid breakdown and its significance during ATP generation in slow-twitch muscle. In fish, lipids supplied to slow-twitch muscle are usually considered to be the primary fuel support the endurance swimming (Magnoni and Weber, 2007), and thus the levels of enzymes involved in lipolysis and oxidation were higher (Anttila et al., 2010). In this study, we found that the contents of most enzymes were supported by the transcriptional regulation, while CPT1, Acads, and enoyl-CoA hydratase 1 (ECH) were regulated by post-transcriptional events in P. dentex slow-twitch muscle, as miRNA may be one important factor (Chabowski et al., 2006; Davalos et al., 2011). In addition, our analysis revealed that the expressions of nearly all genes in TCA cycle and oxidative phosphorylation, except LHPP, at mRNA and/or protein levels were higher in slow-twitch muscle. It is plausible that the pronounced differences in oxidative metabolism ability between muscle types are not due to the composition of specific mitochondria, but attributed to the number of mitochondria.
Glycolysis
In fish, it was reported that the glucose metabolism level in fast-twitch muscle is much higher than that in slow-twitch muscle (LeMoine et al., 2010). The existence of metabolically active complexes containing glycolytic enzymes from Gpi to Pkm is a promising idea to explain glycolysis capacity, especially in fast-twitch muscle (Crowther et al., 2002). It is well documented that the activity of three muscle proteins is central to the regulation of glucose flux through the glycolysis pathway, i.e., hexokinase, Pfkm, and Pkmb (Villar-Palasi and Larner, 1970; Wegener and Krause, 2002). Hexokinase catalyzes the initial step in glucose metabolism to regulate glucose phosphorylation, and two main isoforms, HXK1 and HXK2, existed in P. dentex skeletal muscle. Our data confirmed that both hexokinase isoforms’ expression was significantly higher at the protein level in slow-twitch muscle. Hexokinase was possibly multi-functional, as involved in transcriptional and apoptotic regulation (Kim and Dang, 2005). Pfkm catalyzes the irreversible transformation of fructose-6-phosphate into fructose-1,6-bisphosphate, one of the early rate-limiting steps in glycolysis (Dunaway, 1983). Our work showed that the post-transcriptional regulation supported the central role of Pfkm in P. dentex fast-twitch muscle. Moreover, Pkmb is the terminal enzyme in the glycolytic pathway, where it catalyzes the essentially irreversible transphosphorylation from phosphoenolpyruvate to pyruvate and the production of ATP (Villar-Palasi and Larner, 1970), and the product pyruvate feeds into a number of metabolic pathways that place this enzyme at a primary metabolic intersection. Accordingly, our data confirmed that the expression of Pkmb was significantly higher in fast-twitch muscle at both mRNA and protein levels, but Pkma was the opposite. The role of Pkmb may be more prominent in skeletal muscle, as seen from other teleosts (Prado-Lima and Val, 2016; Wang et al., 2019). Thus, fast-twitch muscle plays a more important role in glycolysis, the first step of glucose metabolism.
In summary, we presented a large-scale quantitative proteomic study on the skeletal muscle of P. dentex. We identified and characterized a large number of muscle-type specific proteins, mainly those related to myofibrillary structure and energy metabolism. The integrative analysis of proteomic and transcriptomic data provided an insight into the complex regulatory events at the transcriptional and post-transcriptional levels that contribute to shaping the identity of fast-twitch and slow-twitch skeletal muscles. The significant differences between protein abundances and mRNA expression levels supported the widespread existence of fiber-type specific, post-transcriptional regulation in fast-twitch and slow-twitch muscles. These findings will greatly improve our understanding of the molecular basis of skeletal muscle contraction, metabolism, and their regulation in teleost. It is noted that the specific regulatory events and related regulatory networks are not clear and deserve further study.
Data Availability Statement
The datasets presented in this study can be found in online repositories. The names of the repository/repositories and accession number(s) can be found in the article/Supplementary Material.
Ethics Statement
The animal study was reviewed and approved by the Animal Care and Use Committee of Yellow Sea Fisheries Research Institute.
Author Contributions
HW, BL, SL, and ZZ conceived and designed the research. HW, BL, and CJ collected the samples and performed the research. HW and JL analyzed the data. HW and SL supervised, wrote, reviewed, and edited the manuscript. All authors contributed to the article and approved the submitted version.
Funding
This work was supported by the National Natural Science Foundation of China (grant nos. 42076132 and 32102768) and the China Agriculture Research System of MOF and MARA (CARS-47).
Conflict of Interest
The authors declare that the research was conducted in the absence of any commercial or financial relationships that could be construed as a potential conflict of interest.
Publisher’s Note
All claims expressed in this article are solely those of the authors and do not necessarily represent those of their affiliated organizations, or those of the publisher, the editors and the reviewers. Any product that may be evaluated in this article, or claim that may be made by its manufacturer, is not guaranteed or endorsed by the publisher.
Acknowledgments
We thank Dalian Tianzheng Industry Co., Ltd. (Dalian, Liaoning, China) for providing specimens for this study.
Supplementary Material
The Supplementary Material for this article can be found online at: https://www.frontiersin.org/articles/10.3389/fmars.2022.842172/full#supplementary-material
Footnotes
- ^ https://www.ncbi.nlm.nih.gov/sra?linkname=bioproject_sra_all&from_uid=733284
- ^ http://kobas.cbi.pku.edu.cn/
References
Addis, M. F., Cappuccinelli, R., Tedde, V., Pagnozzi, D., Porcu, M. C., Bonaglini, E., et al. (2010). Proteomic analysis of muscle tissue from gilthead sea bream (Sparus aurata, L.) farmed in offshore floating cages. Aquaculture 309, 245–252. doi: 10.1016/j.aquaculture.2010.08.022
Aedo, J. E., Fuentes-Valenzuela, M., Molina, A., and Valdes, J. A. (2019). Quantitative proteomics analysis of membrane glucocorticoid receptor activation in rainbow trout skeletal muscle. Comp. Biochem. Physiol. Part D Genom. Prot. 32:100627. doi: 10.1016/j.cbd.2019.100627
Ahongo, Y.-D., Le Cam, A., Montfort, J., Bugeon, J., Lefèvre, F., and Rescan, P.-Y. (2022). Gene expression profiling of trout muscle during flesh quality recovery following spawning. BMC Genom. 23:1. doi: 10.1186/s12864-021-08228-3
Aji, L. P. (2011). Aerobic poise of marine fish in relation to habitat and lifestyle. J. Penel. Sains 14, 48–51. doi: 10.26554/jps.v14i3.215
Anders, S., Pyl, P. T., and Huber, W. (2015). HTSeq-a Python framework to work with high-throughput sequencing data. Bioinformatics 31, 166–169. doi: 10.1093/bioinformatics/btu638
Anttila, K., Jantti, M., and Manttari, S. (2010). Effects of training on lipid metabolism in swimming muscles of sea trout (Salmo trutta). J. Comp. Physiol. B 180, 707–714. doi: 10.1007/s00360-010-0446-1
Baer, B., and Millar, A. H. (2016). Proteomics in evolutionary ecology. J. Prot. 135, 4–11. doi: 10.1016/j.jprot.2015.09.031
Bosworth, C. A. I. V., Chou, C. W., Cole, R. B., and Rees, B. B. (2005). Protein expression patterns in zebrafish skeletal muscle: initial characterization and the effects of hypoxic exposure. Proteomics 5, 1362–1371. doi: 10.1002/pmic.200401002
Carrera, M., Pineiro, C., and Martinez, I. (2020). Proteomic strategies to evaluate the impact of farming conditions on food quality and safety in aquaculture products. Foods 9:8. doi: 10.3390/foods9081050
Carrizo, V., Valenzuela, C. A., Aros, C., Dettleff, P., Valenzuela-Munoz, V., Gallardo-Escarate, C., et al. (2021). Transcriptomic analysis reveals a Piscirickettsia salmonis-induced early inflammatory response in rainbow trout skeletal muscle. Comp. Biochem. Physiol. Part D Genom. Prot. 39:100859. doi: 10.1016/j.cbd.2021.100859
Chabowski, A., Gorski, J., and Bonen, A. (2006). Regulation of fatty acid transport: from transcriptional to posttranscriptional effects. Naunyn. Schmiedebergs Arch. Pharmacol. 373, 259–263. doi: 10.1007/s00210-006-0075-0
Chu, W., Zhang, F., Song, R., Li, Y., Wu, P., Chen, L., et al. (2017). Proteomic and microRNA transcriptome analysis revealed the microRNA-SmyD1 network regulation in skeletal muscle fibers performance of Chinese perch. Sci. Rep. 7:16498. doi: 10.1038/s41598-017-16718-2
Chu, W. Y., Chen, J., Zhou, R. X., Zhao, F. L., Meng, T., Chen, D. X., et al. (2011). Characterization and ontogenetic expression analysis of the myosin light chains from the fast white muscle of mandarin fish Siniperca chuatsi. J. Fish Biol. 78, 1225–1238. doi: 10.1111/j.1095-8649.2011.02929.x
Ciciliot, S., Rossi, A. C., Dyar, K. A., Blaauw, B., and Schiaffino, S. (2013). Muscle type and fiber type specificity in muscle wasting. Internat. J. Biochem. Cell Biol. 45, 2191–2199. doi: 10.1016/j.biocel.2013.05.016
Crowther, G. J., Kemper, W. F., Carey, M. F., and Conley, K. E. (2002). Control of glycolysis in contracting skeletal muscle. II. Turning it off. Am. J. Physiol. Endocrinol. Metab. 282, E74–E79. doi: 10.1152/ajpendo.2002.282.1.E74
Davalos, A., Goedeke, L., Smibert, P., Ramirez, C. M., Warrier, N. P., Andreo, U., et al. (2011). miR-33a/b contribute to the regulation of fatty acid metabolism and insulin signaling. Proc. Natl. Acad. Sci. U S A 108, 9232–9237. doi: 10.1073/pnas.1102281108
Dunaway, G. A. (1983). A review of animal phosphofructokinase isozymes with an emphasis on their physiological role. Mole. Cell. Biochem. 52, 75–91. doi: 10.1007/BF00230589
Estévez, A., Andree, K., and Johnston, I. A. (2012). Fast skeletal muscle transcriptome of the Gilthead sea bream (Sparus aurata) determined by next generation sequencing. BMC Genom. 13, 1–17. doi: 10.1186/1471-2164-13-181
Franzini-Armstrong, C., and Sweeney, H. L. (2012). “The contractile machinery of skeletal muscle,” in Muscle, eds J. A. Hill and E. N. Olson (Boston, MA: Academic Press), 823–840. doi: 10.1016/b978-0-12-381510-1.00058-2
Gao, K., Wang, Z., Zhou, X., Wang, H., Kong, D., Jiang, C., et al. (2017). Comparative transcriptome analysis of fast twitch muscle and slow twitch muscle in Takifugu rubripes. Comp. Biochem. Physiol. Part D: Gen. Prot. 24, 79–88. doi: 10.1016/j.cbd.2017.08.002
George, J. C. (1962). A histophysiological study of the red and white muscles of the Mackerel. Am. Midl. Natur. 68, 487–494. doi: 10.2307/2422753
Ghaedi, G., Keyvanshokooh, S., Azarm, H. M., and Akhlaghi, M. (2016). Proteomic analysis of muscle tissue from rainbow trout (Oncorhynchus mykiss) fed dietary β-glucan. Iran. J. Vet. Res. 17, 184–189.
Gonzalez-Freire, M., Semba, R. D., Ubaida-Mohien, C., Fabbri, E., Scalzo, P., Hojlund, K., et al. (2017). The Human Skeletal Muscle Proteome Project: a reappraisal of the current literature. J. Cachexia Sarcop. Muscle 8, 5–18. doi: 10.1002/jcsm.12121
Gordon, A. M., Homsher, E., and Regnier, M. (2000). Regulation of contraction in striated muscle. Physiol. Rev. 80, 853–924. doi: 10.1152/physrev.2000.80.2.853
Grunow, B., Stange, K., Bochert, R., and Tonissen, K. (2021). Histological and biochemical evaluation of skeletal muscle in the two salmonid species Coregonus maraena and Oncorhynchus mykiss. PLoS One 16:e0255062. doi: 10.1371/journal.pone.0255062
Gupta, V., Discenza, M., Guyon, J. R., Kunkel, L. M., and Beggs, A. H. (2012). alpha-Actinin-2 deficiency results in sarcomeric defects in zebrafish that cannot be rescued by alpha-actinin-3 revealing functional differences between sarcomeric isoforms. FASEB J. 26, 1892–1908. doi: 10.1096/fj.11-194548
Harada, T. (1970). The present status of marine fish cultivation research in Japan. Helgol. Wissens. Meeresunt. 20, 594–601. doi: 10.1007/BF01609931
Hashimoto, K., Watabe, S., Kono, M., and Shiro, M. (1979). Muscle protein composition of sardine and mackerel. Bull. Japan. Soc. Sci. Fish. 45, 1435–1441. doi: 10.2331/suisan.45.1435
Hinits, Y., Osborn, D. P., and Hughes, S. M. (2009). Differential requirements for myogenic regulatory factors distinguish medial and lateral somitic, cranial and fin muscle fibre populations. Development 136, 403–414. doi: 10.1242/dev.028019
Hirayama, Y., Kanoh, S., Nakaya, M., and Watabe, S. (1997). The two essential light chains of carp fast skeletal myosin, LC1 and LC3, are encoded by distinct genes and change their molar ratio following temperature acclimation. J. Exp. Biol. 200, 693–701. doi: 10.1242/jeb.200.4.693
Holland, A., and Ohlendieck, K. (2013). Proteomic profiling of the contractile apparatus from skeletal muscle. Expert Rev. Proteom. 10, 239–257. doi: 10.1586/epr.13.20
Huang da, W., Sherman, B. T., and Lempicki, R. A. (2009). Bioinformatics enrichment tools: paths toward the comprehensive functional analysis of large gene lists. Nucleic Acids Res. 37, 1–13. doi: 10.1093/nar/gkn923
Ibarz, A., Felip, O., Fernandez-Borras, J., Martin-Perez, M., Blasco, J., and Torrella, J. R. (2011). Sustained swimming improves muscle growth and cellularity in gilthead sea bream. J. Comp. Physiol. B 181, 209–217. doi: 10.1007/s00360-010-0516-4
Jackson, H. E., and Ingham, P. W. (2013). Control of muscle fibre-type diversity during embryonic development: the zebrafish paradigm. Mech. Dev. 130, 447–457. doi: 10.1016/j.mod.2013.06.001
Jiao, S., Tan, X., Sui, Y., and You, F. (2019). Muscle fibre type composition in the lateral muscle of olive flounder Paralichthys olivaceus. Acta Histochemica 121, 1–6. doi: 10.1016/j.acthis.2018.10.002
Johnston, I. A., Bower, N. I., and Macqueen, D. J. (2011). Growth and the regulation of myotomal muscle mass in teleost fish. J. Exp. Biol. 214, 1617–1628. doi: 10.1242/jeb.038620
Johnston, I. A., Davison, W., and Goldspink, G. (1977). Energy metabolism of carp swimming muscles. J. Comp. Physiol. 114, 203–216. doi: 10.1007/bf00688970
Jones, P., Binns, D., Chang, H. Y., Fraser, M., Li, W., McAnulla, C., et al. (2014). InterProScan 5: genome-scale protein function classification. Bioinformatics 30, 1236–1240. doi: 10.1093/bioinformatics/btu031
Kalhovde, J. M., Jerkovic, R., Sefland, I., Cordonnier, C., Calabria, E., Schiaffino, S., et al. (2005). ‘Fast’ and ‘slow’ muscle fibres in hindlimb muscles of adult rats regenerate from intrinsically different satellite cells. J. Physiol. 562(Pt 3), 847–857. doi: 10.1113/jphysiol.2004.073684
Kim, J. W., and Dang, C. V. (2005). Multifaceted roles of glycolytic enzymes. Trends Biochem. Sci. 30, 142–150. doi: 10.1016/j.tibs.2005.01.005
Knight, A. E., and Molloy, J. E. (2000). Muscle, myosin and single molecules. Essays Biochem. 35, 43–59. doi: 10.1042/bse0350043
Kronnie, G. T., Tatarczuch, L., Van Raamsdonk, W., and Kilarski, W. (1983). Muscle fibre types in the myotome of stickleback, Gasterosteus aculeatus L.; a histochemical, immunohistochemical and ultrastructural study. J. Fish Biol. 22, 303–316. doi: 10.1111/j.1095-8649.1983.tb04754.x
Kwasek, K., Choi, Y. M., Wang, H., Lee, K., Reddish, J. M., and Wick, M. (2021). Proteomic profile and morphological characteristics of skeletal muscle from the fast- and slow-growing yellow perch (Perca flavescens). Sci. Rep. 11:16272. doi: 10.1038/s41598-021-95817-7
LeMoine, C. M., Craig, P. M., Dhekney, K., Kim, J. J., and McClelland, G. B. (2010). Temporal and spatial patterns of gene expression in skeletal muscles in response to swim training in adult zebrafish (Danio rerio). J. Comp. Physiol. B 180, 151–160. doi: 10.1007/s00360-009-0398-5
Li, X., Xie, S., Qian, L., Cai, C., Bi, H., and Cui, W. (2020). Identification of genes related to skeletal muscle growth and development by integrated analysis of transcriptome and proteome in myostatin-edited Meishan pigs. J. Prot. 213:103628. doi: 10.1016/j.jprot.2019.103628
Li, Z., Du, X., Wen, L., Li, Y., Qin, J., Chen, Z., et al. (2021). Transcriptome analysis reveals the involvement of ubiquitin-proteasome pathway in the regulation of muscle growth of rice flower carp. Comp. Biochem. Physiol. Part D Gen. Prot. 41:100948. doi: 10.1016/j.cbd.2021.100948
Liao, H. Y., Chien, C. C., Tang, P., Chen, C. C., Chen, C. Y., and Chen, S. C. (2018). The integrated analysis of transcriptome and proteome for exploring the biodegradation mechanism of 2, 4, 6-trinitrotoluene by Citrobacter sp. J. Hazard Mater. 349, 79–90. doi: 10.1016/j.jhazmat.2018.01.039
Lowey, S., Waller, G. S., and Trybus, K. M. (1993). Skeletal muscle myosin light chains are essential for physiological speeds of shortening. Lett. Nat. 365, 454–456. doi: 10.1038/365454a0
Magnoni, L., and Weber, J. M. (2007). Endurance swimming activates trout lipoprotein lipase: plasma lipids as a fuel for muscle. J. Exp. Biol. 210(Pt 22), 4016–4023. doi: 10.1242/jeb.007708
Maier, T., Guell, M., and Serrano, L. (2009). Correlation of mRNA and protein in complex biological samples. FEBS Lett. 583, 3966–3973. doi: 10.1016/j.febslet.2009.10.036
Mareco, E. A., Garcia de la Serrana, D., Johnston, I. A., and Dal-Pai-Silva, M. (2015). Characterization of the transcriptome of fast and slow muscle myotomal fibres in the pacu (Piaractus mesopotamicus). BMC Gen. 16:182. doi: 10.1186/s12864-015-1423-6
Marston, S., and Zamora, J. E. (2020). Troponin structure and function: a view of recent progress. J. Muscle Res. Cell Mot. 41, 71–89. doi: 10.1007/s10974-019-09513-1
Morita, T. (2003). Structure-based analysis of high pressure adaptation of alpha-actin. J. Biol. Chem. 278, 28060–28066. doi: 10.1074/jbc.M302328200
Nogueira, N., Ferreira, M., Cordeiro, N., and Canada, P. (2018). Quality parameters of wild white trevally (Pseudocaranx dentex) natural spawn kept in captivity. Aquaculture 495, 68–77. doi: 10.1016/j.aquaculture.2018.05.023
O’Brien, K. M., Mueller, I. A., Orczewska, J. I., Dullen, K. R., and Ortego, M. (2014). Hearts of some Antarctic fishes lack mitochondrial creatine kinase. Comp. Biochem. Physiol. A Mol. Integr. Physiol. 178, 30–36. doi: 10.1016/j.cbpa.2014.08.003
Ochiai, Y., Handa, A., Kobayashi, T., Watabe, S., and Hashimoto, K. (1989). Isolation and enzymatic properties of myosin subfragment 1 isozymes from the ordinary muscle of Tilapia Oreochromis niloticus. Nippon Suisan Gakkaishi 55, 2143–2149. doi: 10.2331/suisan.55.2143
Ochiai, Y., and Ozawa, H. (2020). Biochemical and physicochemical characteristics of the major muscle proteins from fish and shellfish. Fish. Sci. 86, 729–740. doi: 10.1007/s12562-020-01444-y
Ochiai, Y., Ozawa, H., Huang, M. C., and Watabe, S. (2010). Characterization of two tropomyosin isoforms from the fast skeletal muscle of bluefin tuna Thunnus thynnus orientalis. Arch. Biochem. Biophys. 502, 96–103. doi: 10.1016/j.abb.2010.07.015
Palstra, A. P., Mes, D., Kusters, K., Roques, J. A., Flik, G., Kloet, K., et al. (2014). Forced sustained swimming exercise at optimal speed enhances growth of juvenile yellowtail kingfish (Seriola lalandi). Front. Physiol. 5:506. doi: 10.3389/fphys.2014.00506
Palstra, A. P., and Planas, J. V. (2011). Fish under exercise. Fish. Physiol. Biochem. 37, 259–272. doi: 10.1007/s10695-011-9505-0
Perry, S. V. (2001). Vertebrate tropomyosin: distribution, properties and function. J. Muscle Res. Cell Mot. 22, 5–49. doi: 10.1023/A:1010303732441
Piovesana, S., Capriotti, A. L., Caruso, G., Cavaliere, C., La Barbera, G., Zenezini Chiozzi, R., et al. (2016). Labeling and label free shotgun proteomics approaches to characterize muscle tissue from farmed and wild gilthead sea bream (Sparus aurata). J. Chromatogr. A 1428, 193–201. doi: 10.1016/j.chroma.2015.07.049
Pollard, T. D. (2016). Actin and Actin-Binding Proteins. Cold Spring Harb. Perspect. Biol. 8:8. doi: 10.1101/cshperspect.a018226
Prado-Lima, M., and Val, A. L. (2016). Transcriptomic characterization of Tambaqui (Colossoma macropomum, Cuvier, 1818) exposed to three climate change scenarios. PLoS One 11:e0152366. doi: 10.1371/journal.pone.0152366
Schiaffino, S., and Reggiani, C. (2011). Fiber types in mammalian skeletal muscles. Physiol. Rev. 91, 1447–1531. doi: 10.1152/physrev.00031.2010
Silva, P., Rowlerson, A. M., Valente, L. M., Olmedo, M., Monteiro, R. A., and Rocha, E. (2008). Muscle differentiation in blackspot seabream (Pagellus bogaraveo, Brunnich): histochemical and immunohistochemical study of the fibre types. Tissue Cell 40, 447–458. doi: 10.1016/j.tice.2008.05.001
Smith-Vaniz, W. F. (1999). “Carangidae. Jacks and scads (also trevallies, queenfishes, runners, amberjacks, pilotfishes, pampanos, etc.),” in FAO species identification guide for fishery purposes. The living marine resources of the Western Central Pacific, eds K. E. Carpenter and V. H. Niem (Rome: FAO).
Sun, X., Liu, Z., Wu, B., Zhou, L., Wang, Q., Wu, W., et al. (2018). Differences between fast and slow muscles in scallops revealed through proteomics and transcriptomics. BMC Genom. 19:377. doi: 10.1186/s12864-018-4770-2
Swartz, D. R., Yang, Z., Sen, A., Tikunova, S. B., and Davis, J. P. (2006). Myofibrillar troponin exists in three states and there is signal transduction along skeletal myofibrillar thin filaments. J. Mol. Biol. 361, 420–435. doi: 10.1016/j.jmb.2006.05.078
Syme, D. A. (2005). Functional properties of skeletal muscle. Fish Biomech. 23, 179–240. doi: 10.1016/s1546-5098(05)23006-6
Tanaka, H., Shimizu, N., and Yoshikawa, N. (2017). Role of skeletal muscle glucocorticoid receptor in systemic energy homeostasis. Exp. Cell Res. 360, 24–26. doi: 10.1016/j.yexcr.2017.03.049
Toramoto, T., Ikeda, D., Ochiai, Y., Minoshima, S., Shimizu, N., and Watabe, S. (2004). Multiple gene organization of pufferfish Fugu rubripes tropomyosin isoforms and tissue distribution of their transcripts. Gene 331, 41–51. doi: 10.1016/j.gene.2004.01.013
Trapnell, C., Pachter, L., and Salzberg, S. L. (2009). TopHat: discovering splice junctions with RNA-Seq. Bioinformatics 25, 1105–1111. doi: 10.1093/bioinformatics/btp120
Villar-Palasi, C., and Larner, J. (1970). Glycogen metabolism and glycolytic enzymes. Annu. Rev. Biochem. 39, 639–672. doi: 10.1146/annurev.bi.39.070170.003231
Virel, A., and Backman, L. (2004). Molecular evolution and structure of alpha-actinin. Mol. Biol. Evol. 21, 1024–1031. doi: 10.1093/molbev/msh094
Wang, H., Li, B., Yang, L., Jiang, C., Zhang, T., Liu, S., et al. (2022). Expression profiles and transcript properties of fast-twitch and slow-twitch muscles in a deep-sea highly migratory fish, Pseudocaranx dentex. PeerJ. 2022:12720. doi: 10.7717/peerj.12720
Wang, Z., Ding, Z., Xu, Q.-H., and Liu, J.-X. (2019). Metabolism responses to silver nanoparticles stresses during zebrafish embryogenesis. Chemosphere 222, 991–1002. doi: 10.1016/j.chemosphere.2019.01.177
Warnes, G. R., Bolker, B., Bonebakker, L., Gentleman, R., Huber, W., Lumley, T., et al. (2016). Package ‘gplots’. Various R Programming Tools for Plotting Data.
Watanabe, T., and Vassallo-Agius, R. (2003). Broodstock nutrition research on marine finfish in Japan. Aquaculture 227, 35–61. doi: 10.1016/s0044-8486(03)00494-0
Wegener, G., and Krause, U. (2002). Different modes of activating phosphofructokinase, a key regulatory enzyme of glycolysis, in working vertebrate muscle. Biochem. Soc. Trans. 30, 264–270. doi: 10.1042/bst0300264
Wu, M. P., Chang, N. C., Chung, C. L., Chiu, W. C., Hsu, C. C., Chen, H. M., et al. (2018). Analysis of Titin in Red and White Muscles: Crucial Role on Muscle Contractions Using a Fish Model. Biomed. Res. Int. 2018:5816875. doi: 10.1155/2018/5816875
Wu, P., Chen, L., Cheng, J., Pan, Y., Zhu, X., Bao, L., et al. (2021). The miRNA expression profile directly reflects the energy metabolic differences between slow and fast muscle with nutritional regulation of the Chinese perch (Siniperca chuatsi). Comp. Biochem. Physiol. A Mol. Integr. Physiol. 259:111003. doi: 10.1016/j.cbpa.2021.111003
Yamashita, K., and Yoshioka, T. (1991). Profiles of creatine kinase isoenzyme compositions in single muscle fibres of different types. J. Mus. Res. Cell Mot. 12, 37–44. doi: 10.1007/BF01781172
Yang, H., Xu, X. L., Ma, H. M., and Jiang, J. (2016). Integrative analysis of transcriptomics and proteomics of skeletal muscles of the Chinese indigenous Shaziling pig compared with the Yorkshire breed. BMC Genet. 17:80. doi: 10.1186/s12863-016-0389-y
Yang, N., Yu, L., Deng, Y., Han, Q., Wang, J., Yu, L., et al. (2020). Identification and characterization of proteins that are differentially expressed in adipose tissue of olanzapine-induced insulin resistance rat by iTRAQ quantitative proteomics. J. Prot. 212:103570. doi: 10.1016/j.jprot.2019.103570
Yu, E. M., Zhang, H. F., Li, Z. F., Wang, G. J., Wu, H. K., Xie, J., et al. (2017). Proteomic signature of muscle fibre hyperplasia in response to faba bean intake in grass carp. Sci. Rep. 7:45950. doi: 10.1038/srep45950
Keywords: Pseudocaranx dentex, fast-twitch muscle, proteomic, transcriptomic, integrative analysis, slow-twitch muscle
Citation: Wang H, Li B, Li J, Jiang C, Liu S and Zhuang Z (2022) Label-Free Quantitative Proteomic Analysis Provides Insight Into the Differences Between Slow-Twitch Muscle and Fast-Twitch Muscle of Pseudocaranx dentex. Front. Mar. Sci. 9:842172. doi: 10.3389/fmars.2022.842172
Received: 23 December 2021; Accepted: 28 February 2022;
Published: 14 April 2022.
Edited by:
Hui Zhang, Institute of Oceanology (CAS), ChinaReviewed by:
Denise Schrama, University of Algarve, PortugalHuan Zhang, University of Connecticut, United States
Jun Li, Institute of Oceanology (CAS), China
Copyright © 2022 Wang, Li, Li, Jiang, Liu and Zhuang. This is an open-access article distributed under the terms of the Creative Commons Attribution License (CC BY). The use, distribution or reproduction in other forums is permitted, provided the original author(s) and the copyright owner(s) are credited and that the original publication in this journal is cited, in accordance with accepted academic practice. No use, distribution or reproduction is permitted which does not comply with these terms.
*Correspondence: Shufang Liu, liusf@ysfri.ac.cn