From Embryo to Adult Life: Differential Expression of Visual Opsins in the Flatfish Solea senegalensis Under Different Light Spectra and Photoperiods
 Sara Frau1†
  José A. Paullada-Salmerón1,2,3†
  Isabella Paradiso1
  Mairi E. Cowan1,4
  Águeda J. Martín-Robles2,3,5*
  José A. Muñoz-Cueto1,2,3*
- 1Department of Biology, Faculty of Marine and Environmental Sciences, University of Cádiz, Puerto Real, Spain
- 2INMAR Research Institute, Marine Campus of International Excellence (CEIMAR), Agrifood Campus of International Excellence (ceiA3), Puerto Real, Spain
- 3European University of the Seas SEA-EU, Cádiz, Spain
- 4Scottish Association for Marine Science, Oban, United Kingdom
- 5Biochemistry and Molecular Biology Area, Department of Biomedicine, Biotechnology and Public Health, Faculty of Sciences, University of Cádiz, Puerto Real, Spain
Visual photoreceptors in fish are usually adjusted to the light environment to ensure the highest efficiency and best adaptation. In the Senegalese sole, metamorphosis determines migration from pelagic to benthic habitats, with marked differences in both light intensity and spectrum. Here, we analysed the ontogeny of six visual photopigments, namely, rod opsin (rh1), short wavelength-sensitive (sws1 and sws2), medium wavelength-sensitive (rh2.3 and rh2.4), and long wavelength-sensitive (lws) cone opsins, in sole specimens maintained in light-dark cycles of white (LDW), blue (LDB), red (LDR), and continuous white (LL) lights by using RT-qPCR and in situ hybridisation. Most of the opsins displayed a similar developmental expression pattern under all tested conditions. However, lower transcripts were detected under LDR and LL compared to LDW and LDB. A significant increase in gene expression was detected before and after metamorphosis, reaching minimum transcript levels at hatching and during metamorphosis. Interestingly, green opsins (rh2.3 and rh2.4) displayed a significant increase only before metamorphosis, with their expression remaining low during and after metamorphosis. The rod opsin and short-, medium-, and long-wavelength sensitive cone opsins were detected in retinal photoreceptors of the sole from pre-metamorphic to adult stages by in situ hybridisation. In adults, the short-wavelength cone opsins (sws1 and sws2) were found in single cones, whereas the medium- (rh2.4) and long-wavelength (lws) cone opsins were present in double cones. The results obtained by in situ hybridisation in the retina of developing sole, in terms of number of positive cells and/or intensity of labelling, were consistent with the ontogenetic transcript patterns found by RT-qPCR, suggesting that most of the visual opsin expressions detected in the whole specimens could correspond to retinal expression. Taken together, our results pointed out that the ontogeny of the Senegalese sole is accompanied by remodelling in opsin gene expression, with the green-cone opsins being the most abundant photopigments in pre-metamorphosis and rod opsin the dominant visual photopigment from the completion of metamorphosis onwards. These results enlarge our knowledge of flatfish metamorphosis and ecology and provide useful information to develop light protocols adapted to different ontogenetic stages that could improve welfare and production in sole aquaculture.
Introduction
Particularly diverse light environments are present in aquatic marine habitats. When sunlight hits the ocean, some photons are reflected off the surface back into the atmosphere, but water absorbs most of them. In a very shallow layer, longer wavelengths are absorbed more quickly than shorter wavelengths (Jerlov, 1968). Light with short and medium wavelengths, such as blue and green lights, can penetrate more deeply. At 40 m, ocean water has absorbed nearly all the red and orange visible lights. However, blue and green lights are still able to penetrate beyond these depths (up to 200 m) in open ocean waters. Factors such as suspended sediments and dissolved organic matters can alter the quality of underwater light and consequently modify the absorption of different spectra (Jerlov, 1968). These changes in the physical environment require an organism to adapt to new abiotic conditions and modify its physiology and behaviour to survive.
Many fish species present variations in retinal sensitivity during development in response to altered or changing light conditions in the early stages compared to adult life (Evans and Fernald, 1990). These differences in light intensity and spectrum affect the wavelength absorption of photoreceptor cells, resulting in altered retinal mosaics and changes in the number of different photoreceptor cells and the expression of opsins in the retina. Five visual opsin subfamilies have been reported in vertebrates, including medium wavelength-sensitive rhodopsin (RH1) expressed in rods, UV-sensitive or very-short-wavelength-sensitive 1 (SWS1), blue-sensitive or short-wavelength-sensitive 2 (SWS2), medium wavelength-sensitive rhodopsin-like 2 (RH2), and long wavelength-sensitive (LWS) opsins expressed in cones (Carleton et al., 2020; Musilova et al., 2021). In teleost fish, gene duplication events result in multiple copies of opsin genes compared to other vertebrates. Thus, up to two sws1, three sws2, eight rh2, five lws, and two rh1 opsin genes have been described in teleosts, although some deep-sea fish exhibit a much higher number of rh1 gene copies (up to 38) as an adaptation to the dim light of mesopelagic habitats (Carleton et al., 2020; Musilova et al., 2021). Fish such as the eel (Anguilla anguilla), salmon (Oncorhynchus gorbuscha), and rainbow trout (Oncorhynchus mykiss) that undergo important life cycle transformations (i.e., metamorphosis, smoltification) were also reported to exhibit opsin plasticity associated with these changes. This could occur in a number of different ways like shifts in chromophore or absorbance spectrum, and loss, substitution, or addition of other types of opsins during these processes, coinciding with drastic changes in the environment (Cheng and Novales Flamarique, 2004; Veldhoen et al., 2006; Bowmaker et al., 2008; Temple et al., 2008).
Similarly, flatfish species are widely affected by physical and environmental changes (Evans and Fernald, 1990; Dufour et al., 2012; Iwanicki et al., 2017). The Senegalese sole, Solea senegalensis, is exposed to different environmental light depending on the ontogenetic phase. Larvae live on the surface of the seawater column exposed to a vast range of visible light spectra, while juveniles and adults live in the bottom, mainly in coastal areas of up to 100 m depth dominated by blue and green lights (Muñoz-Cueto et al., 2019). A number of studies have focused on the plasticity of opsins in pre-metamorphic and post-metamorphic flatfish species (Evans et al., 1993; Helvik et al., 2001a,b; Mader and Cameron, 2004; Hoke et al., 2006; Ferraresso et al., 2013; Chen et al., 2014; Savelli et al., 2018; Wang et al., 2021), even though it is still not clear whether these changes are driven by genetic forces or by environmental factors.
In a recent study, we characterised the mosaic, the type, and the distribution of the cones in the retina of two Solea spp. including Solea senegalensis, evidencing a loss of regular cone mosaic patterning compared to other fishes adapted to different light environments and habitats (Frau et al., 2020a). In a second study, we demonstrated that light regimes clearly affected phases, amplitudes, and/or significance of opsin daily rhythms in the Senegalese sole. We revealed that the alternation in light-dark (LD) cycles of appropriate wavelengths are very important for the optimal development of opsin repertoire in the sole, with blue light representing the most adequate for early establishment of robust visual opsin daily rhythms (Frau et al., 2020b). In this study, we continued to collect information on the topic by investigating ontogenetic patterns of expression of visual opsins and their retinal localisation in this metamorphic flatfish species, the Senegalese sole, and how they are affected when exposed to different light conditions during development, by using real-time qPCR and in situ hybridisation. Considering the importance that both photoperiod and light spectrum play in the early stages of the sole (Blanco-Vives et al., 2010, 2011, Martín-Robles et al., 2012), as well as the high commercial value and wide consumption of this species (Howell and Dinis, 2019), the information obtained in this study could be relevant for deciphering whether opsin usage is driven by environmental factors or genetically preprogrammed (or both), for improving the welfare of animals and proper development and breeding of the Senegalese sole in the aquaculture industry.
Materials and Methods
Animals and Rearing System
Senegalese sole fertilised eggs were provided by the Spanish Institute of Oceanography (Santander, Cantabria, Spain) in the spring reproductive season and brought to the University of Cadiz under dark conditions. They arrived at our facilities 1 day before hatching, and they were distributed into eight 15-L cylindroconical tanks. Water temperature was maintained under a natural thermocycle of 21 ± 0.5°C during the day and 18 ± 0.5°C during the night and continuously recorded with an underwater sensor and a data logger (HOBO Pendant; Onset Computer Corporation, Bourne, MA, United States) placed in each tank. All the tanks were sustained under continuous water and oxygen renovation, 35 ppt of salinity, and pH 7.5–8.2.
Food protocol administration to the larvae was conducted according to Frau et al. (2020b). To feed the larvae, rotifers were cultured and enriched with green algae at a proportion of 300 cells/ml/day of Nannochloropsis gaditana and 50 cells/ml/day of Isochrysis galbana. Enriched rotifers were added to the tanks as live food at a density of 10 individuals/ml/day from 3 to 6 days post-hatching (dph) and at a density of 15 individuals/ml/day from dph 7 to 9. Artemia nauplii were added to the tanks at a density of 1 to 5 nauplii/ml/day and were provided from 7 to 31 dph. For the whole experiment, the alive food was provided to the larvae four times a day to ensure their constant circulation. Rotifers, algae, and Artemia were provided by the fish facility of the “Servicio Central de Investigación en Cultivos Marinos” (REGA ESII0280003I2, University of Cádiz).
Experimental Setup and Sampling
Upon acclimation to our facilities, fertilised eggs were exposed to different light wavelengths and photoperiod conditions: LD cycles of blue light (LDB, λ peak = 463 nm, half-peak bandwidth 435–500 nm), red light (LDR, λ peak = 665 nm half-peak, bandwidth 628–692 nm), white light (LDW, ∼ 100 lx), and constant white light (LL). The white light possessed a broad spectrum of 95% irradiance within the range of 367 to 757 nm. A photoperiod of 14 h of light and 10 h of darkness was set in the LDW, LDB, and LDR tanks, while the LL group was kept with continuous (24 h) white light. LDW represented the control group mimicking the current fish hatchery protocol. Two biological replicates (tanks) were analysed for each light condition. All the tanks were covered with a thick black screen to avoid the effects of any background light on the experiments. Details regarding the light setup of the experiments are indicated in the Materials and methods section of Frau et al. (2020b).
For the qPCR experiment, pools of larvae were sampled in different developmental stages: days post hatching (dph) –1 (before hatching), dph 0 (hatching), dph 4, dph 7, dph 9, dph 17, dph 21, and dph 32. Twenty specimens/sample were collected for dph –1, 0, 4, and 7; ten specimens/sample for dph 9 and 17; and five specimens/sample for dph 21 and 32 (n = 3–5 per stage, obtained from both tanks of each light condition). In each stage, sampling was performed at zeitgeber/circadian time (ZT/CT) 4 (12:00 h local time) for specimens maintained under LD cycles and constant conditions, respectively. ZT0 corresponds to lights on and ZT14 to lights off. All the samples were immediately frozen in liquid nitrogen and stored at –80°C until they were used.
In situ hybridisation (ISH) analysis was performed in sole specimens at dph 7 (pre-metamorphosis), dph 13 (metamorphosis), dph 32 (post-metamorphosis), and 2-year-old (adult) stages, which were maintained under LDW condition and sampled at ZT4 (12:00 h local time).
All animals were manipulated following the guidelines of the Animal Experimentation and Ethics Committee of the University of Cádiz (Spain) and the Directorate General for Agricultural and Livestock Production of the Regional Government of Andalusia (approval number 15/12/2020/142) and in accordance with international ethical standards and the European Union regulation (EC Directive 86/609/EEC).
RNA Extraction and cDNA Synthesis
Total RNA from sole larvae was extracted using TRIsure Reagent® (Bioline, London, United Kingdom), as described in Frau et al. (2020b). Briefly, the samples were resuspended and homogenised, and the RNA was precipitated, isolated, cleaned and stored at –80°C until it was used. Total RNA yield and quality were determined by the 260/280-nm absorbance ratio with a NanoDrop 2000 Spectrophotometer (Thermo Fisher Scientific, Wilmington, DE, United States). For cDNA synthesis, aliquots of 1 μg of total RNA were treated with DNase-I to remove genomic DNA and reverse transcribed using a QuantiTect Reverse transcription kit (Qiagen, Hilden, Germany) following manufacturer instructions.
Gene Expression Analysis
Real-time quantitative PCR (RT-qPCR) was performed to analyse the relative mRNA expression of visual opsins. RT-qPCR reactions were performed in a Bio-Rad CFX96 Touch detection system (Bio-Rad, Richmond, CA, United States) using SYBRPremix Ex TaqII (TliRnaseH Plus; TAKARA BIO INC., Otsu, Japan). Specific forward and reverse primers were used and amplification conditions were described in Frau et al. (2020b) as follows: 1 min at 95°C (initial denaturation) and 40 cycles of 15 s at 95°C (denaturation), 15 s at annealing temperature (58.8°C for sws2; 60°C for sws1, rh2.3, lws, and housekeeping genes; 62.5°C for rh1 and rh2.4), and 10 s at 65°C (extension). Non-template control and non-retro-transcribed total RNA samples were used as negative controls. Duplicates of each sample were analysed in the same assay, and melting curves were determined for each sample to confirm that a single product was amplified. The ΔΔCt method was used to determine relative mRNA opsin expression (Livak and Schmittgen, 2001). Data obtained were normalised to the dph –1 group. Senegalese sole elongation factor 1 alpha (eef1a1) and ubiquitin (ubq) (gene bank accession numbers AB326302.1 and AB291588.1, respectively) were used as housekeeping genes for normalisation (Infante et al., 2008).
Riboprobe Synthesis
Messenger RNAs used for the synthesis of specific riboprobes corresponded to the ORF-coding region of Solea senegalensis visual opsins. The probes consisted of 486 nt for the rod opsin (rh1), 680 nt for the ultraviolet (UV) cone opsin (sws1), 485 nt for the blue cone opsin (sws2), 432 nt for the green cone opsin (rh2.4), and 624 nt for the red cone opsin (lws). Specific riboprobes were synthesised using a pSpark II vector (Canvax Biotech, Córdoba, Spain) containing DNA sequences of sole opsins synthesised by Bio Basic Inc. (Markham, Canada). Antisense and sense single-stranded mRNA probes were obtained with DIG RNA labelling MIX (Sigma Aldrich, Madrid, Spain) by transcription with T7 and SP6 RNA polymerases (Promega Biotech Ibérica S.L., Alcobendas, Spain) on plasmids linearised with SacI and SacII restriction enzymes. The size of the DIG-labeled riboprobes was checked by 1% agarose gel electrophoresis under denaturing conditions, and their concentration was evaluated by spectrophotometric analysis.
In situ Hybridisation
The precise localisation of visual opsin expression (rh1, sws1, sws2, rh2.4, and lws) was analysed by in situ hybridisation (ISH) in the retina of the sole in 4 different developmental stages: pre-metamorphosis, metamorphosis, post-metamorphosis, and adult. Whole larva (pre-metamorphosis, metamorphosis), juvenile (post-metamorphosis), and adult retinas were fixed by immersion in 4% paraformaldehyde in PBS (pH 7.4). After cryoprotection overnight in a 15% sucrose solution in PBS, whole specimens and retinas were embedded in Tissue-Tek and quickly frozen in cold isopentane, and transverse 7-μm-thick serial sections were obtained with a cryostat.
The protocol for ISH was as described in Servili et al. (2012), but was slightly modified. Before hybridisation, cryostat sections were washed in 1 × PBS (pH 7.4) two times and postfixed for 20 min in 4% paraformaldehyde (PAF) diluted in PBS. After postfixation, the sections were washed in PBS and incubated with proteinase K for 5 min at 37°C in PBS, rinsed, and postfixed again in 4% PAF. Afterward, the sections were rinsed two times in 2 × SSC at room temperature for 10 min. The DIG-labeled probes were preheated at 75°C for 5 min before the hybridisation procedure. Hybridisation was carried out at 60–65°C in a humidified chamber using 60 μl of a hybridisation buffer (2 × SSC; 2.5% dextran sulfate; 50% deionised formamide; 5 × Denhardt’s solution; 50 μg/ml of yeast tRNA, pH 8; 4 mM EDTA) containing the DIG-labeled riboprobes (500 ng–1 μg/ml). Subsequently, the slides were rinsed in 2 × SSC at 60–65°C, followed by two rinses at 60–65°C for 30 min in 2 × SSC/50% deionised formamide. The sections were rinsed in 0.2 and 0.1 × SSC at room temperature and then blocked for 1 h in a solution of 100mM Tris-HCl buffer, 150 mM NaCl (pH 7.5) with 0.5% BSA, and 0.2% Triton X-100. The slides were incubated overnight at room temperature with an alkaline phosphatase-conjugated anti-DIG antibody (1:500; Sigma Aldrich, Madrid, Spain). On the next day, the sections were incubated for 40 min in NBT/BCIP (stock solution; Sigma Aldrich, Madrid, Spain). Same riboprobe concentration, and same conditions and incubation/developing times for each opsin were systematically used in our ISH study in all the stages analyzed, permitting us to obtain some comparative information on the amount of transcript levels present in tissue sections. The specificity of the hybridisation signal was systematically checked by hybridising parallel sections with corresponding sense probes. In situ hybridisation slides were analysed on an Axio Imager (Zeiss, Oberkochen, Germany) microscope, and pictures were processed with the Zen software (Zeiss, Oberkochen, Germany) and Adobe Photoshop (Adobe Systems, San Jose, CA, United States) without any modification except for light or contrast adjustments.
Statistical Analyses
Statistical differences in the expression of the visual opsin genes between samples of the two tanks from the same condition and stage were analysed by Student’s t-test. Statistical differences in developmental expression of visual opsin genes under each particular light photoperiod and spectrum condition were analysed by one-way ANOVA and represented in Figures 1, 3, 5, 7, 8, 10. A comparison of visual opsin expression among different light conditions in a given developmental stage was also performed by one-way ANOVA and represented in Supplementary Tables 1–6. Significant ANOVAs were followed by Tukey’s post hoc comparison test to determine differences among means, with p < 0.05 as statistically significant threshold. When needed, values were transformed to match the normal distribution and homogeneity of variances. When data did not accomplish the ANOVA conditions, the non-parametric Kruskal-Wallis test was applied, followed by multiple contrasts of range test (Bonferroni). All the statistical analyses were performed using the Statgraphics Plus 5.1 software (Statpoint Technologies, Warrenton, VA, United States). The data were presented as the mean ± SEM. All the graphics were created by Prism version 6.00 for Mac (GraphPad Software, La Jolla, CA, United States).
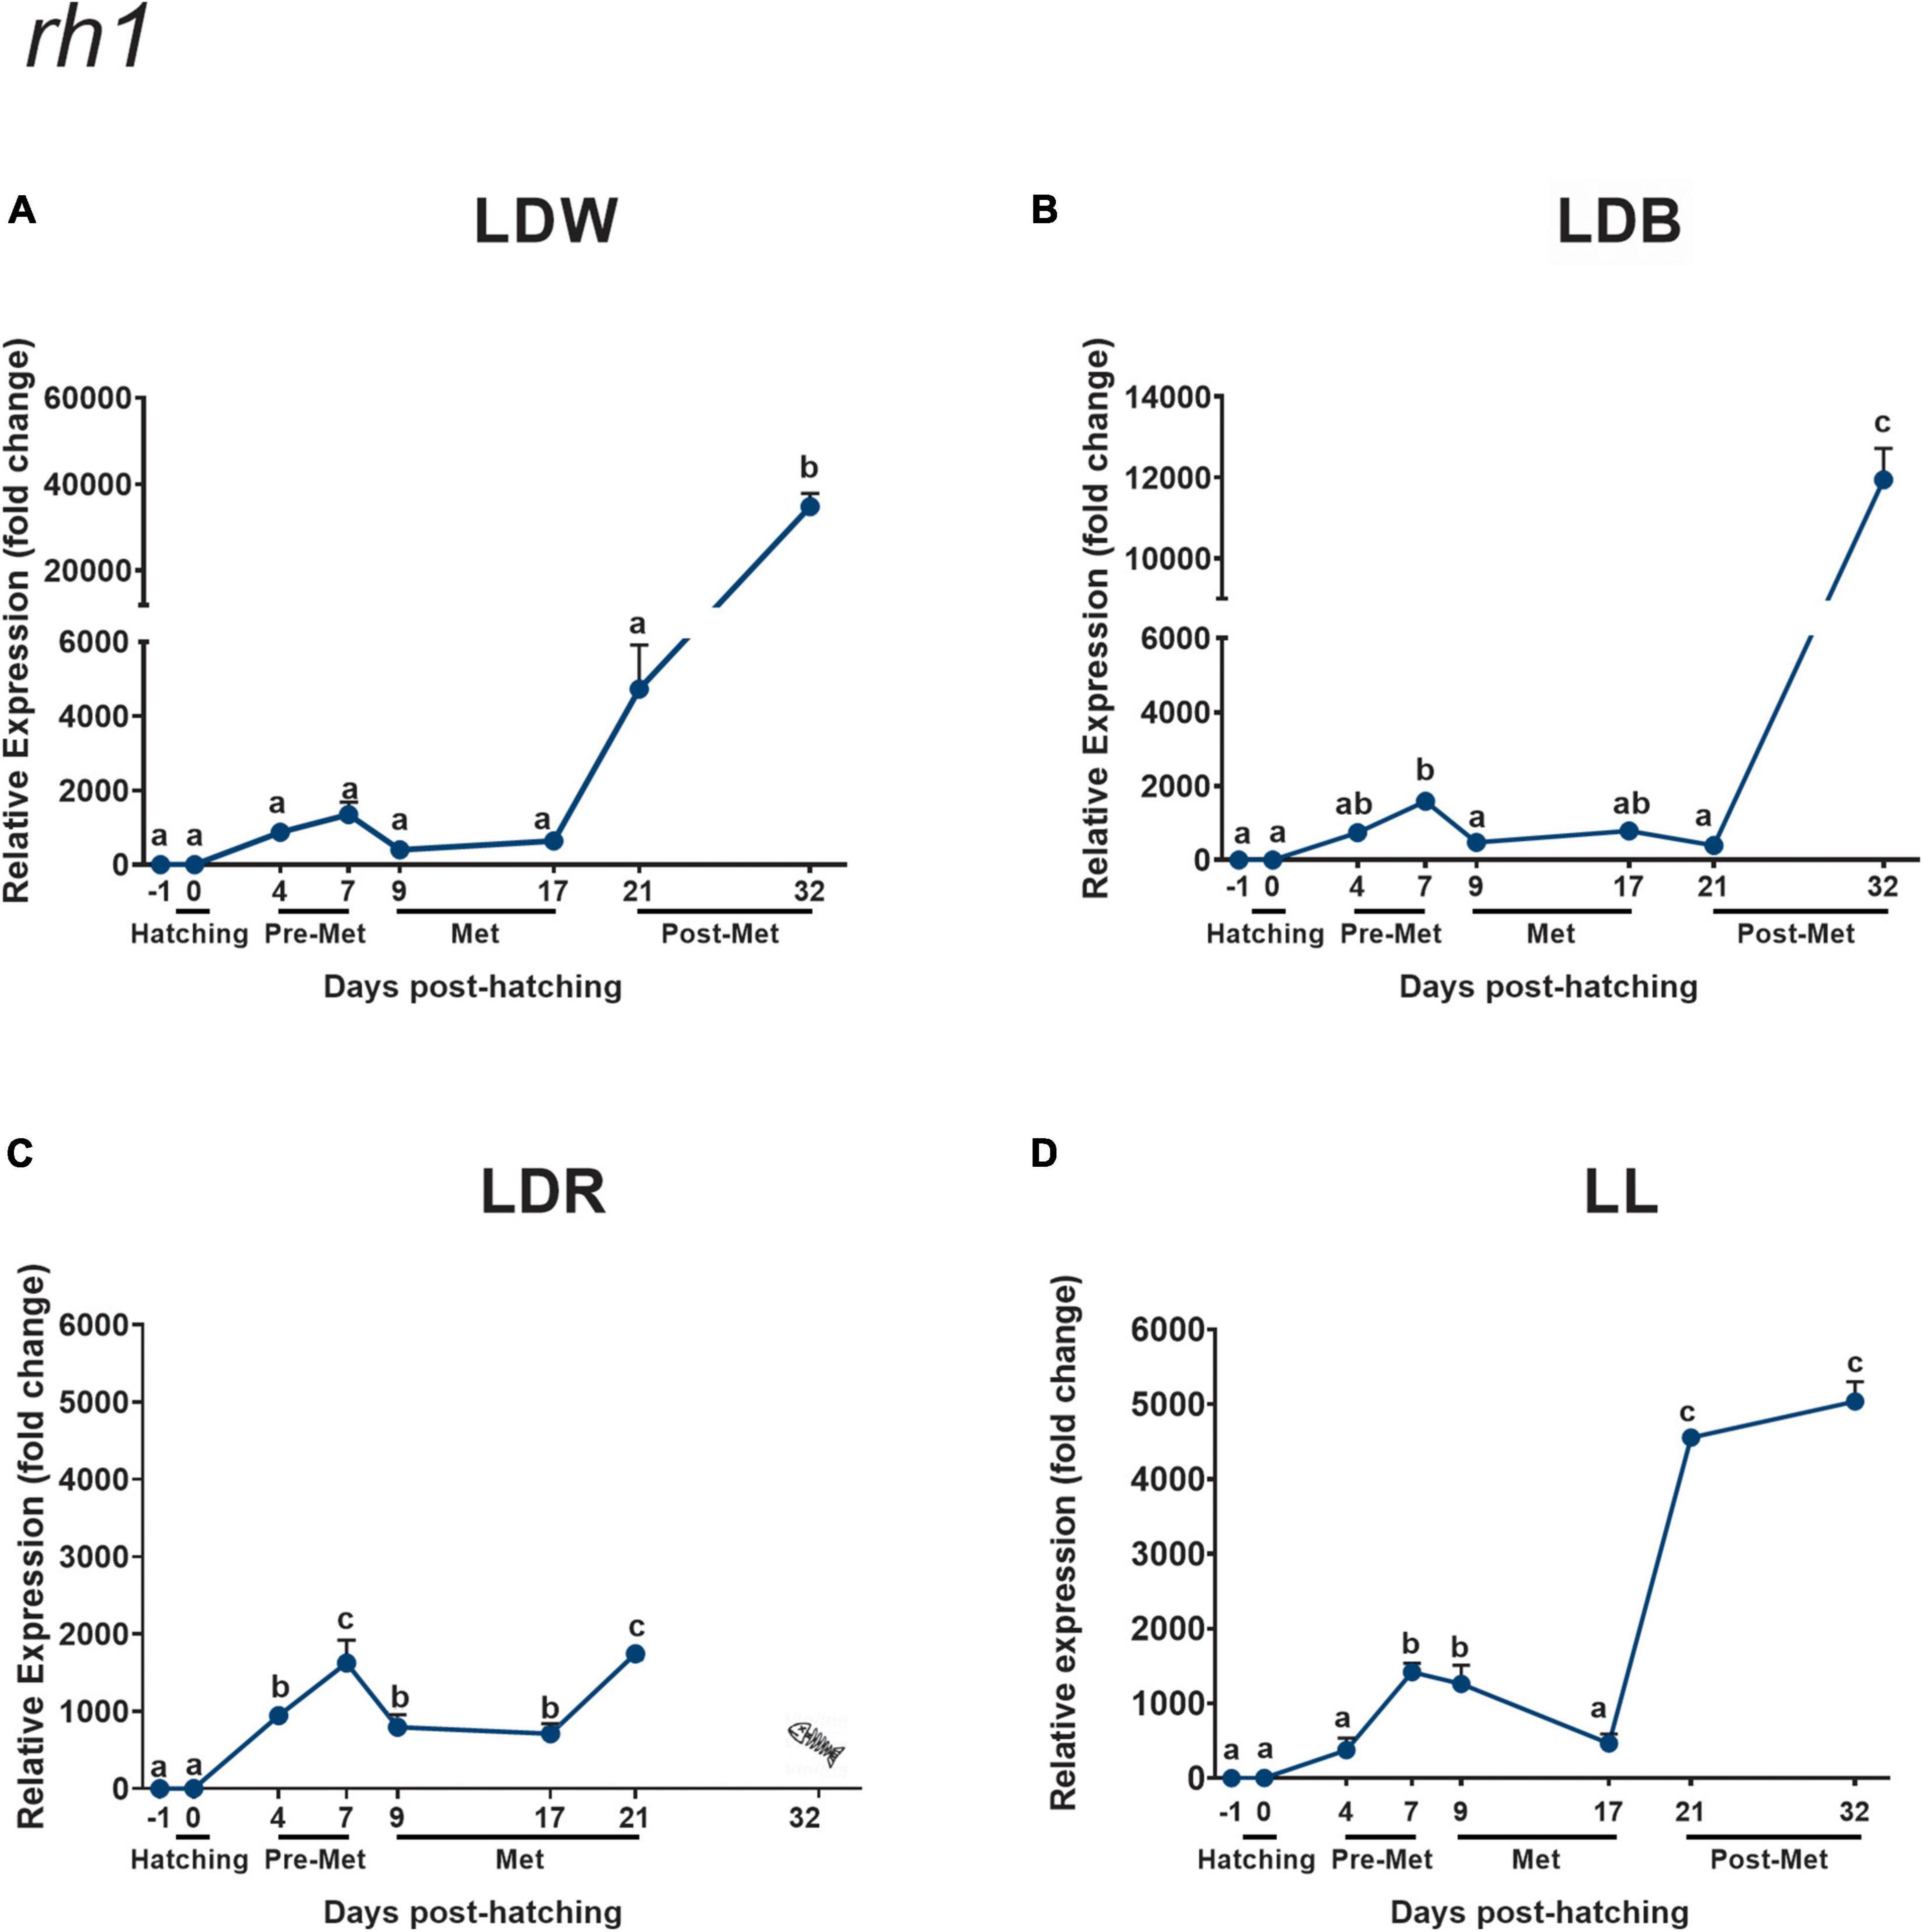
Figure 1. Expression of rod opsin (rh1) in embryos, larvae, and juveniles of the Senegalese sole –1 day post-hatching (dph) or dph –1 (embryos), dph 0 (hatching), dph 4–7 (pre-metamorphosis, Pre-Met), dph 9–17 (metamorphosis, Met), and dph 21–32 (post-metamorphosis, Post-Met) analysed by real-time quantitative polymerase chain reaction (RT-qPCR). It should be noted that the animals under LDR conditions showed delayed development, remaining in the metamorphic phase (S2-middle metamorphosis) on dph 21. Therefore, the bar indicating the metamorphic stage has been extended to dph 21 in panel (C). Each value represents the mean ± SEM (n = 3–5). Relative expression was normalised to the dph –1 group, and using ef1a1 and ubq as housekeeping genes. Senegalese sole specimens were maintained under different photoperiods and light spectra: light/dark (LD) cycles of white (LDW; A), blue (LDB; B), and red (LDR; C) lights, or under constant light conditions (LL; D). Different letters indicate statistically significant differences between mean values (p < 0.05). The Fishbone symbol in the LDR condition indicated that larvae died before the completion of metamorphosis.
Results
Visual monitoring of eye migration, position in the water column (pelagic vs. benthic), locomotor activity (diurnal vs. nocturnal), and total length of the specimens were registered in different light regimes to follow the progression of metamorphosis, using LDW as a control condition (Table 1). A delay in development was observed under the LDR regime, with the animals exhibiting shorter length and retardation in the course of metamorphosis, particularly on dph 21 (S2, middle metamorphosis under LDR vs. S3, late metamorphosis/S4, early post-metamorphosis under LDW, LDB, and LL; Table 1). High mortality was also observed in larvae reared under LDR conditions; as a result, this condition was not possible to be analysed in the last post-metamorphic stage (dph 32). Visual opsin expression during Senegalese sole development and effects of photoperiod and light spectrum were analysed by RT-qPCR (Figures 1, 3, 5, 7, 8, 10). No statistical differences were found in opsin expression among the samples of different tanks from the same condition and stage (Student’s t-test, p > 0.05). In turn, the localisation of visual opsin-expressing cells was revealed by in situ hybridisations in the retina of the sole in the pre-metamorphic, metamorphic, post-metamorphic, and adult stages (Figures 2, 4, 6, 9, 11, 12). The results obtained by ISH in the retina of the developing sole, in terms of the number of positive cells and/or intensity of the labelling, were highly consistent with those found by RT-qPCR. There were no marked differences in labelling between the right and left retinas in any of the developmental stages analysed (Figures 2A,C, 6A,C, 11D,F). No labelling was observed in sections incubated with sense riboprobes (Figures 2G,H, 4G,H, 6G,H, 9C,D, 11B,C), confirming the specificity of the staining evidenced in antisense sections.
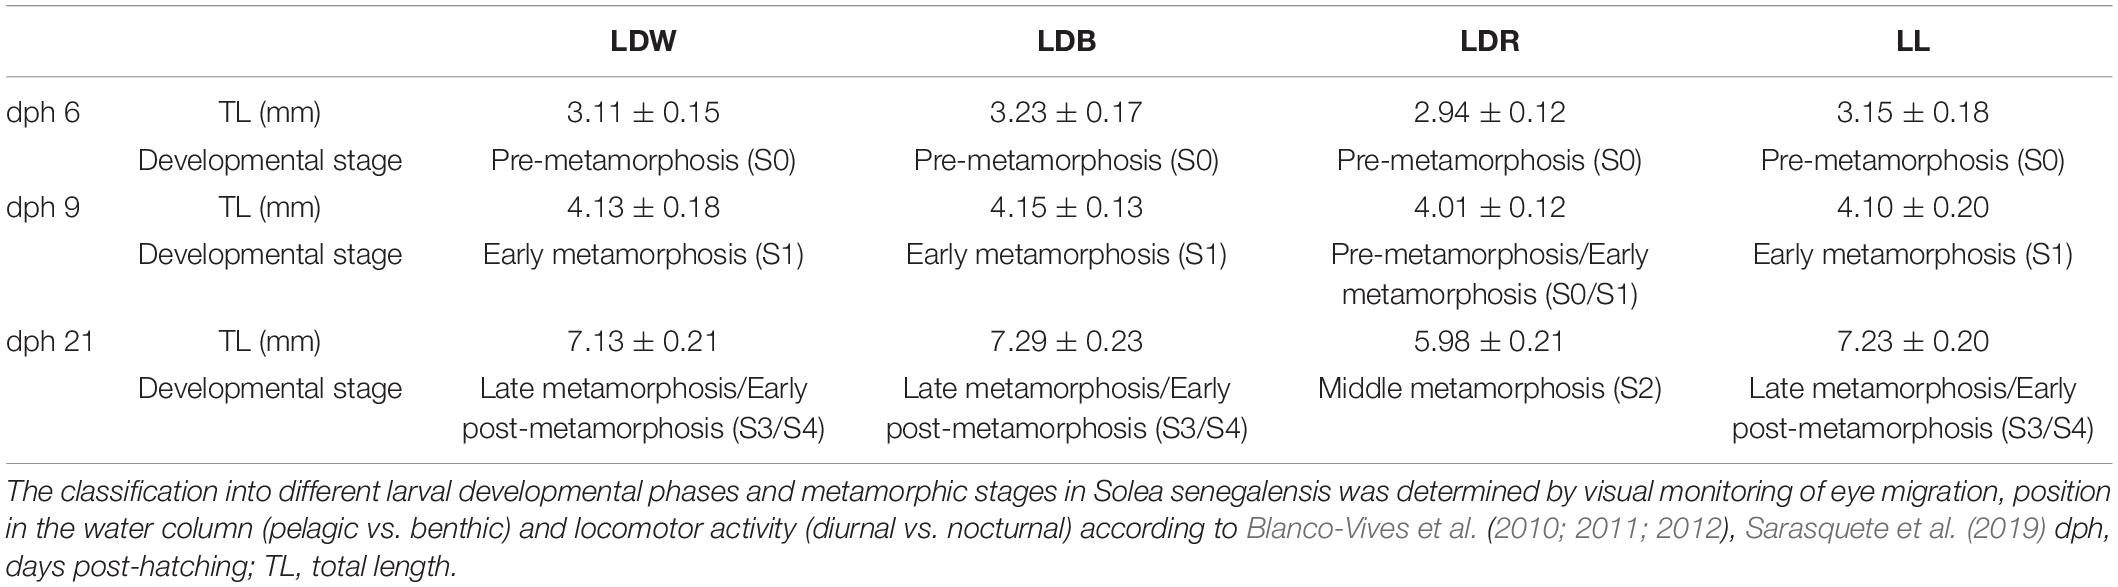
Table 1. Total length (TL) and main developmental stages of Senegalese sole under the different light regimes tested.
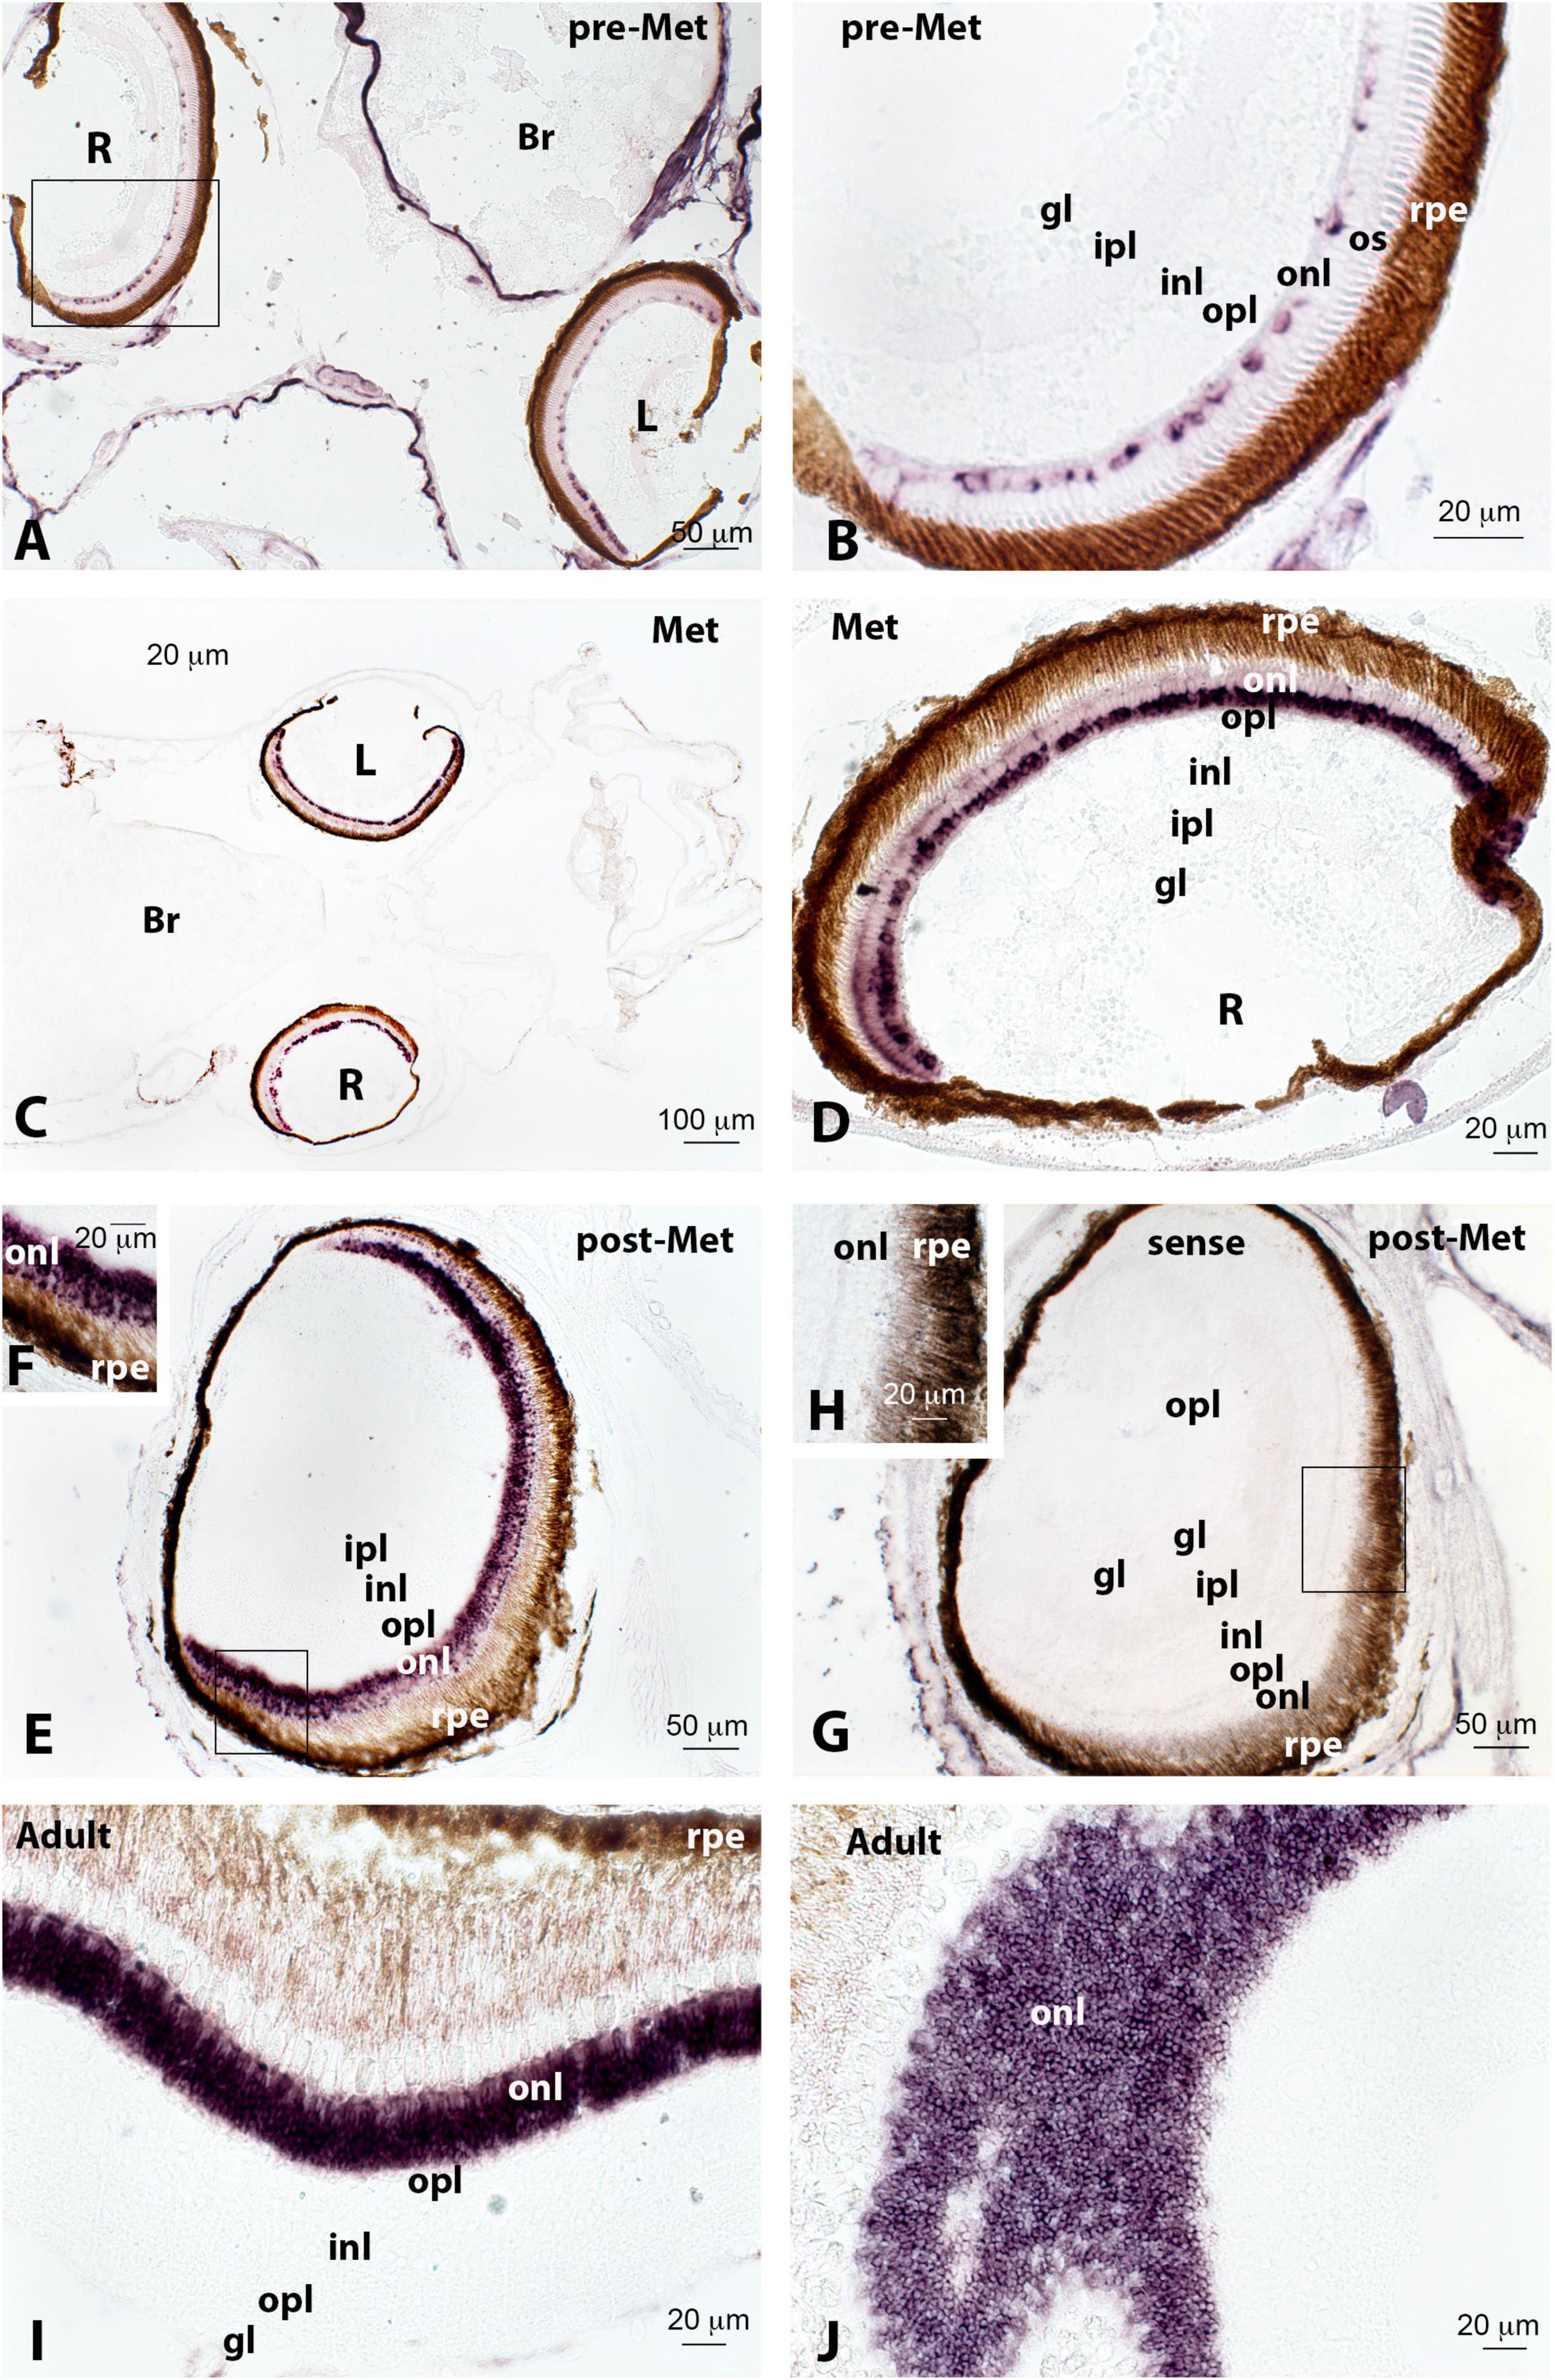
Figure 2. Localisation of rod opsin (rh1) expression in the retina of pre-metamorphic (pre-Met; A,B), metamorphic (Met; C,D), post-metamorphic (post-Met; E–H), and adult (I,J) Senegalese sole specimens revealed by in situ hybridisation. All the photomicrographs represent antisense sections, with the exception of panels (G,H), which show sense control sections. The photomicrograph represented in panel (J) shows a tangential section through the outer nuclear layer (onl), exhibiting abundant positive rh1-expressing cells. Squares in panels (A,E,G) mark the areas magnified in photomicrographs (B,F,H), respectively. Note how the expression of rh1 in rods of onl increases markedly in the post-metamorphic and adult retina compared to the previous stages. Other abbreviations: Br, brain; gl, glomerular layer; inl, internal nuclear layer; ipl, internal plexiform layer; L, left retina; opl, outer plexiform layer; os, outer segment of photoreceptors; R, right retina; rpe, retinal pigment epithelium. Scale bars represent 20 μm in panels (B,D,F,H,I,J); 50 μm in panels (A,E,G); and 100 μm in panel (C).
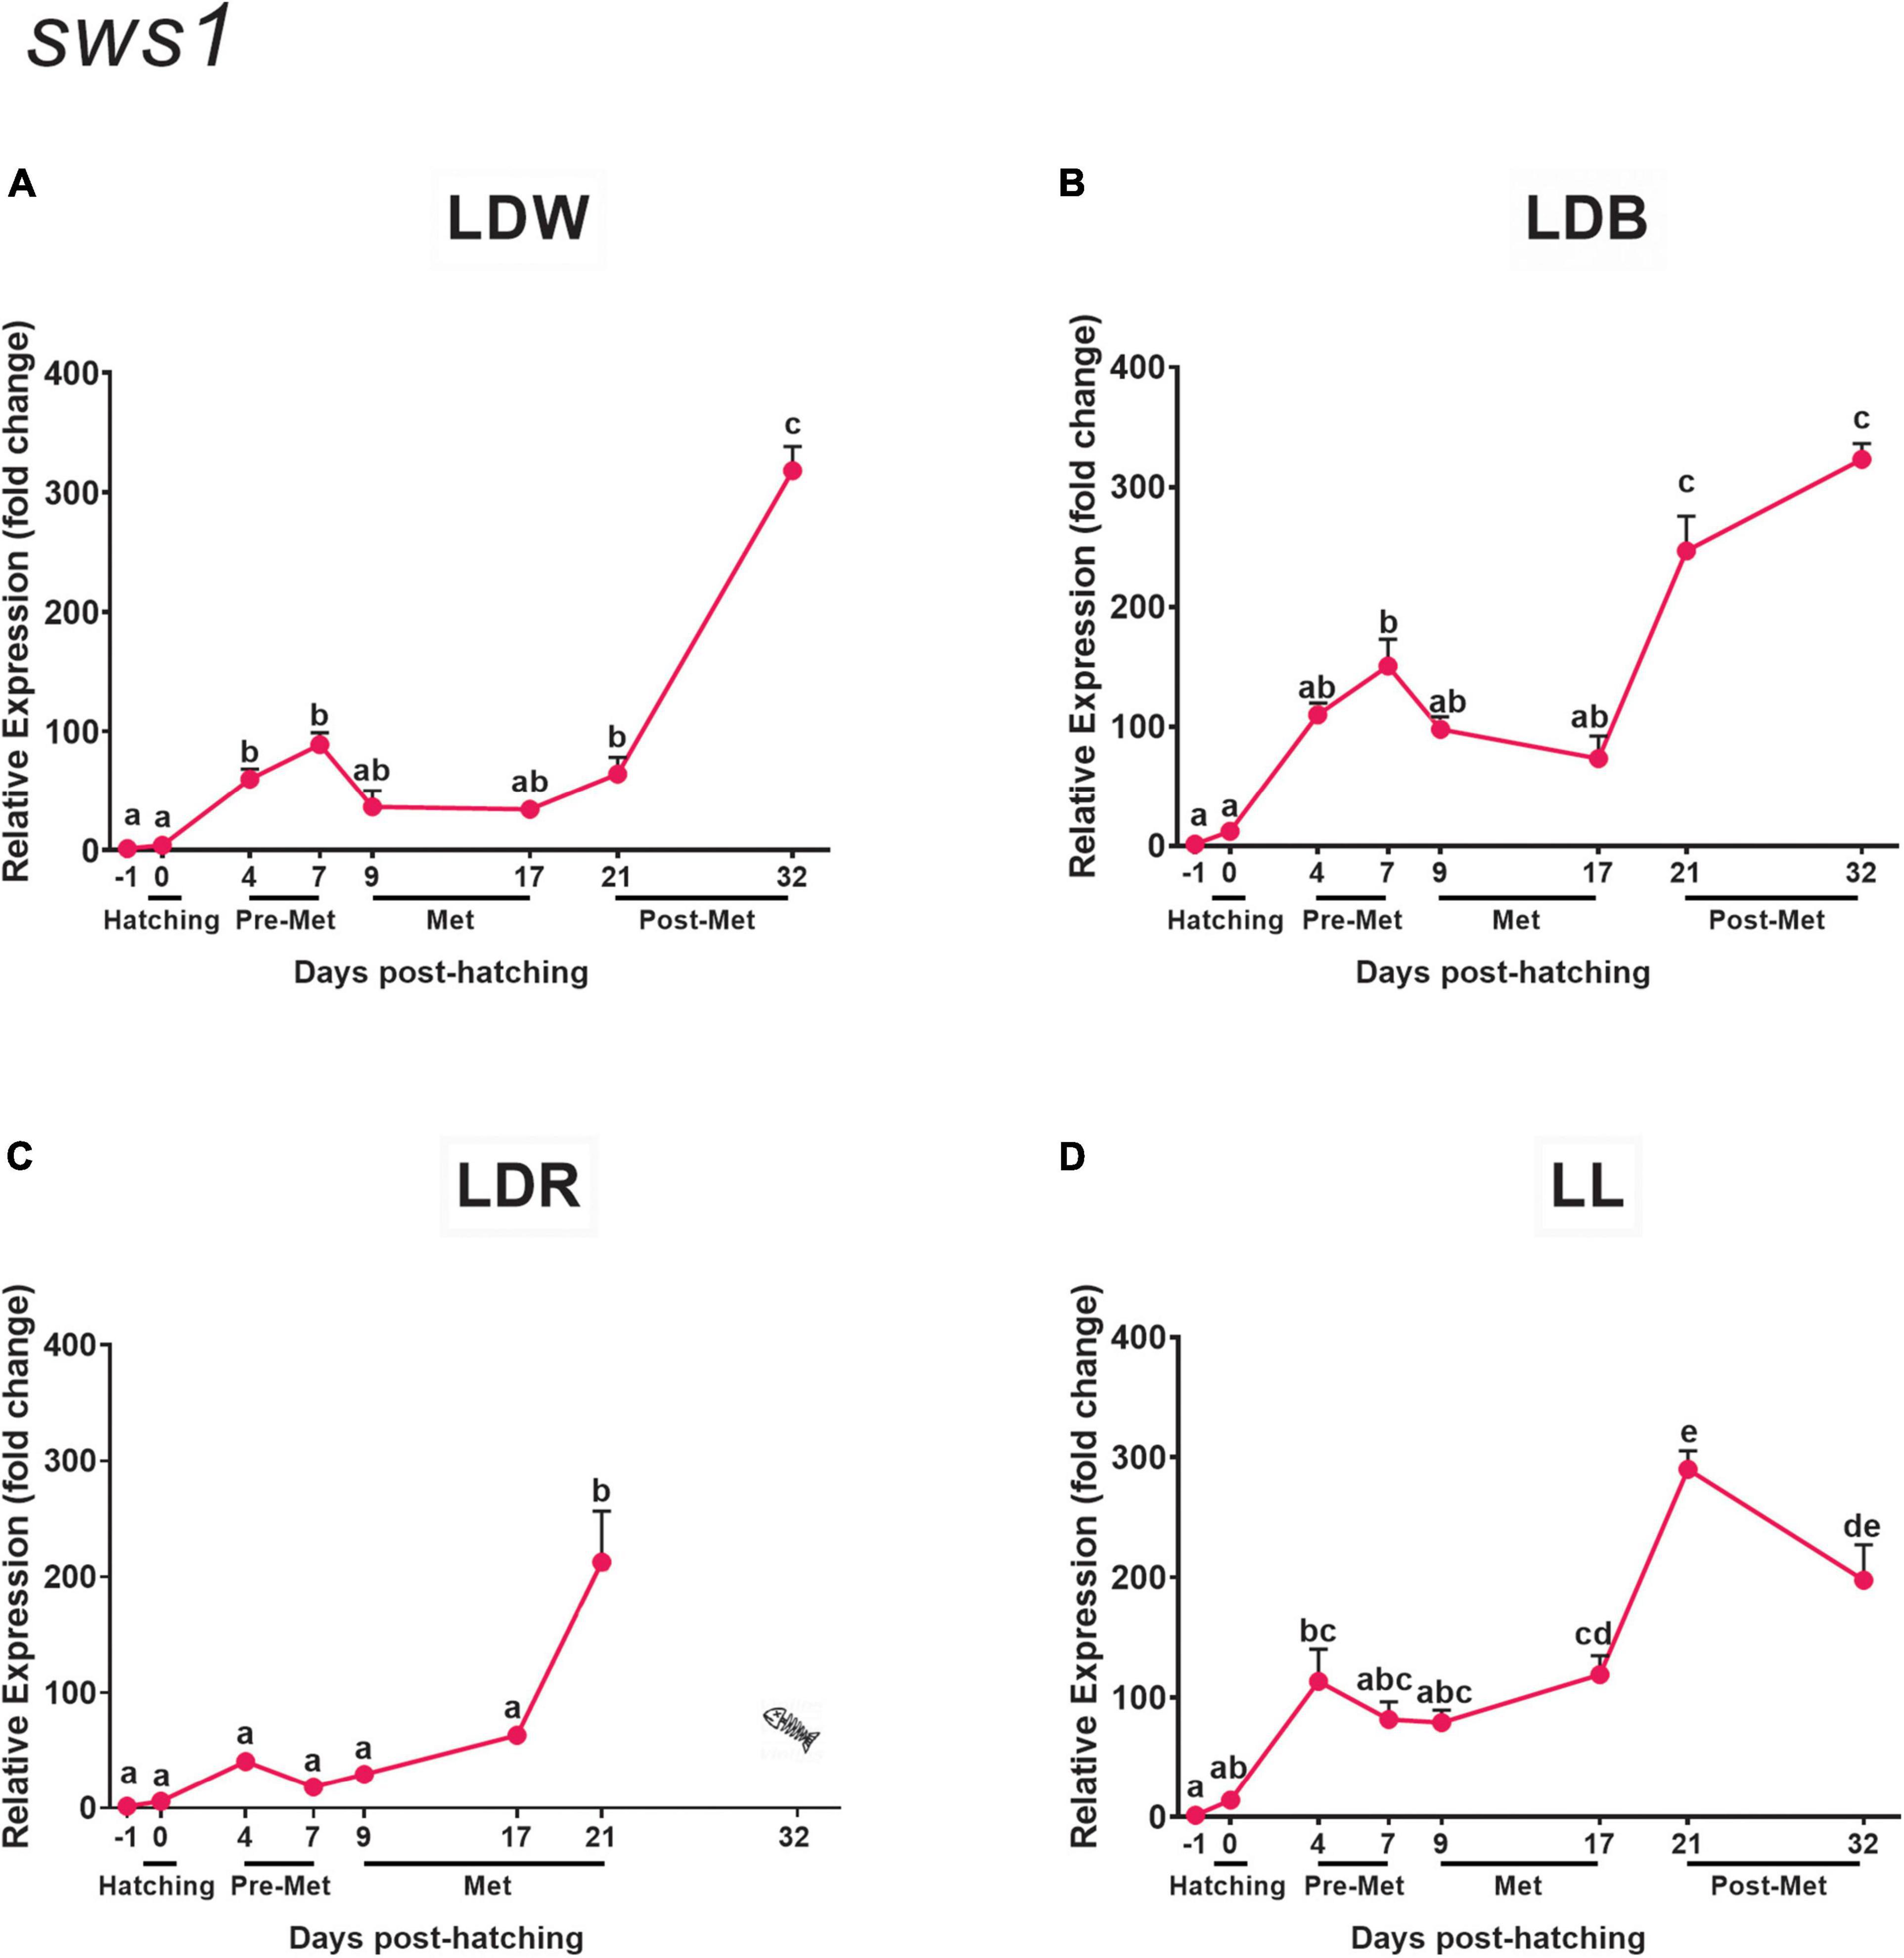
Figure 3. Expression of ultraviolet cone opsin (sws1) in embryos, larvae, and juveniles of the Senegalese sole on dph –1 (embryos), dph 0 (hatching), dph 4–7 (pre-metamorphosis, Pre-Met), dph 9–17 (metamorphosis, Met), and dph 21–32 (post-metamorphosis, Post-Met) analysed by RT-qPCR. For further information, see the legend in Figure 1.
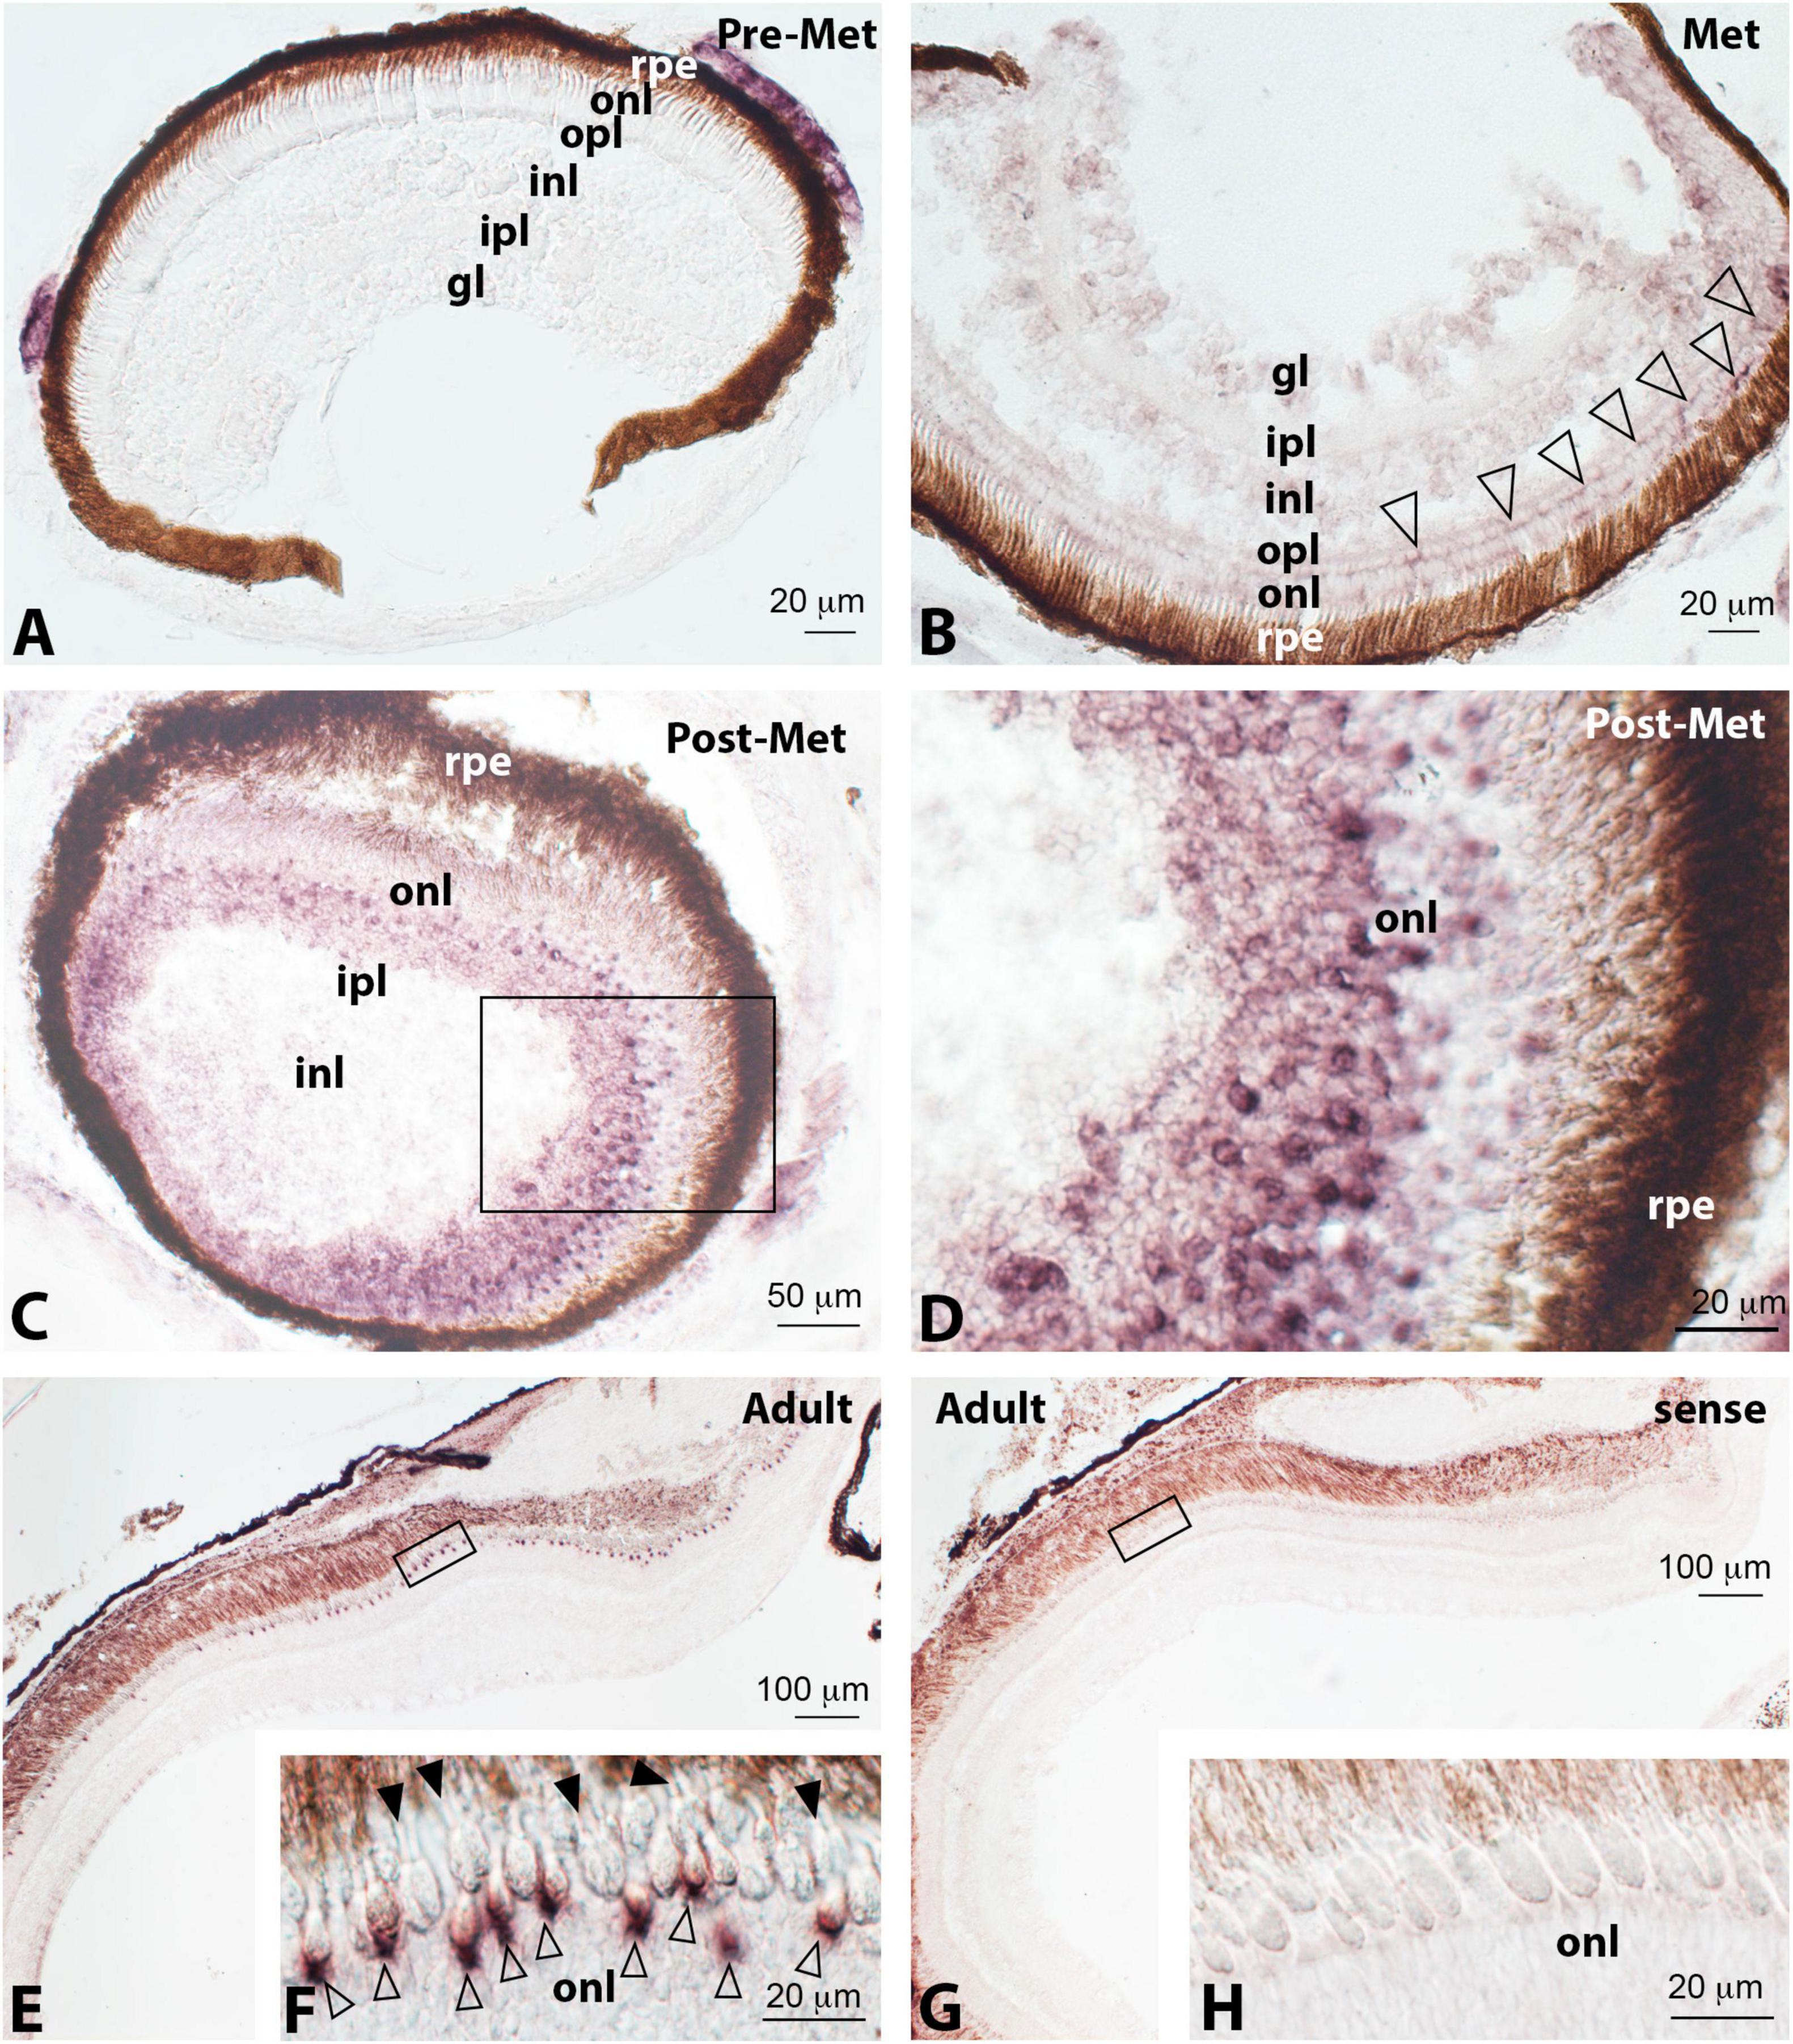
Figure 4. Localisation of ultraviolet cone opsin (sws1) expression in the retina of pre-metamorphic (Pre-Met; A), metamorphic (Met; B), post-metamorphic (Post-Met; C,D), and adult (E–H) Senegalese sole specimens revealed by in situ hybridisation. All the photomicrographs represent antisense sections, with the exception of panels (G) and (H), which show sense control sections. Squares in panels (C,E,G) mark the areas magnified in photomicrographs (D,F,H), respectively. Note the absence of positive cells in pre-metamorphic specimens (A), faint labelling of photoreceptors in metamorphic animals (white arrowheads in panel B), and how the number of labelled photoreceptors and intensity of this labelling increase in post-metamorphic (C,D), and adult (E,F) retina. In the adult retina, sws1 expression appears evident at the base of inner segments of single cones (white arrowheads in panel F). In contrast, double cones were devoid of labelling (F, black arrowheads). For abbreviations, see the legend in Figure 2. Scale bars represent 20 μm in panels (A,B,D,F,H); 50 μm in panel (C); and 100 μm in panels (E,G).
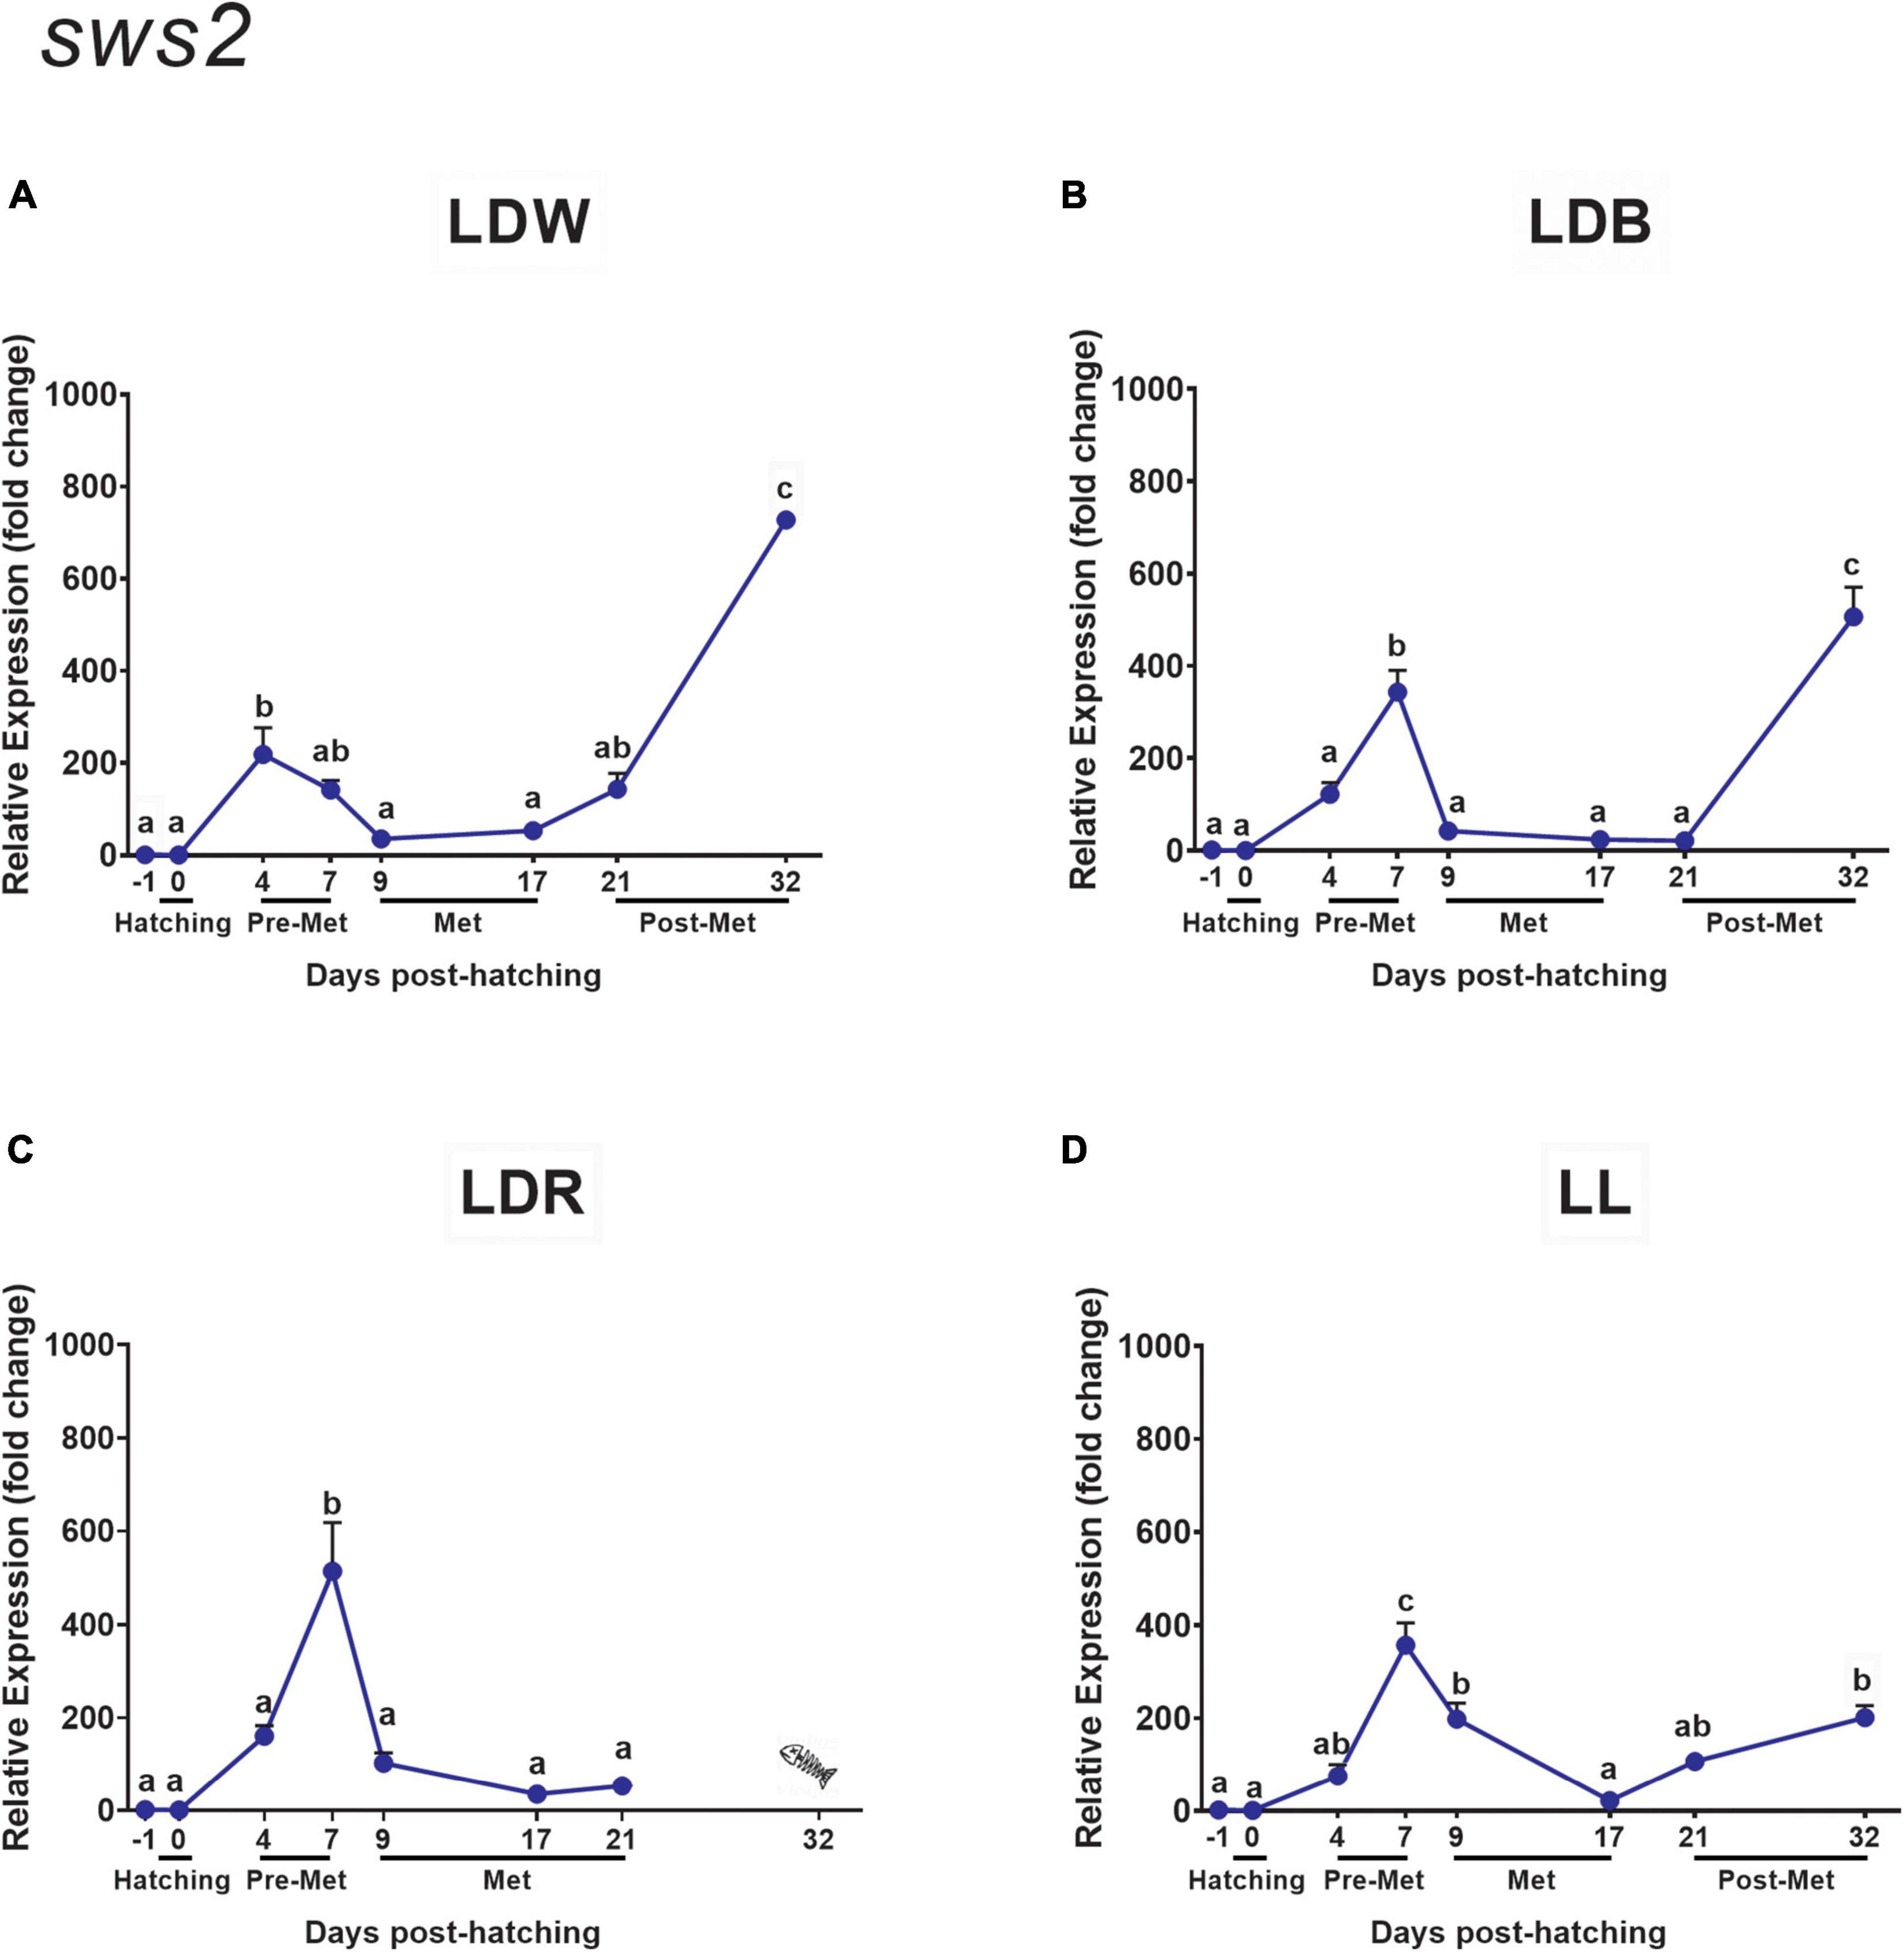
Figure 5. Expression of blue cone opsin (sws2) in embryos, larvae, and juveniles of the Senegalese sole on dph –1 (embryos), dph 0 (hatching), dph 4–7 (pre-metamorphosis, Pre-Met), dph 9–17 (metamorphosis, Met), and dph 21–32 (post-metamorphosis, Post-Met) analysed by RT-qPCR. For further information, see the legend in Figure 1.
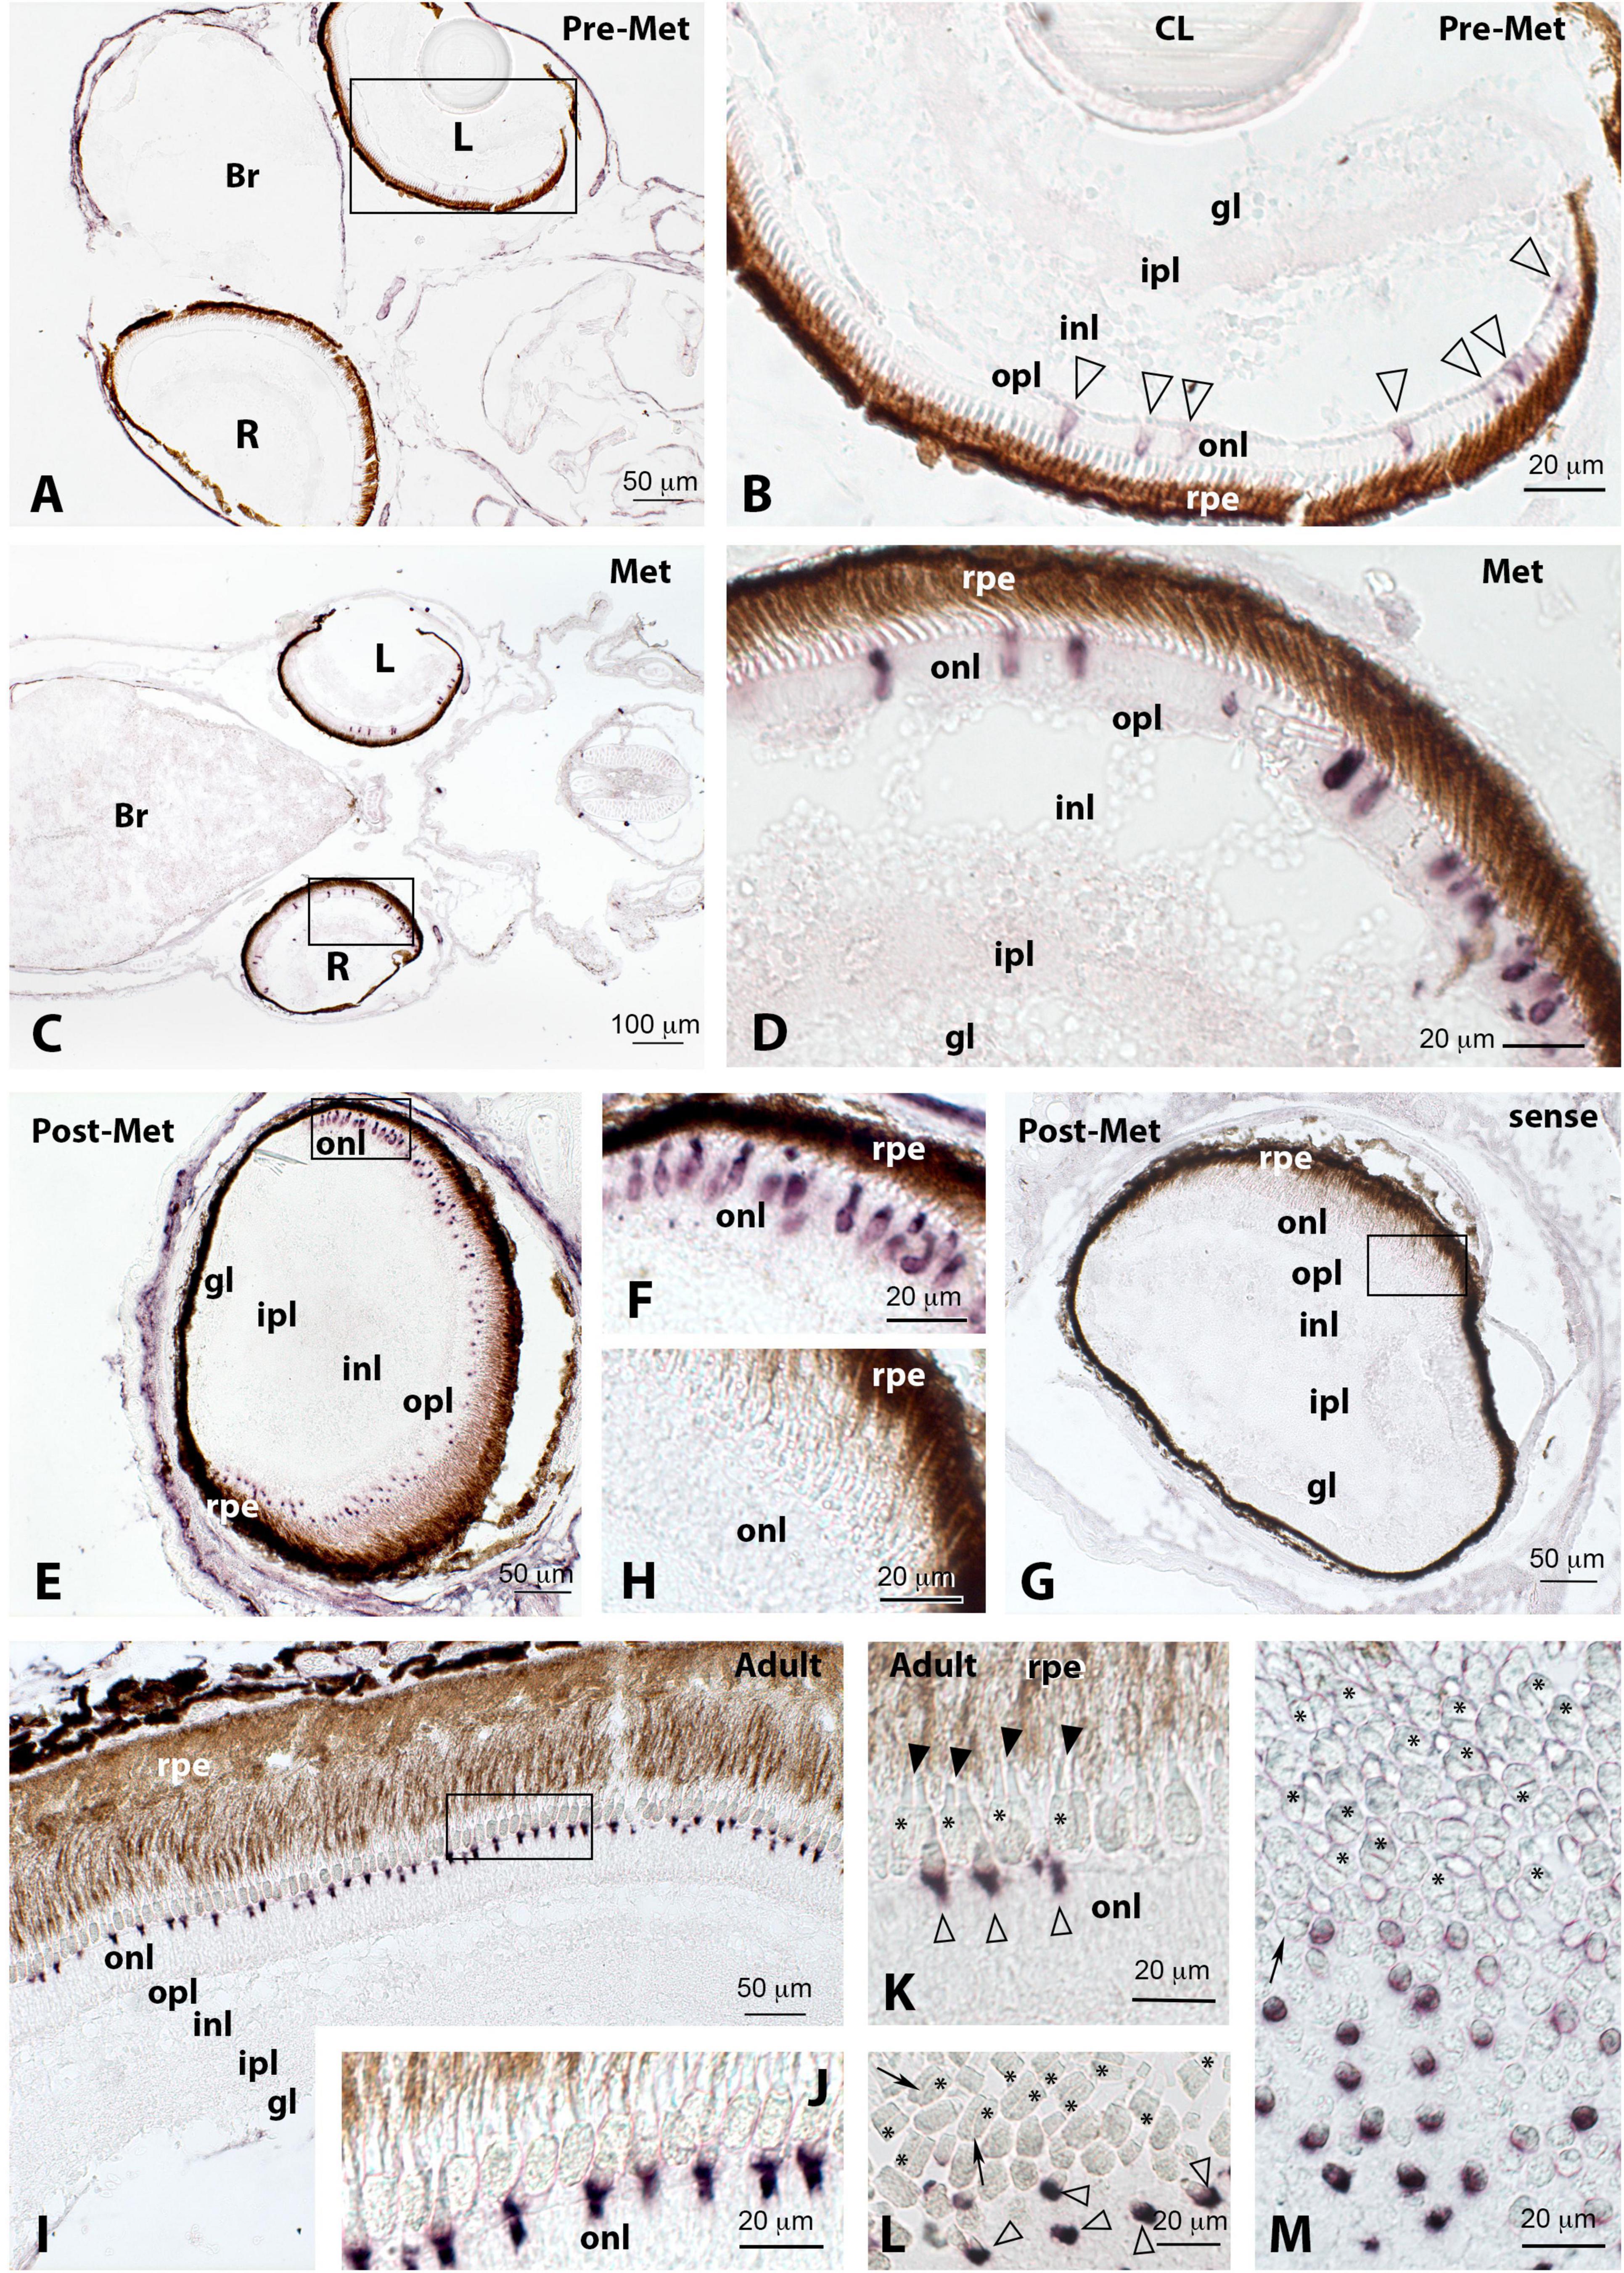
Figure 6. Localisation of blue cone opsin (sws2) expression in the retina of pre-metamorphic (Pre-Met; A,B), metamorphic (Met; C,D), post-metamorphic (Post-Met; E–H), and adult (I–M) Senegalese sole specimens revealed by in situ hybridisation. All the photomicrographs represent antisense sections, with the exception of panels (G) and (H), which show sense control sections. Squares in panels (A,C,E,G,I) mark the areas magnified in photomicrographs (B,D,F,H,J), respectively. Note the low number of positive cells and faint labelling of cones in pre-metamorphic specimens (B, white arrowheads), how the intensity of this labelling increases in metamorphic animals (C,D), and subsequent increase in the number of labelled cones in post-metamorphic (E,F) and adult (I,J) retinas. In the adult retina, sws2 expression appears evident at the base of inner segments of single cones (white arrowheads in panels K,L). In contrast, double cones (asterisks in panels K–M), which exhibit their characteristic double outer segments (black arrowheads in panel K), were devoid of labelling. Most of the unlabelled double cones exhibited straight partitions (L,M), although a few of them showed a bent partition (black arrows in panel L). Black arrow in panel (M) marks an unlabelled triple cone revealed in a radial section. (L,M) photomicrographs represent oblique and tangential sections, respectively, whereas the remaining pictures corresponded to radial sections. CL, crystalline lens. For other abbreviations, see the legend in Figure 2. Scale bars represent 20 μm in panels (B,D,F,H,J–M); 50 μm in panels (A,E,G,I); and 100 μm in panel (C).
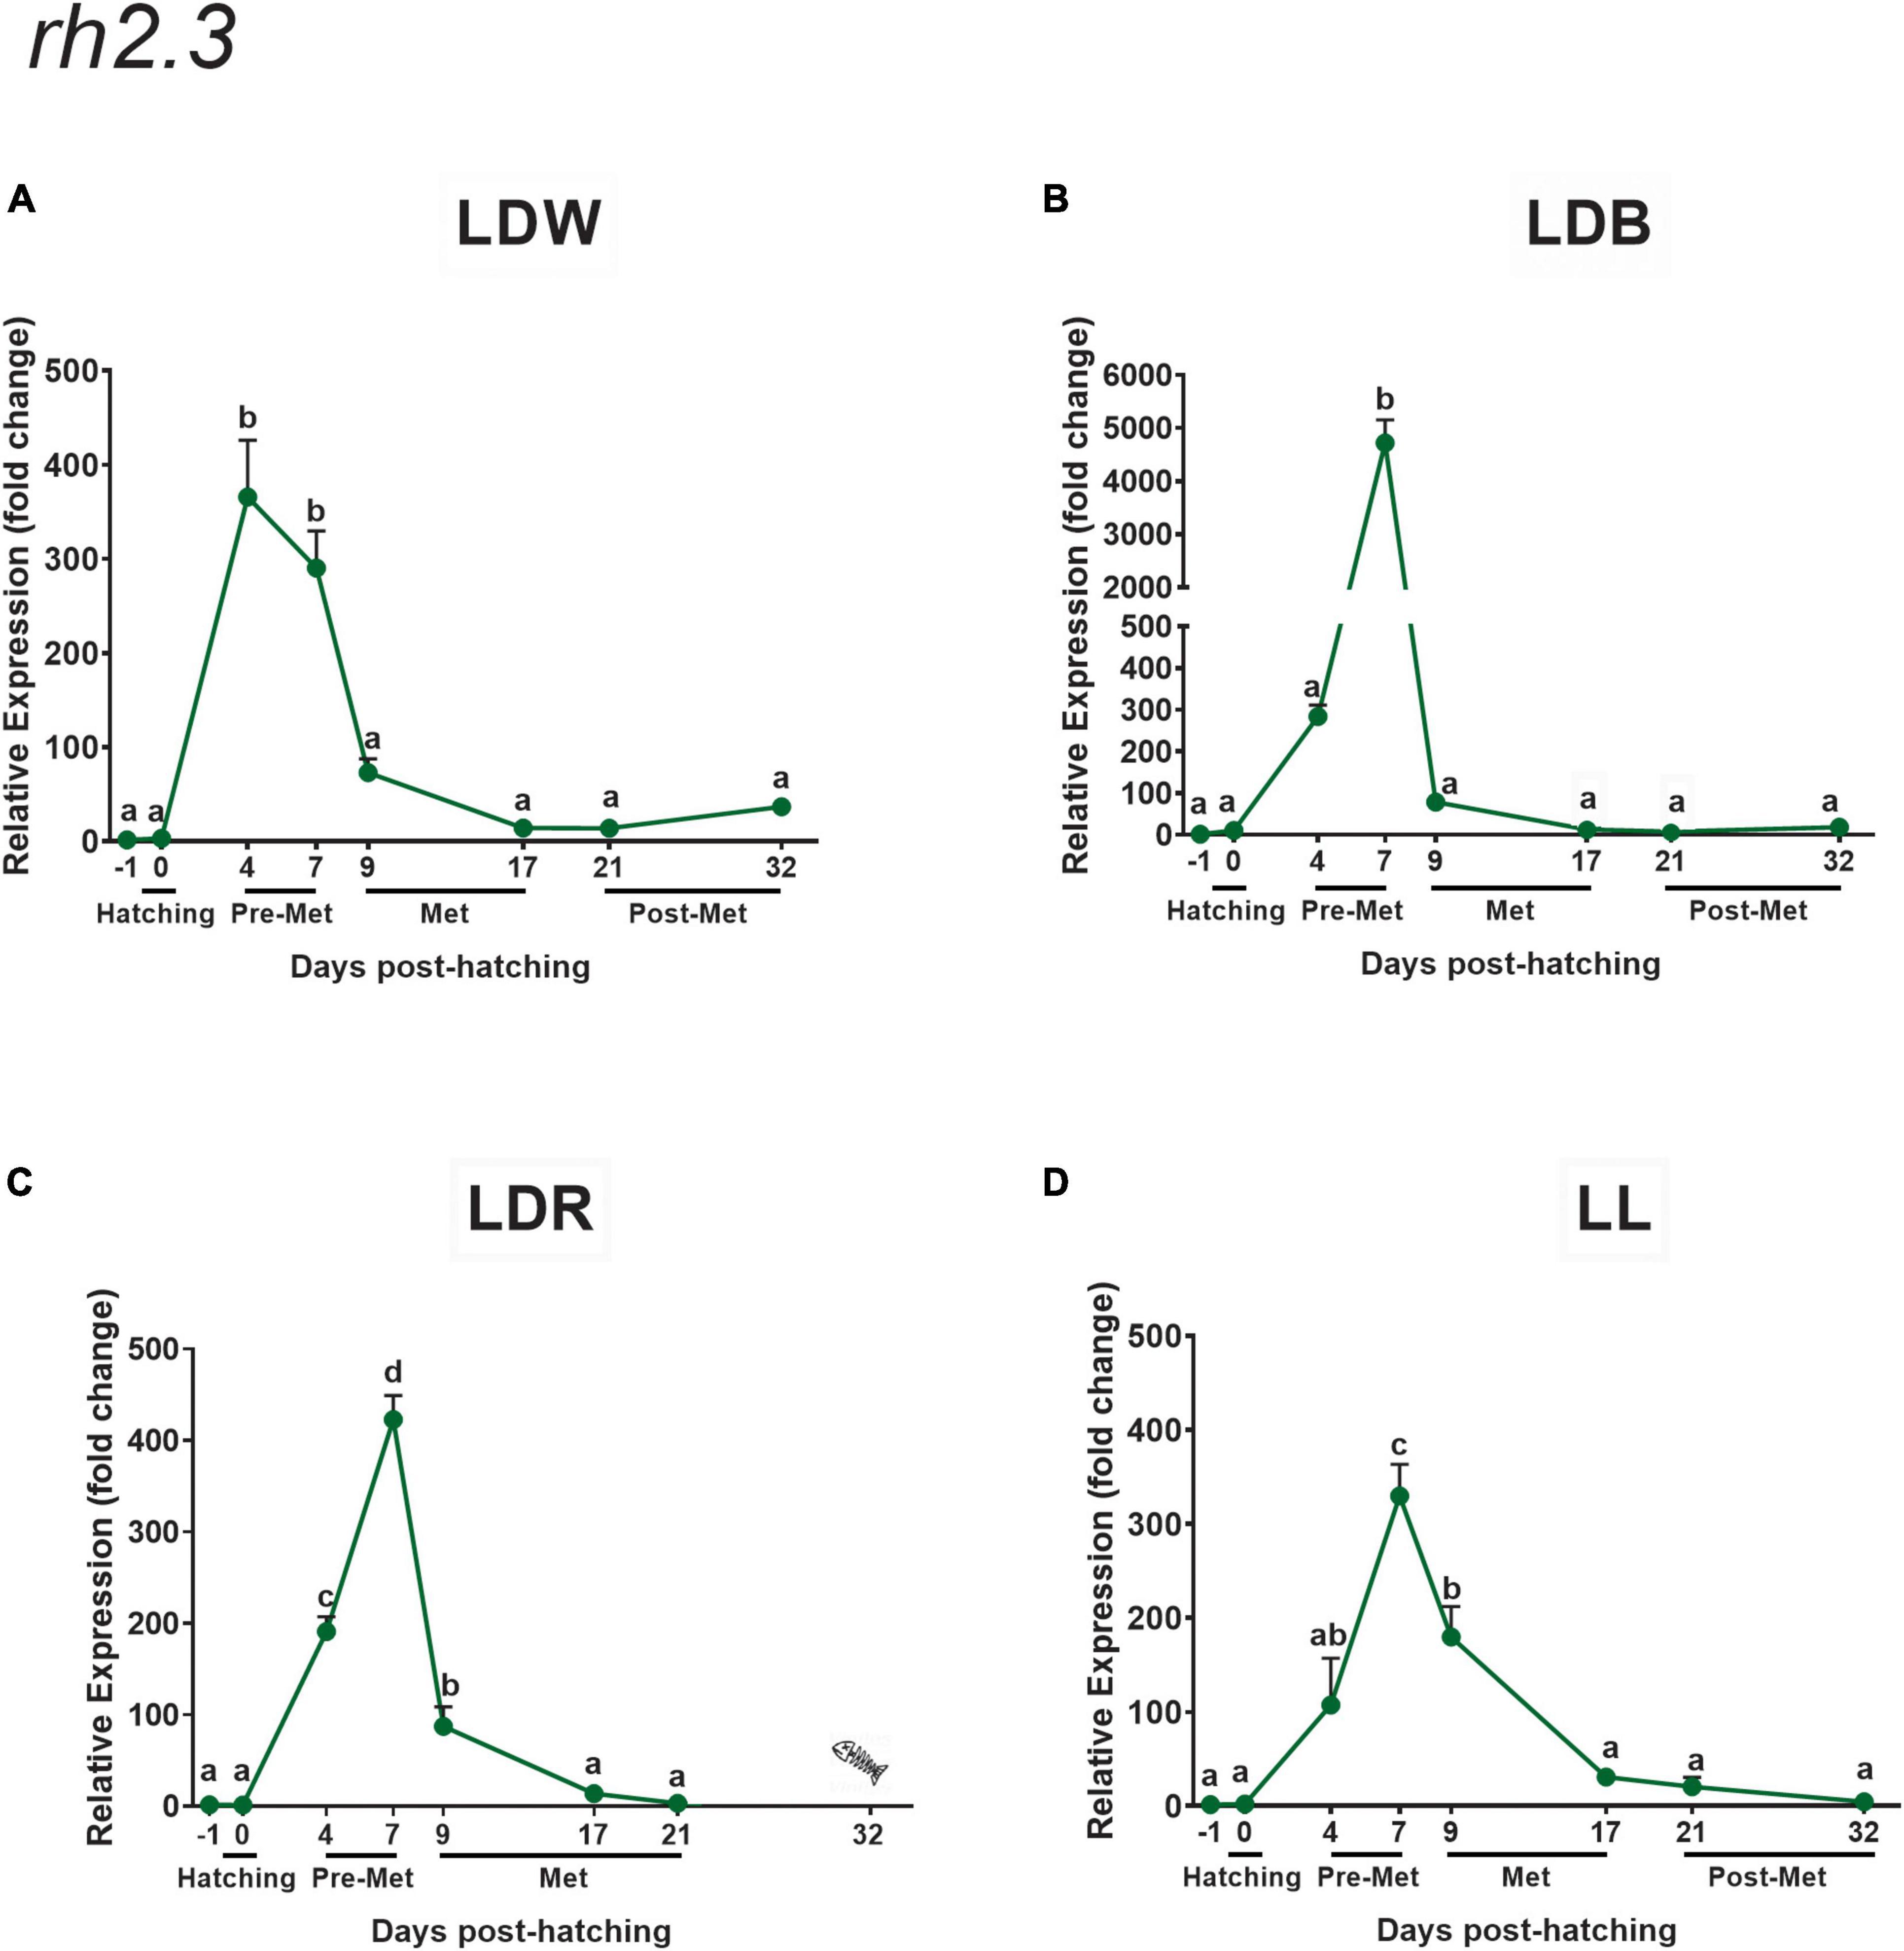
Figure 7. Expression of green cone opsin (rh2.3) in embryos, larvae, and juveniles of the Senegalese sole on dph –1 (embryos), dph 0 (hatching), dph 4–7 (pre-metamorphosis, Pre-Met), dph 9–17 (metamorphosis, Met), and dph 21–32 (post-metamorphosis, Post-Met) analysed by RT-qPCR. For further information, see the legend in Figure 1.
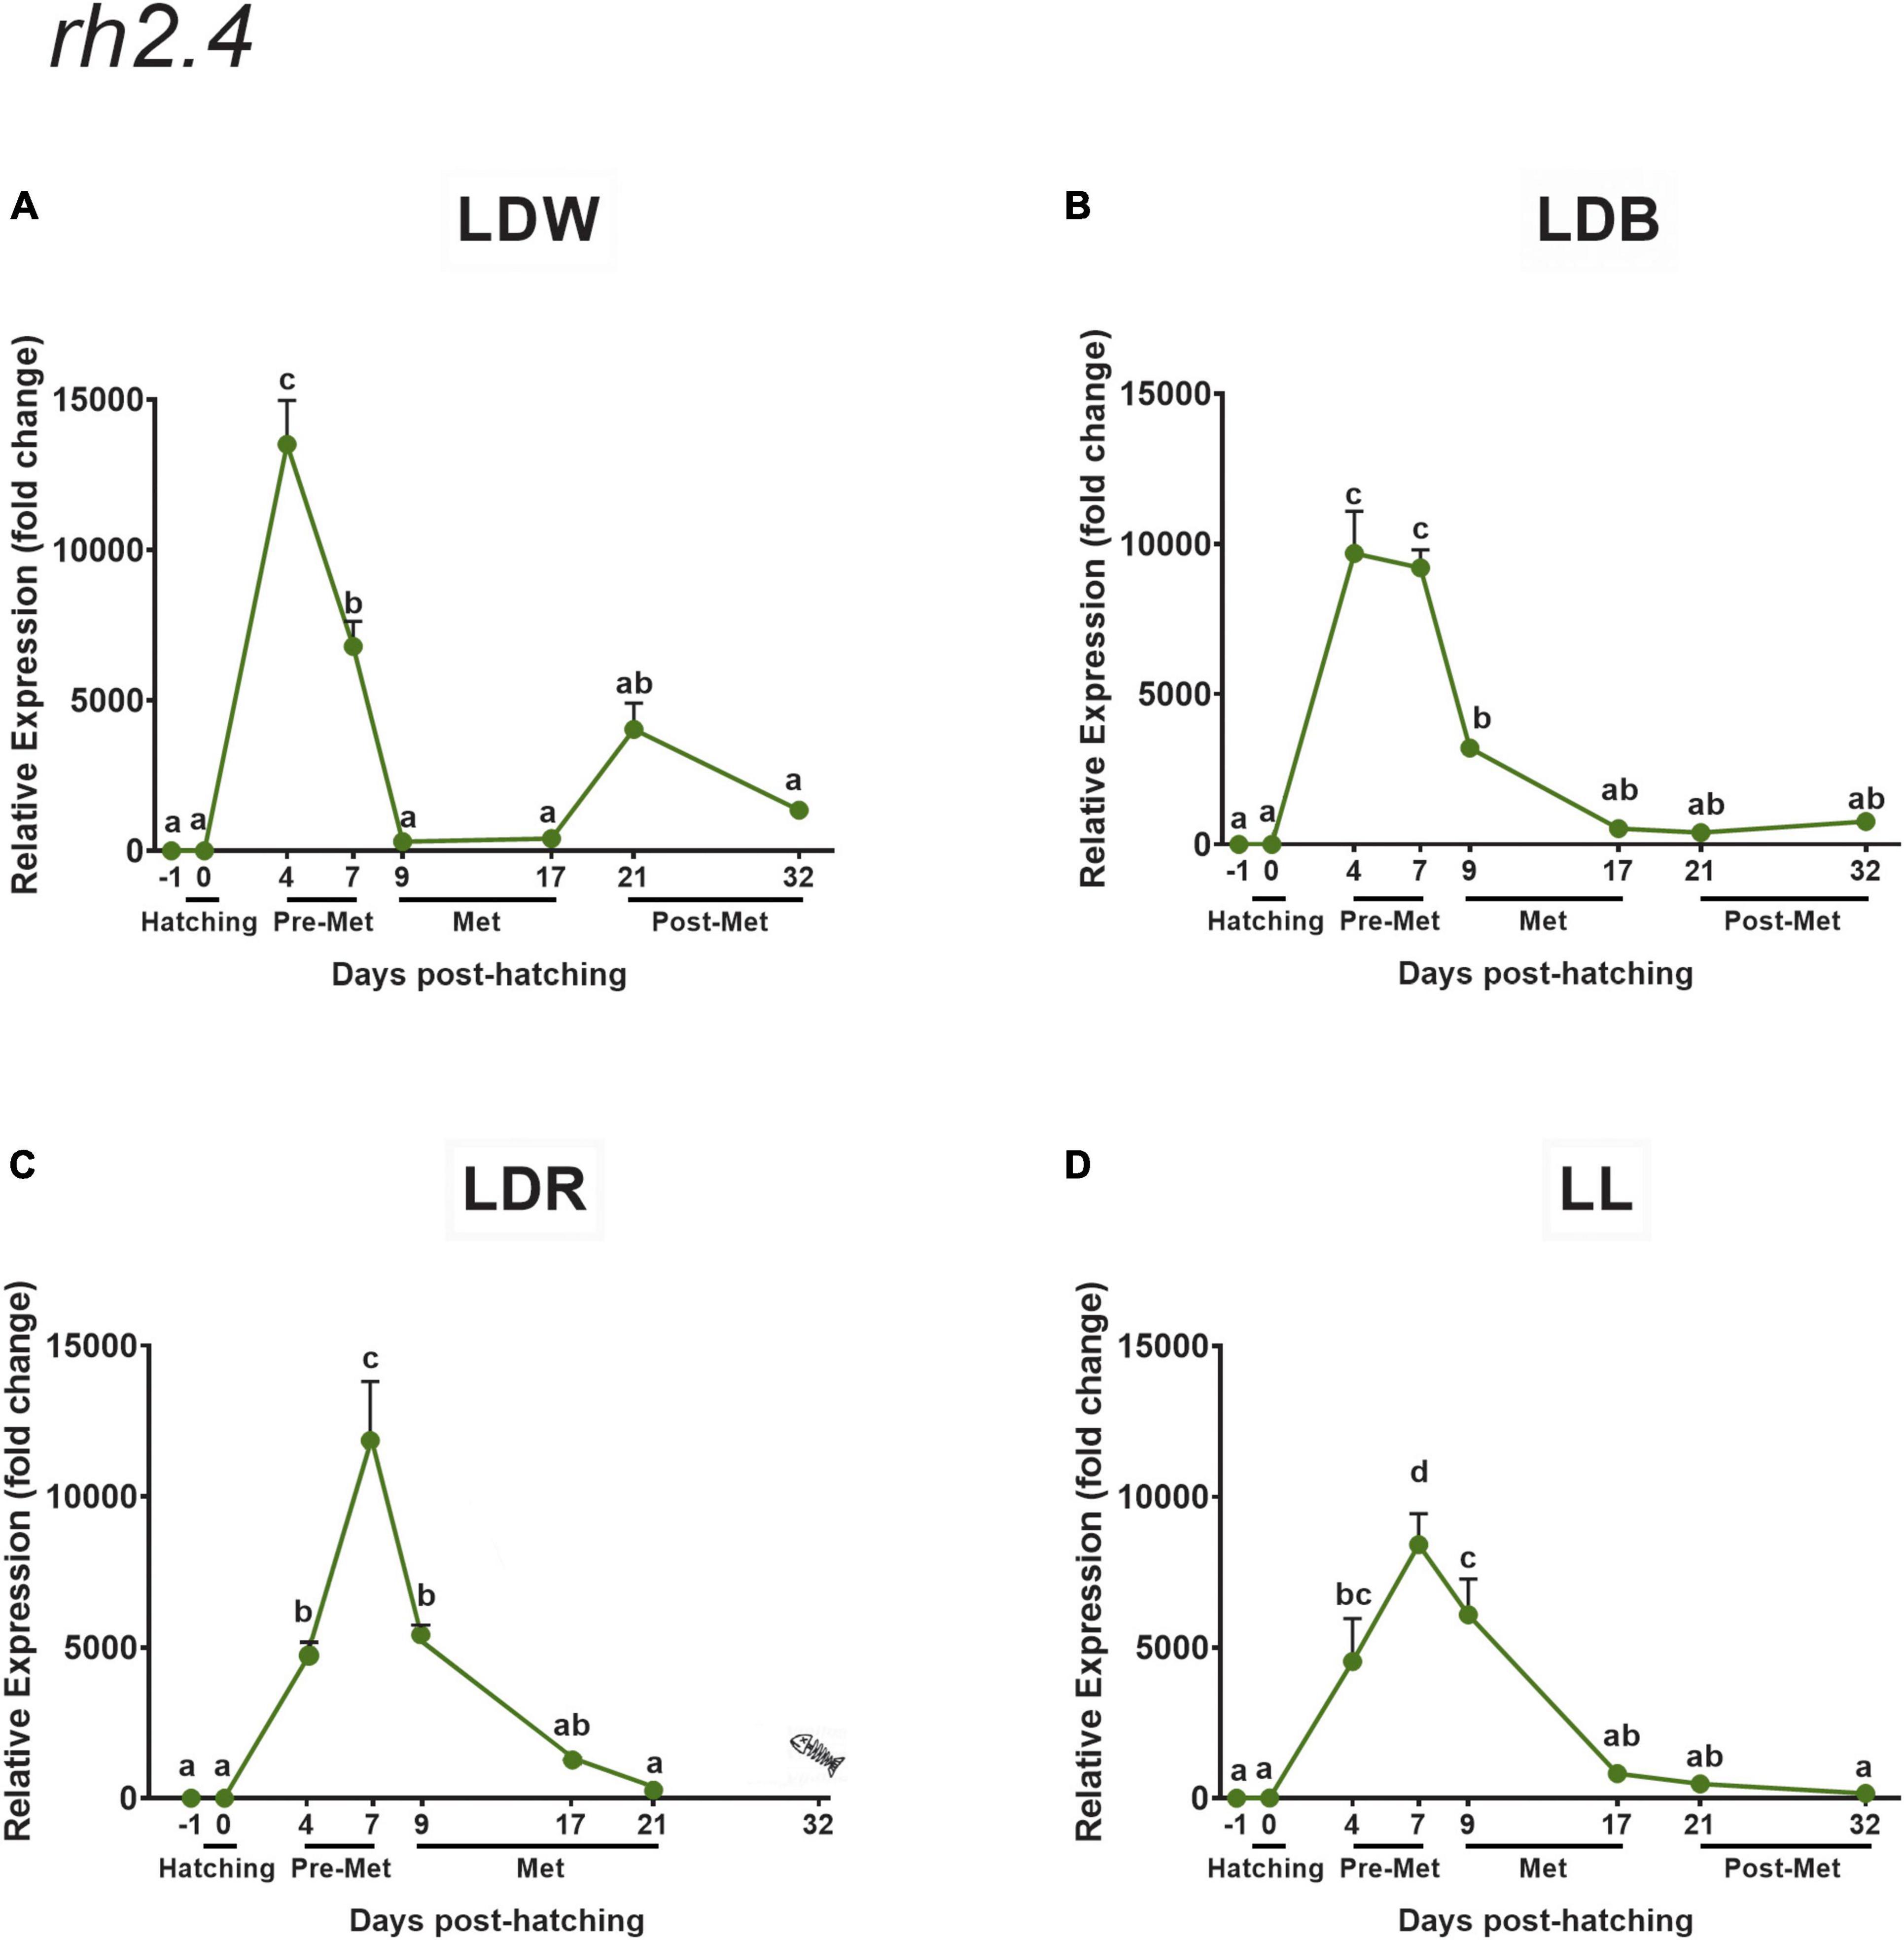
Figure 8. Expression of green cone opsin (rh2.4) in embryos, larvae, and juveniles of the Senegalese sole on dph –1 (embryos), dph 0 (hatching), dph 4–7 (pre-metamorphosis, Pre-Met), dph 9–17 (metamorphosis, Met), and dph 21–32 (post-metamorphosis, Post-Met) analysed by RT-qPCR. For further information, see the legend in Figure 1.
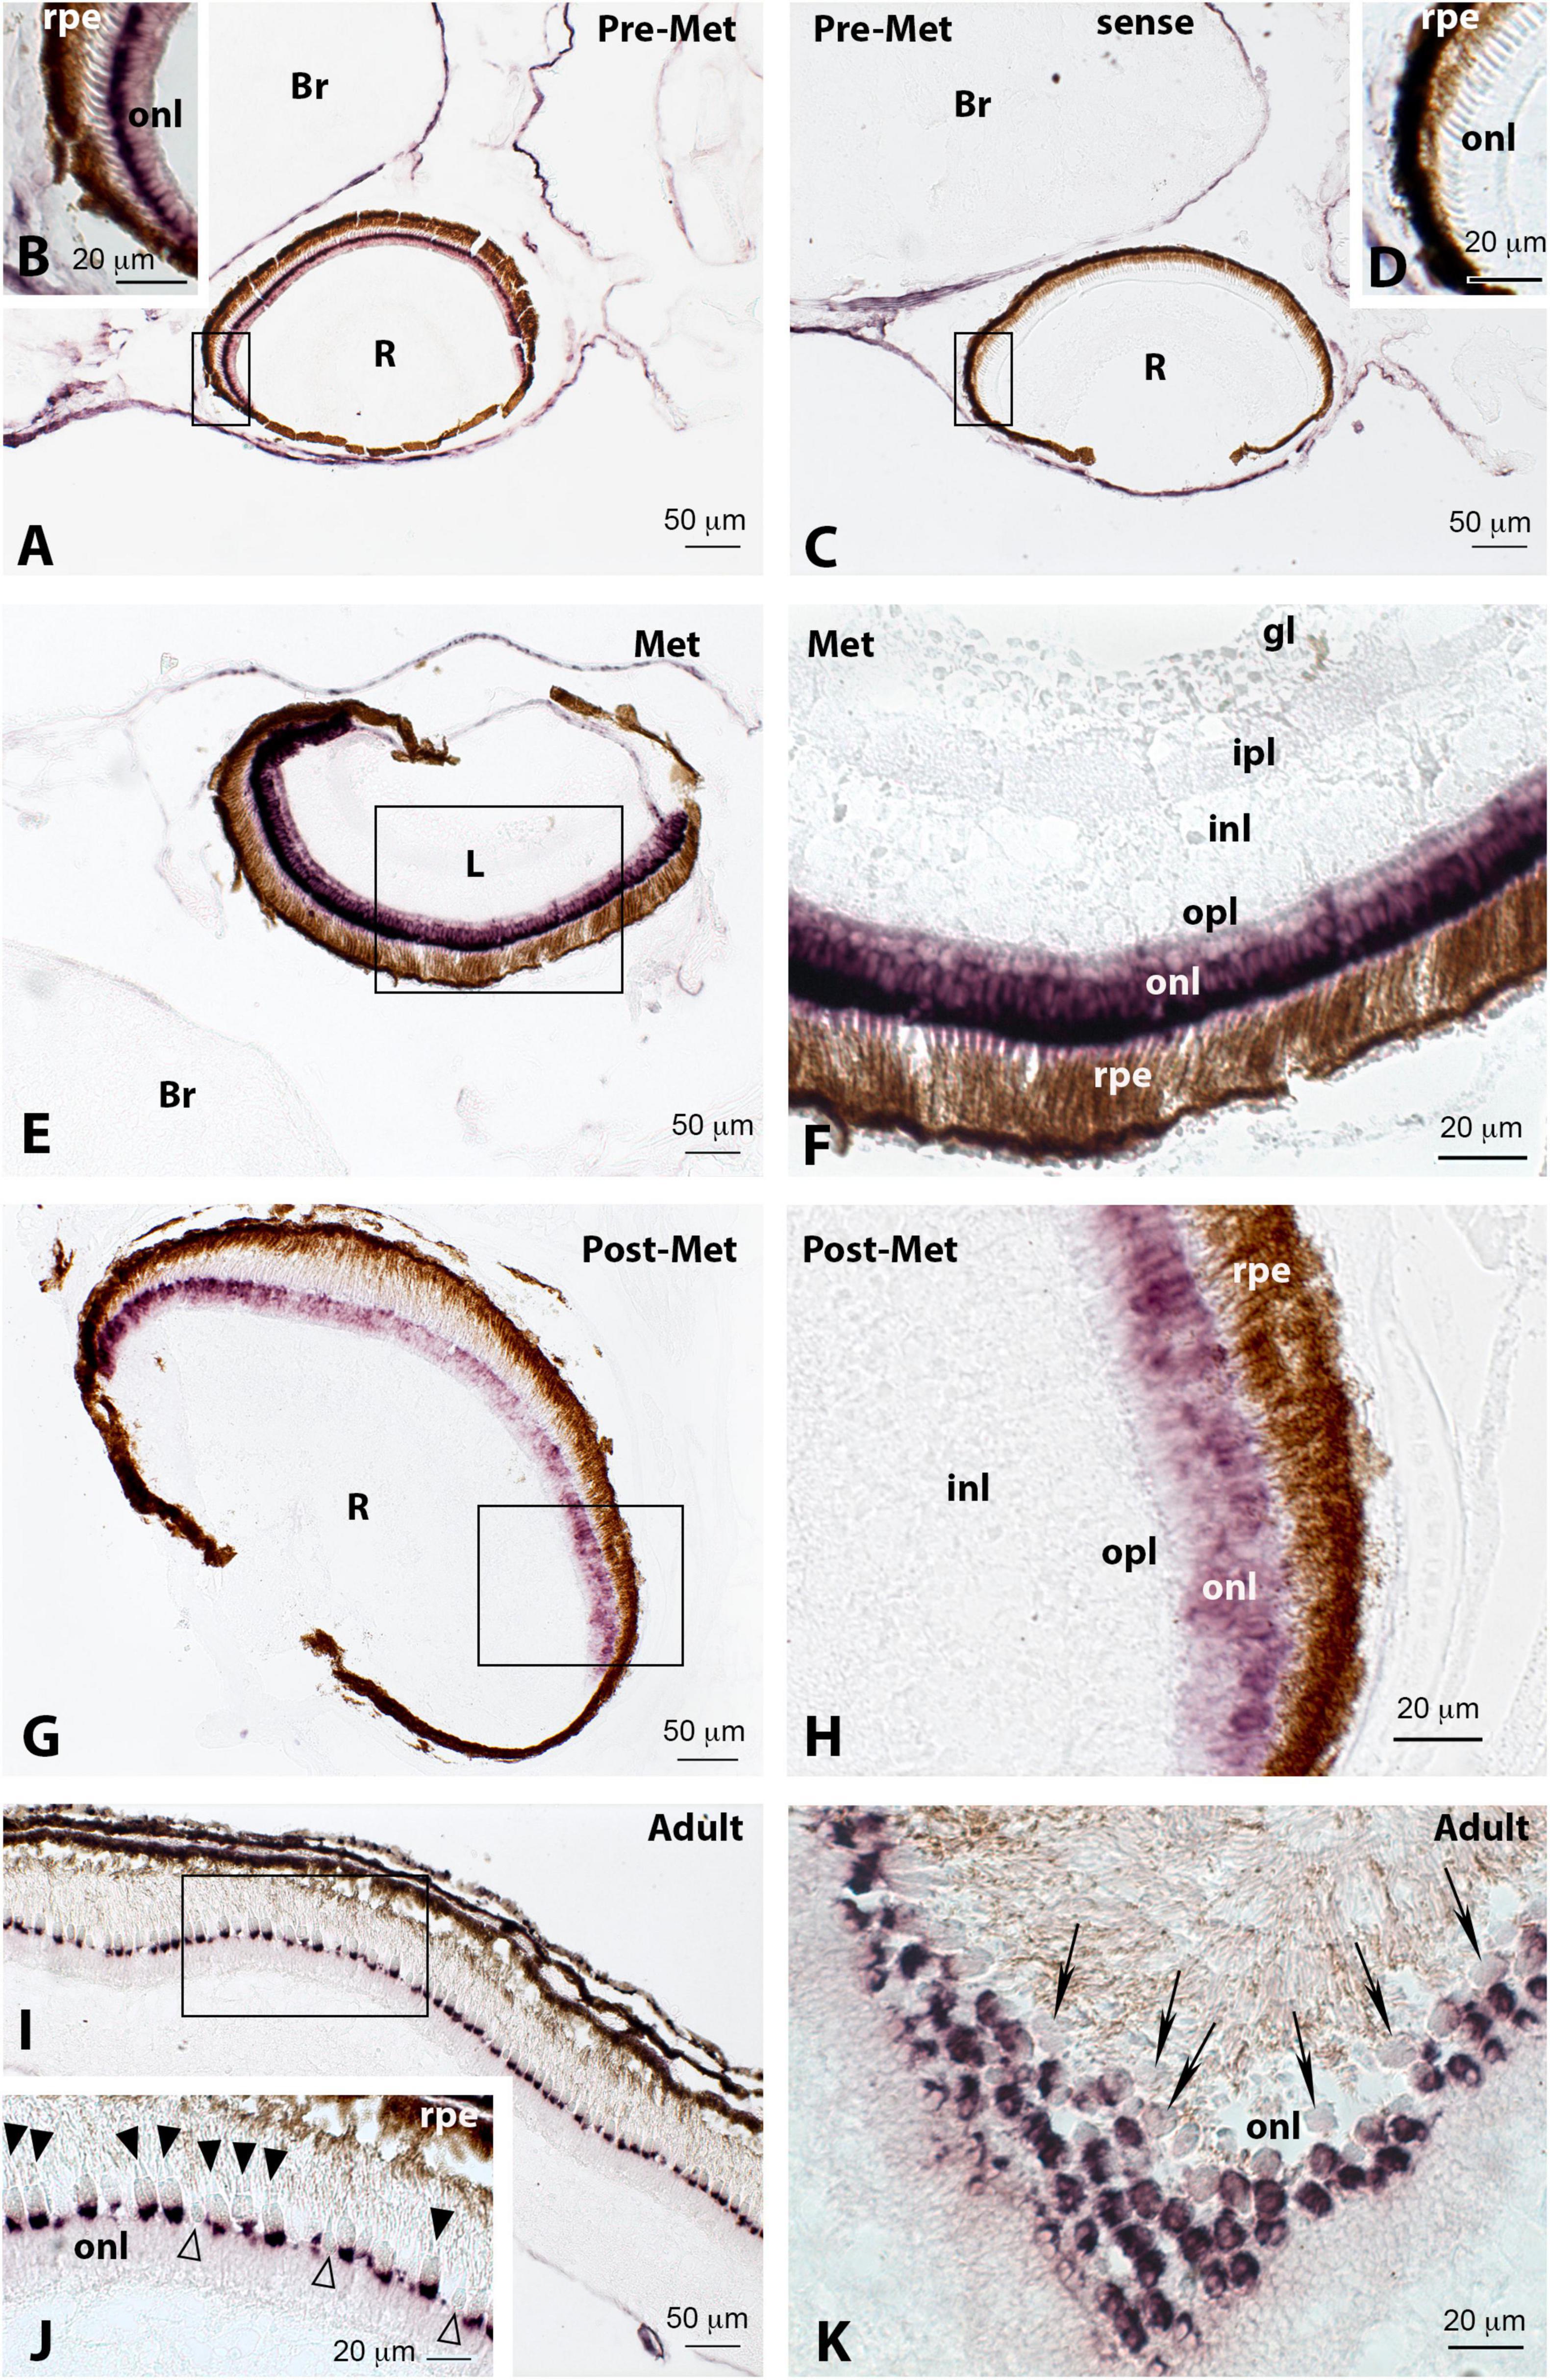
Figure 9. Localisation of green cone opsin (rh2.4) expression in the retina of pre-metamorphic (Pre-Met; A–D), metamorphic (Met; E,F), post-metamorphic (Post-Met; G,H), and adult (I–K) Senegalese sole specimens revealed by in situ hybridisation. All the photomicrographs represent antisense sections, with the exception of panels (C,D), which show sense control sections. Squares in panels (A,C,E,G,I) mark the areas magnified in photomicrographs (B,D,F,H,J), respectively. Note the intense labelling in the retina of pre-metamorphic (A) and metamorphic (E,F) animals, compared to post-metamorphic (G,H) and adult (I–K) specimens. In the adult retina, rh2.4 expression appears evident in the basal region of the inner segments of double cones (J, black arrowheads), with the single cones being devoid of labelling (J, white arrowheads). Some double cones appear unlabelled, as seen in photomicrograph (K) (black arrows). For abbreviations, see the legend in Figure 2. Scale bars represent 20 μm in panels (B,D,F,H,J,K); and 50 μm in panels (A,C,E,G,I).
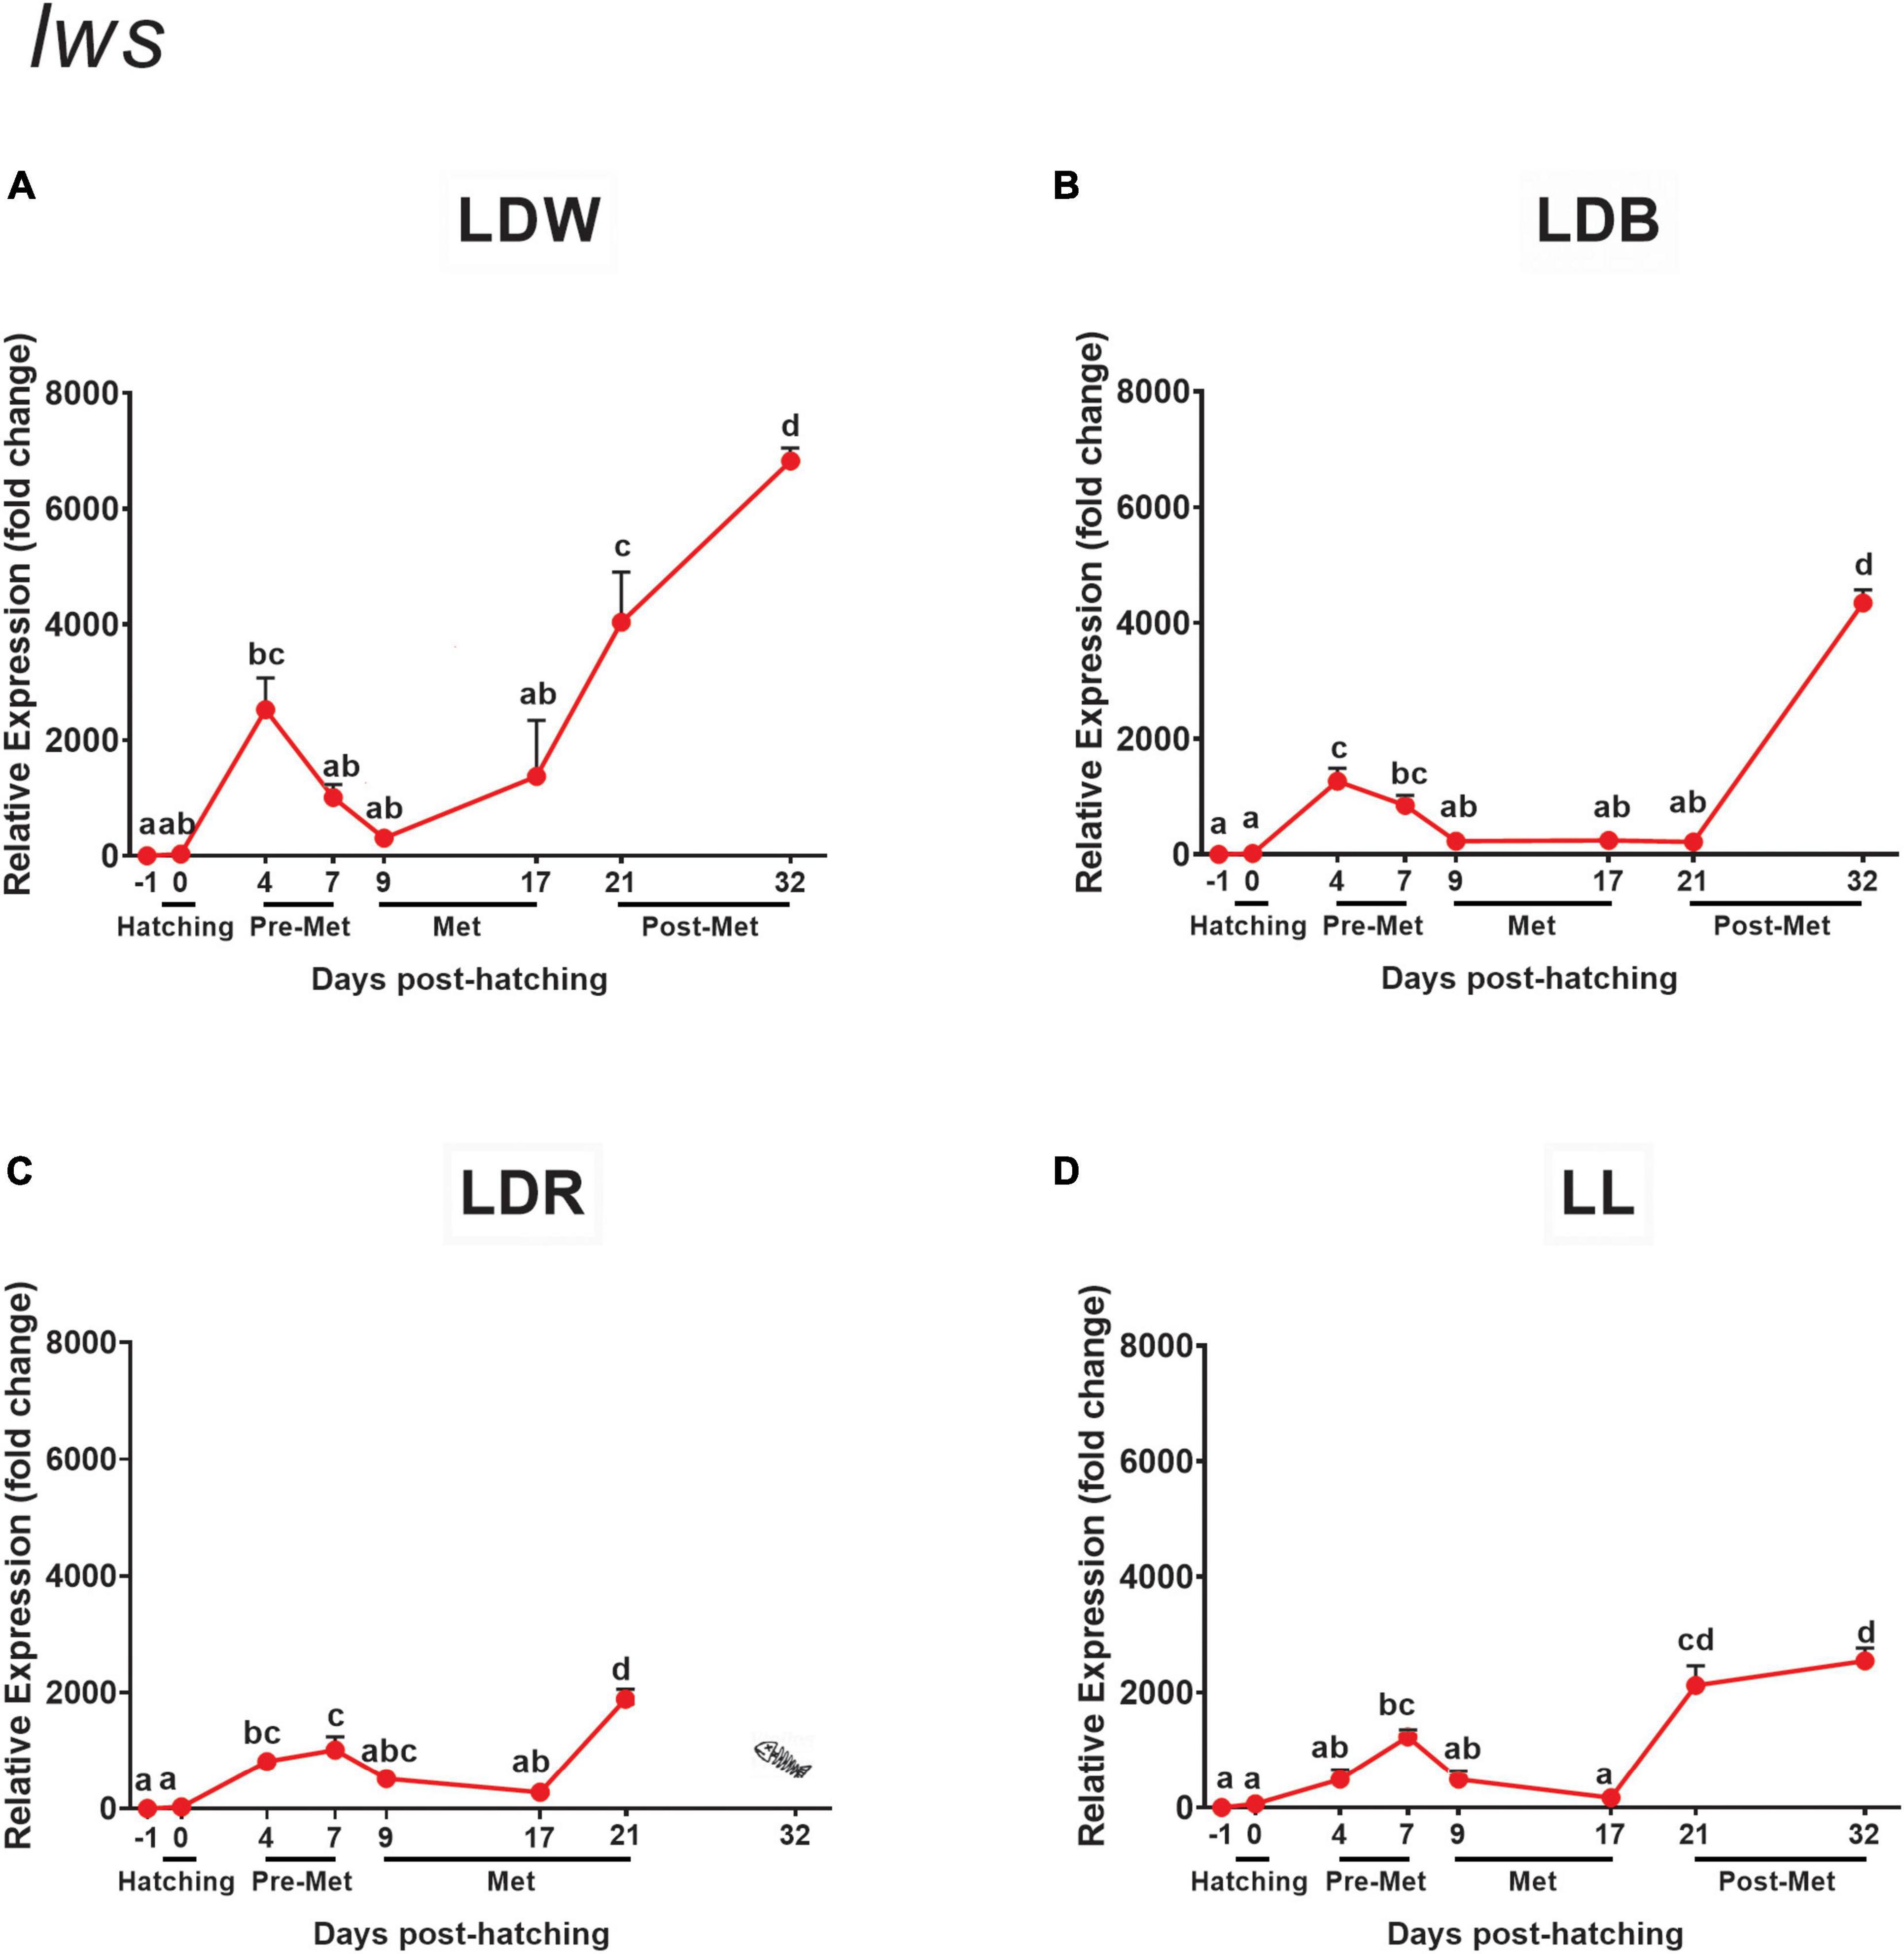
Figure 10. Expression of red cone opsin (lws) in embryos, larvae, and juveniles of the Senegalese sole on dph –1 (embryos), dph 0 (hatching), dph 4–7 (pre-metamorphosis, Pre-Met), dph 9–17 (metamorphosis, Met), and dph 21–32 (post-metamorphosis, Post-Met) analysed by RT-qPCR. For further information, see the legend in Figure 1.
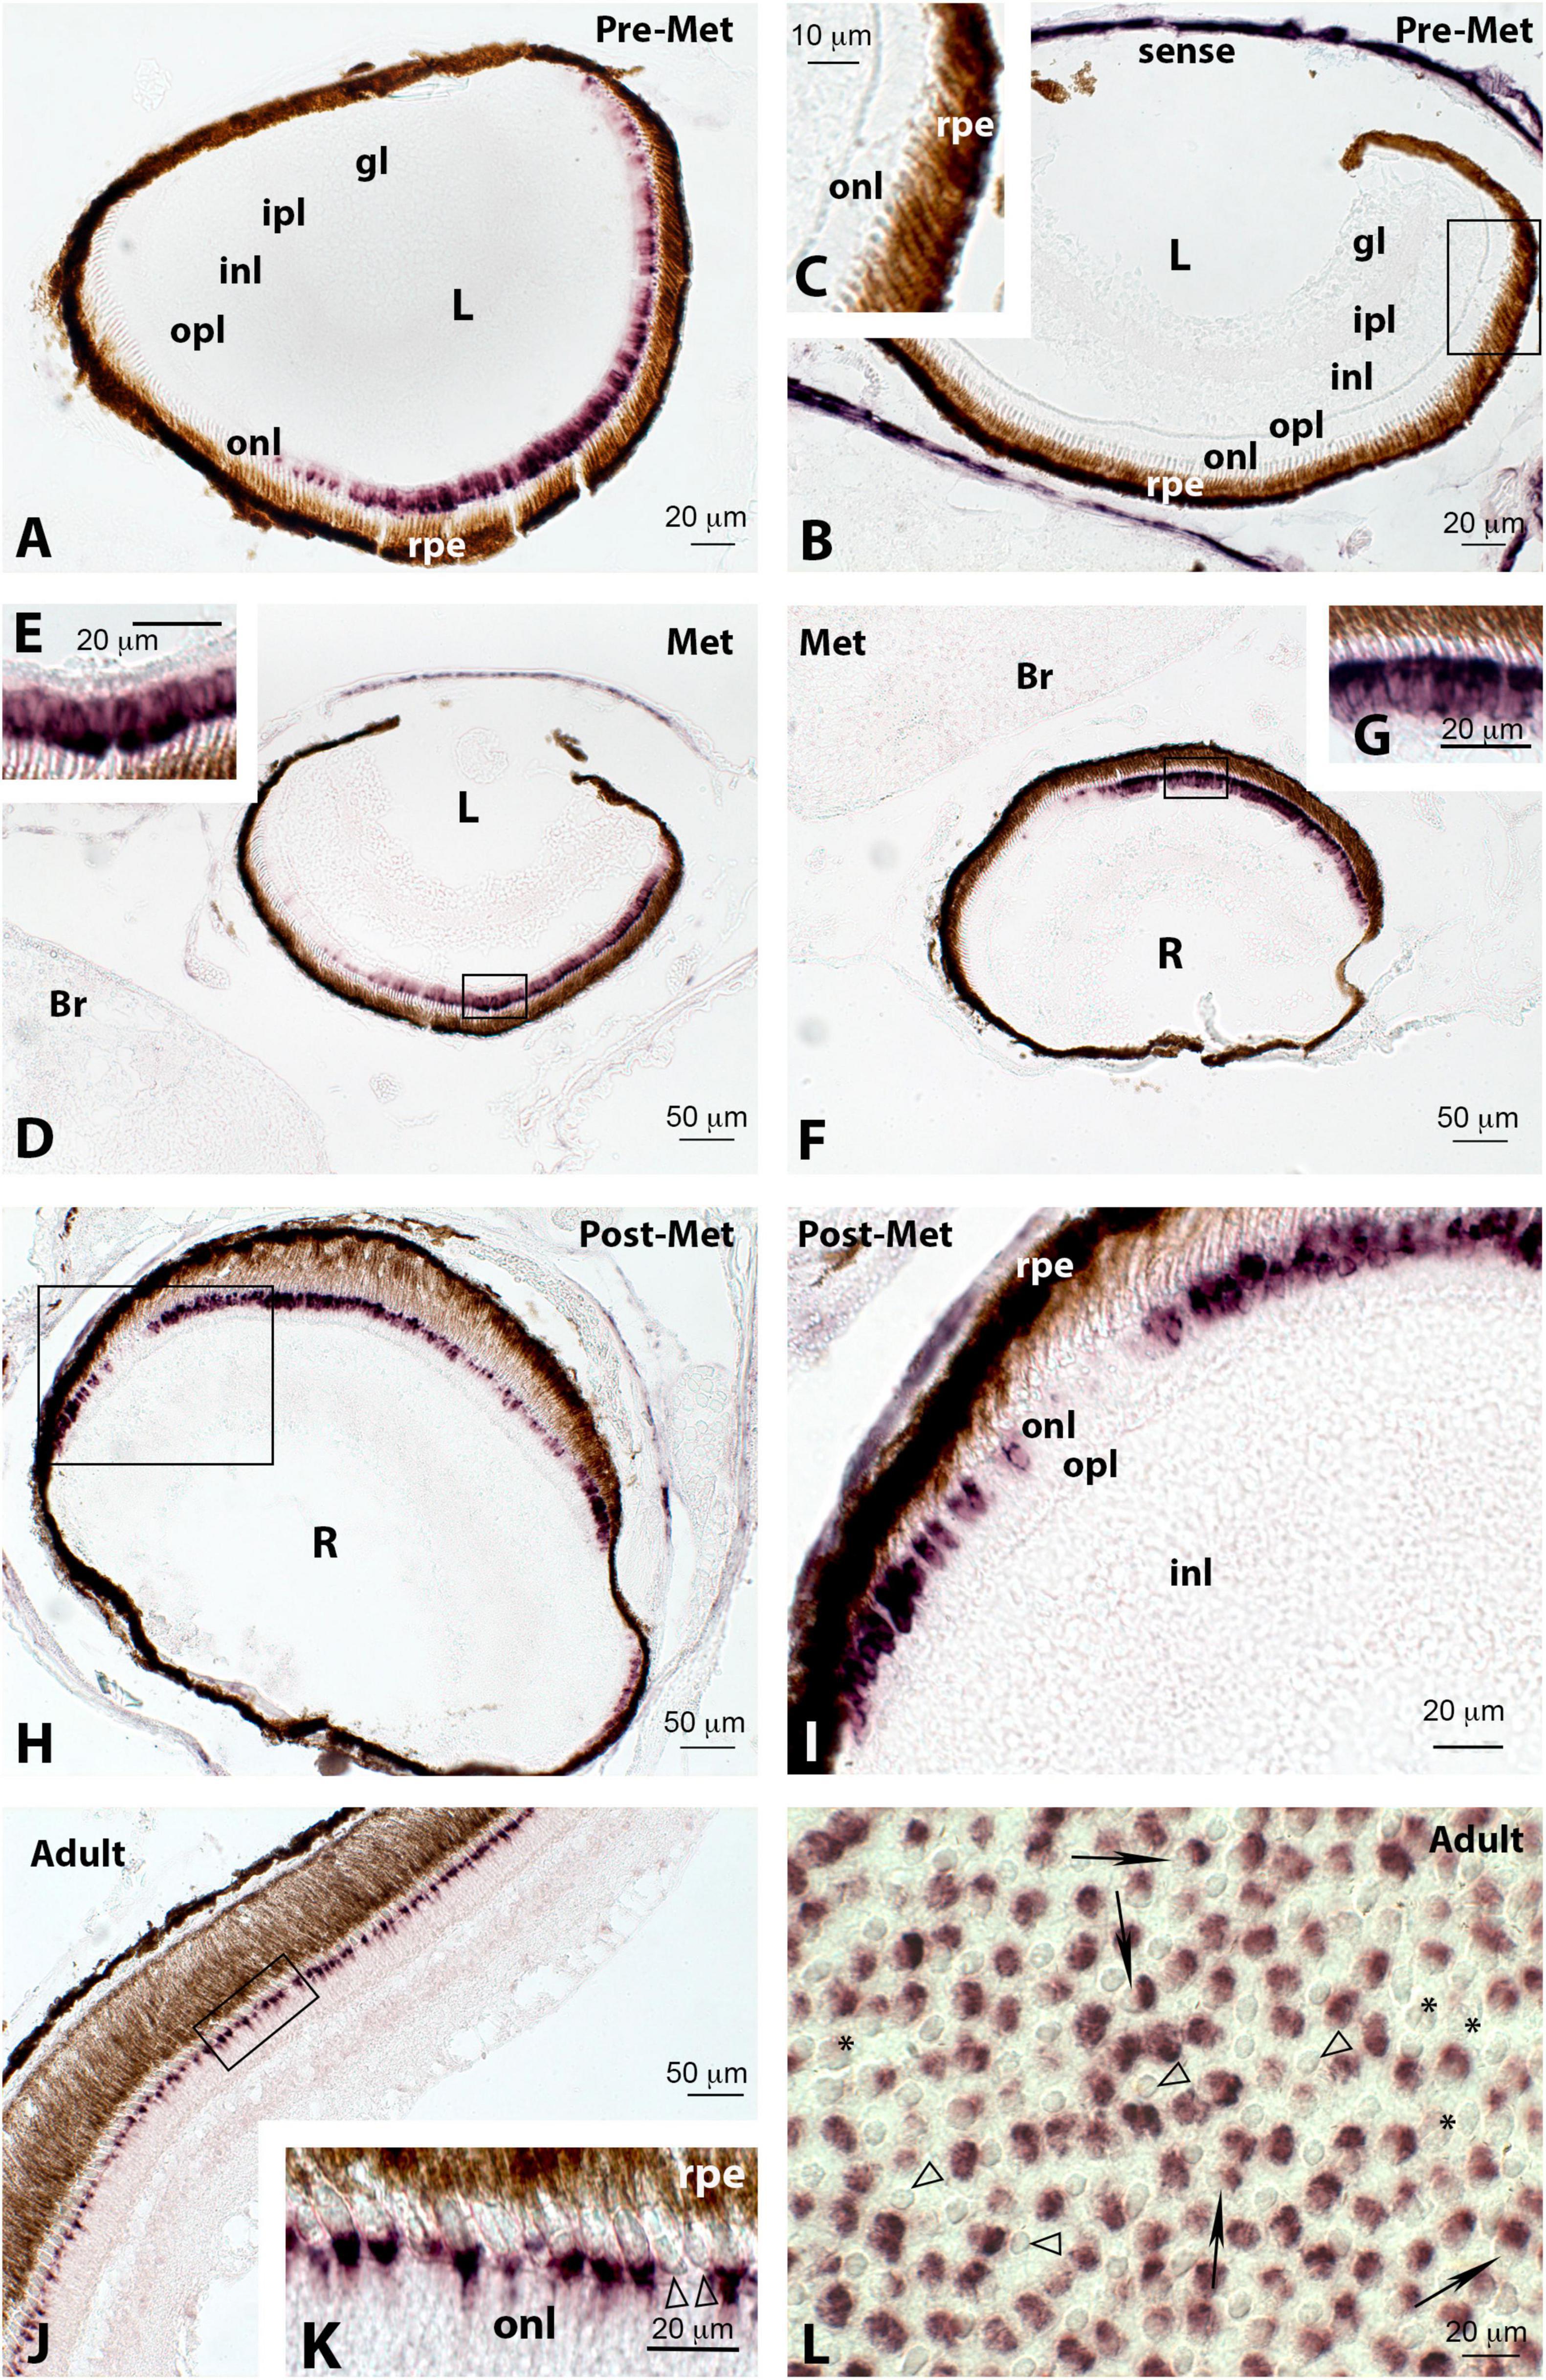
Figure 11. Localisation of red cone opsin (lws) expression in the retina of pre-metamorphic (Pre-Met; A–C), metamorphic (Met; D–G), post-metamorphic (Post-Met; H,I), and adult (J–L) Senegalese sole specimens revealed by in situ hybridisation. All the photomicrographs represent antisense sections, with the exception of panels (B,C), which show sense control sections. Squares in panels (B,D,F,H,J) mark the areas magnified in photomicrographs (C,E,G,I,K), respectively. Note that some parts of the retina (dorsal margin) appear devoid of labelling in pre-metamorphic (A) and metamorphic (D,F) specimens, both in the left and right retinas. Positive red opsin-expressing cells become evident in the dorsal retina of post-metamorphic animals (H,I). In the adult retina, this expression is evident in double cones, with smaller single cones being devoid of labelling (K,L, white arrowheads). Some double cones appear unlabelled (L, asterisks) while others only exhibit one of the pairs labelled (L, black arrows). All pictures corresponded to radial sections, with the exception of (L) that represents a tangential section. For abbreviations, see the legend in Figure 2. Scale bars represent 10 μm in panel (C); 20 μm in panels (A,B,E,G,I,K,L); and 50 μm in panels (D,F,H,J).
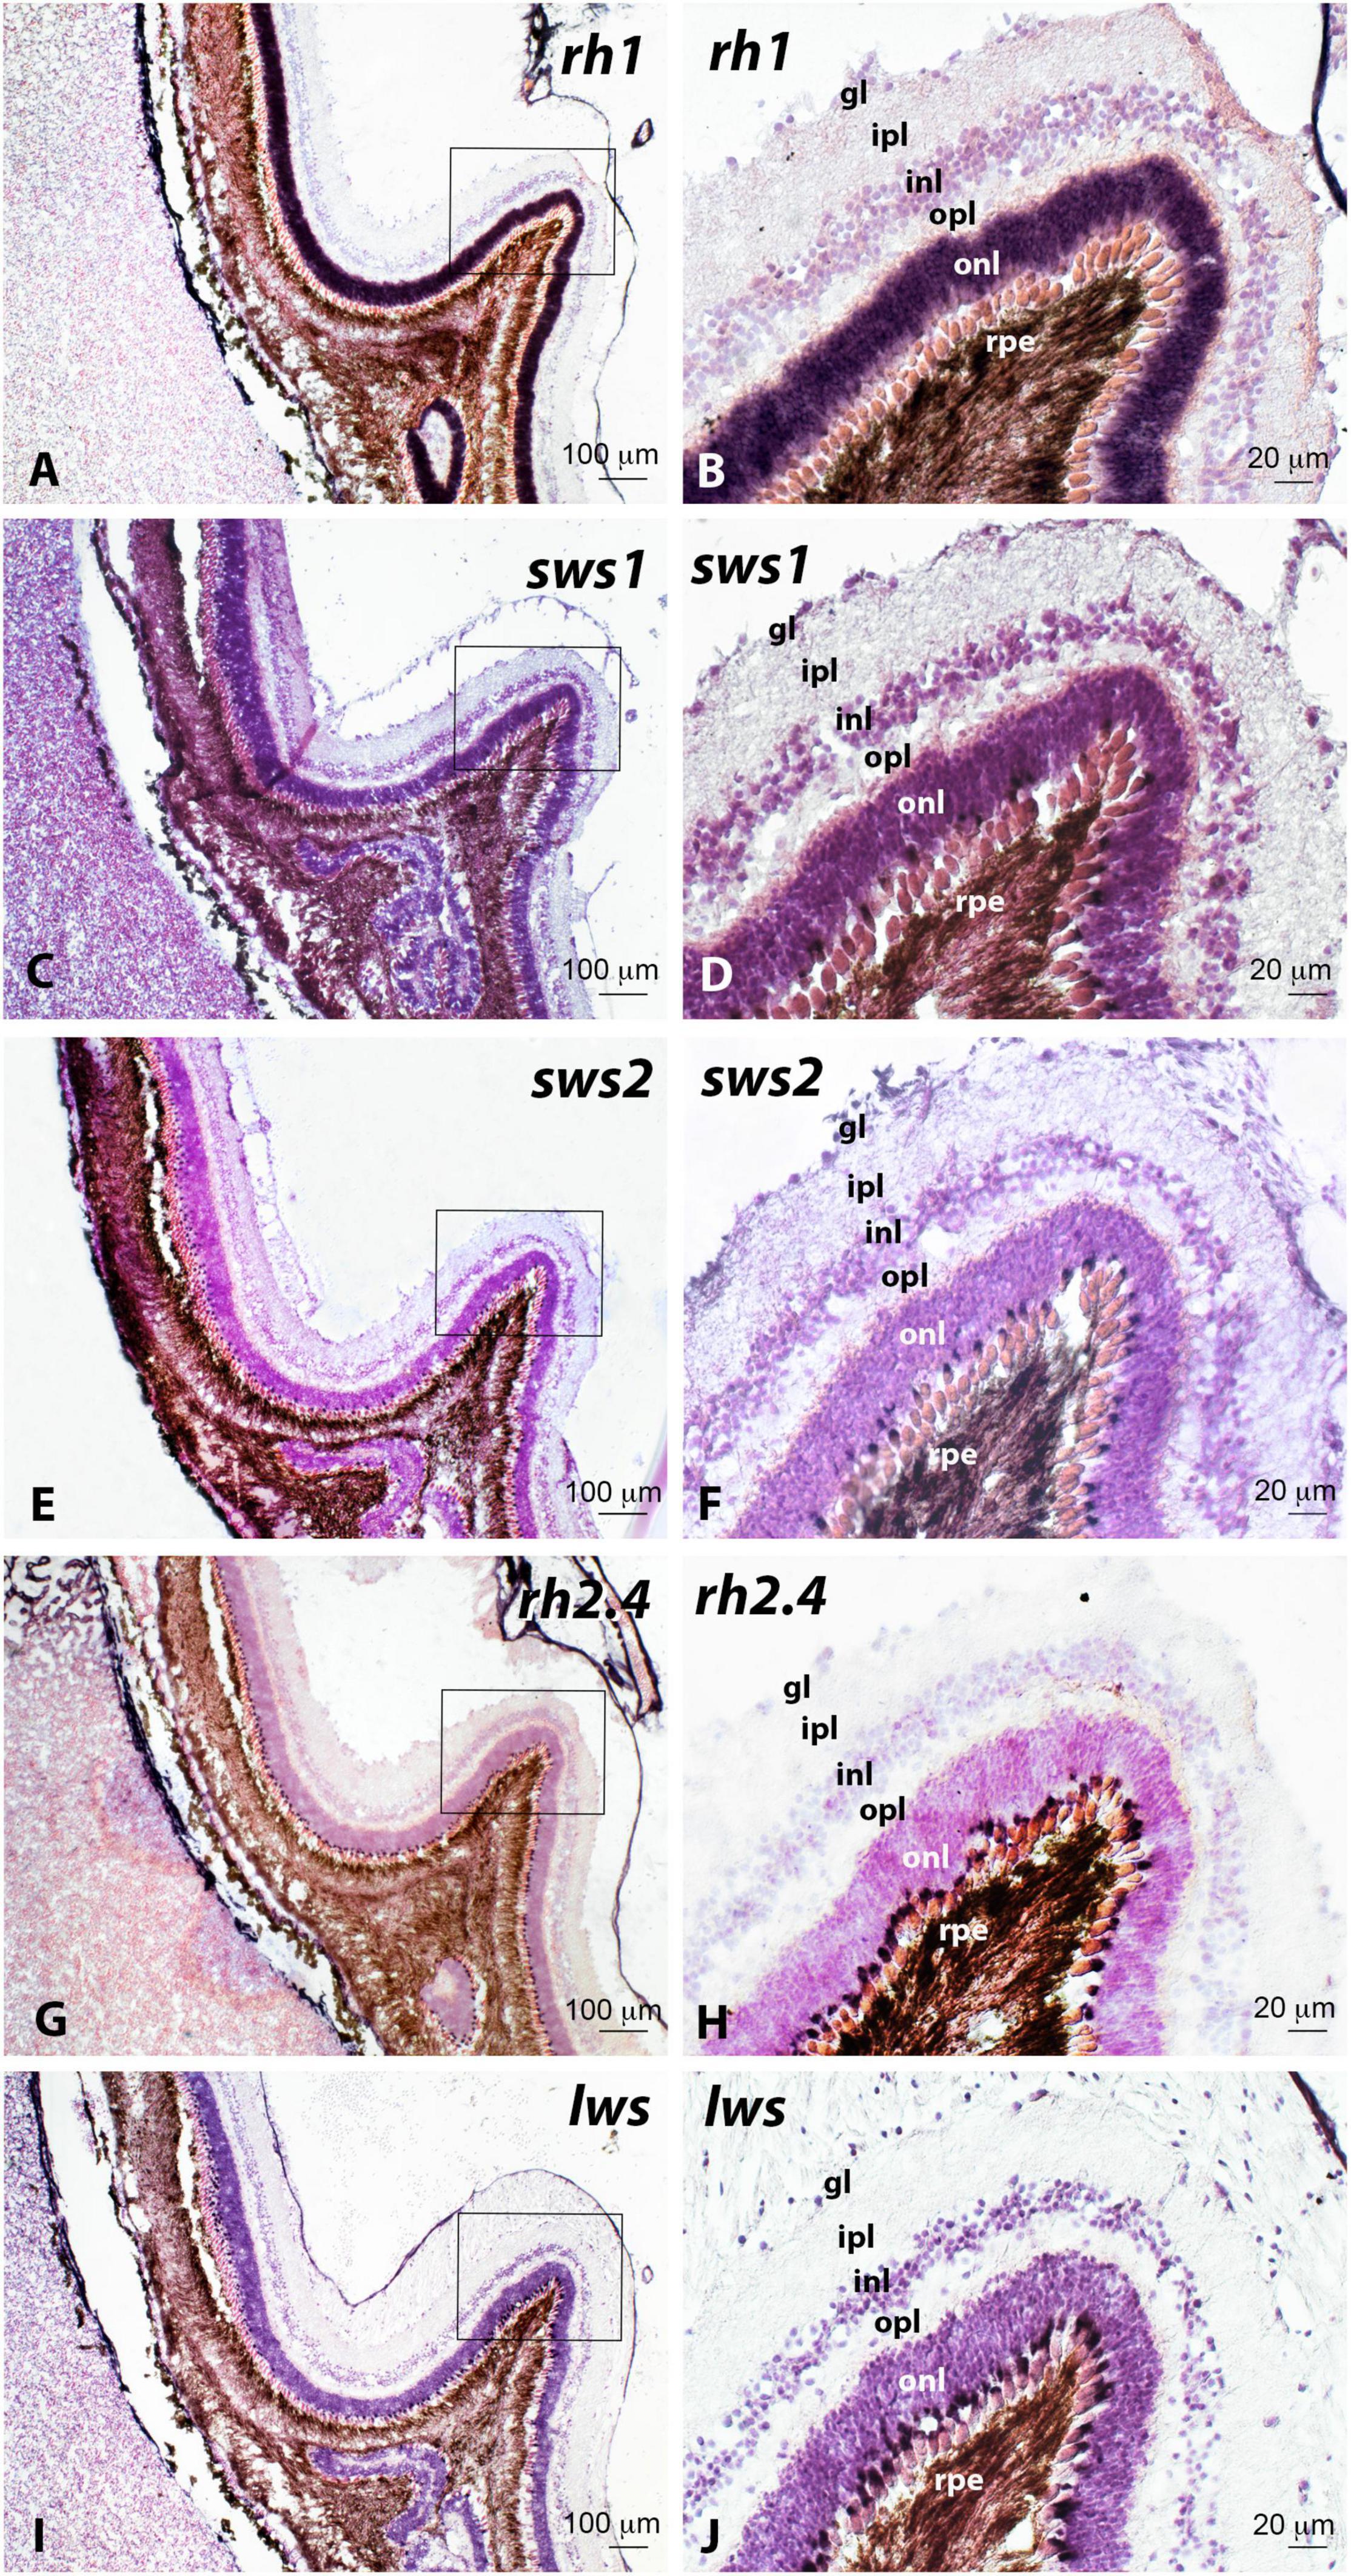
Figure 12. Localisation of rod (rh1; A,B), ultraviolet cone (sws1; C,D), blue cone (sws2; E,F), green cone (rh2.4; G,H) and red cone (lws; I,J) opsin-expressing cells in serial haematoxylin-eosin stained sections of the retina of adult Senegalese sole specimens revealed by in situ hybridisation. All the photomicrographs represent antisense sections. Squares in panels (A,C,E,G,I) mark the areas magnified in photomicrographs (B,D,F,H,J), respectively. Note the presence of abundant rh1-positive cells in the outer nuclear layer (onl, A,B), important amount of rh2.4- (G,H), and lws- (I,J) expressing cells and lower number of sws1- (C,D) and sws2- (E,F) expressing cells in the retina of adult specimens. For other abbreviations, see the legend in Figure 2. Scale bars represent 20 μm in panels (B,D,F,H,J); and 100 μm in panels (A,C,E,G,I).
Rod Opsin
Rod opsin (rh1) transcript levels exhibited a comparable temporal expression pattern in all the groups analysed but had slight differences (Figures 1A–D and Supplementary Table 1). The lowest transcript levels were found in embryos (dph –1) and at hatching (dph 0). A significant increase in expression was evident in the pre-metamorphic stage, in particular on dph 7 (except under LDW conditions), followed by a significant decrease during metamorphosis (dph 9 and/or 17), which was not evident either under LDW conditions, and further increase in later stages under all conditions (dph 21 and/or 32, Figures 1A–D). However, rh1 expression levels were markedly affected by light conditions, with differences particularly evident on dph 21 and 32 (Figure 1 and Supplementary Table 1). In these stages, the highest rh1 expression was reached under LDW conditions, followed by LDB, LL, and LDR. In LDW, the expression was between three (dph 32) and ten (dph 21) times higher than the expression in LDB, around three times higher compared to that in LDR (dph 21), and seven times higher in relation to LL conditions (dph 32). In contrast, during hatching (dph 0), pre-metamorphosis (dph 7), and metamorphosis (dph 17), transcript levels were quite similar among the different light conditions (Supplementary Table 1).
In situ hybridisation permitted us to identify a conspicuous rod opsin expression in the cell bodies and inner segments of photoreceptors present in the outer nuclear layer of the retina in the four ontogenetic stages analysed (Figure 2). The number of rod opsin-expressing cells and intensity of the labelling was lower in pre-metamorphic (Figures 2A,B) and metamorphic (Figures 2C,D) specimens compared to post-metamorphic (Figures 2E,F) and adult animals, in which rh1 represented the most expressed photopigment in densely packed cell bodies of the outer nuclear layer (Figures 2I,J).
Short-Wavelength Opsins: Ultraviolet and Blue Opsins
Ultraviolet (sws1) and blue (sws2) cone opsin transcripts were also detected in Senegalese sole embryos, larvae, and juveniles in all the stages analysed and under all light spectra and photoperiod regimes (Figures 3–6).
The temporal expression pattern of sws1 resembles that found for rh1 and is quite similar in most tested conditions but relative expression levels are much lower and ontogenetic variations are less pronounced. In LDW, LDB, and LL, sws1 expression exhibited its lowest levels in embryos (dph –1) and hatched larvae (dph 0) (Figures 3A,B,D). A significant increment in mRNA levels was observed during pre-metamorphosis (dph 4 and/or 7). During metamorphosis (dph 9 and 17), sws1 expression levels remained constant (Figures 3A,B,D), with further elevation after completion of the metamorphic process (dph 21 and/or 32) (Figures 3A,B,D). Under LDR conditions, sws1 transcript levels did not present any differences from embryos to early metamorphosis, but the expression increased significantly on dph 21 (Figure 3C). The light spectra and photoperiod also affected the expression levels of sws1. The highest expression of this opsin was detected under LDB conditions in most of the developmental stages, followed by LL/LDW conditions, being particularly low in LDR (Figures 3A–D and Supplementary Table 2).
Almost no UV opsin labelling was detected by in situ hybridisation in the retina of pre-metamorphic (Figure 4A) and metamorphic soles (Figure 4B, white arrowheads) using sws1 antisense riboprobes. As observed for rh1, the number of positive cells and intensity of the labelling increased in post-metamorphic specimens (Figures 4C,D). In adults, a moderate sws1 expression appeared restricted to the base of the inner segments of single cone photoreceptors (Figures 4E,F, white arrowheads), which occupied an intermediate position between larger double cones devoid of labelling (Figure 4F, black arrowheads) and cell bodies of rods present in the outer nuclear layer.
Regarding sws2, the temporal pattern of expression resembles that of rh1 rather than that of sws1, with a significant increase during pre-metamorphosis (dph 4 and/or dph 7), a decrease during metamorphosis (dph 9 and 17), and a subsequent rise in transcript levels in late post-metamorphosis (dph 32), which was evident under all light conditions except for LDR specimens that did not reach this stage (Figures 5A–D). This pattern of expression was influenced by the light spectrum and photoperiod. Thus, in LDW, the rise in sws2 expression was advanced in pre-metamorphosis to dph 4, and the peak of expression found in the post-metamorphic stage (dph 32) reached higher levels (Figure 5A and Supplementary Table 3) in relation to LDB (Figure 5B and Supplementary Table 3) and, in particular, compared to constant light conditions in which these values were significantly lower than those attained in pre-metamorphosis (Figure 5D and Supplementary Table 3).
Blue opsin expression in the retina of the sole was higher than that of UV opsins in all developmental stages analysed, as revealed by in situ hybridisation (Figure 6). In the early stages (pre-metamorphosis and metamorphosis), positive sws2 cells were more abundant in the ventral and medial surfaces of the retina (Figures 6A–D, white arrowheads), which were also evident in the dorsal retina of post-metamorphic animals (Figures 6E,F). In adults, the sws2 visual pigment was also confined to the single cones (Figures 6I–M, white arrowheads), with labelling being evident at the base of the inner segments of photoreceptors (myoid region), which have a pear-like appearance in radial sections (Figures 6J,K) and a rounded aspect in oblique (Figure 6L) and tangential (Figure 6M) sections. These sws2-positive single cones appeared surrounded by larger and unlabelled double (Figures 6K–M, black arrowheads and asterisks) and triple (Figure 6M, black arrow) cones, probably expressing medium wavelength- (rh2.3 and/or rh2.4) and long wavelength- (lws) sensitive opsins.
Medium-Wavelength Opsins: Green Opsins
The developmental expression pattern of both green opsins (rh2.3 and rh2.4) was similar but exhibited important differences in transcript levels between them (much higher expression for rh2.4), and when compared with the other opsins analysed, because their expression did not increase in the post-metamorphic stage like the other opsins (Figures 7, 8). In this way, the highest expression values for both rh2.3 and rh2.4 were observed in pre-metamorphosis (dph 4 or dph 7, Figures 7, 8 and Supplementary Tables 4, 5), when the green opsins represented the most abundant photopigments. Light spectrum affected differentially the expression of both green opsins, with blue lights (LDB) determining an increase of around 10 times in mRNA peak levels of rh2.3, but not of rh2.4 (Figures 7B, 8B and Supplementary Tables 4, 5) when compared to the other light regimes (Figures 7A,C,D, 8A,C,D and Supplementary Tables 4, 5). Concerning rh2.4, LDW was the light regime more efficient in increasing its transcript levels in both pre-metamorphosis (dph 4) and post-metamorphosis (dph 21 and 32) (Figure 8 and Supplementary Table 5). Photoperiod also influenced the expression of the green opsins, with lower peak levels of both rh2.3 and rh2.4 in pre-metamorphosis under constant light conditions (LL, Figures 7D, 8D and Supplementary Tables 4, 5) in relation to the light-dark conditions tested (Figures 7A–C, 8A–C and Supplementary Tables 4, 5).
The presence of green opsins in retinal cells of the sole was identified by in situ hybridisation only for rh2.4 because rh2.3 transcript levels were much lower in most of the developmental stages analysed, as revealed by Cts in the qPCR study. In contrast to that observed by qPCR, no marked differences in the expression of rh2.4 were observed among the retinas of pre-metamorphic (Figures 9A,B) and metamorphic animals (Figures 9E,F) by in situ hybridisation. Abundant positive green opsin-expressing cells were evident in the outer nuclear layer of the retina in both stages, with more intense labelling in the external half of the outer nuclear layer, closer to the retinal pigment epithelium (Figures 9B,F). However, in agreement with the qPCR results, a marked reduction in rh2.4 expression was observed in post-metamorphic specimens (Figures 9G,H). In adults, intense rh2.4 labelling was present at the base of the inner segments of double cones (Figures 9I,J, black arrowheads), at the level of the external limiting membrane, whereas single cones appeared unlabelled (Figures 9I,J, white arrowheads). The presence of double cones with inner segments devoid of green opsin labelling was also evident in the retina of the adult sole (Figure 9K, black arrows).
Long-Wavelength Opsins: Red Opsin
Finally, the expression of the red opsin (lws) followed a similar developmental trend than that reported for most of the opsins studied, i.e., the lowest levels in the embryo (dph –1) and hatching (dph 0) stages, a significant increase during pre-metamorphosis (dph 4 and/or dph 7), drop in transcript levels during metamorphosis (non-significant under LDW conditions), and a further increase in later stages (dph 21 and/or dph 32) (Figures 10A–D). The light regime also influenced lws expression. In this case, light-dark cycles of white lights (LDW) were the most efficient in increasing lws transcript levels in the pre-metamorphic stage (dph 4), with two to five times higher expression than the remaining light conditions (Figures 10A–D and Supplementary Table 6). In the later stages, the peak of lws expression was also higher under the LDW regime (dph 32), followed by LDB (dph 32), LL (dph 32), and LDR (dph 21) (Figures 10A–D and Supplementary Table 6). It should be noted that the latter increase was already evident in LDW, LDR, and LL on dph 21 (Figures 10A,C,D and Supplementary Table 6) but was not significant under LDB conditions until 32 dph (Figure 10B and Supplementary Table 6).
The red opsin was detected by in situ hybridisation in the retina of the sole in all the developmental stages analysed (Figure 11). However, in pre-metamorphosis (Figure 11A) and metamorphosis (Figures 11D–G), labelling was much more evident in the ventromedial part of the retina, being the dorsal area almost devoid of positive cells, whereas in post-metamorphic (Figures 11H,I) and adult (Figures 11J–L) animals, the dorsal retina also exhibited conspicuous labelling. The expression of lws was detected in double cones showing intense labelling in both double cone pairs (Figures 11K,L), although some of them were labelled only in one of the double cone members (Figure 11L, black arrows). These positive cells appear intermingled with unlabelled single cones (Figures 11K,L, white arrowheads) and unlabelled double cones (Figure 11L, asterisks), probably containing short-wavelength opsins and medium-wavelength opsins, respectively.
Figure 12 illustrates the comparative distribution of cells expressing the five visual opsins analysed by in situ hybridisation in haematoxylin-eosin stained sections of the retina of the adult sole. The number of rod opsin (rh1)-expressing cells and intensity of the labelling were markedly higher than those observed in serial sections of the retina processed with riboprobes against the other visual pigments (Figures 12A,B). Medium-wavelength sensitive opsin-expressing cells (green opsin rh2.4, Figures 12G,H) were also abundant in cones of the outer nuclear layer of the retina, where a moderate number of intensely stained long wavelength-sensitive opsin-expressing cones (red opsin lws, Figures 12I,J) were also found. In contrast, short-wavelength sensitive opsin-expressing cells containing the blue cone opsin (sws2, Figures 12E,F) and the UV cone opsin (sws1, Figures 12C,D) were less represented in the retina of the adult sole.
Discussion
In the Senegalese sole, as in other flatfish species, metamorphosis causes morphological, cellular, molecular, physiological, and behavioural changes (e.g., migration of left eye to the right side, skin stratification, remodelling of axial muscle, mouth, head, and forebrain, gas-exchange efficiency, gastrointestinal tract compartmentalization, the shift from diurnal to nocturnal locomotor activity, and feeding), which accompany its vertical migration from the surface of the water column to the bedside and determine a switch from planktonic to benthonic habits (Rodríguez-Gómez et al., 2000; Fernández-Díaz et al., 2001; Blanco-Vives et al., 2012; Campinho, 2019). In this study, our main goal was to understand if these morphological, behavioural, and ecological changes match physiological and adaptive changes in visual opsin expression and the number of visual opsin-expressing cells from the embryo to the juvenile/adult stages of the Senegalese sole. As summarised in Figure 13, visual opsin expression was significantly upregulated in pre-metamorphosis (dph 4–7) just after the functional differentiation of the retina (Bejarano-Escobar et al., 2010), and in post-metamorphosis (dph 21–32), when the shift from pelagic to benthic habitats and from diurnal to nocturnal behaviour is already accomplished (Blanco-Vives et al., 2012). In between, a generalised decline in visual opsin expression was detected, coinciding with the metamorphic process (dph 9–17). The overall patterns of expression of the six opsins analysed follow a similar developmental trend regardless of the light regime, suggesting that opsin usage could be genetically preprogrammed during sole development, as has been previously proposed in other fish species such as the cod, Gadus morhua (Valen et al., 2014, 2018). However, photoperiod and light spectrum affected the peak in transcript levels of most of the visual opsins analysed. Overall, the ontogeny of visual opsin-expressing cells and intensity of the labelling present in the retina of the sole, as revealed by in situ hybridisation, provided very consistent results compared to the developmental pattern observed in the whole body by RT-qPCR, which suggests that retinal transcripts account for most visual opsin expressions in this species. These anatomical results also fit well with our previous study, showing that the Senegalese sole did not exhibit the characteristic highly ordered, lattice-like mosaics of other flatfish species (see Figure 11L), and confirming that the short-wavelength sensitive opsins (sws1 and sws2) were expressed in single cones, whereas the middle wavelength (rh2.4)- and long wavelength (lws)-sensitive photopigments were present in double cones (Frau et al., 2020a). From a practical point of view, an important conclusion could be drawn, i.e., both the pre-metamorphosis (dph 4–7) and post-metamorphosis (dph 21–32) stages appear to represent two developmental windows with increased light sensitivity in the sole, as the number of transcript levels of molecules detecting photic stimuli is significantly higher. Therefore, extra care should be taken with the light protocols used when handling larvae and juveniles in these stages in aquaculture practise.
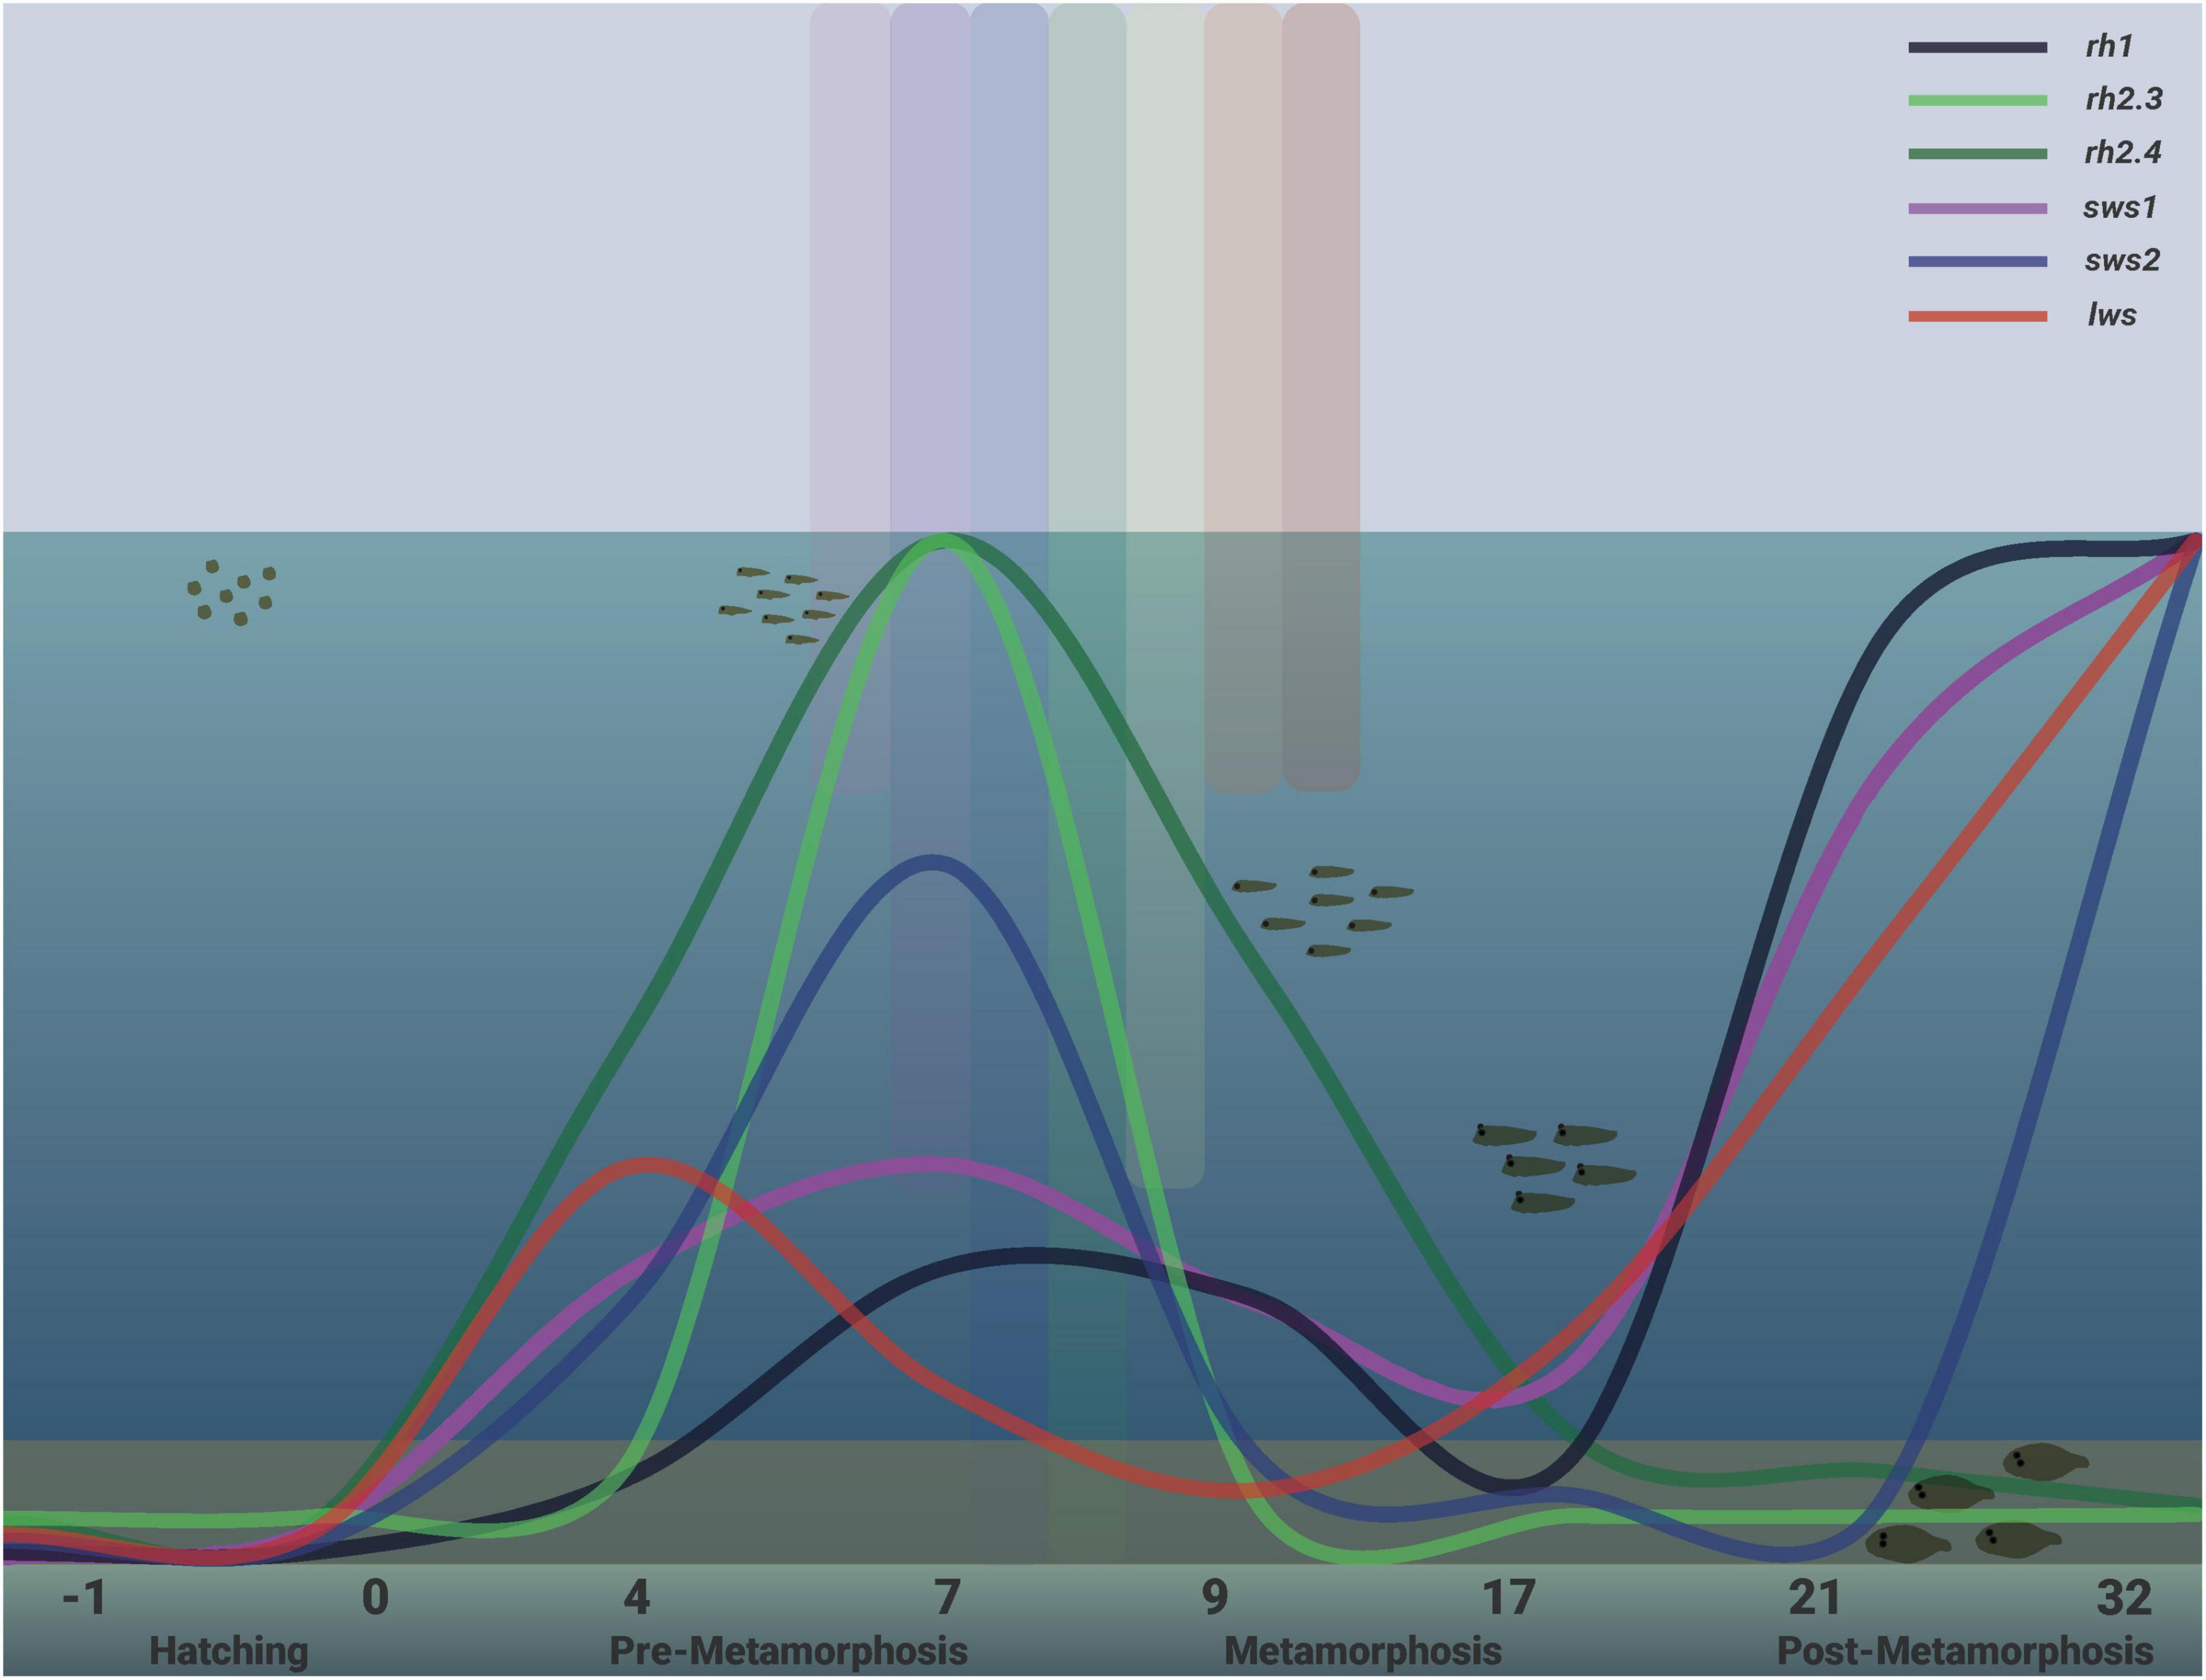
Figure 13. Summary of the profile of visual opsins for rh1, sws1, sws2, rh2.3, rh2.4, and lws transcript levels obtained in this study in developing sole. This figure does not intend to compare expression levels among different opsins but the ontogenetic expression pattern for each visual photopigment. All the visual opsins exhibited early increase in expression during pre-metamorphosis and subsequent decrease in transcript levels during metamorphosis. Note how rh2.3 and rh2.4 green opsin expressions remain at low levels in post-metamorphic juvenile specimens. On the contrary, at this moment, all the other opsin transcript levels increase considerably. The different stages of Senegalese sole development analysed in this study by RT-qPCR are shown in this Figure (hatching, pre-metamorphosis, metamorphosis, and post-metamorphosis), indicating the position that specimens occupy in the water column in each stage. The differential penetration of lights of the visible spectrum into the ocean water column is also represented. Longer wavelengths, such as red light, are the first to be completely absorbed while shorter and medium wavelengths, such as blue and green lights, penetrate deeper. Eggs, embryos, and early larvae of the Senegalese sole live in the upper part of the water column, thus receiving irradiation that contains all wavelengths present in sun light. During metamorphosis, they start to migrate vertically to the bottom, receiving fewer wavelengths; finally, after the completion of the metamorphic process, they live in the seabed in an environment dominated by green and blue lights.
In this study, the expression of all the visual opsins analysed was detected already in sole embryos and larvae one day before hatching (dph –1) and at hatching (dph 0). Several studies have shown that many fish species present advanced eye development already at hatching (Evans and Browman, 2004). However, according to Bejarano-Escobar et al. (2010), new-born Senegalese sole larvae still have unpigmented and rudimentary eyes, consisting of just a neuroepithelial optic cup, similar to other flatfish species such as the turbot, Psetta maxima, and halibut, Hippoglossus hippoglossus (Kvenseth et al., 1996; De Miguel Villegas et al., 1997). On dph 3, the sole larval retina is not yet fully differentiated, although it might be able to sustain a limited visual function, being completely functional on dph 4 (Bejarano-Escobar et al., 2010; Padrós et al., 2011; Sarasquete et al., 2019). Moreover, the pineal organ of the Senegalese sole, the other well-known photoreceptive structure, becomes differentiated 2 days post-fertilisation (corresponding to dph 1) (El M’Rabet et al., 2008; Isorna et al., 2009). Our results suggest that sole embryos and early-staged larvae could activate the molecular machinery to perceive lights of different wavelengths even before the complete differentiation and functionality of light-sensitive structures, and as soon as one day before hatching (dph –1). This is consistent with our previous study, where the expression of visual opsins was also detected very early during development on dph 0 (hatching) (Frau et al., 2020b). The early expression of visual opsins in sole embryos could also be related to direct light sensitivity at the cellular level. It is known that fish organs and fish-derived embryonic cell lines are sensitive to light (Whitmore et al., 2000; Tamai et al., 2005; Vergès-Castillo et al., 2021), and it has been recently shown that they express a wide number of opsin photopigments, which may support their ability to respond directly to photic stimuli (Davies et al., 2015; Steindal and Whitmore, 2020).
The increment in all visual opsin mRNA levels prior to metamorphosis (dph 4–7), when pelagic larvae are swimming in the upper part of the water column exposed to all wavelengths of incident light (Figure 13), coincides with the complete development of the retina, mouth opening, and onset of exogenous feeding in the sole (Bejarano-Escobar et al., 2010; Blanco-Vives et al., 2011; Padrós et al., 2011). This opsin expression could be mediating the light synchronisation of diverse rhythms (e.g., rhythms in the molecular clock, embryonic development, hatching, locomotor, and feeding activities) that appear very early during development in this and other fish species (Blanco-Vives et al., 2010, 2011, 2012; Martín-Robles et al., 2012; Villamizar et al., 2013; Rosa et al., 2015; Frau et al., 2020b). In fact, this increase in visual opsin transcript levels is concurrent with the complete organisation of molecular clock loops in sole larvae and climax of the expression of melatonin-synthesising enzymes aanat1a and aanat2 at early ontogeny, thus contributing to the functionality and entraining of the sole circadian system in early stages (Isorna et al., 2009, 2011; Martín-Robles et al., 2012). The early expression of rod opsin (rh1) detected in the sole by both RT-qPCR and in situ hybridisation is in agreement with that described by Bejarano-Escobar et al. (2010) by immunohistochemistry using an antiserum against bovine rod opsin. However, it is in contrast with previous results reported on flatfish species and most teleosts, in which cones generally anticipate the formation of rods, and rod opsin expression is not detected in the retina in the pre-metamorphic stage, being evident only in the juvenile phase (Evans et al., 1993; Helvik et al., 2001a,b; Mader and Cameron, 2004). Strong overexpression of the rod opsin (7-fold increase) was also identified in common sole (Solea solea L.) larvae from hatching to dph 4 in a transcriptomic study (Ferraresso et al., 2013). During this period, flatfish larvae actively feed, and the developmental process is at its highest rate, with maximum growth rates (Ribeiro et al., 1999; Fernández-Díaz et al., 2001). As vision plays an important role in prey detection and feeding in fish larvae (Blaxter, 1969; Govoni et al., 1986; Falk-Petersen, 2005), increased levels of visual opsin transcripts could contribute to enhancing light sensitivity for foraging behaviour and active feeding and contribute to predator avoidance during this critical period.
On the contrary, flatfish metamorphosis, a highly energy-demanding process, is characterised by a significant decrease in growth, energy content, and feeding rates. Metamorphic specimens have to rely on stored reserves, reducing their growth performance (Yúfera et al., 1999; Fernández-Díaz et al., 2001; Cañavate et al., 2006; Geffen et al., 2007). In addition, sole metamorphosis is associated with shift in swimming duration, prey attack rate, and capture success rate from diurnal to nocturnal (Blanco-Vives et al., 2012), which could be associated with the remodelling in photoreceptors and changes in visual acuity and sensitivity to adapt to new lighting environment. Consistent with these facts, we have observed a significant downregulation of all the visual opsins analysed during this period. Decreasing expression levels of clock genes, melatonin-synthesising enzymes (aanat1 and aanat2), and melatonin receptors (mt1 and mt2) have also been described during metamorphosis (Isorna et al., 2009, 2011; Martín-Robles et al., 2013; Lan-Chow-Wing et al., 2014), as well as a transient lost in clock genes and visual opsin rhythms (Martín-Robles et al., 2012; Frau et al., 2020b). Therefore, the input, clock, and output elements of the circadian systems appear to work at a lower rate and reorganise during metamorphosis.
As mentioned above, visual opsins significantly rose again in post-metamorphic specimens, excluding the green opsins rh2.3 and rh2.4 that remain at low levels at these ages. In this stage, eye migration and metamorphosis are completed, and asymmetrical juveniles have already started their benthic life (Fernández-Díaz et al., 2001; Blanco-Vives et al., 2012). Active feeding restarts again in sole juveniles, and a complete repertoire of visual opsins would be beneficial to detect prey. In fish, it has been demonstrated that the UV cone opsin (sws1) enhanced foraging performance (Novales Flamarique, 2013). The Senegalese sole feed mostly on small, bottom-dwelling invertebrates, and the increase in sws1 expression could help to improve the catching and intake rates of prey as an adaptation to the new environment.
Although we found a conspicuous rh1 expression in the Senegalese sole at pre-metamorphosis, a significant increase was evident in all the experimental groups after metamorphosis. In this sense, a proliferation of rods in fish has been shown as essential for the capacity to see under dim light (Evans and Browman, 2004; Musilova et al., 2019). Matsuda et al. (2008) made a comparison among three flatfish species of different ecotypes, and they found that a nocturnal fish, the pointhead flounder (Hippoglossoides pinetorum), has higher rod density in the outer nuclear layer than either slime flounder (Microstomus achne) or red halibut (Hippoglossoides dubius), which are both diurnal fishes. A correlation between a high proportion of rods and reduced light environment conditions was also reported in eels. Epipelagic freshwater eel possesses rh2 and sws2 cones; however, when it goes through metamorphosis and becomes deep-sea eel, the vision becomes rod-based in the new scotopic environment, and cones are almost lost (Bowmaker et al., 2008). In the half-smooth tongue sole, Cynoglossus semilaevis, transcript levels of rod pigment (rh1) were also significantly higher in benthic stages when compared to pelagic specimens (Chen et al., 2014). Accordingly, our in situ hybridisation study showed a progressive increase in the number of rh1-labelled cells and in the intensity of labelling in the outer nuclear layer of the retina from pelagic pre-metamorphic larvae to benthic post-metamorphic juveniles, with rods being the most abundant photoreceptors in the retina of the adult sole (see Figure 12).
Together with blue light, green wavelengths penetrate deeply into the water column. Fish species tend to possess visual pigments that are related to the most abundant wavelengths (Douglas et al., 2003). In this sense, the significant increase in sws2 observed in the post-metamorphic sole could contribute to perceiving blue lights reaching these benthic habitats. However, for the same reason, the sole was expected to have high levels of green sensitive opsins after metamorphosis. Surprisingly, whereas all other opsins increased their expression after completion of the metamorphic process, the downregulation of green opsins detected during metamorphosis was maintained in early post-metamorphic juveniles for rh2.4, and especially for rh2.3, which was barely detected in this stage. It is interesting to note that the expression of the middle-wavelength sensitive pigment gene (rh2) in the half-smooth tongue sole was also significantly higher in pelagic larvae compared to benthic juveniles (Chen et al., 2014). Whether another type of middle-wavelength-sensitive opsin could be activated in the sole after this drop in rh2.3 and rh2.4 expression remains to be elucidated, because up to eight rhodopsin-like 2 (rh2) genes have been described in teleosts (Carleton et al., 2020; Musilova et al., 2021). Ontogenetic chromophore switches have been reported previously in the literature. Thus, Cheng et al. (2009) described widely the shift that occurs in salmons from sws1 to sws2a when they change from larvae to juvenile life stages. Further investigation performing HPLC analysis on different opsins before and after metamorphosis, and even during older juvenile and adult stages, is needed to test this hypothesis on the Senegalese sole. Nevertheless, a conspicuous expression of rh2.3 and rh2.4 was evident in the retina of older juvenile Senegalese sole specimens (180–250 days old; i.e., over 5 months after metamorphosis), and two middle-wavelength-sensitive visual pigments (λmax 523 and 536 nm, respectively) were found by microspectrophotometry in the juvenile retina of a closely related species living in the same habitats, the common sole Solea solea (Frau et al., 2020a). Therefore, the downregulation of green opsins observed during metamorphosis and in early post-metamorphic juveniles could represent a transient event in Senegalese sole life cycle. In fact, in situ hybridisation analysis performed on the retina of the 2-year-old adult sole (present study) revealed the presence of an important number of intensely labelled rh2.4-expressing cells (see Figure 12 for comparison with other opsins). The high proportion of M-type cones present in the retina of the juvenile and adult soles is consistent with the fact that middle- rather than short-wavelengths are preferentially transmitted in turbid coastal waters (Jerlov, 1968), where the sole inhabits in these older stages. The cone mosaic without a lattice-like structure found in the sole, with packing significantly greater than that found in other flatfish species (Frau et al., 2020a), appears suitable for life in these low-light environments. In any case, metamorphosis in the Senegalese sole is also associated with a shift from cone opsin- to rod opsin-dominated vision, which is characterised by higher sensitivity but lower spatial and temporal resolutions (Ebrey and Koutalos, 2001). Thus, as revealed in our laboratory, rod opsin transcript levels were high in the retina of the juvenile sole (present study, Frau et al., 2020a), and rod opsin-expressing cells were the most abundant photoreceptors in the retina of post-metamorphic and adult animals (present study). Interestingly, in a previous microspectrophotometry analysis (Frau et al., 2020a), we identified the presence of a rod visual photopigment in the retina of a juvenile common sole with λmax of 511 nm, which is close to the wavelengths of maximum absorbance of the two visual pigments measured in the outer segment of green cone opsin photoreceptors (λmax nm and 536 nm). Therefore, rod opsin photopigments could be sensing green wavelengths reaching the seabed until green cone opsins are up-regulated again.
In turn, we could expect a severe downregulation of red-sensitive opsins after metamorphosis, as the red colour absorbance at the bottom of the seabed appears to be negligible (Figure 13). However, we detected an up-regulation of lws transcript levels in the post-metamorphic sole, in particular, under LDW and LDB regimes. This result was confirmed anatomically in the retina of the sole by our in situ hybridisation study, in which we detected an important number of red opsin-expressing cells in double cones of the post-metamorphic and adult sole. Furthermore, microspectrophotometry absorbance measurements from individual photoreceptors of the juvenile common sole revealed the existence of a long-wavelength-sensitive visual pigment with λ peak of 559 nm and bandwidth from 490 to 640 nm (Frau et al., 2020a). According to our results, the expression of long-wavelength-sensitive opsin lws1 in tongue sole was higher in the benthic animals than in the pelagic specimens (Chen et al., 2014). In a recent study by Chang and Yan (2019), the red shiner (Cyprinella lutrensis) was exposed to four water turbidity treatments. Turbid waters often create red light-abundant surroundings (Doxaran et al., 2002) and, accordingly, an elevated proportional expression of lws in the cone was observed, indicating that the visual spectrum of the red shiner displays a redshift in response to increased turbidity (Chang and Yan, 2019). The guppy (Poecilia reticulata) also has higher proportional and relative lws opsin expression when it is reared in turbid waters (Ehlman et al., 2015). All these considerations are particularly important considering that post-metamorphic Solea senegalensis lives in a low-light environment strongly influenced by turbidity, which could support the increased expression of red-sensitive opsins to adapt to the new environment. Alternatively, these red-sensitive opsins could play a role in perceiving long wavelengths when sole specimens experience vertical migrations in the water column at dawn and dusk, and/or perceiving nocturnal moonlight, aspects that will require further investigation in the future. In any case, stimulation of these red-sensitive opsins alone does not seem to be sufficient to guarantee the optimal development of the sole, because, as shown in this and previous studies (Blanco-Vives et al., 2011, 2012; Frau et al., 2020b), animals reared under LDR conditions exhibited impaired hatching, feeding performance and foraging behaviour, delayed development and lower growth, and less robust visual opsin rhythms, dying before the completion of metamorphosis.
Interestingly, the expression pattern of most of the visual opsins during sole ontogeny exhibited an inverse correlation with developmental levels of thyroid hormones (THs), which sharply increase at the beginning of metamorphosis and reach maximum at the metamorphic climax, and decrease progressively until post-metamorphosis (Klaren et al., 2008; Isorna et al., 2009). THs and their receptors are widely described in the literature to be responsible for changes at all levels of metamorphic animals. They also regulate cell migration, neuronal differentiation, and alter profoundly the visual system, and are crucial for optimal maturation of the retina (Mader and Cameron, 2006; Galay-Burgos et al., 2008; Cheng et al., 2009). Cheng et al. (2009) investigated the role of THs in triggering opsin remodelling and demonstrated that THs are responsible for the depopulation of UV cones by inducing a UV-to-blue opsin switch in the retina of juvenile salmonid fishes, as occurs during natural development. Taken together, these results suggest that THs could be modulating the repertoire of visual opsins and their plastic changes in the sole during development. Further studies on Solea senegalensis larvae treated with THs and/or THs antagonists during metamorphosis could give us valuable information to understand this possible correlation.
In this study, we also found significant effects of the light spectrum and photoperiod on modulating the ontogenetic expression of visual opsins, with blue (for sws1 and rh2.3) and white (for rh1, sws2, rh2.4, and lws) light-dark cycles producing the highest peaks in their transcript levels. In previous studies, we showed that LD cycles of blue and white lights represented optimal photic conditions for the proper development of biological functions and behaviour of sole larvae (Blanco-Vives et al., 2011, 2012). In agreement with these results, LD cycles of blue and white lights also constituted the best light regimes for visual opsin development. The improved performance in these light regimes harmonises well with the natural adaptation of sole larvae and juveniles to blue-green dominated light environments in their natural ecosystem. A study by Sierra-Flores et al. (2016) on cod and turbot larvae also showed improved growth and survival under blue/green light compared to red light. This aspect is also highlighted in a review by Villamizar et al. (2011) describing how European sea bass, Dicentrarchus labrax, and sole larvae achieved the best performance and showed the fastest development and lowest degree of deformity using blue light/dark cycles. Our present and previous results, evidencing that the early development of Senegalese sole embryos and larvae is strongly affected by light characteristics, reinforce the assumption that both light photoperiod and spectrum should be taken into account in sole rearing for the proper development of the visual opsin system.
Conclusion
In conclusion, this study provides novel results showing how visual opsin transcript levels change during Senegalese sole ontogeny depending on developmental stages and light regimes. These changes appear to be modulated by environmental, hormonal, and genetic factors. We found common trends in the expression patterns of most of the opsins analysed, with significant increases during pre-metamorphosis and after metamorphosis. Although the visual system remains functional, downregulation of all the opsins was detected during the metamorphic process. The results obtained reveal that green-cone opsins represent the most abundant photopigments in the pre-metamorphic stage, declining thereafter, with rod opsin (sensitive to light in the blue-green spectrum) being the dominant visual photopigment from the completion of metamorphosis onwards. Together with previous results, the data obtained in this study could be of basic interest for better knowledge of the metamorphic process and development of the visual system of Solea senegalensis and could also contribute to more efficient rearing of embryos, larvae, and juveniles of this species in the aquaculture industry. The present results reinforce those obtained in previous studies showing the benefits of using blue/green lights as an alternative to white lights in sole rearing protocols in the early stages. At present, LED technologies permit to adapt the lighting protocols in fish aquaculture to those encountered by the animals in the natural environment in different stages of development, which could contribute to the adequate development of their visual opsins repertoire and improve considerably animal welfare and production.
Data Availability Statement
The original contributions presented in the study are included in the article/Supplementary Material. Further inquiries can be directed to the corresponding author/s.
Ethics Statement
The animal study was reviewed and approved by the Ethics Committee of the University of Cádiz and the General Directorate for Agricultural and Livestock Production of the Regional Government of Andalusia, Spain (Approval Number 15/12/2020/142).
Author Contributions
JAM-C and ÁJM-R contributed to the conception of the study. SF and JAP-S performed the experiments and data analysis with the help of IP and MEC. SF, JAP-S, ÁJM-R, and JAM-C wrote the manuscript. All authors contributed to the article and approved the submitted version.
Funding
This work was funded by a grant from the Spanish Ministry of Science, Innovation and Universities (AGL2017-82582-C3-1-R) to JAM-C. SF was a FPI fellow funded by the CEIMAR at UCA. MEC was a recipient of a Marie Curie contract from the UE (FP7/2007-2013, Grant No. 331964).
Conflict of Interest
The authors declare that the research was conducted in the absence of any commercial or financial relationships that could be construed as a potential conflict of interest.
Publisher’s Note
All claims expressed in this article are solely those of the authors and do not necessarily represent those of their affiliated organizations, or those of the publisher, the editors and the reviewers. Any product that may be evaluated in this article, or claim that may be made by its manufacturer, is not guaranteed or endorsed by the publisher.
Acknowledgments
We would like to thank the staff from the “Planta de Cultivos Marinos” (University of Cádiz) for their help in the husbandry of the experimental animals in this developmental study. We also thank M. Manchado for the helpful assistance with sole opsin sequences.
Supplementary Material
The Supplementary Material for this article can be found online at: https://www.frontiersin.org/articles/10.3389/fmars.2022.797507/full#supplementary-material
References
Bejarano-Escobar, R., Blasco, M., DeGrip, W. J., Oyola-Velasco, J. A., Martín-Partido, G., and Francisco-Morcillo, J. (2010). Eye development and retinal differentiation in an altricial fish species, the Senegalese sole (Solea senegalensis, Kaup 1858). J. Exp. Zool. B, Mol. Dev. Evol. 314, 580–605. doi: 10.1002/jez.b.21363
Blanco-Vives, B., Aliaga-Guerrero, M., Cañavate, J. P., García-Mateos, G., Martín-Robles, A. J., Herrera-Pérez, P., et al. (2012). Metamorphosis induces a light-dependent switch in Senegalese sole (Solea senegalensis) from diurnal to nocturnal behavior. J. Biol. Rhythms. 27, 135–144. doi: 10.1177/0748730411435303
Blanco-Vives, B., Aliaga-Guerrero, M., Cañavate, J. P., Muñoz-Cueto, J. A., and Sánchez-Vázquez, F. J. (2011). Does lighting manipulation during incubation affect hatching rhythms and early development of sole? Chronobiol. Int. 28, 300–306. doi: 10.3109/07420528.2011.560316
Blanco-Vives, B., Villamizar, N., Ramos, J., Bayarri, M. J., Chereguini, O., and Sánchez-Vázquez, F. J. (2010). Effect of daily thermo- and photo-cycles of different light spectrum on the development of Senegal sole (Solea senegalensis) larvae. Aquaculture 306, 137–145.
Blaxter, J. H. S. (1969). Visual thresholds and spectral sensitivity of flatfish larvae. J. Exp. Biol. 51, 221–230. doi: 10.1242/jeb.51.1.221
Bowmaker, J. K., Semo, M., Hunt, D. M., and Jeffery, G. (2008). Eel visual pigments revisited: the fate of retinal cones during metamorphosis. Vis. Neurosci. 25, 249–255. doi: 10.1017/S0952523808080152
Campinho, M. A. (2019). Teleost metamorphosis: the role of thyroid hormone. Front. Endocrinol. 10:383. doi: 10.3389/fendo.2019.00383
Cañavate, J. P., Zerolo, R., and Fernández-Díaz, C. (2006). Feeding and development of Senegal sole (Solea senegalensis) larvae reared in different photoperiods. Aquaculture 258, 368–377.
Carleton, K. L., Escobar-Camacho, D., Stieb, S. M., Cortesi, F., and Marshall, N. J. (2020). Seeing the rainbow: mechanisms underlying spectral sensitivity in teleost fishes. J. Exp. Biol. 223, (Pt 8):jeb193334. doi: 10.1242/jeb.193334
Chang, C.-H., and Yan, H. Y. (2019). Plasticity of opsin gene expression in the adult red shiner (Cyprinellalutrensis) in response to turbid habitats. PLoS One 14:e0215376. doi: 10.1371/journal.pone.0215376
Chen, S., Zhang, G., Shao, C., Huang, Q., Liu, G., Zhang, P., et al. (2014). Whole-genome sequence of a flatfish provides insights into ZW sex chromosome evolution and adaptation to a benthic lifestyle. Nat. Genet. 46, 253–260. doi: 10.1038/ng.2890
Cheng, C. L., and Novales Flamarique, I. (2004). Opsin expression: new mechanism for modulating colour vision. Nature 428:279. doi: 10.1038/428279a
Cheng, C. L., Gan, K. J., and Flamarique, I. N. (2009). Thyroid hormone induces a time-dependent opsin switch in the retina of salmonid fishes. Invest. Ophthalmol. Vis. Sci. 50, 3024–3032. doi: 10.1167/iovs.08-2713
Davies, W. I. L., Tamai, T. K., Zheng, L., Fu, J. K., Rihel, J., Foster, R. G., et al. (2015). An extended family of novel vertebrate photopigments is widely expressed and displays a diversity of function. Genome Res. 25, 1666–1679. doi: 10.1101/gr.189886.115
De Miguel Villegas, E., Dans, M. J. D., Paz-Andrade Castillo, C., and Alvarez, R. A. (1997). Development of the eye in the turbot Psetta maxima (Teleosti) from hatching through metamorphosis. J. Morphol. 233, 31–42. doi: 10.1002/(SICI)1097-4687(199707)233:1<31::AID-JMOR3>3.0.CO;2-R
Douglas, R. H., Hunt, D. M., and Bowmaker, J. K. (2003). “Spectral sensitivity tuning in the deep-sea,” in Sensory Processing in Aquatic Environments, eds S. P. Collin and N. J. Marshall (New York, NY: Springer), 323–342.
Doxaran, D., Froidefond, J.-M., and Castaing, P. (2002). A reflectance band ratio used to estimate suspended matter concentrations in sediment-dominated coastal waters. Int. J. Remote Sensing 23, 5079–5085.
Dufour, S., Rousseau, K., and Kapoor, B. G. (2012). Metamorphosis in Fish. Boca Raton, FL: CRC Press.
Ehlman, S. M., Sandkam, B. A., Breden, F., and Sih, A. (2015). Developmental plasticity in vision and behavior may help guppies overcome increased turbidity. J. Comp. Physiol. A Neuroethol. Sens. Neural. Behav. Physiol. 201, 1125–1135. doi: 10.1007/s00359-015-1041-4
El M’Rabet, A., Confente, F., Ouarour, A., and Muñoz-Cueto, J. A. (2008). “Ontogenia del órgano pineal del lenguado, Solea senegalensis”, in Avances en Endocrinología Comparada, eds J.A. Muñoz-Cueto, J.M. Mancera, and G. Martínez (Cádiz: Servicio de Publicaciones de la Universidad de Cádiz), 4, 179–181.
Evans, B. I., and Fernald, R. D. (1990). Metamorphosis and fish vision. J. Neurobiol. 21, 1037–1052. doi: 10.1002/neu.480210709
Evans, B. I., Hárosi, F. I., and Fernald, R. D. (1993). Photoreceptor spectral absorbance in larval and adult winter flounder (Pseudopleuronectes americanus). Vis. Neurosci. 10, 1065–1071. doi: 10.1017/s0952523800010178
Evans, B., and Browman, H. (2004). Variation in the development of the fish retina. Am. Fish. Soc. Symp. 40, 145–166.
Falk-Petersen, I. B. (2005). Comparative organ differentiation during early life stages of marine fish. Fish Shellfish Immunol. 19, 397–412. doi: 10.1016/j.fsi.2005.03.006
Fernández-Díaz, C., Yúfera, M., Cañavate, J. P., Moyano, F. J., Alarcón, F. J., and Díaz, M. (2001). Growth and physiological changes during metamorphosis of Senegal sole reared in the laboratory. J. Fish Biol. 58, 1086–1097. doi: 10.1111/j.1095-8649.2001.tb00557.x
Ferraresso, S., Bonaldo, A., Parma, L., Cinotti, S., Massi, P., Bargelloni, L., et al. (2013). Exploring the larval transcriptome of the common sole (Solea solea L.). BMC Genomics 14:315. doi: 10.1186/1471-2164-14-315
Frau, S., Flamarique, I. N., Keeley, P. W., Reese, B. E., and Muñoz-Cueto, J. A. (2020a). Straying from the flatfish retinal plan: cone photoreceptor patterning in the common sole (Solea solea) and the Senegalese sole (Solea senegalensis). J. Comp. Neurol. 528, 2283–2307. doi: 10.1002/cne.24893
Frau, S., Loentgen, G., Martín-Robles, ÁJ., and Muñoz-Cueto, J. A. (2020b). Ontogenetic expression rhythms of visual opsins in Senegalese sole are modulated by photoperiod and light spectrum. J. Comp. Physiol. B. 190, 185–204. doi: 10.1007/s00360-020-01264-7
Galay-Burgos, M., Power, D. M., Llewellyn, L., and Sweeney, G. E. (2008). Thyroid hormone receptor expression during metamorphosis of Atlantic halibut (Hippoglossushippoglossus). Mol. Cell. Endocrinol. 281, 56–63.
Geffen, A. J., van der Veer, H. W., and Nash, R. D. M. (2007). The cost of metamorphosis in flatfishes. J. Sea Res. 58, 35–45. doi: 10.1016/j.seares.2007.02.004
Govoni, J. J., Boehlert, G. W., and Watanabe, Y. (1986). The physiology of digestion in fish larvae. Environ. Biol. Fish. 16, 59–77. doi: 10.1007/bf00005160
Helvik, J. V., Drivenes, Ø, Harboe, T., and Seo, H.-C. (2001a). Topography of different photoreceptor cell types in the larval retina of Atlantic halibut (Hippoglossus hippoglossus). J. Exp. Biol. 204, 2553–2559.
Helvik, J. V., Drivenes, Ø, Næss, T. H., Fjose, A., and Seo, H.-C. (2001b). Molecular cloning and characterization of five opsin genes from the marine flatfish Atlantic halibut (Hippoglossus hippoglossus). Vis. Neurosci. 18, 767–780. doi: 10.1017/s095252380118510x
Hoke, K. L., Evans, B. I., and Fernald, R. D. (2006). Remodeling of the cone photoreceptor mosaic during metamorphosis of flounder (Pseudopleuronectes americanus). Brain Behav. Evol. 68, 241–254. doi: 10.1159/000094705
Howell, B. R., and Dinis, M. T. (2019). “An overview of soleid (Pleuronectiformes) fisheries and aquaculture,” in The Biology of Sole, eds J. A. Muñoz-Cueto, E. L. Mañanos-Sánchez, and F. J. Sánchez-Vázquez (Boca Raton, FL: CRC Press, Taylor & Francis Group), 3–22.
Infante, C., Matsuoka, M. P., Asensio, E., Cañavate, J. P., Reith, M., and Manchado, M. (2008). Selection of housekeeping genes for gene expression studies in larvae from flatfish using real-time PCR. BMC Mol. Biol. 9:28. doi: 10.1186/1471-2199-9-28
Isorna, E., Aliaga-Guerrero, M., M’Rabet, A. E., Servili, A., Falcón, J., and Muñoz-Cueto, J. A. (2011). Identification of two arylalkylamine N-acetyltranferase 1 genes with different developmental expression profiles in the flatfish Solea senegalensis. J. Pineal Res. 51, 434–444. doi: 10.1111/j.1600-079X.2011.00907.x
Isorna, E., M’Rabet, A. E., Confente, F., Falcón, J., and Muñoz-Cueto, J. A. (2009). Cloning and expression of arylalkylamine N-acetyltranferase-2 during early development and metamorphosis in the sole Solea senegalensis. Gen. Comp. Endocrinol. 161, 97–102. doi: 10.1016/j.ygcen.2008.10.007
Iwanicki, T. W., Flamarique, I. N., Ausiü, J., Morris, E., and Taylor, J. S. (2017). Fine-tuning light sensitivity in the starry flounder (Platichthys stellatus) retina: regional variation in photoreceptor cell morphology and opsin gene expression. J. Comp. Neurol. 525, 2328–2342. doi: 10.1002/cne.24205
Klaren, P. H. M., Wunderink, Y. S., Yúfera, M., Mancera, J. M., and Flik, G. (2008). The thyroid gland and thyroid hormones in Senegalese sole (Solea senegalensis) during early development and metamorphosis. Gen. Comp. Endocrinol. 155, 686–694. doi: 10.1016/j.ygcen.2007.09.014
Kvenseth, A. M., Pittman, K., and Helvik, J. V. (1996). Eye development in Atlantic halibut (Hippoglossus hippoglossus): differentiation and development of the retina from early yolk sac stages through metamorphosis. Can. J. Fish. Aquat. Sci. 53, 2524–2532. doi: 10.1139/f96-205
Lan-Chow-Wing, O., Confente, F., Herrera-Pérez, P., Isorna, E., Chereguini, O., Rendón, M. C., et al. (2014). Distinct expression profiles of three melatonin receptors during early development and metamorphosis in the flatfish Solea senegalensis. Int. J. Mol. Sci. 15, 20789–20799. doi: 10.3390/ijms151120789
Livak, K. J., and Schmittgen, T. D. (2001). Analysis of relative gene expression data using real-time quantitative PCR and the 2(-Delta Delta C(T)) Method. Methods 25, 402–408. doi: 10.1006/meth.2001.1262
Mader, M. M., and Cameron, D. A. (2004). Photoreceptor differentiation during retinal development, growth, and regeneration in a metamorphic vertebrate. J. Neurosci. 24, 11463–11472. doi: 10.1523/JNEUROSCI.3343-04.2004
Mader, M. M., and Cameron, D. A. (2006). Effects of induced systemic hypothyroidism upon the retina: regulation of thyroid hormone receptor alpha and photoreceptor production. Mol. Vis. 12, 915–930.
Martín-Robles, ÁJ., Aliaga-Guerrero, M., Whitmore, D., Pendón, C., and Muñoz-Cueto, J. A. (2012). The circadian clock machinery during early development of Senegalese sole (Solea senegalensis): effects of constant light and dark conditions. Chronobiol. Int. 29, 1195–1205. doi: 10.3109/07420528.2012.719963
Martín-Robles, ÁJ., Whitmore, D., Pendón, C., and Muñoz-Cueto, J. A. (2013). Differential effects of transient constant light-dark conditions on daily rhythms of Period and Clock transcripts during Senegalese sole metamorphosis. Chronobiol. Int. 30, 699–710. doi: 10.3109/07420528.2013.782313
Matsuda, K., Torisawa, S., Hiraishi, T., and Yamamoto, K. (2008). Comparison of visual acuity and visual axis of three flatfish species with different ecotypes. Fish. Sci. 74, 562–572. doi: 10.1111/j.1444-2906.2008.01559.x
Muñoz-Cueto, J. A., Mañanos-Sánchez, E. L., and Sánchez-Vázquez, F. J. (2019). The Biology of Sole. Boca Raton: CRC Press, Taylor & Francis Group.
Musilova, Z., Cortesi, F., Matschiner, M., Davies, W. I. L., Patel, J. S., Stieb, S. M., et al. (2019). Vision using multiple distinct rod opsins in deep-sea fishes. Science 364, 588–592. doi: 10.1126/science.aav4632
Musilova, Z., Salzburger, W., and Cortesi, F. (2021). The visual opsin gene repertoires of teleost fishes: evolution, ecology, and function. Annu. Rev. Cell. Dev. Biol. 37, 441–468. doi: 10.1146/annurev-cellbio-120219-024915
Novales Flamarique, I. (2013). Opsin switch reveals function of the ultraviolet cone in fish foraging. Proc. Royal Soc. B: Biol. Sci. 280:20122490. doi: 10.1098/rspb.2012.2490
Padrós, F., Villalta, M., Gisbert, E., and Estévez, A. (2011). Morphological and histological study of larval development of the Senegal sole Solea senegalensis: an integrative study. J. Fish Biol. 79, 3–32. doi: 10.1111/j.1095-8649.2011.02942.x
Ribeiro, L., Zambonino-Infante, J. L., Cahu, C., and Dinis, M. T. (1999). Development of digestive enzymes in larvae of Solea senegalensis, Kaup 1858. Aquaculture 179, 465–473. doi: 10.1016/j.cbpb.2014.11.011
Rodríguez-Gómez, F. J., Sarasquete, C., and Muñoz-Cueto, J. A. (2000). A morphological study of the brain of Solea senegalensis. I. the telencephalon. Histol. Histopathol. 15, 355–364. doi: 10.14670/HH-15.355
Rosa, V. D., Frigato, E., López-Olmeda, J. F., Sánchez-Vázquez, F. J., and Bertolucci, C. (2015). The light wavelength affects the ontogeny of clock gene expression and activity rhythms in zebrafish larvae. PLoS One 10:e0132235. doi: 10.1371/journal.pone.0132235
Sarasquete, C., Gisbert, E., and Ortiz-Delgado, J. B. (2019). “Embryonic and larval ontogeny of the Senegalese sole, Solea senegalensis: normal patterns and pathological alterations,” in The Biology of Sole, eds J. A. Muñoz-Cueto, E. L. Mañanos-Sánchez, and F. J. Sánchez-Vázquez (Boca Raton, FL: CRC Press, Taylor & Francis Group), 216–252. doi: 10.1201/9781315120393-11
Savelli, I., Novales Flamarique, I., Iwanicki, T., and Taylor, J. S. (2018). Parallel opsin switches in multiple cone types of the starry flounder retina: tuning visual pigment composition for a demersal life style. Sci. Rep. 8:4763. doi: 10.1038/s41598-018-23008-y
Servili, A., Herrera-Pérez, P., Kah, O., and Muñoz-Cueto, J. A. (2012). The retina is a target for GnRH-3 system in the European sea bass, Dicentrarchus labrax. Gen. Comp. Endocrinol. 175, 398–406. doi: 10.1016/j.ygcen.2011.11.007
Sierra-Flores, R., Davie, A., Grant, B., Carboni, S., Atack, T., and Migaud, H. (2016). Effects of light spectrum and tank background colour on Atlantic cod (Gadus morhua) and turbot (Scophthalmus maximus) larvae performance. Aquaculture 450, 6–13. doi: 10.1016/j.aquaculture.2015.06.041
Steindal, I. A. F., and Whitmore, D. (2020). Zebrafish circadian clock entrainment and the importance of broad spectral light sensitivity. Front. Physiol. 11:1002. doi: 10.3389/fphys.2020.01002
Tamai, T. K., Carr, A. J., and Whitmore, D. (2005). Zebrafish circadian clocks: cells that see light. Biochem. Soc. Trans. 33, 962–966. doi: 10.1042/BST20050962
Temple, S. E., Veldhoen, K. M., Phelan, J. T., Veldhoen, N. J., and Hawryshyn, C. W. (2008). Ontogenetic changes in photoreceptor opsin gene expression in coho salmon (Oncorhynchus kisutch. Walbaum). J. Exp. Biol. 211, 3879–3888. doi: 10.1242/jeb.020289
Valen, R., Edvardsen, R. B., Søviknes, A. M., Drivenes, Ø, and Helvik, J. V. (2014). Molecular evidence that only two opsin subfamilies, the blue light- (SWS2) and green light-sensitive (RH2), drive color vision in Atlantic cod (Gadus morhua). PLoS One 9:e115436. doi: 10.1371/journal.pone.0115436
Valen, R., Karlsen, R., and Helvik, J. V. (2018). Environmental, population and life-stage plasticity in the visual system of Atlantic cod. J. Exp. Biol. 221, (Pt1):jeb165191. doi: 10.1242/jeb.165191
Veldhoen, K., Allison, W. T., Veldhoen, N., Anholt, B. R., Helbing, C. C., and Hawryshyn, C. W. (2006). Spatio-temporal characterization of retinal opsin gene expression during thyroid hormone-induced and natural development of rainbow trout. Vis. Neurosci. 23, 169–179. doi: 10.1017/S0952523806232139
Vergès-Castillo, A., González-Vargas, I. A., Muñoz-Cueto, J. A., Martín-Robles, ÁJ., and Pendón, C. (2021). Establishment and characterisation of single cell-derived embryonic stem cell lines from the gilthead seabream, Sparus aurata. Comp. Biochem. Physiol. B, Biochem. Mol. Biol. 256:110626. doi: 10.1016/j.cbpb.2021.110626
Villamizar, N., Blanco-Vives, B., Migaud, H., Davie, A., Carboni, S., and Sánchez-Vázquez, F. J. (2011). Effects of light during early larval development of some aquaculturedteleosts: a review. Aquaculture 315, 86–94.
Villamizar, N., Blanco-Vives, B., Oliveira, C., Dinis, M. T., Rosa, V. D., Negrini, P., et al. (2013). Circadian rhythms of embryonic development and hatching in fish: a comparative study of zebrafish (diurnal), Senegalese sole (nocturnal), and Somalian cavefish (blind). Chronobiol. Int. 30, 889–900. doi: 10.3109/07420528.2013.784772
Wang, Y., Zhou, L., Wu, L., Song, C., Ma, X., Xu, S., et al. (2021). Evolutionary ecology of the visual opsin gene sequence and its expression in turbot (Scophthalmus maximus). BMC Ecol. Evol. 21:114. doi: 10.1186/s12862-021-01837-1832
Whitmore, D., Foulkes, N. S., and Sassone-Corsi, P. (2000). Light acts directly on organs and cells in culture to set the vertebrate circadian clock. Nature 404, 87–91. doi: 10.1038/35003589
Keywords: ontogeny, photoreception, flatfish metamorphosis, retina, cones, rods (retina), sole (Solea senegalensis)
Citation: Frau S, Paullada-Salmerón JA, Paradiso I, Cowan ME, Martín-Robles ÁJ and Muñoz-Cueto JA (2022) From Embryo to Adult Life: Differential Expression of Visual Opsins in the Flatfish Solea senegalensis Under Different Light Spectra and Photoperiods. Front. Mar. Sci. 9:797507. doi: 10.3389/fmars.2022.797507
Received: 18 October 2021; Accepted: 17 January 2022;
Published: 18 March 2022.
Edited by:
Enric Gisbert, Institute of Agrifood Research and Technology (IRTA), SpainReviewed by:
Ignacio Fernández, Instituto Tecnológico Agrario de Castilla y León, SpainF. Javier Sanchez Vazquez, University of Murcia, Spain
Copyright © 2022 Frau, Paullada-Salmerón, Paradiso, Cowan, Martín-Robles and Muñoz-Cueto. This is an open-access article distributed under the terms of the Creative Commons Attribution License (CC BY). The use, distribution or reproduction in other forums is permitted, provided the original author(s) and the copyright owner(s) are credited and that the original publication in this journal is cited, in accordance with accepted academic practice. No use, distribution or reproduction is permitted which does not comply with these terms.
*Correspondence: Águeda J. Martín-Robles, agueda.jimena@uca.es; José A. Muñoz-Cueto, munoz.cueto@uca.es
†These authors have contributed equally to this work and share first authorship