A new setup to study the influence of plant growth on the consolidation of dredged cohesive sediment
 Maria Barciela-Rial1,2*
  Remon M. Saaltink3,4
  Thijs van Kessel5
  Claire Chassagne1
  Stefan C. Dekker3,6
  Hugo J. de Boer3 Jasper Griffioen3,7 Martin J. Wassen2
  Johan C. Winterwerp1
- 1Hydraulic Engineering, Faculty of Civil Engineering and Geosciences, Delft University of Technology, Delft, Netherlands
- 2Sustainable River Management, Built Environment Academy, HAN University of Applied Sciences, Arnhem, Netherlands
- 3Copernicus Institute of Sustainable Development, Faculty of Geosciences, Utrecht University, Utrecht, Netherlands
- 4Arcadis Nederland, Water, Climate and Landscape, Arnhem, Netherlands
- 5Deltares, Delft, Netherlands
- 6Faculty of Management, Science and Technology, Open University, Heerlen, Netherlands
- 7TNO Geological Survey of the Netherlands, Utrecht, Netherlands
Dredged cohesive sediment is progressively being used for wetland construction. However, little is known about the effect of plant growth during the self-weight consolidation of this sediment. In order to check the feasibility of such a study, a new experimental setup has been constructed. As an example, the effect of Phragmites australis on the consolidation and drainage of dredged sediment from Lake Markermeer, the Netherlands was investigated. The changes in pore water pressures at 10 cm depth intervals during a 129-day period in a column with and without plants were measured, while the water level was fixed at a constant level. Water loss via evaporation and plant transpiration was measured using Mariotte bottles and the photosynthetic processes — including plant transpiration — were measured with a LI-COR photosynthesis system. The results show that several processes initiated by Phragmites australis interfere with the physical processes involved in sediment drainage and consolidation. Phragmites australis effectively altered the pore pressure gradient via water extraction, especially between 40 and 60 cm from the bottom of the column. In this zone, daily cycles in pore pressures were observed which could directly be linked to the diurnal cycle of stomatal gas exchange. On average, water loss via evaporation and transpiration of leaves of Phragmites australis amounted to 3.9 mm day−1, whereas evaporation of bare soil amounted on average to 0.6 mm day−1. The depth-averaged hydraulic conductivity increased on average by 40% in presence of Phragmites australis. This pilot experiment confirms that the pressures sensors coupled with the new set-up enable to study pore pressure development over time and to link the effect of plant growth with alterations in water pressures profiles. A more systematic study with this set-up will in the future enable to quantify the effects of plant growth on consolidation.
1 Introduction
The construction of wetlands with soft cohesive sediment has become increasingly important worldwide (Derrick et al., 2007; Mitsch et al., 2012). An example is the Marker Wadden pilot: a new wetland constructed in Lake Markermeer, Netherlands, with dredged cohesive sediment from the bed of the lake itself (Barciela-Rial et al., 2022).
Cohesive sediment deposits consolidate primarily via self-weight consolidation (Gibson et al., 1967; Been and Sills, 1981; Winterwerp and van Kesteren, 2004). This consolidation process can be speeded up by sediment drainage via artificial drains or water uptake of plant roots. The reduction of the water content by drainage increases the erosion threshold, vane strength, and overall stability soon after construction (Fagherazzi and Furbish, 2001; Chen et al., 2012). In the present Marker Wadden study, the influence of the local plant species Phragmites australis (P. australis, common reed) is investigated.
Most studies on P. australis focus on the behavior of plants in different habitats (An et al., 2020; Armstrong et al., 2000) or water uptake (Garcia-Avila et al., 2019; Liu et al., 2021) but never in relation to changes in the soil properties. Little is known about the potential effect of living plant roots on the consolidation process in soft cohesive sediments, especially due to the superposition of different physical processes induced by plant roots: mechanical armoring (Waldron and Dakessian, 1982; Friend et al., 2003; Reubens et al., 2007), compaction of clay particles in the vicinity of roots (Dorioz et al., 1993), and water uptake by the roots (drainage). It is known that water uptake during vegetative development is nonlinear. During vegetative development, the increase in transpirational water loss is compensated by an increase in water uptake by roots, which is mainly achieved by increasing the root surface area (Suku et al., 2014). As roots elongate, the zone in soils where water is most actively being taken up may change because roots are more porous near their tips (Sanderson, 1983; Zwieniecki et al., 2002). Hence, the part of the sediment drained by plant roots is expected to change horizontally and vertically over time (Gerke and Kuchenbuch 2007). Field studies have found that vegetation-induced suction reduces pore water pressure (Lim et al., 1996; Smethurst et al., 2006; Leung et al., 2015).
In this study, a proof of concept is presented: a new setup was designed to study the influence of root growth on the consolidation of natural cohesive sediments. This new setup is applied to the Marker Wadden sediment as a case study. The effect of root growth and drainage induced by P. australis on the consolidation of the dredged sediment is investigated. The evolution of pore water pressures, the settling, and the water loss were recorded in a column with vegetation and a control column without vegetation. This study isolates the effects of plant roots and plant water uptake, thereby enhancing the understanding of the important plant–sediment interactions in terms of consolidation. Therefore, the effect of P. australis growth on the consolidation process of newly constructed wetlands can be assessed.
2 Material and methods
2.1 Material sampling and characterization
The sediment and water used in this study were collected from Lake Markermeer at coordinates 52.54622oN, 5.38783oE. The upper layer of the lake bed consists of a thin (circa 0.1 m) layer of soft sediment, under which a thick layer of Holocene deposits (clay–silt mixtures, peat, or sand) is present (Rijkswaterstaat, 1995). Deep Holocene sediment was dredged with a Van Veen grab after removing 1.0 m of the uppermost sediment layer, at which the sampling location corresponded with sand. The sediment studied was sampled at a depth of 1.0–3.0 m of the bed lake, and its characteristics are summarized in Table 1. Particle size was determined using a hydrometer and dry sieving, according to the British Standards Institute (1990). The total organic matter (TOM) content was obtained by loss on ignition (LOI), according to the European Standard (EN, 2012). The particle density was measured using a gas pycnometer (ISO/TS, 2004). The Atterberg limits [liquid limit (LL), plastic limit (PL), and plasticity index (PI)] were determined according to the British Standards Institute (1990). The LL was determined with the Casagrande apparatus and the PL with the rolling thread test.

TABLE 1. Sediment properties.
2.2 A new experimental setup
Consolidation experiments were conducted using Perspex (methyl methacrylate) columns (inner diameter of 10 cm, height of 120 cm) in the Fluid Mechanics Laboratory of the Delft University of Technology. A hollow stainless steel pipe (outer diameter of 2 cm, inner diameter of 1 cm) was fixed in the middle of each Perspex column to control boundary conditions (Barciela Rial et al., 2015). This stainless steel pipe contained Vyon 3.2D filters in its wall, allowing the water resupply of the sediment columns. These filters control the water table and prevent sediment from leaking into the pipe. This pipe is referred to as a drainage pipe. In order to induce the constant water table at the desired level in the Perspex columns, the bottom of the drainage pipe was connected to a water column that contained Markermeer water at a fixed level of 77 cm. This water column controlled the water level inside the drainage pipe. Because of water loss via plant transpiration, evaporation, or both, water flowing from this water column to the drainage pipe was automatically replenished from a Mariotte bottle containing Markermeer water (Figure 1).
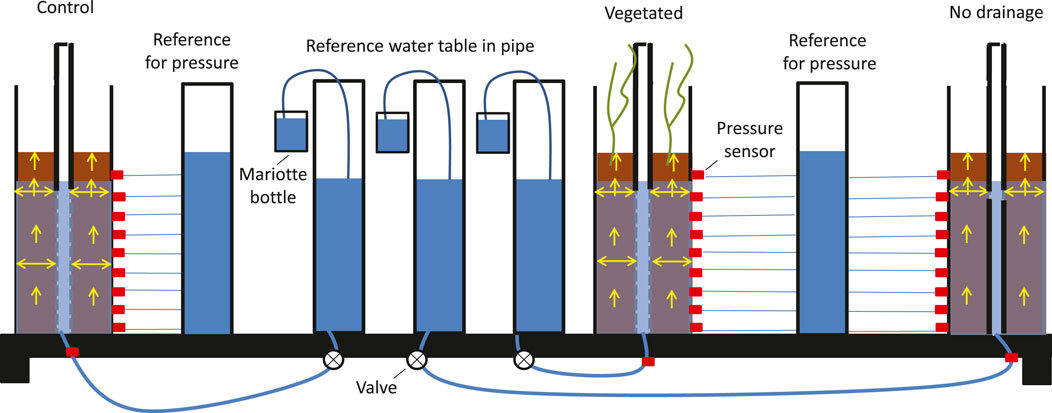
FIGURE 1. Sketch of the setup, including three columns filled with dredged sediment: a control column (only sediment, no vegetation), a vegetated column, and a control column with no drainage. The columns are equipped with pressure sensors (red squares) and a drainage pipe to induce a constant water table in all the columns. The water table in all the drainage pipes is induced at 77 cm by connecting them to a column with a reference and constant water table. Each column is connected to its own reference water table to measure the water flows. These water flows are measured with Mariotte bottles that keep the reference water table constant and allow quantifying water transport. For the control and the vegetated columns, the drainage pipe is permeable over a length of 72 cm. For the column without drainage, horizontal flow is only allowed between 70 and 72 cm to prescribe the same reference water table of 77 cm. All pressure measurements are taken relative to a column with constant water height and pressure to increase accuracy.
Six Perspex columns were used in two experimental runs (Table 2). Four columns with plants were harvested in experiment 1 to determine root and shoot variables, whereas two columns were left intact and used for pore pressure measurements. One of the two columns for pore pressure measurements was left unplanted (control column), and the other column was planted with reed (vegetated column). Experiment 1 was conducted in the laboratory hall from November 2016 to February 2017 (118 days), with temperatures of 15°C–20°C, averaging at 17.3°C. The average relative humidity was 72%, fluctuating between 50% and 80%. Because the pressure sensors are very sensitive to small changes in temperature and marginal changes in the water table were recorded, it was decided to repeat the experiment in a climate room. Experiment 2 lasted from March 2017 to August 2017 (t = 129 days). The environmental conditions in the climate room were kept constant at the average conditions measured in the laboratory hall. In both experimental runs, a grow light (Spectrabox Gold) was installed at the same height and with the same day–night cycles. Because the variation in temperature (±5°C) and humidity in the laboratory hall were small, the morphological root and shoot traits measured in the first experimental run could be linked to the changes in pore pressure of the sediment in the second experimental run.
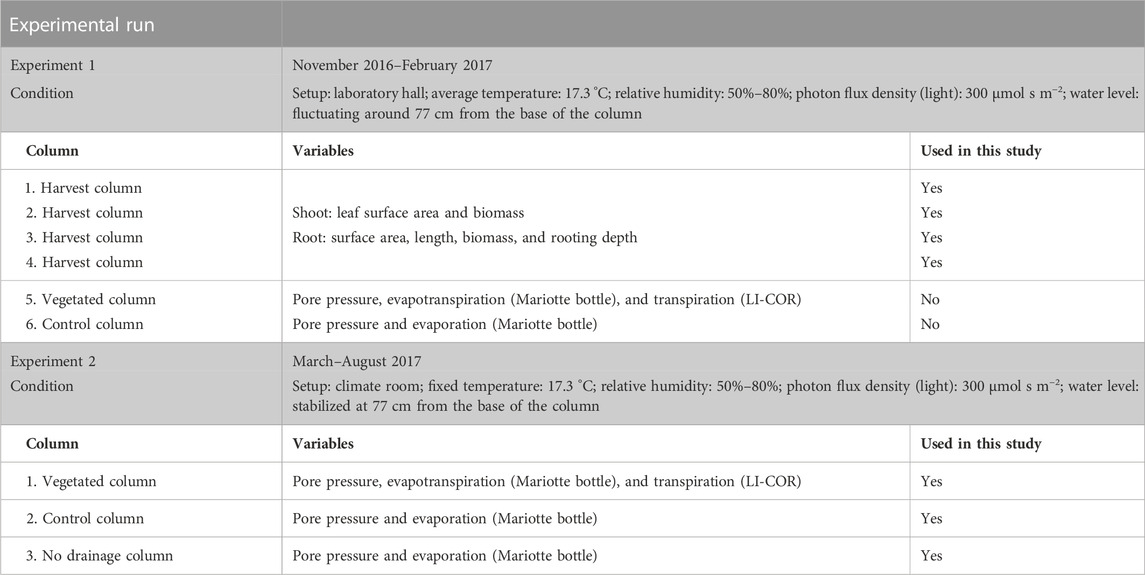
TABLE 2. Description of the two experimental runs that are part of this study.
The columns used for pore pressure measurements were installed with 0.5 Pa Honeywell differential pressure sensors at 0.4, 10.4, 20.4, 30.4, 40.4, 50.4, 60.4, 70.4, and 80.4 cm from the base of the column. All the sensors were provided with a degassing system to avoid inaccuracy induced by air. Furthermore, a Vyon 3.2D filter was installed at each connection point of the sensor to measure pore water pressure (instead of total pressure) and prevent the clay from going through the sensor. All the pressure sensors were connected to a reference column filled with a constant water level to increase the accuracy by measuring differential pressures, thus measuring relative overpressures (Figure 1). All pressure sensors were calibrated before and after the experiment. These two sets of calibrations were compared to assure that the pressure sensors were functioning properly throughout the experiment. Pressure sensors that afterward responded differently to pressure changes were omitted from further analysis: these were the sensors installed at 20.4 and 70.4 cm in the control column and 30.4 cm in the vegetated column. The pressure sensor calibration procedure is detailed in Supplementary Section S1.
The Perspex columns were filled with dredged sediment from Lake Markermeer. The sediment was thoroughly mixed before pouring it into the columns. The measured gravimetric water content of the mixture was 66.7% (water mass/total mass, determined by oven drying). The measured particle density was determined with a gas pycnometer and amounted to 2,590 kg m−3. These water content and particle density correspond with an initial bulk density of the mixture of 1,260 kg m−3, and the initial concentration of solids was 423 g L−1. The sediment was placed in the columns and remixed. After remixing, the suspension height was 118,0 cm in all columns.
Before starting the experiments, the sediment was allowed to settle and consolidate for 14 days, during which the sediment surface lowered to 92.5 cm in the control column and 92.3 cm in the vegetated column (but still without vegetation). Because this 2 mm difference between the columns is likely the result of irregularities of the bed surface at the measurement location, the consolidation rates in the two columns were considered the same, thus showing the reproducibility of the consolidation experiments. After 14 days, the supernatant water was removed from above the sediment without disturbing the consolidating sediment, and plants were transplanted in the vegetated column. This water corresponds to pore water squeezed out during self-weight consolidation. The removal of water from above the sediment marks the start of the experiment (time = 0 days). The mean bulk density of the sediment at t = 0 was 1,332 kg m−3 for both columns.
In both experiments, three shoots (size of 2 cm) of Phragmites australis (common reed) were transplanted into the vegetated column and the harvest columns (Table 2) (t = 0 days). A grow light (Spectrabox Gold) with a photon flux density of 300 μmol s m−2 was installed at the height of 123 cm above the sediment surface. The day–night cycles, which are important for plant development, were the same in both experimental runs: 8 h with the light off and 16 h with the light on. The climate room was surrounded by a white cover to maximize irradiance from the grow light. A ventilator constantly blew within the climate room to ensure air circulation.
The drainage pipe in the control column and the columns with plants was permeable between 0 cm (i.e., the bottom of the column) and 72 cm. An extra column with a drainage pipe only permeable between 70 and 72 cm was monitored to check if and how the drainage pipe of the experimental setup affected the consolidation of the sediment. Therefore, this third column is referred to as a column without drainage in this study. Because the consolidating sediment was connected through 2 cm (between 70 and 72 cm) with the reference water table of 77 cm, the same water table as for the other two columns could be prescribed. The water balance and settling behavior in this column without drainage were compared with those in the control and vegetated columns.
2.2.1 Hydraulic conductivity equation
Pore pressure data from the sensors were transferred to a PC using an analog–digital converter and stored every second by DASYLab software (DASYLab, 2020). Unfortunately, some data gaps occurred due to connection problems of the sensors to the computer. From the 129 experimental days, pore pressure data were recorded for 69 days. Data gaps were evenly distributed, as shown in Supplementary Section S3. The quality and the resolution of the data were sufficient to capture temporal changes in pore pressure due to plant transpiration. The hydraulic conductivity (k) in both columns can be calculated from the pore pressure data and the water losses. As the horizontal spatial scales are much smaller than the vertical scales, drainage occurs preliminary in the horizontal plane (i.e., via the drainage pipe in the center of the column). Thus, the continuity equation on cylindrical coordinates was solved, accounting for radial pore water flow toward the drainage pipe, and the following equation can be used to determine the hydraulic conductivity (see Barciela Rial, 2019 and Supplementary Material for equation derivation):
Here, k is the hydraulic conductivity in m s−1, ρ is the density of water (kg m−3), g is the acceleration of gravity (m s−2), r represents radial coordinate, ΔP (Pa) is the pressure difference between the measured pressure at the column wall (r = R) and the pressure in the porous pipe (r = r0), Q0 is the measured flow (m3 s−1), R is the radius of the column, r0 is the radius of the drainage pipe, and H is the drainage length.
2.2.2 Monitoring of vegetation growth
At experimental time t = 40, 71, 88, and 102 days, one column was harvested in experimental run 1 to measure root and shoot parameters. Above-ground biomass was cut off, after which the photosynthetic area was measured immediately. Plant tissue was air-dried at 70°C for 48 h to determine its dry weight. The leaf per mass area (LMA) was calculated. Samples of 5 cm sediment were serrated from the column, after which the roots were sieved from the sediment. The root surface area, root length, and root volume in each sample were determined with SmartRoot in ImageJ (Lobet et al., 2011). The dry weight mass of the roots was determined per sample after drying, following the same procedure as the above-ground biomass.
Plant transpiration and photosynthetic activity were measured on three leaves per plant per column using the LI-COR portable photosynthesis system (LI-COR 6400) at experimental time t = 41, 61, 81, and 97 days under constant environmental conditions. Photosynthetic parameters of P. australis were determined with the statistical package R (Duursma, 2015).
3 Results
3.1 Plant development and water uptake
Leaf area and leaf biomass increased in the first months to 406 cm2 and 1.48 g at day 88, after which leaves started to wilt and leaf area and leaf biomass decreased to 263 cm2 and 1.00 g at the end of the experiment (Table 3). It is important to note that these results represent the total of the three plants in the column because the belowground biomass of the three individual plants could not be separated.
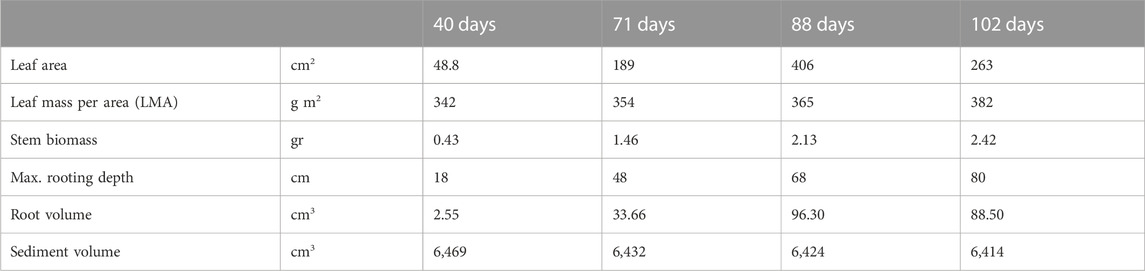
TABLE 3. Plant characteristics at 40, 71, 88, and 102 days, as measured from harvested columns.
The photosynthetic parameters measured during the experiment (see Supplementary Section S5 for a full overview) showed that P. australis behaved as expected from field conditions; the leaves were optimized to the low-light conditions in the experimental facility. Hence, the setup of the experiment did not affect stomatal gas exchange, and data from this experiment can thus be translated to field conditions.
The length, area, volume, and biomass of the roots increased with time. Figure 2 shows the growth root per time. The plant roots proliferated throughout the column and reached the bottom of the column at the end of the experiment (0 cm, day 102). However, the total volume occupied by roots is two orders of magnitude smaller than the volume of the sediment.
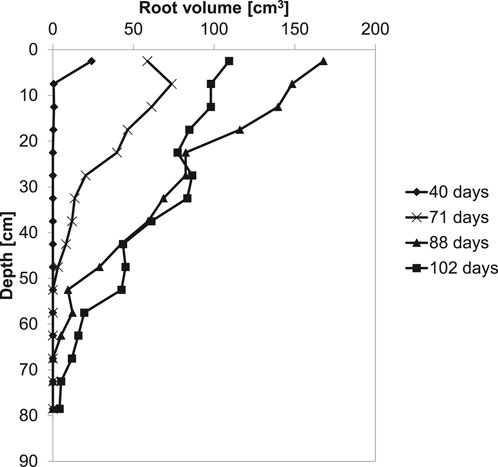
FIGURE 2. Root growth in depth per time.
Figure 3 shows the water transport measured with the Mariotte bottles for the three columns: control, no drainage, and vegetated. For the control column and the column without drainage, the measured water transport corresponds to evaporation, whereas for the vegetated column, it corresponds to evaporation and evapotranspiration. The difference between the water transport of the vegetated column and the control column is the effect of plant transpiration. At the beginning of the experiment, water flow was observed from the sediment toward the drainage pipe, and afterward, the water transport occurred in the opposite direction. All evaporation rates in the control column fall between 0.3 and 0.7 mm day−1, averaging at 0.6 mm day−1. Therefore, the characteristic evaporation rate of 0.6 mm day−1 was added to the transpiration values measured with the LI-COR system to obtain evapotranspiration.
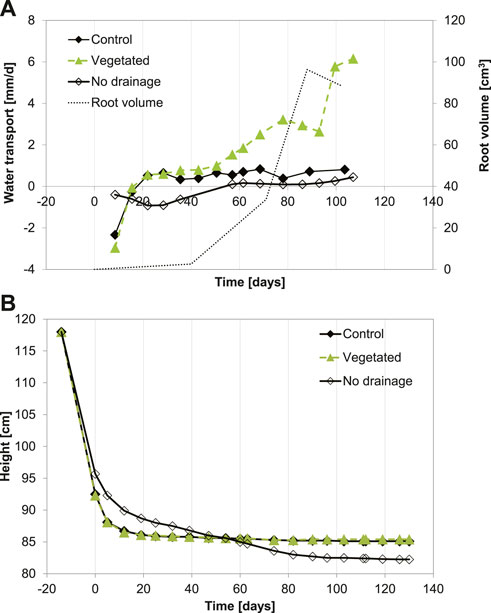
FIGURE 3. (A) Water transport and (B) bed elevation measured during the experiments. Negative values for water transport indicate flow toward the drainage pipe, and positive values indicate flow from this pipe into the sediment.
Figure 4 shows the resulting evapotranspiration values measured with the LI-COR photosynthesis system. The increasing leaf area led to a nonlinear increase in water loss via evapotranspiration. The lowest measured evapotranspiration value of 1.4 mm day−1 corresponded to a total leaf area of 31 cm2. The highest evaporation rate was found (7.7 mm day−1) at a leaf area of 276 cm2. The evapotranspiration rates did not scale linearly with leaf area, likely reflecting optimization of transpiration relative to photosynthesis over the time period when photosynthetic capacity gradually declined due to leaf maturation.
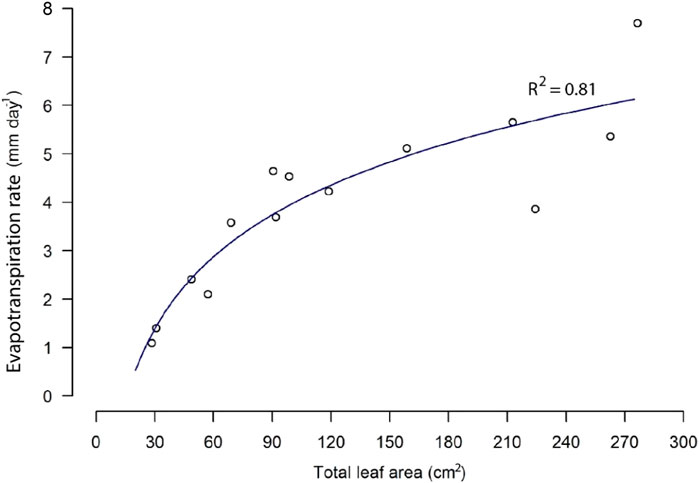
FIGURE 4. Evapotranspiration (mm day−1) as a function of total leaf area (cm2) in the vegetated column. Transpiration was measured with the LI-COIR photosynthesis system.
3.2 Bed consolidation
At the beginning of the experiment, negative water transport was measured, which indicates water flow from the sediment towards the drainage pipe due to the primary compression regime (rapid decrease in sediment bed height as a function of time), as shown in Figure 3. For the control and vegetated columns, the pore water pressures dissipated 15 days after the start of the experiment. Afterwards, the water flow was driven by evaporation (control column) and evaporation + transpiration (vegetated column). After 15 days, the water flow occurred only in the direction from the drainage pipe toward the sediment. The bed height for both columns did not vary significantly after 15 days and reached 85.5 cm at the end of the experiment. The presence of plants did not affect the bed height evolution. It was already stated that the total volume occupied by roots in the sediment could be neglected with respect to the sediment volume (Table 3). Figure 3 also shows the total evolution of the root volume with time in the vegetated column: when the volume of roots starts to grow at around 40 days, the water transport starts to increase with respect to the control column. The vegetated column reached the characteristic evaporation rate of 0.6 mm day−1 after 30 days, after which the water flux increased up to 6.2 mm day−−1 via plant transpiration. The flow in the vegetated column decreased at the end of the experiment due to the maturing of the leaves of Phragmites australis (Table 3 shows the maturation evolution of the leaves).
For the column without drainage, flow from the sediment toward the drainage pipe was observed up to 57 days since the beginning of the experiment. As shown in Figure 1, the no-drainage column is only in contact with the control column at one height, hereby limiting the exchange between the two columns. Therefore, a water return flow occurred over a large portion of the column because drainage at different depths was not possible. This resulted in a different (slower) compression for the sediment in this column compared to the vegetated and control settling columns. After 57 days, a change in slope for the bed height as a function of time (secondary compression) was observed, and there was a small flow from the drainage pipe to the sediment. After 80 days, there was an increase in the flow from the drainage pipe to the sediment, associated with a new change in the slope (the height of the bed has reached a constant value). At the end of the experiment, the water transport almost reached the value found for the control column (i.e., the value associated with daily evaporation). The bed height at the end of the experiment was 82.25 cm, lower than the bed height for the two other columns.
3.3 Pore pressures
The pore water pressure data are grouped into three different phases based on the successive stages of consolidation and drainage in the experiment. The first phase includes the data on the time steps t = 0 days and t = 1 day, during which fast initial consolidation occurred. Only data from the period t = 12–40 days are used for the second phase as we lack pore pressure data from t = 2 to t = 11 days (Supplementary Section S3). During this phase, slow consolidation occurred with little influence of plant transpiration (i.e., plant roots started to grow but did not have a big impact on pore pressure). After 40 days, the effects of plant transpiration on total pore pressure increased. Therefore, total pore pressure data on the period t = 41–129 are used for the third phase.
The pore water pressure profiles are rather identical for the two columns for phases 1 and 2 (Figures 5A, B). However, in the vegetated column, the pore pressure at the top (i.e., 2.5 cm above the water table) decreased from 1.1 kPa in phase 1 (Figure 5A) to −1.0 kPa in phase 3 (Figure 5C), while the pore pressure at the top in the control column decreased from 2.3 to 0.3 kPa. In phase 3 of the vegetated column (Figure 5C), the pore pressure decreased remarkably from 1.2 kPa at 60 cm to −0.9 kPa at 40 cm, with a peak at −1.7 kPa at t = 74 days. This reduction in pore pressure was likely caused by water uptake by plant roots as a result of an increase in the total root area (Table 3), thereby increasing water uptake from the sediment. These results show that reed altered the total pore pressure, especially between 30 and 50 cm from the bottom of the column, by water extraction via roots. The negative pore pressures at these depths suggest that the suction of water is an important process during consolidation in the presence of plants. The pore water pressure profile is led by evapotranspiration and not by self-weight consolidation since the excess pore pressure decreased at the height of the active root part, indicating water transport to the roots.
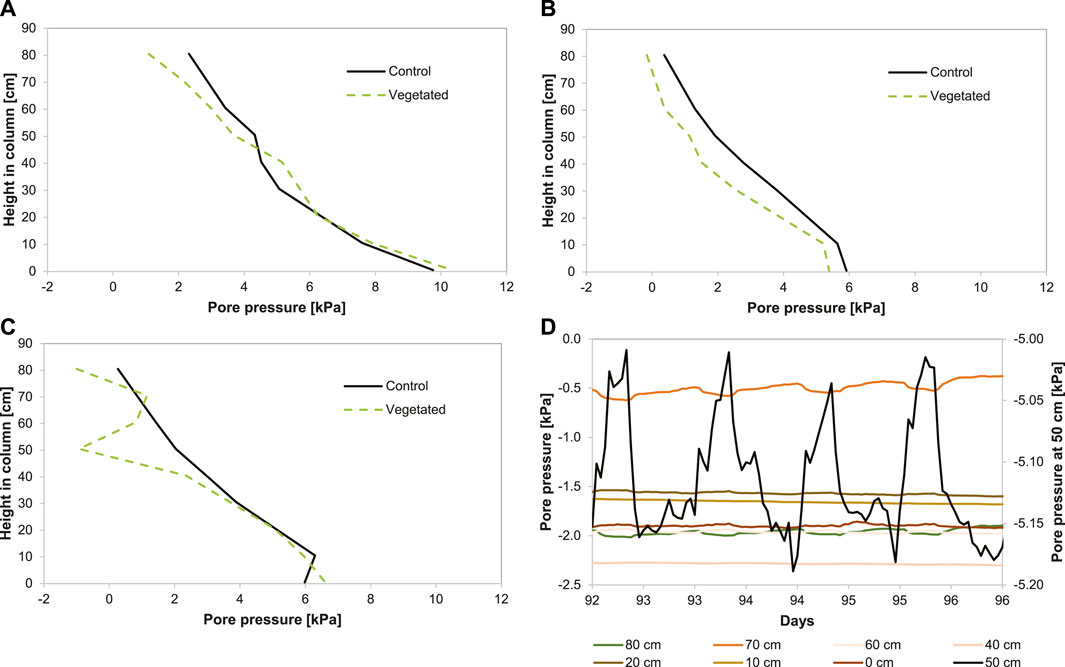
FIGURE 5. (A) Total pore pressure (kPa) in phase 1 (0–1 day) (B), phase 2 (12–40 days), (C) and phase 3 (>40 days) (D). Hourly time series (t = 92–96 days, to be compared with day >40) of pore water pressure relative to the reference column (Figure 1) for the control vegetated column. Note that the sensor at 50 cm depth has a different y-axis.
Figure 5D shows pore pressures during 6 days for the vegetated column. It shows that daily cycles are induced in the pore pressures by plants, especially between 40 and 50 cm height from the bottom of the column (Figure 5B). In the control column, no difference in pore pressure was observed between day and night. These results suggest that during the day, plants effectively lowered pore water pressure at the point where the roots were extracting most of the water (50 cm from the bottom of the column). During the night, the pore water pressures increased relative to the daytime, suggesting that the dominant flow of water at night occurs from the drainage pipe into the sediment to compensate for the water losses during the day. A reverse cycle was visible in the vegetated column at 70 cm, indicating that during the night, water flow from the drainage pipe decreased pressure values, likely because of a lowered water table due to plant drainage during the day. Water flow was likely insufficient to maintain the water table at a fixed level at short time scales because of low hydraulic conductivity.
3.4 Hydraulic conductivity
The measured water fluxes (Figure 3) were used for calculating the hydraulic conductivity using Eq. (1). The water loss via leaves (transpiration) is included in the hydraulic conductivity calculations because the sum of water losses is used in Eq. 1 (i.e., evaporation and transpiration). Thus, the hydraulic conductivity of the vegetated column is based on water transport in-between the soil particles plus water transport through the plant roots. Figure 6 shows the depth-averaged hydraulic conductivity of the control column and vegetated column for the duration of the experiment. The difference in the initial hydraulic conductivities between the control column and the vegetated column might be caused by small disturbances induced when transplanting the reed seedlings at t = 0 days. After day 30, in Phase 3, plant water uptake was observed (Figure 3), and the depth-averaged hydraulic conductivity increased on average by 40% in the presence of Phragmites australis with respect to the control column. Hydraulic conductivity averaged 1.9 × 10⁻¹⁰ m s−1 in the de vegetated column and 1.3 × 10⁻¹⁰ m s−1 in the control column.
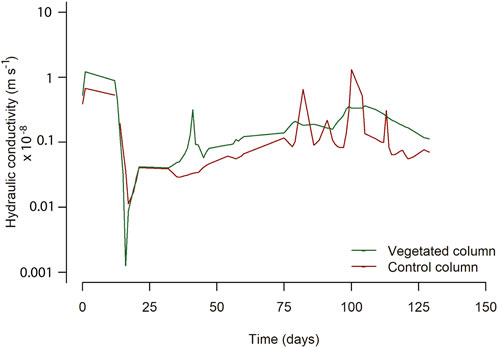
FIGURE 6. Depth-averaged conductivity for the control and vegetated columns.
The hydraulic conductivity profiles in depth are shown in Supplementary Section S4.
4 Discussion
4.1 Plant development and water uptake
The present study prescribed environmental conditions representative of the Marker Wadden study. The plants grew healthy, and the roots reached the bottom of the column at the end of the experiment. The same effect of transpiration was measured with the Mariotte bottles (Figure 3) and the LI-COR system (Figure 4), reaching a maximum of 6 mm day−1 in both cases. The average evapotranspiration rate of 3.9 mm day−1 in this study closely agrees with the average evapotranspiration value of 3.7 mm day−1 measured in reedbeds in the Teesmouth Estuary in England during the growing season (Fermor et al., 2001). Similar rates were measured in the Biebrza wetlands in Poland, averaging between 3.0 and 3.5 mm day−1 in the summer months (Siedlecki et al., 2016). Therefore, the data acquired from this experiment can be used to model the speed of drainage and consolidation in constructed wetlands built with soft, clay-rich material. Such a model would help estimate the difference between natural consolidating mud (such as mudflats) with and without P. australis. In the long term, vegetation would also induce biogeochemical processes (Saaltink et al., 2016), which accelerate pedogenic processes. These processes lead to the maturation or ripening of the sediment into the soil (Pons and Zonneveld, 1965; Barciela-Rial et al., 2020). Ripening processes are out of the scope of this study.
4.2 Bed consolidation
The slower initial consolidation rate and the final lower bed height for the column with no drainage are explained by the different initial conditions. In the column without drainage, water could not escape directly via the pipe, and only a vertical flow of water was possible from the bottom up to 70 cm high. At the upper part, 1) some flow of water toward the pipe was possible (70–72 cm) and 2) water could escape via evaporation (at the sediment surface). The bed height at the end of the experiment for the column without drainage was lower than the bed height for the two other columns. One explanation could be that the limited drainage between 70 and 72 cm could not fully compensate for evaporation. In that case, the internal water table would become lower than the external reference level and the overburden (i.e., the effective weight of the sediment layer above the water table) higher, resulting in higher compaction. This remains to be investigated in further experiments.
Plants are expected to enhance drainage, favorably affecting consolidation, although the current experiments did not show any enhanced consolidation rates. The experimental setup enabled us to isolate the drainage effect of plants, but there was no visible effect on consolidation because the continuous resupply of water in the drainage pipe prevented sediment drying, which otherwise would have occurred due to the plants. Moreover, the lack of difference in consolidation rates between the control and vegetated columns can also be explained by the armoring effect of roots (Waldron and Dakessian, 1982; Friend et al., 2003; Reubens et al., 2007). The roots themselves strengthen the soil, thus its resistance to consolidation. Hence, this armoring counteracts the additional drainage by the roots. Which of these two processes is dominant may be site-specific, depending on vegetation type (Valiela et al., 1976; Moore et al., 2012) and soil properties and its initial conditions (Retnamony and Allam, 1998) before consolidation.
4.3 Pore pressure
The results of this study showed that P. australis effectively alters the pore pressure gradient in soft cohesive sediments. This difference in the pore pressure gradient is referred to as the plant effect. The shape of all pressure depth profiles (Figure 4) is comparable with typical profiles of bare silty soils (Blight, 2003). For the vegetated column, there is a sharp drop in pore pressure of 40–60 cm from the base of the column. In the soil layer where plant roots extracted water, we found pressures up to four times higher than in the control column because of vegetation-induced suction, which corresponds with the data in Figure 2, showing that the larger root volume increase occurred between 20 and 60 cm depth.
The part in the column where roots extract water did not change during the experiment: pore pressure was remarkably reduced between 40 and 60 cm from the bottom of the column. This was unexpected as the roots of P. australis penetrated deeper into the sediment in time, and water uptake is supposed to be largely restricted to the part near the root tip (Kramer and Boyer, 1995). However, the maximal root density in the present experiment was measured at 20–60 cm depth (Figure 2), and other authors, such as Zhang et al. (2020), found water uptake profiles exhibiting similar patterns to the pore pressure profiles measured in the present article. Similarly, Leung et al. (2015) and Leung (2016) showed that the air entry value (i.e., the pressure point after which air recedes into the soil pores) increased four times in the presence of ivy trees (Schefflera heptaphylla) compared to bare soil.
The fact that pore pressure below 40 cm height was completely unaffected even though root surface area per unit volume of soil increased in deeper sediment layers suggests that the changing sediment physical properties were limiting water extraction to a sediment height of 40–60 cm from the bottom of the column. The deep rooting depth of P. australis is a common trait of this species and gives it an advantage over most graminoid plants sharing wetland habitats (Moore et al., 2012). According to Zhuang et al. (2001), root hydraulic characteristics co-determine where water is taken up. This depends on the pattern by which the different parts of the root contribute to the overall water transport. These root characteristics were not measured in this experiment. Therefore, it is hard to conclude why the part where water was extracted did not slightly shift downward in the column through time. Because of the daily cycles present at a sediment height of 50 cm, we are confident in linking the observed reduction in pore pressure at this depth to water loss by root extraction (Figure 5). Moreover, we measured an average water loss via evapotranspiration of 3.9 mm day−1 in the vegetated column, whereas water loss via evaporation amounted on average to 0.6 mm day−1 in the control column. Although pore pressure was restored during the night, the reduction in pore pressure during the day was larger than the increase during the night. This, together with the fact that root surface area per unit volume of soil kept increasing in the zone of water extraction, might explain why pore pressures decreased with time. During the night, the effect of recovery of the water table is observed at a sediment height of 70 cm in the vegetated column (Figure 5). At this height, water flow from the drainage pipe decreased suction values during the night because of a decreased water table due to plant drainage during the day.
4.4 Hydraulic conductivity
The results of this study showed that P. australis increased the average hydraulic conductivity of the sediment in phase 3 by 40% compared to bare soil. The overall hydraulic conductivity of a soil–plant complex likely consists of three parts:
1. The inherent hydraulic conductivity of the soil itself, which is a function of the soil composition and its state of consolidation,
2. The drainage by the roots, enhancing pore water flows through the soil–plant complex, and
3. Drainage channels along the roots or elsewhere in the soil in the form of root-induced cracks.
Thus, the hydraulic properties of the soil and roots are closely coupled (Lobet et al., 2014). Plants increase the permeability in sediments involving the development of drainage channels, of which the main driver is root growth (Ghestem et al., 2011; Orozco-López et al., 2018). In our case, these pores represent macropores made by living or decaying roots of P. australis (i.e., root channels). In particular, in cohesive sediments, these root channels are the dominant flow paths of water (Perillo et al., 1999) and can contribute to 70%–100% of total macropore space in the top 8 cm of sediment (Noguchi et al., 1997; Newman et al., 2004). However, a low fraction of macropores of total porosity already increases the water flow of saturated soil (Beven and Germann, 2003). This is especially relevant in artificial wetlands where fast initial consolidation is important. In the present study, the hydraulic conductivity increased only to a limited extent compared to bare soil despite the increasing root area. Similar observations were reported by Vergani and Graf (2015), who observed stagnation in the increase in sediment permeability due to root proliferation when root length densities approached 0.1 cm-3. This can be explained by two opposing processes occurring when roots proliferate in the sediment: 1) the contact area of water increases with increasing root density; at low root densities, this accelerates water flow through the soil, and 2) the film thickness of mobile water inside the root-induced cracks decreases with increasing root densities, decelerating water flow (Lange et al., 2009). Hence, a stagnant point is reached when the film thickness of the water becomes too thin to promote water flow. Another reason might be that photosynthesis and transpiration decrease per unit leaf area as leaves mature, as was observed for leaves of P. australis in the present experiment (Supplementary Section S5). Therefore, the observed stagnation of the increase in hydraulic conductivity is likely caused by a combination of a reduced photosynthetic capacity of the leaves and a reduction in film thickness.
4.5 Experimental setup and limitations
The experiments presented in this study were meant as pilot experiments to study the effect of plant growth on pore water pressures during the self-weight consolidation of dredged sediment. In future studies, replicas of the presented experiments will be performed to confirm the findings. Moreover, additional measurements like bed strength and density will be performed. The replicas in these types of experiments are recommended because the intraspecific variation in belowground biomass production can be high (Granéli, 1985; Howard, 2009), which may affect the pore pressure profile (Figure 5). However, we already found that the sensors at nine different depths show significantly different behaviors between the vegetated and non-vegetated columns. This total difference at every depth is the plant effect, which can vary slightly during every experiment, both in timing and the extent at different depths. Therefore, a statistically significant set of data should be built up.
4.5.1 The effect of the drainage pipe
The vertical dry density and pore water pressure distributions in the initial phase of this experiment were largely affected by the experimental setup and the addition of the dredged sediment. The drainage pipe in the middle of the column was meant to control the water table during the experiments. However, part of the sediment will immediately dewater when poured in: water will scape through the porous drainage pipe. This effect is larger in the lower part of the column. Higher in the column, vertical drainage prevails. As the very upper part of the drainage pipe was not porous, complex pore water circulations within the soil and the drainage pipe were induced, driven by the uneven pore water pressure gradients (Barciela Rial, 2019).
The contact with a water reservoir makes the sediment susceptible to osmotic processes and water adsorption by organic matter. Osmotic processes, in particular, are driven by ionic concentration gradients between the sediment and the reservoir (Atkins et al., 2014). By osmosis, ions and water could migrate from the sediment to the water reservoir (or vice versa), thereby changing the particle–particle interactions between sediment particles and leading to different consolidation behaviors. Some clays are known to be sensitive to osmotic swelling (Parker et al., 1982).
These aspects should be addressed in forthcoming studies.
5 Conclusion
It was demonstrated, using as example the effect of Phragmites australis on Marker Wadden sediment, that the new experimental set-up presented in this article enables to study the effect of root growth on the consolidation of natural dredged sediment. To the best of our knowledge, the present study is the first that correlates pore pressure measurements to the study of the effect of vegetation on the consolidation of dredged sediment. In particular, the pore pressure sensors used enabled showing how P. australis altered the pore pressure gradient in the sediment. The plants grew healthy, and their growth is comparable to plants growing in situ. In the top 40 cm, daily cycles in pore pressures were observed, which could directly be linked to the diurnal cycle of stomatal gas exchange. On average, water loss via evaporation and transpiration of leaves of P. australis amounted to 3.9 mm day−1, whereas the evaporation of bare soil amounted on average to 0.6 mm day−1. Moreover, the depth-averaged hydraulic conductivity increased on average by 40% in the presence of P. australis. These findings highlight the feature of this plant to fasten drainage in soft cohesive sediment. Future experiments will focus on the following:
1. The effects on soil structure, local density, and flow patterns: the inherent hydraulic conductivity of the soil itself is enhanced by root-growth-induced cracks, forming macropores and drainage channels. Conversely, root growth disturbs the soil structure locally, which may result in the (local) densification of the soil. Furthermore, we have indications that the roots themselves enhance drainage within the soil by promoting pore water flow along their wall.
2. The dominance between the drainage effect of roots and their armoring effect: these effects may neutralize each other, like it seems in the present case, but they may also be affected by factors such as the environmental conditions (e.g., permanent water input or not) and the time scale of the experiment (e.g., root development).
Data availability statement
The raw data supporting the conclusion of this article will be made available by the authors, without undue reservation.
Author contributions
MB-R designed the Perspex columns with pressure sensors and the drainage pipe. MB-R, RS, TK, SD, HB, JG, MW, and JW designed the combined experiment with vegetation, and MB-R and RS performed them. MB-R, CC, TK, and JW developed a mathematical model to calculate hydraulic conductivity. RS and HB monitored and analyzed the plant growth. MB-R and RS prepared the manuscript with contributions from all co-authors.
Funding
This study was supported by funding from the Netherlands Organization for Scientific Research (NWO), project no. 850.13.031 and 850.13.032 and from Boskalis, Van Oord, Deltares, RHDHV, and Natuurmonumenten. The open access fee was paid by TU Delft.
Acknowledgments
The authors would also like to thank Sander de Vree, Mohammed Jafar, Armand Middeldorp, Tom Mol, Frank Kalkman, Rob van Dijk, Hans Tas, and Arno Doorn for their help, support, and advice during the experiment.
Conflict of interest
Author RS was employed by Arcadis BV.
The remaining authors declare that the research was conducted in the absence of any commercial or financial relationships that could be construed as a potential conflict of interest.
Publisher’s note
All claims expressed in this article are solely those of the authors and do not necessarily represent those of their affiliated organizations, or those of the publisher, the editors, and the reviewers. Any product that may be evaluated in this article, or claim that may be made by its manufacturer, is not guaranteed or endorsed by the publisher.
Supplementary material
The Supplementary Material for this article can be found online at: https://www.frontiersin.org/articles/10.3389/feart.2023.952845/full#supplementary-material
References
An, S., Liu, X., Wen, B., Li, X., Qi, P., and Zhang, K. (2020). Comparison of the photosynthetic capacity of phragmites australis in five habitats in saline‒alkaline wetlands. Plants 9 (10), 1317. doi:10.3390/plants9101317
Armstrong, W., Cousins, D., Armstrong, J., Turner, D. W., and Beckett, P. M. (2000). Oxygen distribution in wetland plant roots and permeability barriers to gas-exchange with the rhizosphere: A microelectrode and modelling study with phragmites australis. Ann. Bot. 86 (3), 687–703. doi:10.1006/anbo.2000.1236
Atkins, P., Atkins, P. W., and de Paula, J. (2014). Atkins' physical chemistry. Oxford University Press.
Barciela Rial, M., Winterwerp, J. C., Griffioen, J., and van Kessel, T. (2015). “Consolidation and strength development by horizontal drainage of soft mud deposits in lake Markermeer,” in Book of abstracts NCR-Days (Nijmegen, Netherlands: Delft University of Technology), 62–64.
Barciela Rial, M. (2019). Consolidation and drying of slurries: A building with nature study for the marker wadden. PhD dissertation. Netherlands: TU Delft.
Barciela-Rial, M., van Paassen, L. A., Griffioen, J., van Kessel, T., and Winterwerp, J. C. (2020). The effect of solid phase composition on the drying behaviour of Markermeer sediment. Vadose Zone J. 19, 1–14. doi:10.1002/vzj2.20028
Barciela-Rial, M., Vardon, P. J., Van Kessel, T., Griffioen, J., and Winterwerp, J. C. (2022). Effect of composition on the compressibility and shear strength of dredged cohesive sediment. Sedimentology, stratigraphy and diagenesis. Front. Earth Sci. 10, 786108. doi:10.3389/feart.2022.786108
Been, K., and Sills, G. C. (1981). Self-weight consolidation of soft soils: An experimental and theoretical study. Géotechnique 31, 519–535. doi:10.1680/geot.1981.31.4.519
Beven, K., and Germann, P. (2003). Macropores and water flow in soils. Water Resour. Res. 18, 1310–1325. doi:10.1029/WR018i005p01311
Blight, G. E. (2003). The vadose zone soil-water balance and transpiration rates of vegetation. Géotechnique 53 (1), 55–64. doi:10.1680/geot.2003.53.1.55
British Standards Institute (1990). Methods of test for soils for civil engineering purposes in Classification tests. BS1377-2:1990.
Chen, Y., Thompson, C. E. L., and Collins, M. B. (2012). Saltmarsh creek bank stability: Biostabilisation and consolidation with depth. Cont. Shelf Res. 35, 64–74. doi:10.1016/j.csr.2011.12.009
Derrick, P., McKee, J., Johnson, S., and Mendelsohn, M. (2007). Poplar island environmental restoration project: Project successes, lessons learned, and future plans. Proc. world Dredg. Congr. 1, 487–500.
Dorioz, J. M., Robert, M., and Chenu, C. (1993). The role of roots, fungi and bacteria on clay particle organization. An experimental approach. Exp. approach. Geoderma 56, 179–194. doi:10.1016/0016-7061(93)90109-x
Duursma, R. A. (2015). Plantecophys - an R package for analysing and modelling leaf gas exchange data. PLoS ONE 10 (11), 01433466–e143413. doi:10.1371/journal.pone.0143346
EN (2012). Sludge, treated biowaste, soil and waste -determination of loss on ignition. Geneva, Switzerland: International Organization for Standardization. EN 15935:2012.
Fagherazzi, S., and Furbish, D. J. (2001). On the shape and widening of salt marsh creeks. J. Geophys. Res. 106, 991–1003. doi:10.1029/1999jc000115
Fermor, P. M., Hedges, P. D., Gilbert, J. C., and Gowing, D. J. G. (2001). Reedbed evapotranspiration rates in England. Hydrol. Process. 15, 621–631. doi:10.1002/hyp.174
Friend, P. L., Ciavola, P., Cappucci, S., and Santos, R. (2003). Bio-dependent bed parameters as a proxy tool for sediment stability in mixed habitat intertidal areas. Cont. Shelf Res. 23, 1899–1917. doi:10.1016/j.csr.2002.12.001
García-Ávila, F., Patiño-Chávez, J., Zhinín-Chimbo, F., Donoso-Moscoso, S., del Pino, L. F., and Avilés-Añazco, A. (2019). Performance of Phragmites Australis and Cyperus Papyrus in the treatment of municipal wastewater by vertical flow subsurface constructed wetlands. Int. Soil Water Conservation Res. 7 (3), 286–296. doi:10.1016/j.iswcr.2019.04.001
Gerke, H. H., and Kuchenbuch, R. O. (2007). Root effects on soil water and hydraulic properties. Biologia 62, 557–561. doi:10.2478/s11756-007-0110-8
Ghestem, M., Sidle, R. C., and Stokes, A. (2011). The influence of plant root systems on subsurface flow: Implications for slope stability. Bioscience 61, 869–879. doi:10.1525/bio.2011.61.11.6
Gibson, R. E., England, G. L., and Hussey, M. J. L. (1967). The theory of one-dimensional consolidation of saturated clays. Géotechnique 17, 261–273. doi:10.1680/geot.1967.17.3.261
Granéli, W. (1985). Biomass response after nutrient addition to natural stands of reed, Phragmites australis. Int. Ver. für Theoretische Angew. Limnol. Verhandlungen 22, 2956–2961. doi:10.1080/03680770.1983.11897810
Howard, R. J. (2009). Intraspecific variation in growth of marsh macrophytes in response to salinity and soil type: Implications for wetland restoration. Estuaries Coasts 33, 127–138. doi:10.1007/s12237-009-9227-z
ISO/TS (2004). Geotechnical investigation and testing - laboratory testing of soil - Part 3: Determination of particle density - pycnometer. ISO/TS 17892-3:2004.
Kramer, B., and Boyer, J. S. (1995). “Chapter 5: Roots and root systems,” in Water relations of plants and soils (San Diego: Academic Press), 130.
Lange, B., Lüescher, P., and Germann, P. F. (2009). Significance of tree roots for preferential infiltration in stagnic soilsfiltration in stagnic soils. HESS 13, 1809–1821. doi:10.5194/hess-13-1809-2009
Leung, A. K., Garg, A., and Ng, C. W. W. (2015). Effects of plant roots on soil-water retention and induced suction in vegetated soil. Eng. Geol. 193, 183–197. doi:10.1016/j.enggeo.2015.04.017
Leung, A. K. (2016). Grass evapotranspiration-induced suction in slope: Case study. Environ. Geotech. 3, 155–165. doi:10.1680/envgeo.14.00010
Lim, T. T., Rahardjo, H., Chang, M. F., and Fredlund, D. G. (1996). Effect of rainfall on matric suctions in a residual soil slope. Can. Geotechnical J. 33, 618–628. doi:10.1139/t96-087
Liu, Y., Zhang, Y., Xie, L., Zhao, S., Dai, L., and Zhang, Z. (2021). Effect of soil characteristics on preferential flow of Phragmites australis community in Yellow River delta. Ecol. Indic. 125, 107486. doi:10.1016/j.ecolind.2021.107486
Lobet, G., Pagès, L., and Draye, X. (2011). A novel image analysis toolbox enabling quantitative analysis of root system architecture. Plant Physiol. 157, 29–39. doi:10.1104/pp.111.179895
Lobet, G., Couvreur, V., Meunier, F., Javaux, M., and Draye, X. (2014). Plant water uptake in drying soils. Plant Physiol. 164, 1619–1627. doi:10.1104/pp.113.233486
Mitsch, W. J., Zhang, L., Stefanik, K. C., Nahlik, A. M., Anderson, C. J., Bernal, B., et al. (2012). Creating wetlands: Primary succession, water quality changes, and self-design over 15 years. BioScience 62, 237–250. doi:10.1525/bio.2012.62.3.5
Moore, G. E., Burdick, D. M., Peter, C. R., and Keirstead, D. R. (2012). Belowground biomass of Phragmites australis in coastal marshes. Northeast. Nat. 19, 611–626. doi:10.1656/045.019.0406
Newman, B. D., Wilcox, B. P., and Graham, R. C. (2004). Snowmelt driven macropore flow and soil saturation in a semiarid forest. Hydrol. Process. 18, 1035–1042. doi:10.1002/hyp.5521
Noguchi, S., Tsuboyama, Y., Sidle, R. C., and Hosoda, I. (1997). Spatially distributed morphological characteristics of macropores in forest soil of Hitachi Ohta experimental watershed, Japan. J. For. Res. 2, 115–120. doi:10.1007/BF02348317
Orozco-López, E., Muñoz-Carpena, R., Gao, B., and Fox, G. A. (2018). Riparian vadose zone preferential flow:review of concepts, limitations, and perspectives. Vadose Zone J. 17, 1–20. doi:10.2136/vzj2018.02.0031
Parker, J. C., Amos, D. F., and Zelazny, L. W. (1982). Water adsorption and swelling of clay minerals in soil systems. Soil Sci. Soc. Am. J. 46 (3), 450–456.
Perillo, C. A., Gupta, S. C., Nater, E. A., and Moncrief, J. F. (1999). Prevalence andinitiation of preferential flow paths in a sandy loam with argillichorizon. Geoderma 89, 307–331. doi:10.1016/S0016-7061(98)00087-1
Pons, L. J., and Zonneveld, I. S. (1965). Soil ripening and soil classification: Initial soil formation in alluvial deposits and a classification of the resulting soils. Int. Inst. Land Reclam. Improv. 13, 1–128.
Retnamony, G. R., and Allam, M. M. (1998). Effect of clay mineralogy on coefficientof consolidation. Clays Clay minerals 46, 596–600. doi:10.1346/ccmn.1998.0460514
Reubens, B., Poesen, J., Danjon, F., Geudens, G., and Muys, B. (2007). The role of fine and coarse roots in shallow slope stability and soil erosion control with a focus on root system architecture: A review. Trees 21, 385–402. doi:10.1007/s00468-007-0132-4
Rijkswaterstaat (1995). Geologische en bodemkundige atlas van het markermeer. Lelystad: Rijkswaterstaat, Directie IJsselmeergebied. Tech. rep. Lelystad
Saaltink, R. M., Dekker, S. C., Griffioen, J., and Wassen, M. J. (2016). Wetland eco-engineering: Measuring and modeling feedbacks of oxidation processes between plants and clay-rich material. Biogeosciences 13, 4945–4957. doi:10.5194/bg-13-4945-2016
Sanderson, J. (1983). Water uptake by different regions of the barley root. Pathways of radial flow in relation to development of the endodermis. J. Exp. Bot. 34, 240–253. doi:10.1093/jxb/34.3.240
Siedlecki, M., Pawlak, W., Fortuniak, K., and Zielinski, M. (2016). Wetland evapotranspiration: Eddy covariance measurement in the Biebrza valley, Poland. Wetlands 36, 1055–1067. doi:10.1007/s13157-016-0821-0
Smethurst, J. A., Clarke, D., and Powrie, W. (2006). Seasonal changes in pore water pressure in a grass-covered cut slope in London Clay. Géotechnique 56, 523–537. doi:10.1680/geot.2006.56.8.523
Suku, S., Knipfer, T., and Fricke, W. (2014). Do root hydraulic properties change during the early vegetative stage of plant development in barley (Hordeum vulgare)? Ann. Bot. 113, 385–402. doi:10.1093/aob/mct270
Valiela, I., Teal, J. M., and Persson, N. Y. (1976). Production and dynamics of experimentally enriched salt marsh vegetation: Belowground biomass. Limnol. Oceanogr. 21, 245–252. doi:10.4319/lo.1976.21.2.0245
Vergani, C., and Graf, F. (2015). Soil permeability, aggregate stability and root growth: A pot experiment from a soil bioengineering perspective. Ecohydrology 9, 830–842. doi:10.1002/eco.1686
Waldron, L. J., and Dakessian, S. (1982). Effect of grass, legume, and tree roots on soil shearing resistance. Soil Sci. Soc. Am. J. 46, 894–899. doi:10.2136/sssaj1982.03615995004600050002x
Winterwerp, J. C., and van Kesteren, W. G. M. (2004). Introduction to the Physics of Cohesive Sediments in the Marine Environment. Amsterdam: Elsevier.
Zhang, X. X., Whalley, P. A., Ashton, R. W., Evans, J., Hawkesford, M. J., Griffiths, S., et al. (2020). A comparison between water uptake and root length density in winter wheat: Effects of root density and rhizosphere properties. Plant Soil 451, 345–356. doi:10.1007/s11104-020-04530-3
Zhuang, J., Nakayama, K., Yu, G. R., and Urushisaki, T. (2001). Estimation of root water uptake of maize: An ecophysiological perspective. Field Crops Res. 69, 201–213. doi:10.1016/s0378-4290(00)00142-8
Keywords: consolidation, wetland, dredged sediment, plant growth, pore pressure, cohesive, drainage
Citation: Barciela-Rial M, Saaltink RM, van Kessel T, Chassagne C, Dekker SC, de Boer HJ, Griffioen J, Wassen MJ and Winterwerp JC (2023) A new setup to study the influence of plant growth on the consolidation of dredged cohesive sediment. Front. Earth Sci. 11:952845. doi: 10.3389/feart.2023.952845
Received: 25 May 2022; Accepted: 27 January 2023;
Published: 22 February 2023.
Edited by:
Eduardo Siegle, University of São Paulo, BrazilReviewed by:
Dobroslav Znidarcic, University of Colorado, United StatesValéria Quaresma, Federal University of Espirito Santo, Brazil
Copyright © 2023 Barciela-Rial, Saaltink, van Kessel, Chassagne, Dekker, de Boer, Griffioen, Wassen and Winterwerp. This is an open-access article distributed under the terms of the Creative Commons Attribution License (CC BY). The use, distribution or reproduction in other forums is permitted, provided the original author(s) and the copyright owner(s) are credited and that the original publication in this journal is cited, in accordance with accepted academic practice. No use, distribution or reproduction is permitted which does not comply with these terms.
*Correspondence: Maria Barciela-Rial, m.barcielarial@tudelft.nl