


Abstract
Dendrochronology in West Africa has not yet been developed despite encouraging reports suggesting the potential for long tree-ring reconstructions of hydroclimate in the tropics. This paper shows that even in the absence of local tree chronologies, it is possible to reconstruct the hydroclimate of a region using remote tree rings. We present the West Sub-Saharan Drought Atlas (WSDA), a new paleoclimatic reconstruction of West African hydroclimate based on tree-ring chronologies from the Mediterranean Region, made possible by the teleconnected climate relationship between the West African Monsoon and Mediterranean Sea surface temperatures. The WSDA is a one-half degree gridded reconstruction of summer Palmer Drought Severity indices from 1500 to 2018 CE, produced using ensemble point-by-point regression. Calibration and verification statistics of the WSDA indicate that it has significant skill over most of its domain. The three leading modes of hydroclimate variability in West Africa are accurately reproduced by the WSDA, demonstrating strong skill compared to regional instrumental precipitation and drought indices. The WSDA can be used to study the hydroclimate of West Africa outside the limit of the longest observed record and for integration and comparison with other proxy and archaeological data. It is also an essential first step toward developing and using local tree-ring chronologies to reconstruct West Africa's hydroclimate.
Export citation and abstract BibTeX RIS

Original content from this work may be used under the terms of the Creative Commons Attribution 4.0 license. Any further distribution of this work must maintain attribution to the author(s) and the title of the work, journal citation and DOI.
1. Introduction
Four hundred million people call West Africa home (United Nations 2019). A quarter of them lives in the Western Sahel, a semi-arid expanse of grassland, shrubs, and small trees, while the remaining third live in the Guinea Coast, a more fertile belt of tropical rain forests just south of the Western Sahel. Decadal rainfall variability is similar in both regions, conjoined by the regional dominance of the West African monsoon. The year-to-year persistence of rainfall on the other hand is much weaker, and anomalies are generally less extreme on the Guinea Coast than in the Western Sahel (Nicholson 2013).
The strong spatial and temporal variations in rainfall make West Africa prone to drought, especially in the Western Sahel due to its semi-aridity. However, the region's vulnerability to drought is rarely due to variations in rainfall alone but is a superposition of several factors, including inadequate planning to deal with shortfalls. Critical sectors of the economy such as agriculture and hydroelectricity generation rely heavily on rainfall. Yet, they often lack contingency plans to combat drought or struggle to implement them where they exist (Raichur 1973). For example, in 2015, drought limited water availability in the Volta River Basin, an essential source of water distribution and economic activity for West Africa. Consequently, electricity generation by the dams within the basin came to a halt, including the Akosombo Dam, the single largest electricity source in Ghana (Eshun and Amoako-Tuffour 2016). There were no contingency plans for immediate and alternative long-term power generation, which crippled the Ghanaian economy and diminished the livelihood of many of its already impoverished communities, symptomatic of the policy inactions that exacerbate West Africa's inherent susceptibility to drought (Shiferaw et al 2014). In addition to natural climate variability, global warming has increased the probability and severity of drought globally, and of great concern is the projection that Africa may be the continent most impacted (Masson-Delmotte et al 2021).
Policies premised on leveraging science and technology hold the greatest promise to implementing measures of efficient water use, future drought mitigation, and other climate-driven economic impacts, but their formulation is limited by the considerable uncertainty in the projections of hydroclimatic variability in West Africa (Challinor et al 2007, Biasutti et al 2009, Roudier et al 2011, Biasutti 2013) and lack of important information, deriving in part from the lack of long, systematically measured hydroclimate data. Only during the 1930s did synoptic observation stations become generally established in the sub-region and these remain sparse even today (Tarhule and Hughes 2002). The instrumental record is thus too short to determine the characteristic time scale and forcing of regional climate variability over several centuries, or to identify whether recent patterns of drought could be part of an imminent change toward drier conditions in the region (Seager et al 2007). In addition, long observational records for key climatic variables are the basis for evaluating the performance of climate models, the primary tools for climate attribution and projections. Their lack, therefore, limits our ability to accurately attribute the relative contributions of human influences versus natural variability to recent hydroclimatic changes and can also lead to unreliable baselines for deriving observationally constrained estimates of future projections based on a past climate regime. Ultimately, this precludes a proper assessment.
In the absence of ample instrumental records, dendrochronological methods of climate reconstruction have yielded unique insights into the natural variability of Earth's climate system (Cook and Kairiukstis 1990, Buckley et al 2010, Cook et al 2010a, Anchukaitis 2017), allowing us to characterize climate variability and test model performances outside the limit of the longest observed record. Due to their strong response to environmental changes, trees are particularly well suited for studying hydroclimate variability (St. George 2014, St. George and Ault 2014), although the specific monthly or seasonal climate response can vary across regions and continents (St. George et al 2010, Touchan et al 2014). Trees provide annually resolved information on past climate variability and can be dated to the exact calendar year, thus enabling quantitative and precise calibration and verification. Despite their own inherent uncertainties, proxy data, including tree rings are also used in conjunction with instrumental records to reduce uncertainty in hydroclimatic projections (Henderson et al 2009, Haywood et al 2019). Unfortunately, the potential for dendrochronology in West Africa has not yet been developed.
In this study, we show that even in the absence of local tree chronologies, it is possible to reconstruct the hydroclimate of a region using remote tree-ring growth. We present a Palmer Drought Severity Index (PDSI) reconstruction as a proxy for the hydroclimate over West Africa based on tree-ring chronologies from the Mediterranean region. This is made possible by a strong teleconnection signal between the Mediterranean region and West Africa. Rowell (2003) first demonstrated the positive influence of Mediterranean Sea surface temperatures (SST) anomalies on West African Monsoon (WAM) precipitation through northerly moisture advection from the Mediterranean toward the Sahel. Since then, several studies including Jung et al (2006), Peyrillé et al (2007), and Diatta et al (2020) have been dedicated to the WAM-Mediterranean interaction and the existence of this teleconnection is now widely accepted.
Our results are encapsulated in the novel West Sub-Saharan Drought Atlas (WSDA, figure 1), an annually resolved spatial reconstruction of West Africa's hydroclimate over the past 500 years. The WSDA can be used to assess the performance of climate models and for integration and comparison with other proxy, historical, and archaeological data. It is also an important first step toward the goal of developing and using local tree-ring chronologies to reconstruct West Africa's hydroclimate.
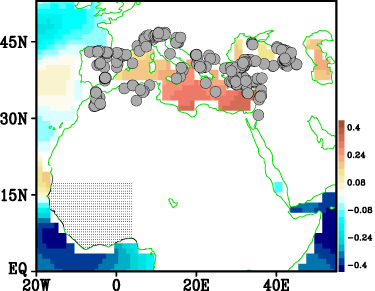
Figure 1. Geographic context for the study. Shaded gray circles with black outlines represent the 333 sites of the tree-ring chronologies utilized in reconstructed scPDSI over West Africa (i.e. WSDA). The black one-half degree points over West Africa represent the WSDA grid. Shading outside land (white) areas represents the summer (June, July, and August) correlation between sea surface temperature and the time series of empirical orthogonal function 1 (EOF1) of instrumental scPDSI over West Africa, from 1901 to 2018.
Download figure:
Standard image High-resolution image2. Data and methodology
2.1. Tree-ring network and reconstruction method
The tree-ring network we used for the WSDA reconstruction is based on the Mediterranean portion of the Old-World Drought Atlas tree-ring network (Cook et al 2015). It is comprised of 333 tree-ring chronologies and its spatial distribution is shown in figure 1. All chronologies begin on or before 1798 and end no earlier than 1990. We used this network because of its previous success in reconstructing past drought over the Mediterranean region and its clear association with the Mediterranean teleconnections that influence West Africa rainfall.
The method of reconstruction we used is the Point-by-Point Regression (PPR) method (Cook et al 1999) and its extension to ensemble PPR (EPPR) as described most recently in Cook et al (2020). PPR was specifically developed for the reconstruction of hydroclimate variability from tree rings, but it originally relied on relatively local tree-ring chronologies to reconstruct local hydroclimate (Cook et al 1999). This limitation was relaxed through the use of multiple search radii for locating tree-ring chronologies in more remote locations to reconstruct hydroclimate at each grid point and a novel correlation-weighted method for generating the principal component (PC) regression models used for reconstruction (Cook et al 2010a, 2020). This resulted in an ensemble of reconstructions at each grid point (hence EPPR) that could be evaluated for skill.
The tree-ring chronologies used for reconstruction have a common end year of 1990 because of the widely varying years in which the trees were sampled but lose one year (1990) due to the inclusion of a lagged tree-ring variable in the model (Cook et al 1999). For this reason, the calibration period chosen for developing the reconstructions was set to 1951–1989. This period includes the highest number of rainfall stations used for calculating the self-calibrating PDSI (scPDSI) over West Africa (figure 2 in Nicholson et al 2018) and therefore ought to be the highest quality period for calibrating each EPPR model. Of the remaining pre-1951 scPDSI data, only the 1920–1950 period was used for model validation because of the sharply declining number of rainfall stations over West Africa in the early 20th Century (figure 2 in Nicholson et al 2018). As standard, time series were detrended and pre-whitened to remove autocorrelations.
The WSDA reconstructions cover the period 1500–2018 CE. Each grid point reconstruction has been scaled to recover lost variance due to regression (proportional to 1−R2). This enabled each reconstruction to be updated from 1990 to 2018 with instrumental data.
2.2. Calibration and verification statistics
We provide five rigorous calibration and verification statistics that are typically used for assessing the quality of dendroclimatic reconstructions (e.g. Michaelsen 1987, Meko 1997, Cook et al 1999). They include the calibration period coefficient of determination or R2 (CRSQ) and cross-validation reduction of error (CVRE). The latter is a 'leave-one-out' procedure analogous to R2 based on Allen's PRESS statistic (Allen 1971) and its R2 equivalent (Quan 1988) and is a more conservative measure of the explained variance than CRSQ. In extremely weak calibration cases CVRE can actually go negative, which is a clear indication of no calibration skill.
The validation period statistics are the square of the Pearson correlation (VRSQ, sign of the correlation applied), the reduction of error statistic (VRE), and the coefficient of efficiency (VCE), and these can be interpreted as expressions of shared variance between the actual data and the tree-ring estimates. Negative values indicate no reconstruction skill as measured. The formulae of these statistics require that VRSQ is greater than or equal to VRE, which in turn is greater than or equal to VCE when calculated from the same data, thus making VCE the hardest validation statistic to pass. No theoretical significance tests are available for the VRE and VCE. Simply, values greater than zero indicate that the reconstruction has skill in excess of the calibration or verification period climatology of the instrumental data. In addition to these validation metrics, the root mean square error (RMSE) statistic is provided as a simple estimate of uncertainty. For a full explanation of these statistics, the reader is referred to Cook et al (1999).
2.3. Hydroclimatic and SST datasets
The instrumental hydroclimate data used for statistical calibration and validation in this study is the widely used scPDSI (Wells et al 2004, van der Schrier et al 2013), specifically the CRU TS 4.03 dataset that covers the period 1901–2018 (Harris et al 2014). It is calculated from the University of East Anglia's Climatic Research Unit's instrumental temperature and precipitation dataset, available on a 0.5° resolution. From these monthly data, we reconstruct the summer (June–August) average scPDSI over West Africa. This matches the season reconstructed for the Old World Drought Atlas (OWDA) and also coincides with the summer rainfall season over the WSDA domain.
We also present a qualitative comparison of our scPDSI reconstruction with instrumental rainfall- indices in West Africa, including the Joint Institute for the Study of the Atmosphere and Ocean (JISAO) Sahel precipitation index which spans 1901–2017 (Mitchell 2016), derived from the 0.25° resolution German Weather Service Global Precipitation Climatology Centre monthly precipitation dataset and the Sahel rainfall time series from Nicholson et al (2018), which is based on 602 rain gauge records of variable length extending from 1854 to 2014. A comparative series for the Gulf of Guinea region to the south, from 1885 to 2014 is also utilized. Together, the latter two rainfall indices from Nicholson et al (2018), hereafter referred to as NRI, collectively provide insight into the variability of the West African monsoon.
Apart from these meteorological datasets, we make use of the Hadley Center Sea Ice and Sea Surface Temperature dataset (HadISST, Rayner et al 2003), which is analyzed in concert with the instrumental scPDSI to deduce the connection between West African hydroclimate and Mediterranean SST.
2.4. Empirical orthogonal function (EOF) analysis
The primary goal of EOF analysis is to simplify a given space-time dataset by extracting the smallest set of independent modes of variability that can adequately describe it (e.g. Lorenz 1956, LaMarche and Fritts 1971). Standard EOFs are found by computing the eigenvalues and eigenvectors of the anomaly covariance matrix of a field. The eigenvalues provide a measure of the percent variance explained by the corresponding mode, the latter are orthogonal to each other depending on the time period being used. The time series (PC) of each mode is determined by projecting the derived eigenvectors onto the spatially weighted anomalies.
Here, we use EOFs to identify the coherent patterns in the reconstructed hydroclimate over West Africa and the Mediterranean Region and evaluate them against the instrumental scPDSI and precipitation datasets. Typically, the first few modes contain the most variance as well as physically interpretable patterns when it comes to atmospheric and hydroclimatic processes, so in this paper, we focus on the first three EOFs. All analyses are based on the Boreal summer months of June, July, and August (i.e. JJA). Also, datasets are normalized before use to prevent areas of maximum variance from dominance and facilitate comparison.
3. Results and discussion
Figure 1 shows the locations of the tree-ring chronologies used for reconstructing the WSDA, the WSDA domain limits, and how the first PC (PC1) of instrumental scPDSI over the WSDA is correlated to SSTs in the Mediterranean. The strength and pattern of the correlations are consistent with the known teleconnection between the two regions, which is primarily characterized by the WAM response to thermal Mediterranean forcing. When the Mediterranean is warmer than normal, it reinforces the northward migration of the monsoon system and surface convergence in the vicinity of the intertropical convergence zone through stronger moist convection south of the Sahara. The increased moisture convergence feeds the convective activity leading to increased precipitation (Rowell 2003, Fontaine et al 2010, Gaetani et al 2010). On the other hand, the alternate effect of WAM dynamics on Mediterranean climate is not as clearly understood, although a few studies including Rodwell and Hoskins (2001) argue that the Rossby wave response to West African monsoonal heating, interacting with midlatitude westerlies, does impact Mediterranean climate by producing a strong region of adiabatic descent there.
Calibration and verification results over the Mediterranean and WSDA grids are presented in figure 2, providing an avenue to measure the quality of reconstructions from the local chronologies and a benchmark against which to evaluate the reconstruction of the remote hydroclimate in West Africa. Most of the grid points show reasonably robust calibrations (figure 2(a)), with a validation skill map that exhibits a diagonal split between high skill in the northwest and relatively low skill in the southeast (figure 2(b)). The latter may be caused in part by a decline in the number of rainfall records contributing to the scPDSI estimates, especially over Turkey and the Middle East, thus resulting in reduced instrumental data quality, especially before 1930. Recall that the Mediterranean tree-ring chronologies utilized in this study were previously used to build the OWDA as presented in Cook et al (2015), which elaborates further on the quality of instrumental and proxy reconstructions in the region.

Figure 2. Reconstruction drought calibration and verification statistics. (a) and (b) Mediterranean Region cross-validation RSQ (CVRE) and validation period RSQ (VRSQ). (c) and (d) WSDA calibration period RSQ (CRSQ) and cross-validation RSQ (CVRE). (e)–(g) WSDA validation RSQ (VRSQ), validation period reduction of error (VRE) and validation period coefficient of efficiency (VCE). See Cook et al (1999, 2010a, 2013, 2020) for a description of these particular statistics and their interpretation. Unlike CRSQ, which can never be negative, CVRE, VRSQ (by retaining the sign of r after squaring), VRE and VCE can have negative values, indicating that there is no skill in the estimates. All but root mean square error are in units of fractional explained variance. RSQ is R2.
Download figure:
Standard image High-resolution imageOver the West Africa grid, we present four additional validation metrics, given that the WSDA is the main focus of this paper. Much like the Mediterranean, the entire WSDA grid calibrates well (figures 2(c) and (d)), with weaker but useful validations indicated by the positive VRSQ, VRE and VCE, scattered across the domain (figure 2(e)–(g)). Judging by the VCE, which is the hardest metric to pass, the most consistent and reliable validation occurs along the main river systems of two of the three biggest watersheds in West Africa (figure S1, Stanzel et al 2018). Within the Volta River Basin to the east, the best grids show up along the Volta River in Ghana. In the west, they appear along the Senegal River within the Senegal River Basin (figure 2(g)). The RMSEs in figure 2(h) provide more insight into the magnitude of the total errors of the WSDA reconstructions, both bias and variance. In congruence with the other validation metrics, the lowest reconstruction skill is largely found over the central part of the region.
One possible reason for the low skill validations is the poor quality of observations particularly before 1951, when fewer stations are available, and most grid point interpolations are relaxed towards the climatology as available stations diminish. The relatively strong validity of the reconstruction over the Northwestern Mediterranean and within specific river basins is also not surprising. Historically, humans have settled close to water bodies and food sources because of commerce and trade, which would provide an economic incentive to take hydroclimatic measurements there. Any long systematically measured data within the WSDA grid implicitly augurs well for its validation.
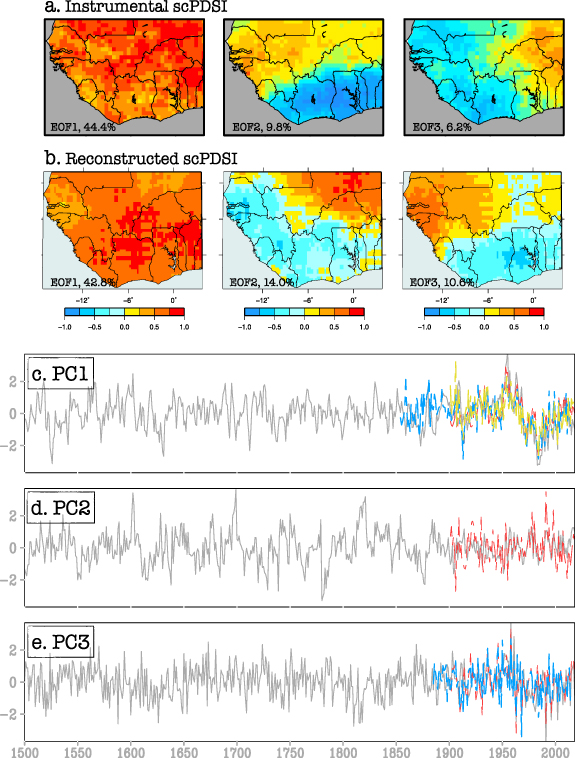
Considering the limitations with historical data at the grid point scale, we proceeded to evaluate the utility of the WSDA on a regional scale by comparing EOFs of the instrumental and reconstructed summer scPDSI in figure 3. EOF1 of the instrumental scPDSI (figure 3(a)) explains 44% of the total variance and exhibits a monopole mode of variability or anomalous conditions of the same sign throughout the region. EOF2 explains 10% of the variance and is characterized by a meridional dipole pattern of variability, which represents the well-known dipole of hydrological conditions over the Sahel region and the Gulf of Guinea (e.g. Nicholson 2013). So, wet conditions in the Sahel are opposed by dry conditions on the Guinea Coast, and vice versa. Grist and Nicholson (2001) describe these two modes as so fundamental that they are evident on both interannual and interdecadal time scales and in the historical record of past centuries. EOF3 is a zonal dipole that explains 6% of the total variance and has been related to an observed long term intensification of the Saharan heat low (Lavaysse 2015) and enhancing effects from anthropogenic global warming (James et al 2013).
Figure 3. EOF patterns of (a) instrumental scPDSI over West Africa (spanning 1901–2018) and (b) reconstructed scPDSI over West Africa or WSDA (spanning 1500–2018). (c)–(e) EOF time series: WSDA is the gray line and red is instrumental scPDSI. The NRI Sahel rainfall index is superimposed on the PC1 of WSDA in blue and the JISAO Sahel index in yellow. The NRI Gulf of Guinea index is also superimposed on the PC3 of WSDA in blue. PC1 of WSDA is correlated to instrumental scPDSI at R = 0.76, the NRI Sahel rainfall index at R = 0.66, and the Joint Institute for the Study of the Atmosphere and Ocean (JISAO) rainfall index at R = 0.61. If an 11 year running mean is applied, R goes up to 0.85, 0.92, and 0.91 respectively.
Download figure:
Standard image High-resolution image
The EOFs of the reconstructed scPDSI (figure 3(b)) match their instrumental counterparts (figure 3(a)), although EOF2 and EOF3 switch precedence, which is unsurprising considering the fact that the WSDA spans a much longer period of time (1500–2018) relative to the instrumental record (1901–2018). Indeed, computing the EOFs from 1901–1989, which is a period where the WSDA encompasses tree-ring only data, to compare with the instrumental record, yields identical loading patterns and are ordered in the same way (figure S2). Further, we correlate the PCs of the WSDA to the corresponding PCs of instrumental scPDSI, and for a more qualitative comparison with independent rainfall indices from JISAO and NRI over their respective overlapping time periods (figures 3(c)–(e)). Except for the NRI Gulf of Guinea index, all the other indices are significantly correlated to both the dominant monopole mode of variability (EOF1) and the dipole mode (EOF3 in WSDA) that distinguishes the hydrological conditions over the Sahel from the Gulf of Guinea. The NRI Gulf of Guinea index is only significantly correlated to EOF3 (table S1). This is quite intriguing, especially given the absence of local tree-ring chronologies in the WSDA.
4. Conclusions
The WSDA is a new paleoclimatic reconstruction of drought and wetness that reproduces several aspects of the spatio-temporal hydroclimatic variability over West Africa. It is a one-half degree gridded reconstruction of summer scPDSI from 1500 to 2018 CE and is made possible by the teleconnected climate relationship between West Africa and the Mediterranean region. An EPPR was used to produce the WSDA.
The reconstructed scPDSI of the WSDA accurately reproduced the three leading modes of hydroclimate variability in West Africa and demonstrated strong skill when compared to regional instrumental rainfall and drought indices. The inclusion of local tree-ring chronologies in the WSDA is planned for the future and promises to yield a more robust reconstruction, with a much more complete and local understanding of hydroclimatic variability in West Africa. This is evident in figure S3 which shows the correlation of summer (JJA) rainfall index over the Sahel with Mediterranean SST. The correlation between the detrended rainfall index and SST in the Mediterranean is strong (figure S3(a)) but weakens significantly when the rainfall index is first differenced (figure S3(b)). The rainfall data in figure S3(a) was detrended by removing its linear best fit, which reduces the interannual variability at any given location and in this case transforms the data to an overall decadal variation. While differencing has the effect of removing the trend and multi-year variability in a data series, it also results in one fewer observation than the original series (figure S3(b)). This seems to suggest the WSDA in its current form fails to retain all hydroclimatic information, especially on the interannual timescale, making a strong case for the inclusion of local tree-ring chronologies. We also recognize the potential role modes of climate variability and remote SST patterns can play in modulating the timescale of the teleconnection response in Mediterranean trees, which warrants further studies.
It was widely believed that usual tree-ring dating methods may not be suitable for trees that grow in Africa because they do not necessarily grow annual rings, but that is no longer the general viewpoint today. Several researchers including Hummel (1946), Mariaux (1981), Detienne (1989), Jacoby (1989), Buckley et al (1995), and D'Arrigo et al (1997) have provided evidence that annual rings form in several tropical species. In West Africa, some success in producing annual tree-ring chronologies has also been recently reported from the Ivory Coast (De Ridder et al 2013) and the Cameroons (Battipaglia et al 2015). But several factors, including the difficulty in identifying and interpreting growth bands, the lack of precedents demonstrating successful cross dating, political instability, economic and logistical difficulties have contributed to stifling further investigations of these promising results. The situation is further exacerbated by the fact that most practitioners of dendrochronology are from the mid-latitudes and have limited time and resources for devoting effort to evaluating tropical trees for dendrochronological research (Tarhule and Hughes 2002). However, the limited success in African dendrochronology reported to date suggests that the potential is there to develop long tree-ring chronologies.
Acknowledgments
Boniface Fosu acknowledges support from the Northern Gulf Institute at Mississippi State University from NOAA's Office of Oceanic and Atmospheric Research, US Department of Commerce. Award #NA16OAR4320199. B M Buckley acknowledges support from NSF AGS-2102759, and NSF AGS-2001949.
Data availability statement
The data that support the findings of this study are available upon reasonable request from the authors.
Supplementary data (5.2 MB PDF)