

Abstract
In addition to high temperature, high humidity can have significant consequences on thermal comfort of human beings. The co-occurrence of high temperature and high humidity (so-called 'oppressive hot days') often results in heat stress events, but the extent to which it is affected by preceding surface moisture has not been fully understood to date. In this study, we examine the relations between preceding 3-month standardized precipitation index (SPI) and the number of hot days indicated by the surface air temperature (NHD-Tx) and the wet-bulb globe temperature (NHD-Wx) that combines both temperature and humidity in the hottest month in low latitudes. Results show that, in contrast with the negative correlations between SPI and NHD-Tx, which are associated with the previously reported precipitation deficit-temperature feedback, significant positive correlations between SPI and NHD-Wx are found in some low latitude areas. The probability of above-average NHD-Wx could be ∼30% higher after wet conditions than that after dry conditions in areas like southern South America, some parts of Africa, and West Asia. Hotspot analyses further show that abundant preceding rainfall has an asymmetric impact on oppressive hot days by favoring more above-average NHD-Wx. Our analyses imply that a local feedback may exist between surface moisture and oppressive hot extremes, via which the unbearable heat stress over some parts of the tropics is modulated, controlled, and/or caused by changes in the preceding near-surface humidity/soil moisture. The spatially heterogeneous patterns of the relations between preceding rainfall and heat stress confirm the precipitation deficit-temperature feedback in many areas and reveal the coexistence of surface moisture-oppressive heat stress in several low latitude areas. We emphasize the necessity of considering both feedbacks for a better understanding of the distinct roles of preceding rainfall in the consequent development of heat stress in low latitudes.
Export citation and abstract BibTeX RIS

Original content from this work may be used under the terms of the Creative Commons Attribution 3.0 licence. Any further distribution of this work must maintain attribution to the author(s) and the title of the work, journal citation and DOI.
1. Introduction
Heat stress occurs when the human body feels thermal discomfort or heat injury due to exposure to the ambient air. Intensifying heat stress events have been widely reported in many regions of the world during the past decades (Tang et al 2012, 2014, Sun et al 2014, Michael et al 2018). They are projected to be more frequent and intense in the future (Meehl and Tebaldi 2004, Schubert et al 2014, Dong et al 2015, Leng et al 2016, Mora et al 2017). Heat stress from temperature extremes may result in severe problems of human health and ecosystem function and cause dramatic economic losses (Ciais et al 2005, Gasparrini and Armstrong 2011, Sheridan and Allen 2018), especially in regions where adaptive capacity of society is limited (IPCC 2012, Miralles et al 2012, Lee et al 2016). Increased high temperature extremes in the past have been found to be associated with the strong local feedback of soil moisture-temperature at worldwide regions (Hirschi et al 2011, Mueller and Seneviratne 2012, Hauser et al 2016, Herold et al 2016). The feedback shows that preceding soil moisture deficit can result in more frequent high temperature extremes and consequently persistent heat stress than under normal or wetter conditions (Seneviratne et al 2010, Alexander 2011, Miralles et al 2012, 2014). As shown by Mueller and Seneviratne (2012), the impact of moisture deficits on the number of high temperature days is asymmetric, i.e. high frequency of hot days is most strongly influenced by the moisture conditions, while the influence on the smaller numbers of hot days is much weaker.
Regarding the heat stress events, most of the previous studies mainly focused on the high temperature extremes and their relationships with soil dryness (Schubert et al 2014, Mazdiyasni and AghaKouchak 2015). However, the thermal comfort of human bodies depends not only on surface air temperature but also on humidity. Recently, oppressive heat stress (i.e. bodily thermal comfort), indicated by the combination of temperature and humidity (e.g. Steadman 1984), and its impact on human beings have been assessed for the past (Willett and Sherwood 2012, Sippel et al 2016, Wehner et al 2016) and the future (Im et al 2017, Lee and Min 2018, Li et al 2018). Such assessments of oppressive heat stress demonstrated a narrower adaptation space for humans under future climate change than the assessments based on high temperature criteria alone (Sherwood and Huber 2010, Liu et al 2018). Thus, understanding oppressive heat stress would have significant implications for human adaptation to a warming world.
Strong links between preceding precipitation and oppressive heat stress have been found in Illinois of the USA (Ford and Schoof 2016, 2017) and Eastern China (Liu et al 2017). To date, however, the influence of preceding wet soil conditions on the development of heat stress is insufficiently well understood in lower latitudes where about 5 billion people live, although considerable heat stress events caused by high temperature and humidity have been reported in these regions (Dunne et al 2013, Im et al 2017). Thus, further investigations are needed to understand the land-atmosphere coupling during heat stress events, which would be instrumental for better predictions of the occurrence of future heat stress events by climate models.
This study investigates the relations between preceding rainfall and heat stress in the hottest month in low latitudes (40S to 40N) based on in situ observations and reanalysis datasets. Following the work of Mueller and Seneviratne (2012), we aim to find generally prevalent relationships regarding preceding surface moisture and the two types of heat stress events in low latitudes. The relationships can provide primary information of the land-atmosphere interaction in these regions. We organize this paper as follows. The methods and data used in this study are presented in section 2, results are shown in section 3, and discussion and conclusions are presented in section 4.
2. Methods and data
We examine the correlations between preceding standardized precipitation index (SPI), which is a proxy of soil moisture conditions, and heat stress events in the hottest month for the period of 1979–2016. The number of hot days (NHD, defined in the Methods section) based on daily maximum wet-bulb globe temperature (WBGT) (Wx) is calculated as a measure of oppressive heat stress events in the hottest month. Using correlation analysis and quantile regression methods, we reveal the links between the probability of oppressive heat stress occurrence and preceding SPI, and identify hotspot regions with a strong local feedback for further in-depth analysis. For comparison, the same analyses are also performed for the NHD based on only daily maximum temperature (Tx).
2.1. Climate data
We used sub-daily (hourly or 3-hourly) records of surface air temperature and WBGT from the quality-controlled integrated surface database (ISD) provided by the UK Met Office Hadley Centre (HadISD). HadISD is a global and long-term dataset based on the station data archived in the ISD at National Oceanic and Atmospheric Administration's National Centers for Environmental Information (Smith et al 2011, Dunn et al 2012, 2014, 2016). From 7877 stations of the HadISD version 2.0.1.2016f, we selected for our analysis only stations with recording period of more than 20 years during the 1979–2016 period. The selection gave us 2429 and 2038 stations for the surface air temperature and WBGT, respectively (see figure S1 is available online at stacks.iop.org/ERL/14/044010/mmedia).
We used global gridded monthly precipitation from the Climatic Research Unit (CRU) TS dataset version 4.01 (Harris et al 2014) to estimate the 3-month SPIs during the period of 1979–2016. For the same period, we retrieved several land surface variables, including precipitation, temperature, dew point temperature, surface pressure, and latent heat fluxes (evapotranspiration), from the ECMWF ERA-Interim reanalysis (ERA, Dee et al 2011). To demonstrate that the result is independent of dataset, the National Centers for Environmental Prediction reanalysis 2 dataset (NCEP, Kanamitsu et al 2002) with a spatial resolution of around 0.95° is also used to estimate the correlations between SPI and NHD. The ERA reanalysis dataset has a full coverage of low latitudes with a spatial resolution of 0.75° and is used for a better illustration of spatial characteristics of heat stress events and insights into the land-atmosphere coupling.
2.2. Standardized precipitation index
The SPI (McKee et al 1993) is widely used as a proxy of soil moisture conditions (e.g. Hirschi et al 2011, Liu et al 2017). Global soil moisture products are also available (e.g. AMSR2, Jackson et al 2018), although their spatial and temporal coverage is limited and the temporal hydrological variability is less pronounced compared to the proxy (Hirschi et al 2014). SPI can be estimated from observations and can be easily computed nearly everywhere over the global land areas, which makes it useful as a climate predictor. The 3-month SPIs were found to be closely correlated with temperature extremes in previous studies (Hirschi et al 2011, Mueller and Seneviratne 2012). In this study, the 3-month SPIs preceding the hottest month (hereafter referred to as CRU SPI) are calculated based on CRU monthly precipitation at the grid cells determined by the latitudes and longitudes of HadISD stations. The half-degree CRU SPIs are regridded at the resolution of 0.75° by averaging the values of the nearest half-degree cells for calculating correlations between CRU SPI and ERA NHD. Correlations between SPIs and NHDs based on ERA and NCEP datasets are also calculated at their original spatial resolution. Following Hirschi et al (2011), the dry and wet conditions (years) are identified when the SPI values are below −0.5 and above 0.5, respectively.
2.3. Heat stress index
For each station, we calculate daily maximum air temperature (Tx) and WBGT (Wx) using the sub-daily records from HadISD. WBGT is an integrated heat stress indicator that combines dry-bulb temperature and humidity (Budd 2008). It has been widely used for assessing the risk to human health under heat stress and adaptation to climate change (e.g. Sherwood and Huber 2010, Im et al 2017). We estimate WBGT from ERA and NCEP using the same equation as Liu et al (2017): WBGT = 0.567T + 0.393e + 3.94, where T is temperature (°C), and e is simultaneous water vapor pressure (hPa) estimated from temperature and dew point temperature in ERA and from specific humidity and surface pressure in NCEP.
Our analyses focus on the hottest month (usually in the mid-summer) for calculation of Tx and Wx (see figure S1 in SI for the hottest month indicated by Tx and Wx). The number of hot days (NHD) per month, which is defined here as the number of days with Tx (referred to as NHD-Tx) or Wx (referred to as NHD-Wx) exceeding the 90th percentile in the month, were used as the measure of heat stress at the monthly time scale. NHD-Wx represents oppressive hot days with hot and wet weather and NHD-Tx indicates hot days without the constraint of atmospheric humidity. Here we term the NHD-Wx as 'oppressive hot days' to differentiate it from the 'hot days' as indicated by NHD-Tx. A time-window of 5 d centered on each day of the month is applied for the study period (38 years). Therefore, more robust estimates of the 90th percentile can be obtained from the 190 (5 × 38) daily values. An above-average NHD is identified when the NHD of a year is larger than the average NHD of all years. The probability of occurrence of an above-average NHD after dry (wet) conditions is estimated as the ratio (in %) of the number of years with above-average NHD after dry (wet) conditions to the total numbers of dry (wet) years.
2.4. Quantile regression
We used quantile regression to examine the influence of preceding rainfall on heat stress. Previous studies (e.g. Hirschi et al 2011, Mueller and Seneviratne 2012) have found that the impact of SPI on NHD is asymmetric therefore quantile regression can offer a more complete picture of this relationship. The quantile regression was introduced by Koenker and Bassett (1978) and can be viewed as an extension of the ordinary least-square regression to a set of quantiles, which can better represent how the response variable is related to the independent variable (Koenker and Hallock 2001). It has been increasingly used to characterize the asymmetrical relationships between hydroclimate extremes and climate change (see, Hirschi et al 2011, Herold et al 2016, Ford and Schoof 2016). In this study, the SPI and NHD-Tx/NHD-Wx relationships are assessed using quantile regression models by fitting the 0.1, 0.3, 0.5, 0.7 and 0.9 quantiles, which basically profile the data distribution, of NHD-Tx/NHD-Wx to the SPI values.
Below, we briefly describe the calculation of quantile regression which was detailed by Koenker and Hallock (2001). For a classical linear regression, the mean of a response variable Y is linearly related to a random variable X by

where β is slope and γ is intercept. In a quantile regression, the E[Y∣X] is replaced by a conditional quantile ![${Q}_{\left[Y| X\right]}\left(\tau \in \left[0,\,1\right]\right)$](https://content.cld.iop.org/journals/1748-9326/14/4/044010/revision2/erlab018aieqn1.gif) and the regression can be expressed as
and the regression can be expressed as

The slope βτ and intercept γτ of the quantile regression can be obtained by solving the asymmetrically weighted absolute residuals:

where argmin denotes argument of minimum, the points at which the function values are minimized.  is the titled absolute value function that gives different weights to positive and negative residuals (Koenker and Hallock 2001):

3. Results
Figure 1 shows the correlations between the NHD in the hottest month and the preceding 3-month SPI for both HadISD stations and ERA grid cells. NHD-Tx and preceding CRU SPI shows statistically significant (at the 90% confidence level, the same hereafter) and negative correlations over large areas for both HadISD stations (figure 1(a)) and ERA grids (figure 1(b)), including 60% of HadISD stations and 49% of ERA land areas (see table S1). The dominant negative correlations indicate that the link between preceding rainfall deficit and temperature extremes is widespread over the study area. Significant correlations between NHD-Wx and preceding SPI are less apparent and show heterogeneous spatial patterns for both HadISD (figure 1(c)) and ERA (figure 1(d)). Overall, there are about 28% of HadISD stations and 21% of ERA land areas showing significant correlations between SPI and NHD-Wx. The proportion of stations (land areas) showing negative correlations is larger than that of positive correlations. However, in contrast to NDH-Tx, positive, significant correlations account for a much larger proportion (27% and 40% for figures 1(c) and (d), respectively) of the stations (land areas). The pattern of these statistically significant correlations is remarkably distinct from that between NHD-Tx and preceding SPI in figures 1(a) and (b), which are characterized by predominantly negative correlations. Similar patterns are found between NHD-Wx and SPI based on the ERA-Interim (figure 1(e)) and NCEP (figure 1(f)) datasets, and significant positive correlations between NHD-Wx and SPI account for more than a half of the total land area with significant correlations (66% and 63%, respectively). It should be noted that the correlations in figures 1(a) and (c) may be not fully revealed due to the relatively sparse station network (see figure S1). These results imply different links between preceding rainfall and the consequential heat stress events indicated by Tx and Wx.

Figure 1. Pearson correlations between NHD in the hottest month and preceding 3 months SPI. Correlations between SPI and NHD indicated by Tx (NHD-Tx, (a)) and NHD indicated by Wx (NHD-Wx, (c)), respectively, employing HadISD for NHD and CRU dataset for SPI, correlations between SPI, NHD-Tx (b) and NHD-Wx (d) employing ERA-Interim reanalysis for NHD and CRU dataset for SPI; correlations between SPI and NHD-Wx employing ERA-Interim reanalysis (e) and NCEP reanalysis (f) for both NHD and SPI. Stations with non-significant correlations are not displayed in (a) and (c) for a better view. Statistically significant correlations (at the 90% confidence level) in (b) and (d) are indicated by stippling areas. The numbers beside 'Neg' ('Pos') show the ratio of the stations/areas with significant negative (positive) correlations to the total stations/areas with significant correlations. The hotspot region in South America (24S-35S, 52W-63W) is identified by black rectangle in the maps.
Download figure:
Standard image High-resolution imageFigure 2 shows the probability of occurrence of an above-average NHD-Tx/NHD-Wx in the hottest month after dry and wet conditions. More than half of the years show above-average NHD-Tx values after dry conditions (figure 2(a)), while much fewer years show above-average NHD-Tx values after wet conditions (figure 2(c)). Overall, larger probabilities of above-average NHD-Tx occurrence are observed after dry conditions (figure 2(e)). In contrast with NHD-Tx, less probabilities of above-average NHD-Wx are found after dry conditions (figure 2(b)), while more than 60% of the years show an above-average NHD-Wx following wet conditions in parts of South America, Africa, and West Asia (figure 2(d)). Figure 2(f) indicates that high NHD-Wx is more likely to occur after wet than dry conditions in some low latitude areas. In some parts of South America, Africa, and West Asia, wet years with above-average NHD-Wx outnumber dry years by more than 30%. However, there is a prominent spatial heterogeneity of the probabilities of above-average NHD-Wx. It is also noted that higher probabilities of above-average NHD-Wx after dry conditions are found in some areas of southern Brazil, northern India, and Indochina Peninsula. In the tropical zone, the results based on ERA SPIs and above-average NHD-Wx indicate even more significant prevalence of wet years over dry years (see figure S2).
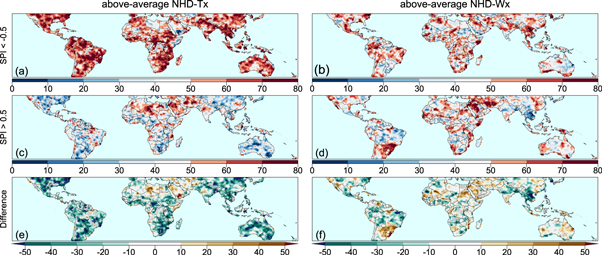
Figure 2. Probability of occurrence (%) of hot days after dry versus wet conditions for NHD-Tx (left panels) and NHD-Wx (right panels). The probability of occurrence for an above-average number of hot days in the respective hottest month of each year after dry conditions (SPI < −0.5, (a) and (b)), and wet conditions (SPI > 0.5, (c) and (d)), and their differences ((e) and (f)). The maps in this figure are smoothed with a moving box of 3 × 3 pixels for a better visual view. Grid cells with less than 4 wet/dry years are masked by grey color. Dry and wet conditions are defined by CRU SPI.
Download figure:
Standard image High-resolution imageIn order to further understand the underlying links between preceding rainfall and oppressive heat stress, we performed a hotspot analysis by choosing a region with a typical wet-warm climate in South America based on the significant and positive correlation (figures 1(c) and (d)) and prominent high probabilities of above-average NHD-Wx (figure 2(d) and (f)). Figure 3 shows the scatter plots of NHD-Tx and NHD-Wx from both HadISD and ERA dataset versus CRU SPI over the hotspot region (24S-35S, 52W-63W) in South America (see figure 1). There are 51 HadISD stations in total, among which 16 (21) stations show statistically significant correlations between SPI and NHD-Tx (NHD-Wx) within the hotspot region. For the ERA dataset, about 72% (41%) of the hotspot area show statistically significant correlations between SPI and NHD-Tx (NHD-Wx) (see table S2). In these panels, histograms of the relative frequency of NHD are shown for the wet and dry conditions, respectively, along with regression lines for the 0.1, 0.3, 0.5, 0.7, and 0.9 quantiles. The quantile regression slopes are negative (positive) and the magnitudes often increase with quantiles for NHD-Tx (NHD-Wx) (see table S3 for the regression coefficients). The regressions for quantile 0.9 are statistically significant for NHD-Wx for both the HadISD and ERA datasets (see table S3). The relative frequency shows that a larger NHD-Tx (NHD-Wx) often follows dry (wet) conditions, while a smaller NHD-Tx (NHD-Wx) is expected after wet (dry) conditions. The widening distributions of NHD-Tx (NHD-Wx) after drier (wetter) conditions and the gradually increasing slope magnitudes of the quantile regression lines indicate that dry (wet) conditions tend to have larger influences on oppressive heat stress in the hotspot region. The regression slopes of the selected quantiles are also estimated for each grid cell in the low latitudes and similar findings are obtained in many land areas (see figure S3).

Figure 3. Heat stress versus preceding 3-month SPI in the hotspot region in South America. (a) HadISD NHD-Tx versus CRU SPI, (b) HadISD NHD-Wx versus CRU SPI, (c) ERA NHD-Tx versus CRU SPI, (d) ERA NHD-Wx versus CRU SPI. The data points (N = 38 for each plot) are domain-averages of all stations or grid cells within the hotspot region for each year. NHDs in (a) and (b) are estimated from HadISD, and NHDs in (c) and (d) are estimated from ERA dataset. SPI is estimated from CRU dataset. The bars show the frequency of NHD (normalized by the number of data points within shade areas) after dry condition (tan) and wet conditions (blue), respectively.
Download figure:
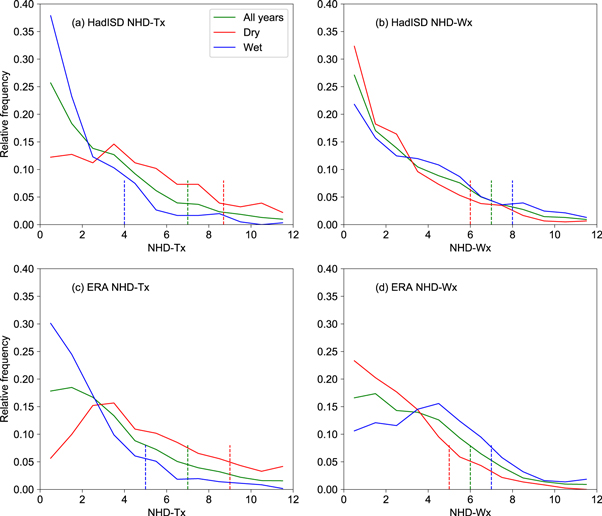
Standard image High-resolution imageFigure 4 shows the relative frequency (normalized by the total number of NHD) of NHD-Tx/NHD-Wx in the hotspot region from both the HadISD and ERA datasets for all, dry (SPI < −0.5) and wet (SPI > 0.5) years, with the 90th percentile of NHD-Tx and NHD-Wx denoted by vertical dashed lines. For both datasets, the relative frequency distribution of NHD-Tx generally has a small and short right tail for wet years and large right tail for dry years (figures 4(a) and (c)), while NHD-Wx has a longer right tail for wet years and a small right tail for dry years (figures 4(b) and (d)). The 90th percentiles of NHD-Tx are larger for dry years than those for wet years, while the opposite is found for NHD-Wx distributions. These results further demonstrate that the preceding rainfall (soil moisture) conditions have asymmetrical impacts on the distributions of NHD-Tx and NHD-Wx, resulting in larger influence on their high values.
Figure 4. Relative frequency distribution of NHD in the hotspot region in South America for all, dry and wet years. Distributions of NHD-Tx (a) and NHD-Wx (b) are estimated from the HadISD dataset, and distributions of NHD-Tx (c) and NHD-Wx (d) are estimated from the ERA dataset. Locations of the 90th percentile of the NHD distributions are identified for all (green dashed lines), dry (SPI < −0.5, red dashed lines) and wet (SPI > 0.5, blue dashed lines) years, respectively. Dry and wet years are defined by CRU SPI.
Download figure:
Standard image High-resolution image
4. Discussion and conclusions
Our analyses show statistically significant and positive correlations between preceding 3-month SPI and oppressive heat stress in the hottest month in several low latitude areas. It is generally consistent with previous studies in Eastern China (Liu et al 2017) and Illinois of the USA (Ford and Schoof 2016). The larger probability of occurrence of oppressive hot days (above-average NHD-Wx) after wet conditions than that after dry conditions indicates that abundant preceding rainfall favors oppressive hot days in the following month. This relationship has a paradoxical sign, when more preceding precipitation/cooling leads to more oppressive heat stress. On the other hand, the strong coupling between preceding rainfall deficit and extreme hot days is confirmed by the statistically significant negative correlations between preceding 3-month SPI and NHD-Tx in the hottest month, which is generally consistent with previous studies (e.g. Mueller and Seneviratne 2012). These suggest complex links between preceding rainfall and heat stress in these regions.
For the feedback between precipitation deficit and temperature, humidity has little effect on modulating heat stress of high temperature. High temperatures often make the soil drier and thus the following heat stress event could be more persistent or extended (Alexander 2011, Koster et al 2016). Moisture deficit results in less evapotranspiration (latent heat flux) and consequently larger sensible heat flux that elevates surface temperature, while abundant rainfall may produce larger evapotranspiration, thus enhance the evaporative cooling effect on the land surface.
However, the strong feedback between precipitation and oppressive heat stress may have different consequences in some humid areas where the interaction is dominated by evapotranspiration (latent heat flux), and humidity would become an influential factor for oppressive heat stress. Our analyses, following those of Mueller and Seneviratne (2012), show that abundant moisture could probably induce relatively lowered temperature but high humidity, i.e. more oppressive days in warm and wet regions. We infer that the elevated evapotranspiration resulting from abundant rainfall may have a limited cooling effect, which can hardly counteract the intensified oppressive heat stress arising from the combined effect of high temperature and humidity.
Our analyses suggest that the precipitation deficit-high temperature feedback and the abundant rainfall-oppressive heat stress feedback may coexist in some low latitude areas. Evapotranspiration may increase after both dry heat and wet heat weather conditions (see figure S4) and consequently results in drier soil (Teuling et al 2013) or probably more rainfall (Schär et al 1999), depending on soil moisture conditions. Thus, it is likely that soil moisture availability for evapotranspiration plays an important role in the development of heat stress events, that is, to be dry hot days or oppressive hot days (Ford and Schoof 2017).
Relative humidity in the hottest month is strongly related to the preceding 3-month SPI (see figures S5(a) and (c)), which may contribute to the positive correlations between SPI and NHD-Wx. The hottest month after wet conditions often has an elevated relative humidity except for some regions like the Amazon River and Congo River where humidity is always high (figures S5(b) and (d)). The elevated atmospheric moisture may not contribute much water vapor to local rainfall directly but can increase precipitation efficiency (Schär et al 1999) and consequently produce persistent wet weather conditions. Thus, the feedback between oppressive heat stress and abundant preceding rainfall seem to be partly driven by the strong coupling between soil moisture and precipitation (Koster et al 2004). In fact, a few regions (e.g. eastern China and West Asia) with that coupling shown by Koster et al (2004) are overlapped with the hotspot regions suggested by our analyses (figures 1(c) and (d)). However, it remains a challenge to fully understand the coupling between soil moisture, precipitation and temperature extremes (Lorenz et al 2016, Liu et al 2017), which calls for further investigations with models and high-quality observations such as well-developed soil moisture data and high-density network of meteorological stations.
This study confirms the previously reported soil moisture-high temperature feedback (Mueller and Seneviratne 2012) and highlights the distinct roles of preceding rainfall in regulating heat stress and identifies hot spots with strong links between abundant rainfall and oppressive heat stress in low latitudes. We emphasize that both soil moisture—heat stress feedbacks need to be considered for the prediction of heat stress events in some low latitude regions. The land-atmosphere coupling may become stronger as 'wet may get wetter and dry may get dryer' (Greve et al 2014) in a warming world. Therefore, in the humid areas, the land-atmosphere interaction would result in high humidity and oppressive heat stress, which would be further intensified in the future due to the weakening constraint of soil moisture on air temperature (Rasmijn et al 2018). In the dry areas, the precipitation deficit-temperature feedback would be strengthened and result in more heat stress of high temperature. By extending the understanding of the land-atmosphere coupling in heat stress events, our findings could be used for the seasonal forecast and projection of heat stress occurrences in low latitudes.
Acknowledgments
This research is supported by the National Natural Science Foundation of China (41730645, 41790424, 41425002, and 41877164) and the Key Research Program of the Chinese Academy of Sciences (KGFZD-135-17-009-3). W Liu acknowledges the support received from the Early Postdoctoral Mobility Fellowship awarded by Swiss National Science Foundation (P2EZP2_175096). Grant 14.B25.31.0026 of the Ministry of Education and Science of the Russian Federation provided support to P Groisman for his work conducted at the P P Shirshov Institute of Oceanology.