

Abstract
Proxy records have provided major insights into the variability of past climates over long timescales. However, for much of the Southern Hemisphere, the ability to identify spatial patterns of past climatic variability is constrained by the sparse distribution of proxy records. This is particularly true for mainland Australia, where relatively few proxy records are located. Here, we (1) assess the potential to use existing proxy records in the Australasian region—starting with the only two multi-century tree-ring proxies from mainland Australia—to reveal spatial patterns of past hydroclimatic variability across the western third of the continent, and (2) identify strategic locations to target for the development of new proxy records. We show that the two existing tree-ring records allow robust reconstructions of past hydroclimatic variability over spatially broad areas (i.e. > 3° × 3°) in inland north- and south-western Australia. Our results reveal synchronous periods of drought and wet conditions between the inland northern and southern regions of western Australia as well as a generally anti-phase relationship with hydroclimate in eastern Australia over the last two centuries. The inclusion of 174 tree-ring proxy records from Tasmania, New Zealand and Indonesia and a coral record from Queensland did not improve the reconstruction potential over western Australia. However, our findings suggest that the addition of relatively few new proxy records from key locations in western Australia that currently have low reconstruction skill will enable the development of a comprehensive drought atlas for the region, and provide a critical link to the drought atlases of monsoonal Asia and eastern Australia and New Zealand.
Export citation and abstract BibTeX RIS

Original content from this work may be used under the terms of the Creative Commons Attribution 3.0 licence.
Any further distribution of this work must maintain attribution to the author(s) and the title of the work, journal citation and DOI.
Introduction
Recent prolonged droughts, long-term rainfall declines and extreme pluvial events have highlighted Australia's vulnerability to hydroclimatic extremes and the urgent need to understand the mechanisms and timescales of hydroclimatic variability (e.g. Indian Ocean Climate Initiative 2002, van den Honert and McAneney 2011, Van Dijk et al 2013). However, it is becoming increasingly apparent that instrumental climate records for the Australian continent do not capture the full range of hydroclimatic variability required to understand the significance and drivers of recent extreme events. Proxy records of climate (i.e. preserved physical, biological or chemical evidence of climatic conditions) can be calibrated against instrumental records and used to infer past climatic conditions. However, while proxy records from a diversity of natural archives have been used to significantly extend climate records (by centuries to millennia) and have provided significant insights into the drivers of past hydroclimatic variability in Australia (e.g. from corals (Lough 2007, 2011), speleothems (e.g. Denniston et al 2013, 2015, Haig et al 2014), sediments (Bowler et al 2003, Magee et al 2004, Proske et al 2014, Rouillard et al 2016), ice cores (Tozer et al 2015, Turney et al 2015, Vance et al 2013, 2015) and tree rings (e.g. Allen et al 2015, Cook et al 2000, Cullen and Grierson 2009, O'Donnell et al 2015, 2016), the sparse spatial coverage of high-resolution proxy records across the Southern Hemisphere continues to limit our understanding of past climatic variability (PAGES 2k Consortium 2017).
In contrast, the comparatively dense spatial coverage of proxy records across the Northern Hemisphere has enabled the development of regional 'drought atlases', which have revealed past spatial and temporal patterns of hydroclimate across North America (NADA and Living Blended drought atlas, LBDA, Cook et al 2004, 2007, 2010b), Mexico (MXDA, Stahle et al 2016), Monsoonal Asia (MADA, Cook et al 2010a) and Europe ('Old World' drought atlas, OWDA, Cook et al 2015). Importantly, these drought atlases have been used to place drought periods of the modern era in the context of hydroclimatic variability of the last millennium or more. For example, the NADA and LBDA showed there were drought periods prior to the 19th century in North America that were of a greater duration and magnitude (i.e. 'megadroughts') than any drought period during the 20th Century (Cook et al 2010b). Similarly, the OWDA shows that a drying trend since the 1970s in the Mediterranean region is not unusual in the context of the last millennium (Cook et al 2015), with the exception of the Levant region of the Middle East, where a recent 15 year drought period was the driest in the last 900 years (Cook et al 2016a). These drought atlases have also provided insights into the role of broad-scale circulation features on continental and hemispheric scales. For example, 'megadrought' periods identified in both North America and Europe in the mid-15th Century indicate the possibility that Atlantic atmospheric circulation dynamics (i.e. the North Atlantic Oscillation) may have played a role in synchronising drought across these continents (Cook et al 2015, Oglesby et al 2012).
The sparse spatial coverage of proxy climate records limits the potential to develop similar drought atlases in Australia. However, hydroclimate in Australia is relatively coherent across large spatial scales, extending over hundreds to thousands of kilometres (D'Arrigo et al 2008, Risbey et al 2009) owing to low topographic complexity across the continent and strong and spatially broad influences of large-scale ocean-atmosphere modes of variability, such as the Indian Ocean Dipole (IOD), Southern Annular Mode (SAM) and the El Niño Southern Oscillation (ENSO) (see Risbey et al 2009 for a discussion of the drivers of rainfall variability in Australia). This high degree of coherency of hydroclimate in Australia may allow the development of robust reconstructions of past temporal and spatial variability of hydroclimate (i.e. drought atlases) across Australia from comparatively fewer climate proxies than other regions of the world. For example, D'Arrigo et al (2008) showed the potential to reconstruct hydroclimate (as the Palmer Drought Severity Index, PDSI) across northern and eastern Australia using only three proxies: a tree-ring chronology from northern central Australia (Baker et al 2008), a tree-ring and coral-based reconstruction of PDSI from Java, Indonesia (D'Arrigo et al 2006) and a coral-based reconstruction of rainfall from north-eastern Australia (Lough 2007). More recently, these same tree-ring and coral chronologies along with 174 tree-ring chronologies from western and northern Australia, Tasmania and New Zealand were utilised to develop a drought atlas for eastern Australia and New Zealand (the ANZDA; Palmer et al 2015). The development of a robust reconstruction of drought across eastern Australia from these remote chronologies was possible because of strong teleconnections between Indonesia, eastern Australia and New Zealand, driven by ocean-atmosphere circulation features over the Pacific Ocean (e.g. ENSO and the Interdecadal Pacific Oscillation, IPO) (Palmer et al 2015). Similarly, an apparent teleconnection in the Indian Ocean mid-latitudes that links the climate of eastern Antarctica with that of eastern Australia (Tozer et al 2015, Vance et al 2013, 2015, and potentially southwest Australia, van Ommen and Morgan 2010) has enabled reconstructions of both the IPO and eastern Australian rainfall using sea salt records from ice cores at Law Dome, Antarctica (Tozer et al 2015, Vance et al 2013).
While broad-scale teleconnections have allowed high-resolution reconstructions of northern and eastern Australian hydroclimate from remote proxies in the Australasian region, the same is not necessarily true for western Australia. Across northern and eastern Australia, ocean-atmosphere circulation in the Pacific is the dominant influence on hydroclimate; however, the influence of Pacific Ocean climate is generally much weaker and more variable in western Australia (Risbey et al 2009). Hydroclimate across western Australia is more strongly influenced by ocean-atmosphere circulation features over the Indian and Southern Oceans, such as the IOD, Ningaloo Niño (NN) and SAM (Doi et al 2015, Fierro and Leslie 2013, Hendon et al 2007, 2014, Kataoka et al 2013, Marshall et al 2015, Raut et al 2014, Risbey et al 2009). Consequently, different climate influences may lead to disparate spatio-temporal patterns of drought between western Australia and northern and eastern Australia, which may limit what can be interpreted across western Australia from existing remote proxies. This gap in our understanding of long-term hydroclimatic variability across western Australia is of considerable concern given that recent changes in precipitation patterns have been observed across the region. For example, since the 1960s, temperate southwest western Australia has been severely impacted by a drastic (~20%) multi-decadal decline in rainfall during the dominant rainfall season (autumn-winter; Cai and Cowan 2006, Indian Ocean Climate Initiative 2002). At the same time, the semi-arid and tropical north of western Australia has experienced an increase in summer-autumn rainfall (Lavender and Abbs 2013, O'Donnell et al 2015, Shi et al 2008). The significance of these recent changes in the context of long-term climatic variability remains unclear.
Our aim here is to determine the extent to which the only two high-resolution tree-ring chronologies developed in western Australia (for the inland north (O'Donnell et al 2015) and south (Cullen and Grierson 2009)) can explain variability in hydroclimate (as PDSI) across western Australia. We also test if including 175 more remote tree-ring and coral records from the Australasian region in addition to the two western Australian records can improve the reconstruction skill for PDSI across western Australia. We seek to identify areas of low reconstruction skill that can be specifically targeted for the development of new proxies needed to extend understanding of long-term hydroclimatic variability across western Australia.
Data
Palmer Drought Severity Index
We use the Palmer Drought Severity Index (PDSI) for our reconstructions to maintain consistency with previous studies. The PDSI has been the preferred metric for reconstructing past variations in hydroclimate in the drought atlas studies of North America (Cook et al 2007), Mexico (Stahle et al 2016), Europe (Cook et al 2015), Asia (Cook et al 2010a) and eastern Australia and New Zealand (Palmer et al 2015). The PDSI is a widely used measure of meteorological drought or more specifically, soil moisture availability, which is based on a water balance model calculated using instrumental records of precipitation and temperature and a general soil water holding capacity parameter (Palmer 1965, van der Schrier et al 2013). The PDSI incorporates previous months conditions resulting in strong temporal autocorrelation over several months (Wells et al 2004).
We used the global 0.5° grid of the self-calibrating PDSI (sc-PDSI; van der Schrier et al 2013) available by application from the British Atmospheric Data Centre (http://badc.nerc.ac.uk). We extracted sc-PDSI data for each of the 923 0.5° grid points in the western Australian region (12–36°S and 110–130°E). We excluded sc-PDSI data prior to 1910 from further analyses because there are very few instrumental precipitation and temperature records across western Australia prior to 1910 (figure S1(a) available at stacks.iop.org/ERL/13/024020/mmedia), making the earliest (1901–1909) sc-PDSI data for this region relatively unreliable. For much of western Australia, mean PDSI over the 1910–2012 period is below zero. Prior to analysis, we calculated anomalies of the observed PDSI (i.e. re-centred PDSI to a mean of zero) to highlight wet and dry periods in relation to the baseline conditions for each grid point.
Chronologies
We utilised two chronologies developed from ring widths of Callitris columellaris trees in the inland north (O'Donnell et al 2015) and south (Cullen and Grierson 2009) of western Australia (figure 1). We also utlised another 175 tree-ring and coral chronologies from the Australasian region that were used to develop the ANZDA (see Palmer et al 2015 and Cook et al 2016b for details.)
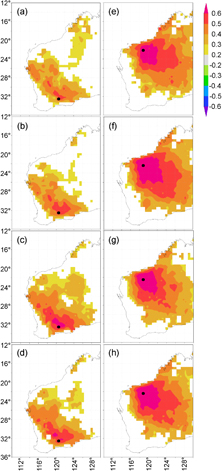
Figure 1. Significant (α = 0.05) correlations between gridded PDSI and the south (a)−(d) and the north (e)–(h) western Australian tree-ring chronologies (1910–2010 C.E), for (a) and (e) austral summer (December–February); (b) and (f) austral summer-autumn (December–May); (c) and (g) austral autumn-winter (March–August); and (d) and (h) austral summer-winter (December–August). PDSI data are the Climatic Research Unit's scPDSI version 3.25; available from Climate Explorer: http://climexp.knmi.nl/). Correlation maps were produced using Climate Explorer. The locations of the chronologies are indicated by black dots.
Download figure:
Standard image High-resolution imageBoth western Australian chronologies are located in semi-arid climate zones, where water availability is the main factor limiting tree growth. The climate of the south chronology is characterised as semi-arid Mediterranean, where the majority of the ca. 250 mm average annual rainfall falls in the austral autumn and winter (March to September) (see Cullen and Grierson 2009). Over the last half century at least, autumn-winter rainfall in this region has been most strongly influenced by atmospheric blocking activity, particularly in the Great Australian Bight region (O'Donnell et al 2011, Risbey et al 2009). Atmospheric blocking refers to the formation of high-pressure systems over the Southern Ocean, which block the west–east movement of low-pressure systems in the mid-latitudes, driving cut-off lows towards the equator. When these blocking high-pressure systems form in the Great Australian Bight region (~120°E) they favour rainfall over the south coast of western Australia (Risbey et al 2009). The south site is also occasionally subject to episodic extreme rainfall events in the summer and early autumn months (December–March) associated with tropical cyclones tracking from the northwest coast of the continent (O'Donnell et al 2011). The climate of the north chronology is considered sub-tropical semi-arid with an average annual rainfall of ca. 300 mm, which falls predominantly in the austral summer and autumn months (December–May). More than half of all rainfall at the north site is attributed to intense episodic events in summer-autumn associated with long-lived closed lows (i.e. monsoonal depressions and tropical cyclones; Lavender and Abbs 2013). Over at least the last half century, summer-autumn rainfall in this region has been most strongly influenced by the Southern Annular Mode (O'Donnell et al 2015, Risbey et al 2009), which, during its positive phase in summer-autumn, drives a poleward shift in the subtropical dry zone resulting in higher rainfall in the subtropics of the Southern Hemisphere (Hendon et al 2014).
We updated the south (Cullen and Grierson 2009) chronology to 2013 with new samples collected in April 2014. Both chronologies were detrended in a signal-free framework (Melvin and Briffa 2008) and indices calculated as ratios from an age-dependent spline (Melvin et al 2007). Both chronologies are strongly and positively correlated with precipitation (r > 0.7) during their respective dominant rainfall seasons, i.e. in the summer-autumn season (December–May) for the north chronology (O'Donnell et al 2015) and in the autumn-winter season (March–September) for the south chronology (Cullen and Grierson 2009). The south chronology is 359 years long (1655–2013) but the north chronology only covers the 1802–2012 period. Consequently, we only use the 211-year period (1802–2012) common to both chronologies in further analyses.
Methods
Spatial reconstruction of PDSI
PDSI has strong month-to-month autocorrelation (r1 = 0.897) prescribed in its calculation (Palmer 1965, Wells et al 2004). Consequently, despite the dominant rainfall season of inland north-western Australia (austral summer-autumn) leading that of inland south-western Australia (austral autumn-winter) by several months, both of the western Australian tree-ring chronologies were significantly correlated with PDSI throughout the austral summer-autumn-winter months across broad regions of western Australia (figure 1). The season with the strongest correlation (r > 0.6) that was common to both chronologies was autumn-winter (March–August) of the current year of tree growth (figures 1(c) and (g)). Consequently, we chose the austral autumn-winter (March–August) period as the season of PDSI to reconstruct in western Australia. All previous drought atlas studies, including the eastern Australian and New Zealand drought atlas (ANZDA; Palmer et al 2015) used a three-month summer period (December–February in the Southern Hemisphere and June–August in the Northern Hemisphere) as the season to reconstruct. We did not use the same season here because the three-month summer (December–February) season does not fully capture the main season of rainfall (autumn-winter; March–August) and therefore meaningful drought for inland south-western Australia (figure 1(a)). Given the inherent autocorrelation in the calculation of monthly PDSI, each of the PDSI reconstructions represents the hydroclimatic conditions of much broader seasons than their prescribed season of calculation. Consequently, despite differences in the seasons used for reconstruction, the western Australian and eastern Australian reconstructions (Palmer et al 2015) reflect hydroclimatic conditions across broad and overlapping seasons.
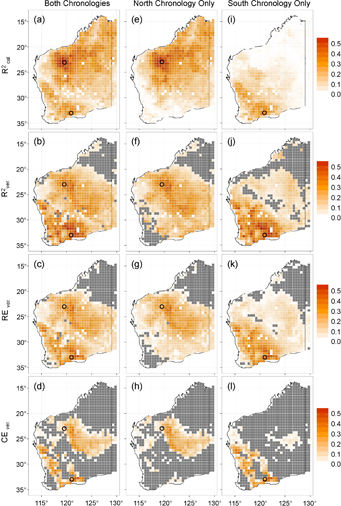
Figure 2. Calibration and verification statistics for the reconstructions of March–August PDSI for each of the 923 0.5° grid points in western Australia using (a)–(d) both western Australian tree-ring chronologies, (e)–(h) only the chronology from inland north-western Australia, and (i)–(l) only the chronology from inland south-western Australia as predictors. Statistics include: (a), (e) and (i) R2 of the calibration period (1955–2012); and (b), (f) and (j) R2; (c), (g) and (k) reduction of error, RE; and (d),(h) and (l) coefficient of efficiency, CE of the verification period (1910–1954). Grey shading indicates grid points where verification tests failed (i.e. R2 not significantly > 0 at α = 0.1, 1-sided; CE or RE < 0). Squares that are shaded white consistently across all figures (a)–(l) represent grid points for which there are no reliable observed PDSI data. Open circles indicate locations of the two chronologies.
Download figure:
Standard image High-resolution imageWe used the point-by-point regression method (PPR, Cook et al 1999, 2007, 2010a) to reconstruct gridded PDSI across western Australia using the two western Australian tree-ring chronologies as predictors, first separately and then together. The 'search radius' parameter of PPR is usually used to include only those chronologies proximal to each grid point and therefore likely to be mechanistically linked to climate at each grid point (Cook et al 2010a). However, given the low topographic variability in western Australia, broad spatial coherence of climate, and distance between the two western Australian chronologies (>1000 km), we relaxed this option (search radius of 2000 km) to allow our two chronologies to reconstruct PDSI at all grid points across the region. A similarly expanded search radius was used to reconstruct the ANZDA in eastern Australia (Palmer et al 2015).
We used methods consistent with Cook et al (2010a, 2015) and Palmer et al (2015) and ran a series of 16 models with or without autoregressive modelling in which the tree-ring series found within the search radius of each grid point were weighted by a power (0, 0.1, 0.25, 0.5, 0.67, 1.0, 1.5, or 2.0) of their correlation with PDSI at the grid point over the calibration period. The ensemble members were then averaged together to form a 16 member ensemble mean reconstruction. To test the robustness of the model, we undertook split-period calibration/verification analysis (Cook and Kairiukstis 1990, Fritts 1976). We used the 1955–2012 period for calibration and the 1910–1954 period for verification. We chose the 1955–2012 period for calibration to ensure that our models were calibrated on the highest-quality climate data period; the number and spatial coverage of climate stations in western Australia, particularly in inland areas of western Australia, were much greater in the latter (1955–2012) than in the early (1910–1954) period (figure S1(b)). We used two rigorous tests of fit, the reduction of error (RE) and the coefficient of efficiency (CE) to verify the model for each grid point.
In parallel with the above, we also investigated the potential to improve the spatial coverage and strength of our model by including 175 other tree-ring and coral proxy records from the Australasian region. We included existing tree-ring chronologies from northern and eastern Australia (Northern Territory and Tasmania), Indonesia and New Zealand as well as a coral chronology from north-eastern Australia (i.e. all chronologies used to produce the ANZDA; see Palmer et al 2015) as predictors of western Australian PDSI. We used the same methods as described above, but altered the calibration (1940–1975) and verification (1910–1939) periods to allow for several of the New Zealand chronologies that do not extend beyond 1975 to be included in the model. As above, the latter period (1940–1975) was used for calibration, as this was the period with greater spatial coverage of instrumental climate stations across western Australia (figure S1(b)). We also relaxed the search radius criterion further (to 7000 km) to allow all chronologies to potentially be included in the model.
Temporal reconstructions of PDSI
We spatially averaged the ensemble reconstructed Mar–August PDSI anomalies to generate time series of past hydroclimatic variability for areas of western Australia where the PPR model passed all calibration and verification tests. In particular, we selected two areas of arbitrary size where the variance explained (calibration and verification R2) by the two chronologies in the PPR models was relatively high (i.e. > 0.3) and tests of fit were passed (CE and RE > 0). Consequently, we chose two areas: 21.5–24.5°S, 119–122°E in the north and 30.5–34°S, 120–122.5°E in the south of western Australia. We rescaled the variance of reconstructed PDSI anomalies to match the variance of the observed PDSI over the calibration period to allow comparisons to be made between extreme events in the observed period and those in the past. We used a 20 year loess smoothing curve to highlight decadal-scale variation in the reconstructed and observed PDSI anomalies.
Results and discussion
Potential to reconstruct spatial patterns of drought from tree rings
Each of the models using only one chronology as a predictor passed all calibration (R2cal.) and verification tests (R2ver., REver., CEver.) across broad regions (i.e. > 3° × 3°) near each of their locations in the inland north and inland south of western Australia (figures 2 (e)–(l)). Using both chronologies as predictors, the final model can robustly reconstruct March–August PDSI (i.e. pass all calibration and verification tests) over much of inland western Australia, but the strongest explanatory power (R2cal. and R2ver > 0.3) remains in the two broad regions centred on the locations of the two chronologies (figures 2 (a)–(d)). We further examine reconstructed PDSI in these areas in the following section.
All of the models showed low reconstruction skill in areas of western Australia that are more remote from the locations of the chronologies (figures 2 (a)–(d)). The final (two-predictor) PPR model passed all verification tests (CEver. and REver.) for grid points along the mid-west coast and central inland areas of western Australia, but the variance explained in these areas was relatively low (R2ver. < 0.2; figure 2(b)). Hence, while the two existing chronologies contain useful information about the variability of past hydroclimate in these regions, for our purposes we consider that the variance explained is not sufficient to reliably reconstruct PDSI in these areas. Consequently, we excluded areas with R2ver. <0.2 from further interpretation of reconstructed PDSI. The final model failed to skilfully reproduce variability of drought (failed CEver., REver. and/or R2ver.) in the southwest, southeast and the north of western Australia (figures 2(b)–(d)). Differences in the dominant drivers (see Risbey et al 2009) and hence variability of hydroclimate among these areas mean that hydroclimatic variability of these areas cannot be reliably reconstructed using only the two existing tree-ring chronologies.
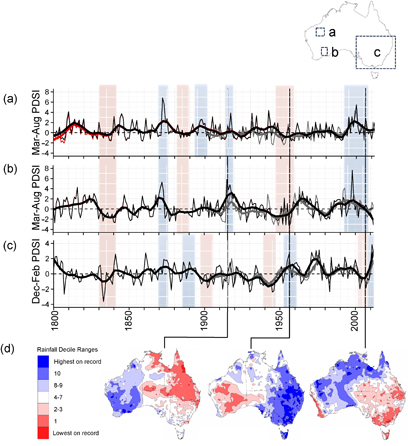
Figure 3. Temporal variation in reconstructed and observed PDSI anomalies in the inland north and south of western Australia and south-eastern Australia over the last two centuries. Reconstructed (black) and observed (grey) autumn-winter (March–August) PDSI anomalies for (a) inland north-western and (b) inland south-western Australia using the final two-predictor model and (c) summer (December–February) PDSI anomalies for south-eastern Australia (from Palmer et al 2015 and Cook et al 2016a). (d) Observed summer-winter (December–August) rainfall deciles across Australia in years when hydroclimatic conditions in inland western Australian were opposed to those in south-eastern Australia (1915, 1956, and 2006; Australian Bureau of Meteorology). Red lines (a and b) indicate reconstructions using only the local chronology as the single predictor. Thick black (grey) lines (a)–(c) are 20 year loess smoothing curves highlighting ~ decadal-scale variation in reconstructed (observed) PDSI. Red (blue) shading (a)–(c) indicates when drought (wet) periods as indicated by the 20 year loess curve being below (above) zero were synchronous or in antiphase among the three regions.
Download figure:
Standard image High-resolution image
Nevertheless, the final model shows strong potential to reliably reconstruct past drought variability across remarkably large areas of western Australia (figures 2(a)–(d)). Our results suggest that the development of only a few new chronologies from strategic locations (i.e. particularly the north, the coastal southwest and southeast as well as central inland areas of western Australia) would dramatically improve reconstructions of both spatial and temporal hydroclimatic variability across the western Australian region.
Remarkably, the inclusion of 175 other proxy records from the Australasian region (see Palmer et al 2015) did not improve the reconstruction verification skill for western Australia compared to using only the two western Australian proxies (figure S2). We suggest that the influence of the Pacific Ocean on hydroclimate throughout much of western Australian is relatively modest compared to the eastern and northern continental regions (Risbey et al 2009), which limits what can be interpreted of western Australian hydroclimate from these 175 Australasian chronologies. This finding again reinforces the need to develop several new proxy records from within western Australia to be able to capture spatial variation in hydroclimate across the region.
Past hydroclimatic variability in inland western Australia
Our analysis has revealed that the western Australian chronologies can provide significant insight into climatic variability for two broad regions in the inland south and north of western Australia as well as the relationship between the two regions over time. The final reconstruction models (using both chronologies as predictors) explained almost 50% of the variance in observed PDSI in inland north- (R2 = 0.49) and south-western (R2 = 0.48) Australia. The resulting reconstructions reveal inter-annual to multi-decadal-scale variability of PDSI in inland north- and south-western Australia as well as years and multi-year periods of synchronous drought and wetter than average conditions in both regions (black lines in figures 3(a) and (b)). Synchronicity of drought and wet periods among the two regions is not attributed to both models sharing the same predictors as the reconstructions remain essentially unchanged when based only on the local chronology as the single predictor (red lines in figures 3(a) and (b)).
Our reconstructions show a prolonged period of drought in the 1950s in both the inland north and south of western Australia, which matches instrumental climate records well, and also reveals prolonged droughts occurred across much of inland western Australia in the 1830s and 1880s (figures 3(a) and (b)). There are few readily available historical reports of climatic conditions in the 19th Century for western Australia. However, a drought that affected crops in the agricultural regions east of Perth in the southwest of western Australia was reported in the late 1830s (Foley 1957). Similarly, there are reports of prolonged drought in the late 1870s and early 1880s that restricted tilling activities around Perth (Foley 1957). These independent historical reports corroborate the occurrence of drought conditions in southwest Australia during the periods when our reconstructions reveal drought was influencing the inland north and south of western Australia. Our reconstructions thus provide new evidence that these documented prolonged drought periods in southwest western Australia in the 19th Century were likely much more widespread across the western Australian region than hitherto believed.
Synchronous periods of above average rainfall are also evident in both the inland north and south of western Australia over the last two centuries, though these were generally of a shorter duration (several years) than drought periods (> decade; figures 3(a) and (b)). Two multi-year wet periods occurred in the early 1870s (wet years in 1872 and 1873) and in the late 1910s (wet years in 1915 and 1917; figures 3(a) and (b)). Synchronous wet years seen in both reconstructions were likely caused by widespread rainfall derived from tropical cyclones or other closed lows tracking from the northwest Australian coast inland towards the southeast coast of western Australia. Much of inland western Australia receives 30%–60% of its average annual rainfall from (ex-)tropical cyclones or other closed lows (Lavender and Abbs 2013). Unfortunately cyclone track records do not extend prior to the 1970s to confirm whether synchronous wet years in the 1870s and 1910s are related to single intense rain events (such as from a tropical cyclone) or coincident rain events derived from multiple sources. Further investigation of the oxygen isotope ratios (δ18O) of tree rings could help to disentangle potential sources of rainfall, where anomalously low (depleted) δ18O isotope values typically indicate that rainfall (and soil water) was likely derived from tropical cyclones (Miller et al 2006, Mora et al 2006, 2007). Historical documents, where available, can also confirm the occurrence of tropical cyclones and other rain-bearing systems. Historical reports indicate that a 'disastrous' severe tropical cyclone influenced the Pilbara region of northwest Australia in April 1872 ('Disastrous Cyclone at Roebourne', The Herald, Fremantle, 18 May 1872) and while there are no available historical reports of rainfall in the south of western Australia during this time, storms of 'unprecedented severity' (also described as 'tornadoes' and 'hurricanes') were reported along the southwest coast in the months prior (February and March 1872; 'The Gale on Sunday', The Inquirer and Commercial News, Perth, 13 March 1872; 'Hurricane at Geraldton', The Inquirer and Commercial News, Perth, 21 February 1872) suggesting that there were multiple extreme rain events (possibly multiple tropical cyclones) across western Australia during this season.
An unusual prolonged (multi-decadal) wet period is evident in both reconstructions in the most recent decades (beginning in the 1980s in the inland south and in the 1990s in the inland north; figures 3(a) and (b)). This period is distinctive in both regions as the longest wet period (as indicated by PDSI) in the last two centuries. This 'wetting' trend across semi-arid inland western Australia (Fierro and Leslie 2013, O'Donnell et al 2015) and an opposing trend in the temperate southwest of western Australia (i.e. west of 118°E, south of 32°S; Cai and Cowan 2006, Raut et al 2014) have been attributed to changes in the behaviour of broad-scale climate drivers, particularly the Southern Annular Mode, over the same period.
Interestingly, many of the prolonged drought and wet periods evident over the last two centuries in our reconstructions appear to have been in antiphase with those of eastern Australia (figures 3(a)–(c)), which is also evident in instrumental rainfall records for the most recent century (figure 3(d)). For example, two of the three major drought periods in inland western Australia (i.e. 1880s and 1950s) coincided with relatively wet periods in south-eastern Australia (figures 3(a)–(d); Cook et al 2016b, Palmer et al 2015). In fact, the 1950s drought in western Australia coincided with the highest decadal-scale stream flow of the Murray River (in south-eastern Australia) in the last 200 years (Gallant and Gergis 2011). The prolonged wet period in the last two decades in inland western Australia also contrasts with much of eastern Australia, which was influenced by a severe drought during this time (i.e. the 'Millennium drought', ca. 1997–2010; figures 3(a)–(d)). Furthermore, while eastern Australia was experiencing some of the most severe drought conditions in the last two centuries during the 'Federation' (1896–1902) and 'World War II' (1937–1945) droughts, hydroclimatic conditions in inland western Australia appear to have been comparatively mild (figures 3(a)–(c); Verdon-Kidd and Kiem 2009).
Despite the high incidence of antiphase hydroclimatic conditions, we find at least one period of extreme drought during the 1830s was synchronous between inland (north and south) western and eastern Australia in the last two centuries (Cook et al 2016b, Gallant and Gergis 2011, Ho et al 2015, Palmer et al 2015, figures 3(a)–(c)). This finding suggests it is possible that drought conditions were widespread across the continent during this period; however, a more precise understanding of the spatial signature of this drought period (and other past drought and wet periods) is contingent upon the development of an Australia-wide drought atlas.
Conclusions
Our results clearly demonstrate the considerable potential for developing a drought atlas for western Australia, complementing the recent development of a drought atlas for eastern Australia and New Zealand (Palmer et al 2015). This analysis emphasises the urgent need for the development of proxy records across western Australia to better understand the trends of different climate modes and changing teleconnections across the continent on multi-decadal to centennial timescales. The development of an Australia-wide drought atlas would greatly improve our understanding of the spatial and temporal variability of drought and wet periods across the continent and provide a context to interpret the spatial scale and magnitude of recent hydroclimatic events.
Acknowledgments
This research was supported by the Australian Research Council under projects LP120100310, DP130104156, and DP170101033) and The University of Western Australia (Research Collaboration Award awarded to A O'Donnell). Lamont-Doherty Earth Observatory contribution number 8174.